Upshur County, WV
Upshur County Map
Upshur County Overview
23,875
TOTAL POPULATION
12,038
MALE POPULATION
11,837
FEMALE POPULATION
101.70
MALES / 100 FEMALES
98.33
FEMALES / 100 MALES
42.0
MEDIAN AGE
2.9
AVG FAMILY SIZE
2.4
AVG HOUSEHOLD SIZE
$28,855
PER CAPITA INCOME
$64,231
AVG FAMILY INCOME
$49,663
AVG HOUSEHOLD INCOME
29.7%
WAGE / INCOME GAP [ % ]
70.3¢/ $1
WAGE / INCOME GAP [ $ ]
$9,801
FAMILY INCOME DEFICIT
0.47
INEQUALITY / GINI INDEX
10,151
LABOR FORCE [ PEOPLE ]
52.2%
PERCENT IN LABOR FORCE
5.8%
UNEMPLOYMENT RATE
Upshur County Area Codes
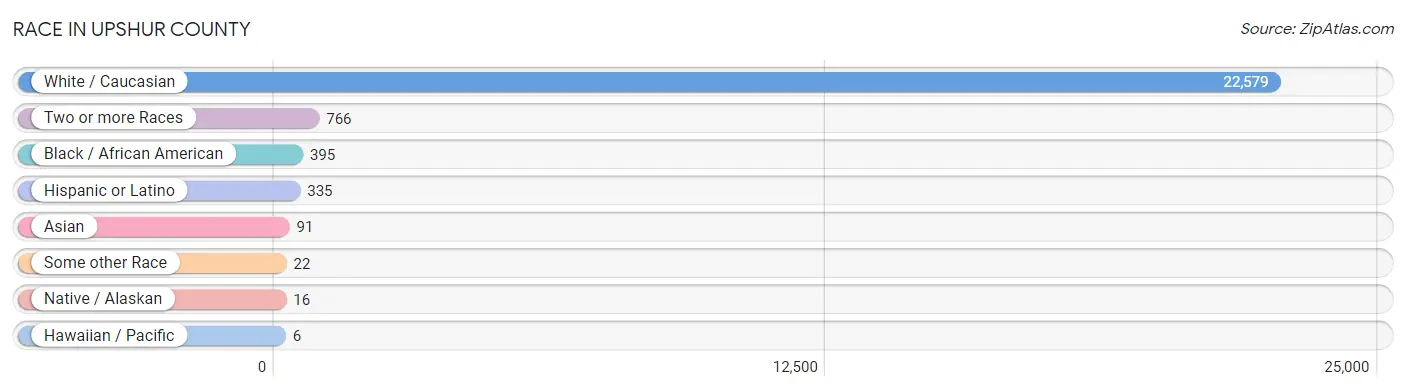
Race in Upshur County
The most populous races in Upshur County are White / Caucasian (22,579 | 94.6%), Two or more Races (766 | 3.2%), and Black / African American (395 | 1.7%).
| Race | # Population | % Population |
| Asian | 91 | 0.4% |
| Black / African American | 395 | 1.7% |
| Hawaiian / Pacific | 6 | 0.0% |
| Hispanic or Latino | 335 | 1.4% |
| Native / Alaskan | 16 | 0.1% |
| White / Caucasian | 22,579 | 94.6% |
| Two or more Races | 766 | 3.2% |
| Some other Race | 22 | 0.1% |
| Total | 23,875 | 100.0% |
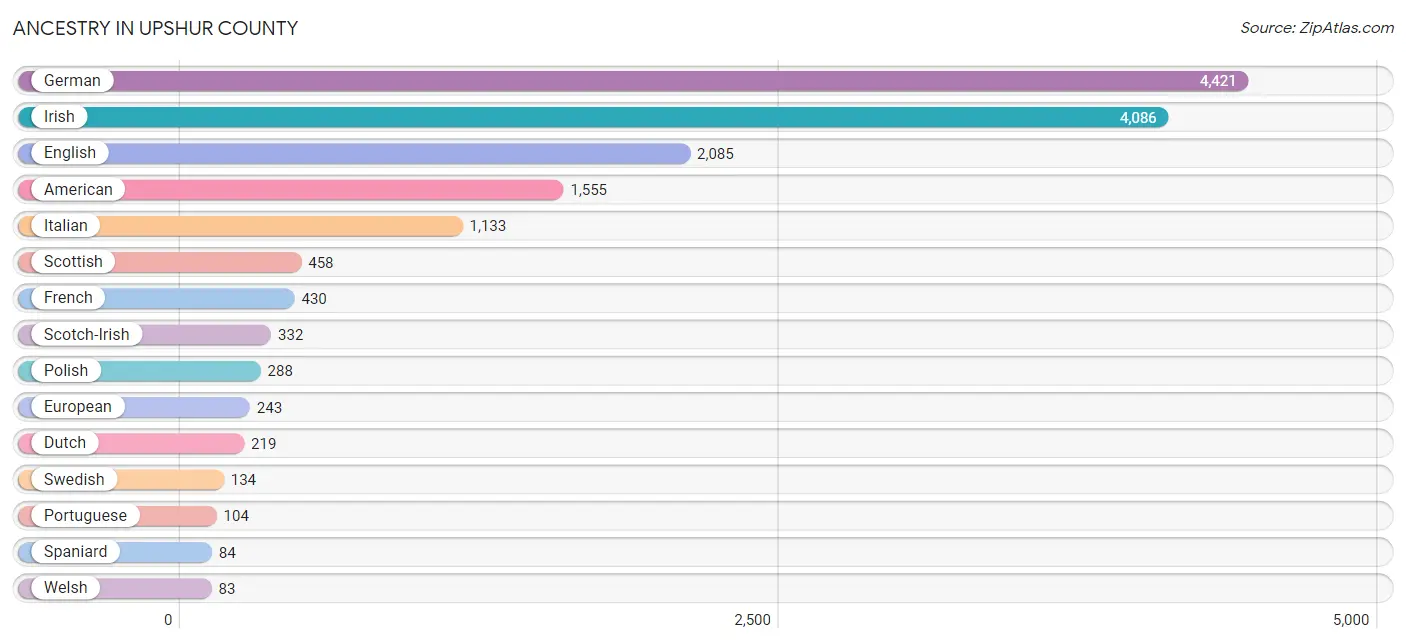
Ancestry in Upshur County
The most populous ancestries reported in Upshur County are German (4,421 | 18.5%), Irish (4,086 | 17.1%), English (2,085 | 8.7%), American (1,555 | 6.5%), and Italian (1,133 | 4.8%), together accounting for 55.6% of all Upshur County residents.
| Ancestry | # Population | % Population |
| African | 27 | 0.1% |
| Alaska Native | 4 | 0.0% |
| American | 1,555 | 6.5% |
| Austrian | 9 | 0.0% |
| Bhutanese | 78 | 0.3% |
| Brazilian | 79 | 0.3% |
| British | 41 | 0.2% |
| Canadian | 17 | 0.1% |
| Cherokee | 23 | 0.1% |
| Cuban | 12 | 0.1% |
| Czech | 52 | 0.2% |
| Czechoslovakian | 14 | 0.1% |
| Danish | 24 | 0.1% |
| Dutch | 219 | 0.9% |
| Eastern European | 18 | 0.1% |
| English | 2,085 | 8.7% |
| European | 243 | 1.0% |
| Finnish | 34 | 0.1% |
| French | 430 | 1.8% |
| French Canadian | 5 | 0.0% |
| German | 4,421 | 18.5% |
| Greek | 4 | 0.0% |
| Haitian | 1 | 0.0% |
| Hungarian | 12 | 0.1% |
| Irish | 4,086 | 17.1% |
| Italian | 1,133 | 4.8% |
| Jamaican | 3 | 0.0% |
| Korean | 38 | 0.2% |
| Mexican | 67 | 0.3% |
| Mexican American Indian | 9 | 0.0% |
| Native Hawaiian | 15 | 0.1% |
| Norwegian | 13 | 0.1% |
| Polish | 288 | 1.2% |
| Portuguese | 104 | 0.4% |
| Puerto Rican | 62 | 0.3% |
| Russian | 78 | 0.3% |
| Scotch-Irish | 332 | 1.4% |
| Scottish | 458 | 1.9% |
| Slavic | 9 | 0.0% |
| Slovak | 29 | 0.1% |
| Spaniard | 84 | 0.4% |
| Spanish | 19 | 0.1% |
| Sri Lankan | 20 | 0.1% |
| Subsaharan African | 27 | 0.1% |
| Swedish | 134 | 0.6% |
| Swiss | 49 | 0.2% |
| Thai | 6 | 0.0% |
| Ukrainian | 16 | 0.1% |
| Welsh | 83 | 0.4% | View All 49 Rows |
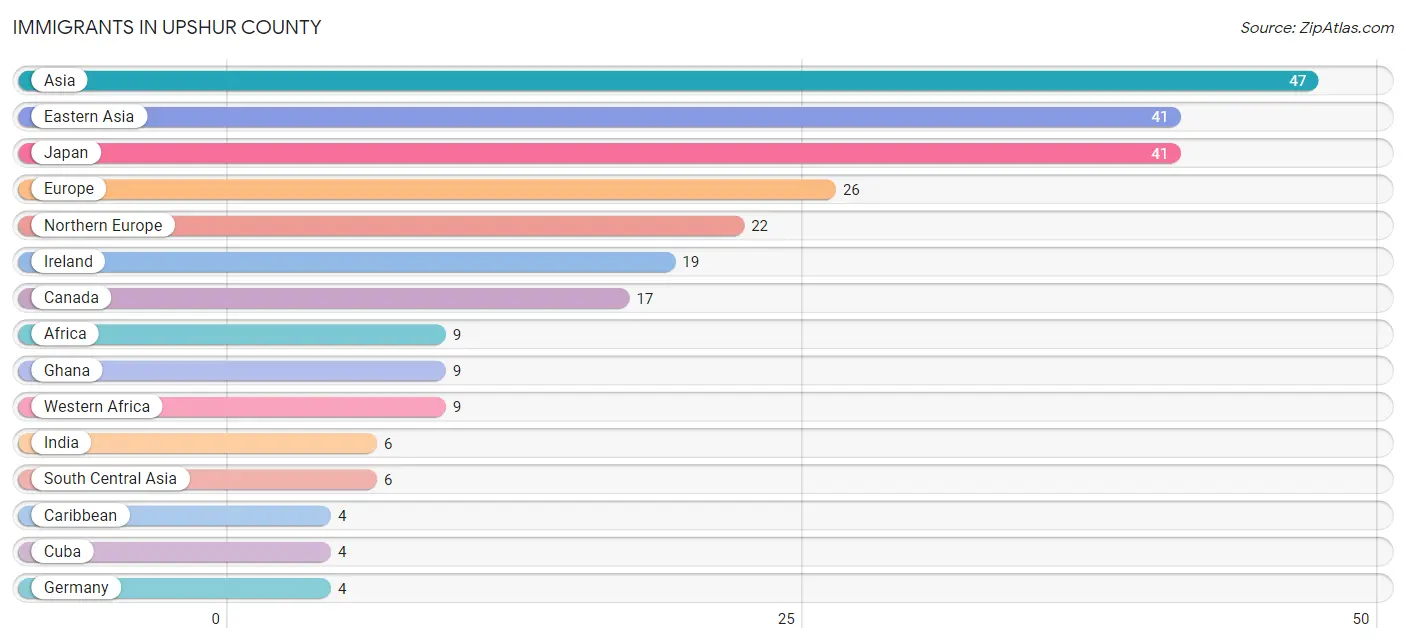
Immigrants in Upshur County
The most numerous immigrant groups reported in Upshur County came from Asia (47 | 0.2%), Eastern Asia (41 | 0.2%), Japan (41 | 0.2%), Europe (26 | 0.1%), and Northern Europe (22 | 0.1%), together accounting for 0.7% of all Upshur County residents.
| Immigration Origin | # Population | % Population |
| Africa | 9 | 0.0% |
| Asia | 47 | 0.2% |
| Canada | 17 | 0.1% |
| Caribbean | 4 | 0.0% |
| Cuba | 4 | 0.0% |
| Eastern Asia | 41 | 0.2% |
| England | 3 | 0.0% |
| Europe | 26 | 0.1% |
| Germany | 4 | 0.0% |
| Ghana | 9 | 0.0% |
| India | 6 | 0.0% |
| Ireland | 19 | 0.1% |
| Japan | 41 | 0.2% |
| Latin America | 4 | 0.0% |
| Northern Europe | 22 | 0.1% |
| South Central Asia | 6 | 0.0% |
| Western Africa | 9 | 0.0% |
| Western Europe | 4 | 0.0% | View All 18 Rows |
Sex and Age in Upshur County
Sex and Age in Upshur County
The most populous age groups in Upshur County are 15 to 19 Years (953 | 7.9%) for men and 65 to 69 Years (932 | 7.9%) for women.
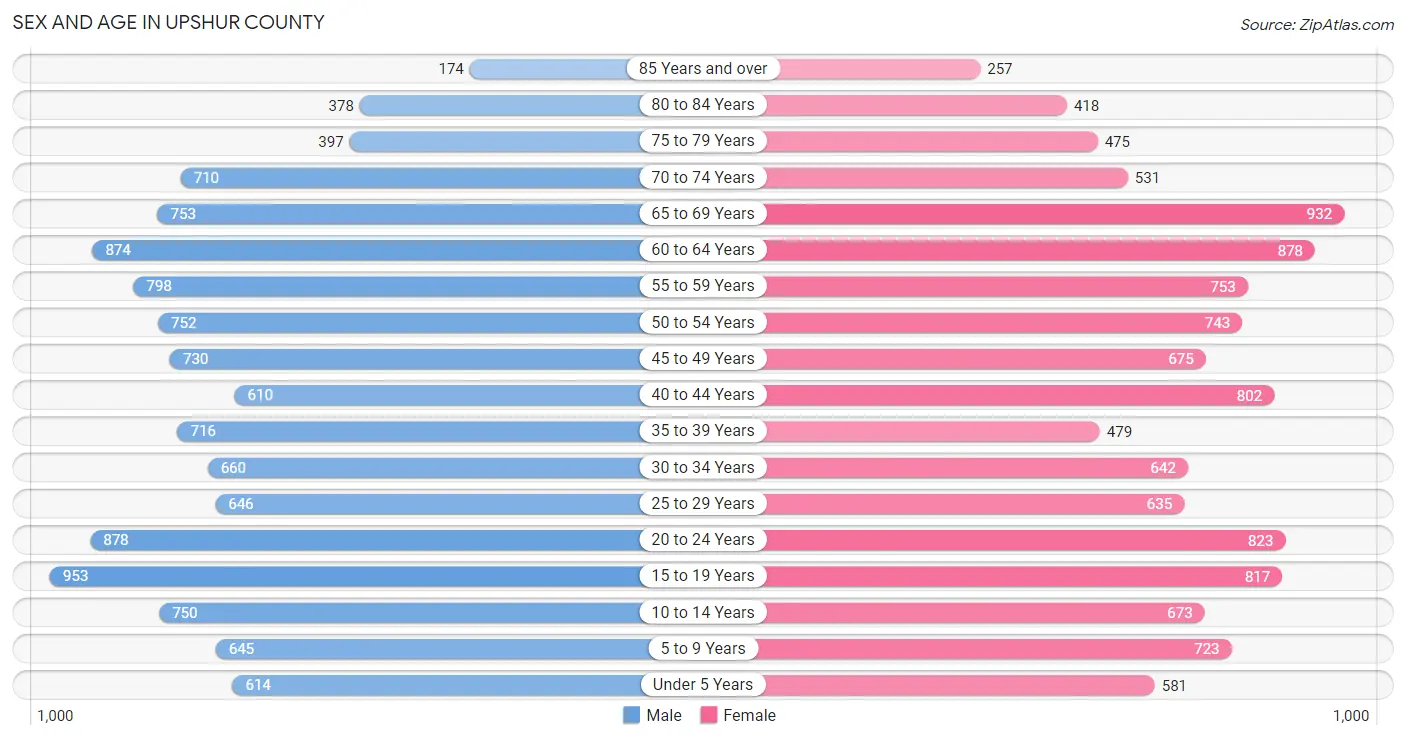
| Age Bracket | Male | Female |
| Under 5 Years | 614 (5.1%) | 581 (4.9%) |
| 5 to 9 Years | 645 (5.4%) | 723 (6.1%) |
| 10 to 14 Years | 750 (6.2%) | 673 (5.7%) |
| 15 to 19 Years | 953 (7.9%) | 817 (6.9%) |
| 20 to 24 Years | 878 (7.3%) | 823 (7.0%) |
| 25 to 29 Years | 646 (5.4%) | 635 (5.4%) |
| 30 to 34 Years | 660 (5.5%) | 642 (5.4%) |
| 35 to 39 Years | 716 (5.9%) | 479 (4.1%) |
| 40 to 44 Years | 610 (5.1%) | 802 (6.8%) |
| 45 to 49 Years | 730 (6.1%) | 675 (5.7%) |
| 50 to 54 Years | 752 (6.2%) | 743 (6.3%) |
| 55 to 59 Years | 798 (6.6%) | 753 (6.4%) |
| 60 to 64 Years | 874 (7.3%) | 878 (7.4%) |
| 65 to 69 Years | 753 (6.3%) | 932 (7.9%) |
| 70 to 74 Years | 710 (5.9%) | 531 (4.5%) |
| 75 to 79 Years | 397 (3.3%) | 475 (4.0%) |
| 80 to 84 Years | 378 (3.1%) | 418 (3.5%) |
| 85 Years and over | 174 (1.5%) | 257 (2.2%) |
| Total | 12,038 (100.0%) | 11,837 (100.0%) |
Families and Households in Upshur County
Median Family Size in Upshur County
The median family size in Upshur County is 2.89 persons per family, with single female/mother families (1,153 | 18.5%) accounting for the largest median family size of 3.04 persons per family. On the other hand, single male/father families (576 | 9.3%) represent the smallest median family size with 2.34 persons per family.
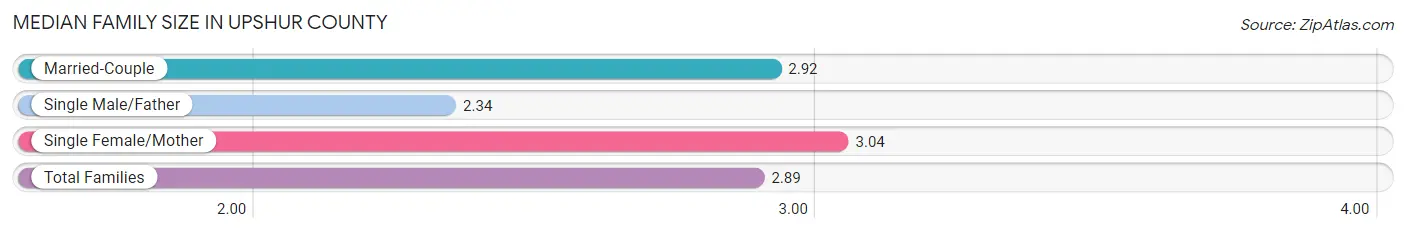
| Family Type | # Families | Family Size |
| Married-Couple | 4,487 (72.2%) | 2.92 |
| Single Male/Father | 576 (9.3%) | 2.34 |
| Single Female/Mother | 1,153 (18.5%) | 3.04 |
| Total Families | 6,216 (100.0%) | 2.89 |
Median Household Size in Upshur County
The median household size in Upshur County is 2.36 persons per household, with single female/mother households (1,153 | 12.1%) accounting for the largest median household size of 3.33 persons per household. non-family households (3,321 | 34.8%) represent the smallest median household size with 1.20 persons per household.
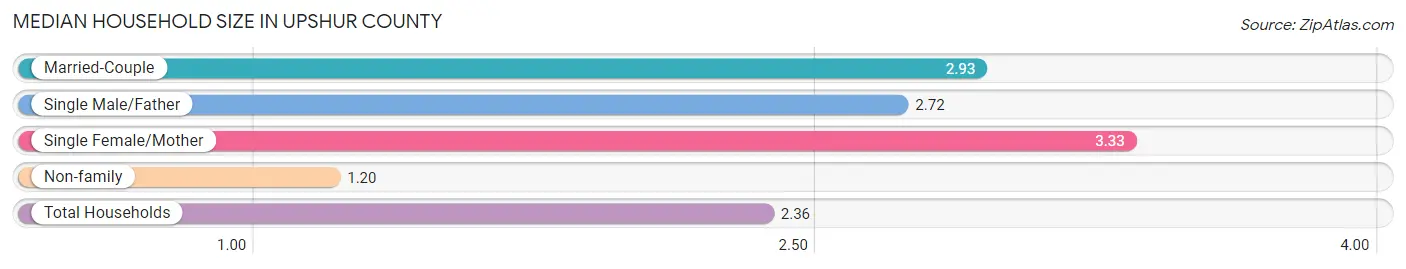
| Household Type | # Households | Household Size |
| Married-Couple | 4,487 (47.0%) | 2.93 |
| Single Male/Father | 576 (6.0%) | 2.72 |
| Single Female/Mother | 1,153 (12.1%) | 3.33 |
| Non-family | 3,321 (34.8%) | 1.20 |
| Total Households | 9,537 (100.0%) | 2.36 |
Household Size by Marriage Status in Upshur County
Out of a total of 9,537 households in Upshur County, 6,216 (65.2%) are family households, while 3,321 (34.8%) are nonfamily households. The most numerous type of family households are 2-person households, comprising 2,986, and the most common type of nonfamily households are 1-person households, comprising 2,868.
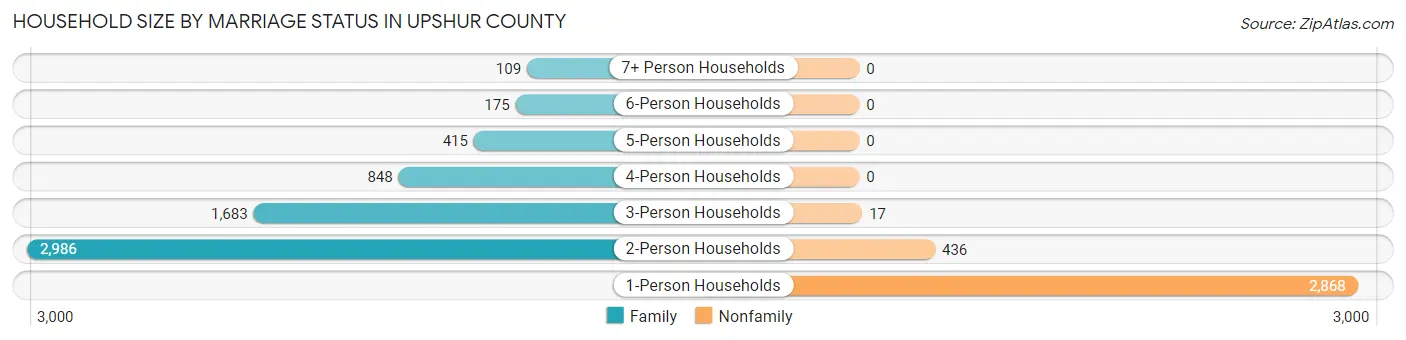
| Household Size | Family Households | Nonfamily Households |
| 1-Person Households | - | 2,868 (30.1%) |
| 2-Person Households | 2,986 (31.3%) | 436 (4.6%) |
| 3-Person Households | 1,683 (17.6%) | 17 (0.2%) |
| 4-Person Households | 848 (8.9%) | 0 (0.0%) |
| 5-Person Households | 415 (4.3%) | 0 (0.0%) |
| 6-Person Households | 175 (1.8%) | 0 (0.0%) |
| 7+ Person Households | 109 (1.1%) | 0 (0.0%) |
| Total | 6,216 (65.2%) | 3,321 (34.8%) |
Female Fertility in Upshur County
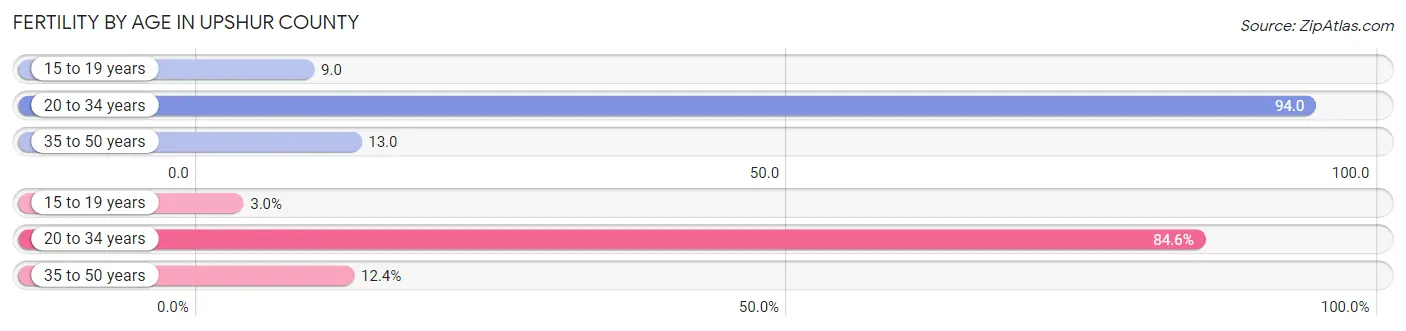
Fertility by Age in Upshur County
Average fertility rate in Upshur County is 45.0 births per 1,000 women. Women in the age bracket of 20 to 34 years have the highest fertility rate with 94.0 births per 1,000 women. Women in the age bracket of 20 to 34 years acount for 84.6% of all women with births.
| Age Bracket | Women with Births | Births / 1,000 Women |
| 15 to 19 years | 7 (3.0%) | 9.0 |
| 20 to 34 years | 198 (84.6%) | 94.0 |
| 35 to 50 years | 29 (12.4%) | 13.0 |
| Total | 234 (100.0%) | 45.0 |
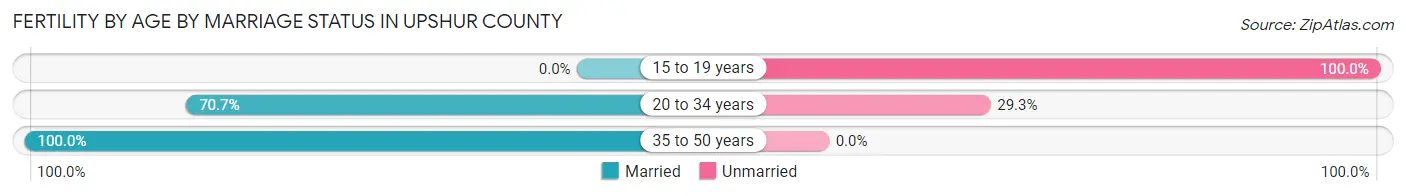
Fertility by Age by Marriage Status in Upshur County
72.2% of women with births (234) in Upshur County are married. The highest percentage of unmarried women with births falls into 15 to 19 years age bracket with 100.0% of them unmarried at the time of birth, while the lowest percentage of unmarried women with births belong to 35 to 50 years age bracket with 0.0% of them unmarried.
| Age Bracket | Married | Unmarried |
| 15 to 19 years | 0 (0.0%) | 7 (100.0%) |
| 20 to 34 years | 140 (70.7%) | 58 (29.3%) |
| 35 to 50 years | 29 (100.0%) | 0 (0.0%) |
| Total | 169 (72.2%) | 65 (27.8%) |
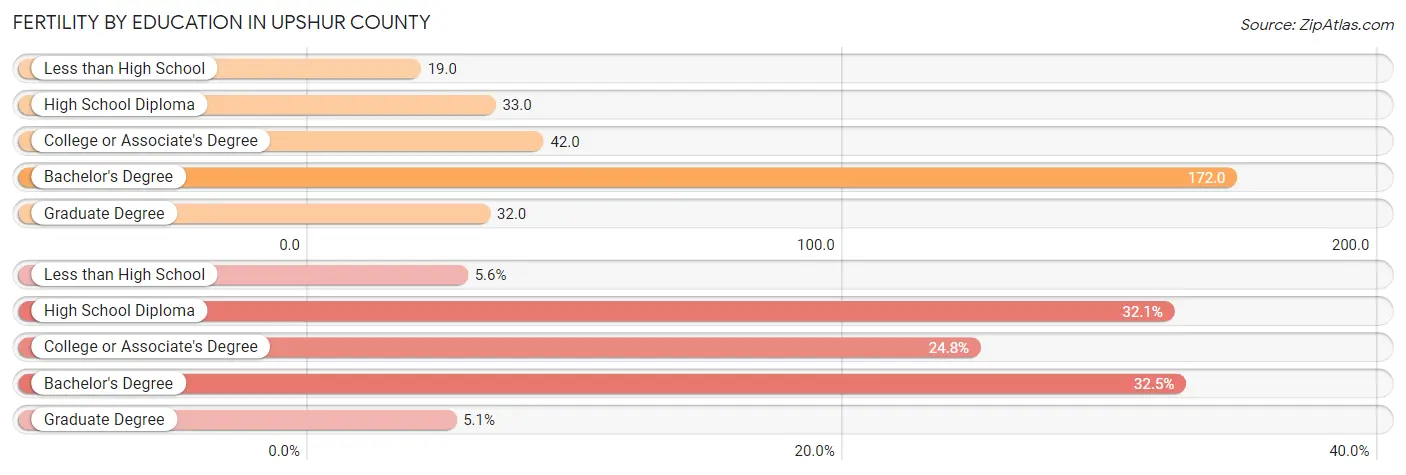
Fertility by Education in Upshur County
Average fertility rate in Upshur County is 45.0 births per 1,000 women. Women with the education attainment of bachelor's degree have the highest fertility rate of 172.0 births per 1,000 women, while women with the education attainment of less than high school have the lowest fertility at 19.0 births per 1,000 women. Women with the education attainment of bachelor's degree represent 32.5% of all women with births.
| Educational Attainment | Women with Births | Births / 1,000 Women |
| Less than High School | 13 (5.6%) | 19.0 |
| High School Diploma | 75 (32.1%) | 33.0 |
| College or Associate's Degree | 58 (24.8%) | 42.0 |
| Bachelor's Degree | 76 (32.5%) | 172.0 |
| Graduate Degree | 12 (5.1%) | 32.0 |
| Total | 234 (100.0%) | 45.0 |
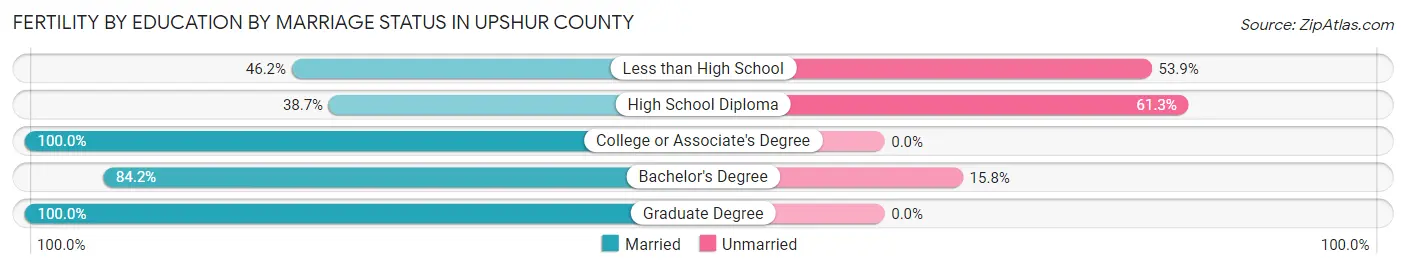
Fertility by Education by Marriage Status in Upshur County
27.8% of women with births in Upshur County are unmarried. Women with the educational attainment of college or associate's degree are most likely to be married with 100.0% of them married at childbirth, while women with the educational attainment of high school diploma are least likely to be married with 61.3% of them unmarried at childbirth.
| Educational Attainment | Married | Unmarried |
| Less than High School | 6 (46.2%) | 7 (53.8%) |
| High School Diploma | 29 (38.7%) | 46 (61.3%) |
| College or Associate's Degree | 58 (100.0%) | 0 (0.0%) |
| Bachelor's Degree | 64 (84.2%) | 12 (15.8%) |
| Graduate Degree | 12 (100.0%) | 0 (0.0%) |
| Total | 169 (72.2%) | 65 (27.8%) |
Income in Upshur County
Income Overview in Upshur County
Per Capita Income in Upshur County is $28,855, while median incomes of families and households are $64,231 and $49,663 respectively.
| Characteristic | Number | Measure |
| Per Capita Income | 23,875 | $28,855 |
| Median Family Income | 6,216 | $64,231 |
| Mean Family Income | 6,216 | $76,849 |
| Median Household Income | 9,537 | $49,663 |
| Mean Household Income | 9,537 | $68,587 |
| Income Deficit | 6,216 | $9,801 |
| Wage / Income Gap (%) | 23,875 | 29.68% |
| Wage / Income Gap ($) | 23,875 | 70.32¢ per $1 |
| Gini / Inequality Index | 23,875 | 0.47 |
Earnings by Sex in Upshur County
Average Earnings in Upshur County are $34,572, $40,564 for men and $28,525 for women, a difference of 29.7%.
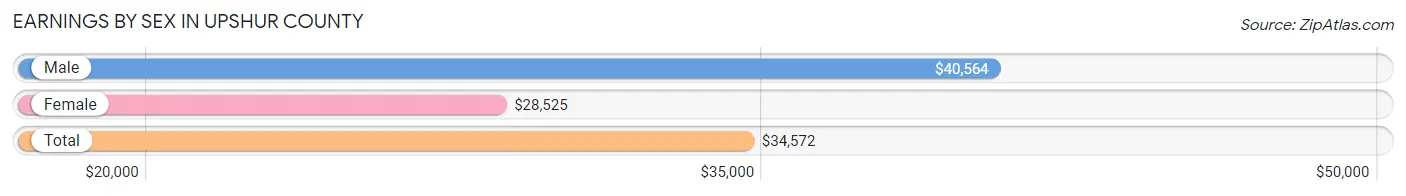
| Sex | Number | Average Earnings |
| Male | 5,692 (52.8%) | $40,564 |
| Female | 5,080 (47.2%) | $28,525 |
| Total | 10,772 (100.0%) | $34,572 |
Earnings by Sex by Income Bracket in Upshur County
The most common earnings brackets in Upshur County are $75,000 to $99,999 for men (600 | 10.5%) and $55,000 to $64,999 for women (505 | 9.9%).
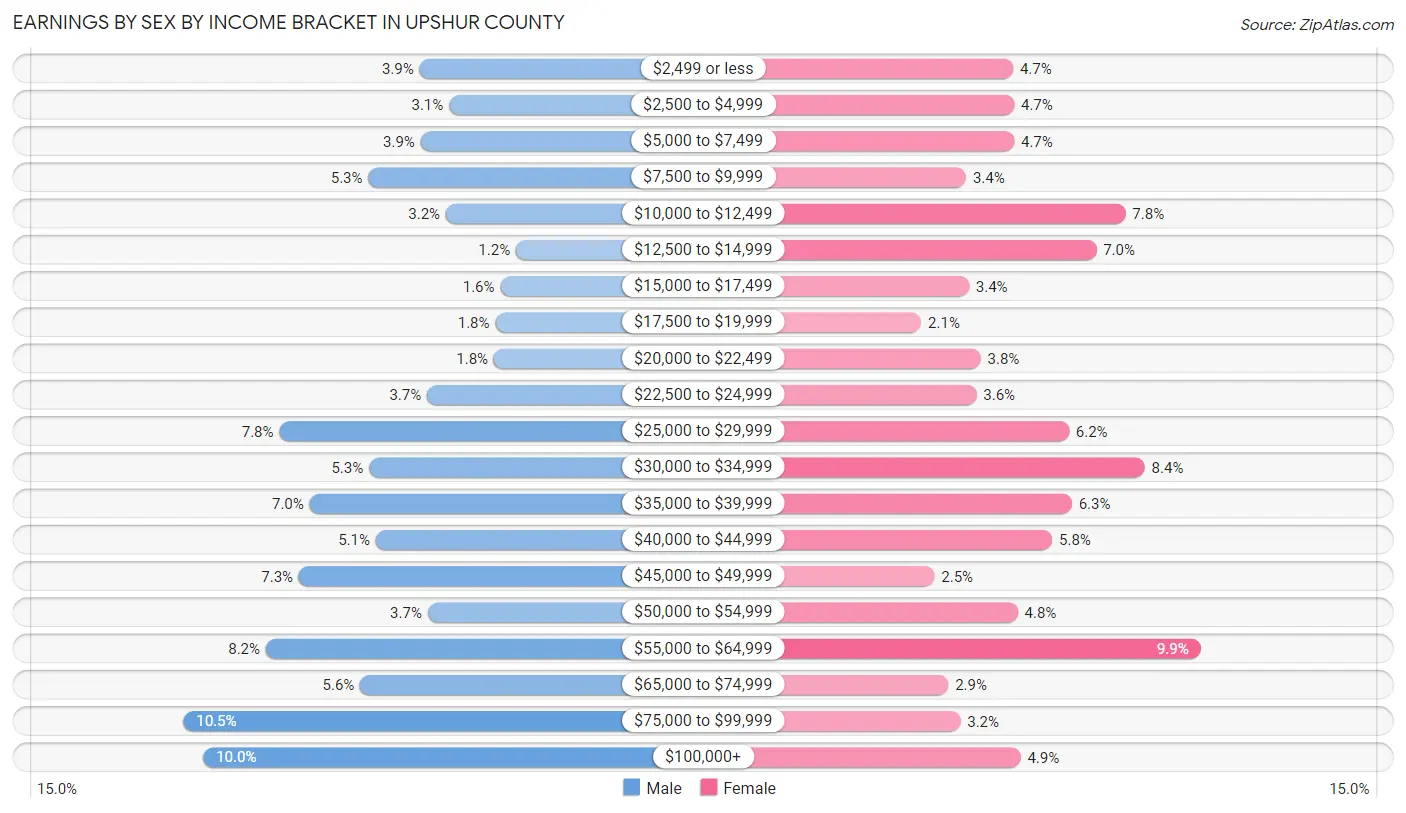
| Income | Male | Female |
| $2,499 or less | 222 (3.9%) | 237 (4.7%) |
| $2,500 to $4,999 | 175 (3.1%) | 239 (4.7%) |
| $5,000 to $7,499 | 220 (3.9%) | 239 (4.7%) |
| $7,500 to $9,999 | 304 (5.3%) | 170 (3.4%) |
| $10,000 to $12,499 | 180 (3.2%) | 398 (7.8%) |
| $12,500 to $14,999 | 68 (1.2%) | 356 (7.0%) |
| $15,000 to $17,499 | 93 (1.6%) | 174 (3.4%) |
| $17,500 to $19,999 | 101 (1.8%) | 106 (2.1%) |
| $20,000 to $22,499 | 103 (1.8%) | 191 (3.8%) |
| $22,500 to $24,999 | 210 (3.7%) | 185 (3.6%) |
| $25,000 to $29,999 | 446 (7.8%) | 317 (6.2%) |
| $30,000 to $34,999 | 303 (5.3%) | 425 (8.4%) |
| $35,000 to $39,999 | 398 (7.0%) | 321 (6.3%) |
| $40,000 to $44,999 | 292 (5.1%) | 293 (5.8%) |
| $45,000 to $49,999 | 415 (7.3%) | 125 (2.5%) |
| $50,000 to $54,999 | 209 (3.7%) | 244 (4.8%) |
| $55,000 to $64,999 | 468 (8.2%) | 505 (9.9%) |
| $65,000 to $74,999 | 317 (5.6%) | 145 (2.9%) |
| $75,000 to $99,999 | 600 (10.5%) | 162 (3.2%) |
| $100,000+ | 568 (10.0%) | 248 (4.9%) |
| Total | 5,692 (100.0%) | 5,080 (100.0%) |
Earnings by Sex by Educational Attainment in Upshur County
Average earnings in Upshur County are $46,225 for men and $33,022 for women, a difference of 28.6%. Men with an educational attainment of bachelor's degree enjoy the highest average annual earnings of $58,574, while those with college or associate's degree education earn the least with $39,493. Women with an educational attainment of graduate degree earn the most with the average annual earnings of $54,542, while those with less than high school education have the smallest earnings of $12,328.
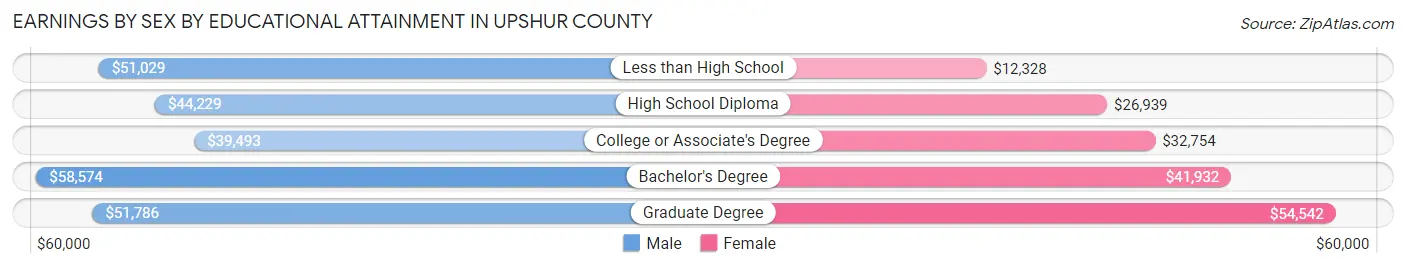
| Educational Attainment | Male Income | Female Income |
| Less than High School | $51,029 | $12,328 |
| High School Diploma | $44,229 | $26,939 |
| College or Associate's Degree | $39,493 | $32,754 |
| Bachelor's Degree | $58,574 | $41,932 |
| Graduate Degree | $51,786 | $54,542 |
| Total | $46,225 | $33,022 |
Family Income in Upshur County
Family Income Brackets in Upshur County
According to the Upshur County family income data, there are 1,225 families falling into the $50,000 to $74,999 income range, which is the most common income bracket and makes up 19.7% of all families. Conversely, the $10,000 to $14,999 income bracket is the least frequent group with only 199 families (3.2%) belonging to this category.
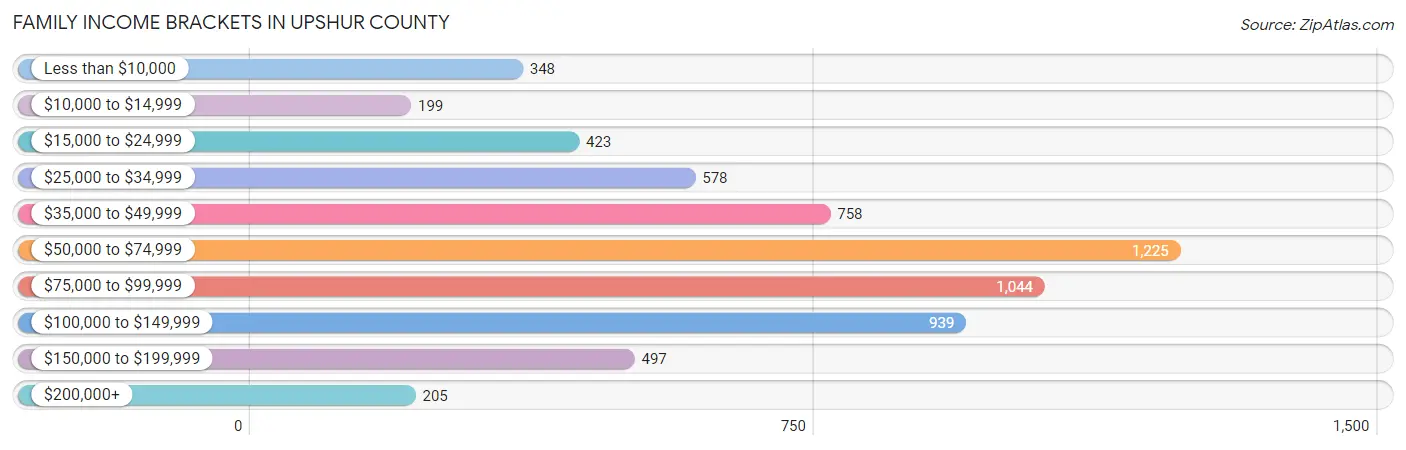
| Income Bracket | # Families | % Families |
| Less than $10,000 | 348 | 5.6% |
| $10,000 to $14,999 | 199 | 3.2% |
| $15,000 to $24,999 | 423 | 6.8% |
| $25,000 to $34,999 | 578 | 9.3% |
| $35,000 to $49,999 | 758 | 12.2% |
| $50,000 to $74,999 | 1,225 | 19.7% |
| $75,000 to $99,999 | 1,044 | 16.8% |
| $100,000 to $149,999 | 939 | 15.1% |
| $150,000 to $199,999 | 497 | 8.0% |
| $200,000+ | 205 | 3.3% |
Family Income by Famaliy Size in Upshur County
4-person families (684 | 11.0%) account for the highest median family income in Upshur County with $82,083 per family, while 2-person families (3,244 | 52.2%) have the highest median income of $29,212 per family member.
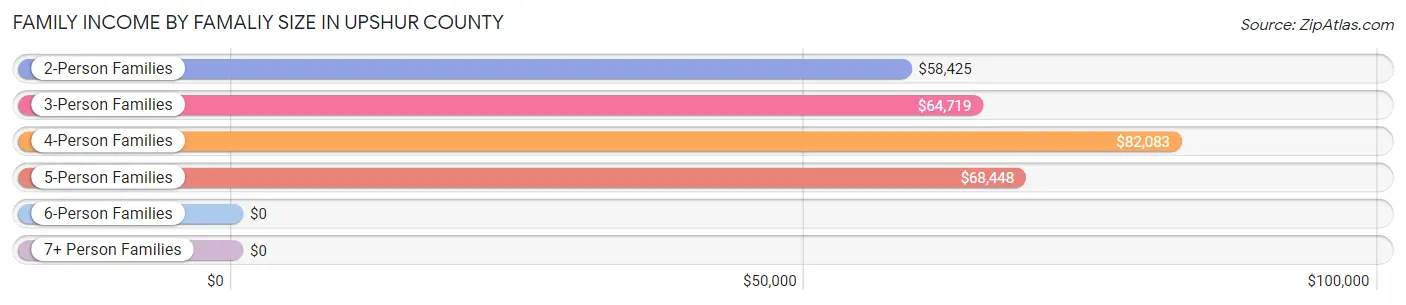
| Income Bracket | # Families | Median Income |
| 2-Person Families | 3,244 (52.2%) | $58,425 |
| 3-Person Families | 1,678 (27.0%) | $64,719 |
| 4-Person Families | 684 (11.0%) | $82,083 |
| 5-Person Families | 380 (6.1%) | $68,448 |
| 6-Person Families | 126 (2.0%) | $0 |
| 7+ Person Families | 104 (1.7%) | $0 |
| Total | 6,216 (100.0%) | $64,231 |
Family Income by Number of Earners in Upshur County
The median family income in Upshur County is $64,231, with families comprising 3+ earners (398) having the highest median family income of $133,438, while families with no earners (1,499) have the lowest median family income of $40,241, accounting for 6.4% and 24.1% of families, respectively.
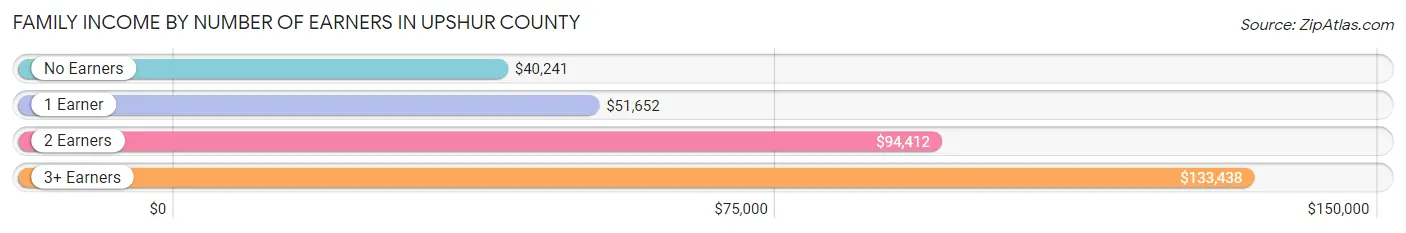
| Number of Earners | # Families | Median Income |
| No Earners | 1,499 (24.1%) | $40,241 |
| 1 Earner | 2,183 (35.1%) | $51,652 |
| 2 Earners | 2,136 (34.4%) | $94,412 |
| 3+ Earners | 398 (6.4%) | $133,438 |
| Total | 6,216 (100.0%) | $64,231 |
Household Income in Upshur County
Household Income Brackets in Upshur County
With 1,555 households falling in the category, the $50,000 to $74,999 income range is the most frequent in Upshur County, accounting for 16.3% of all households. In contrast, only 257 households (2.7%) fall into the $200,000+ income bracket, making it the least populous group.
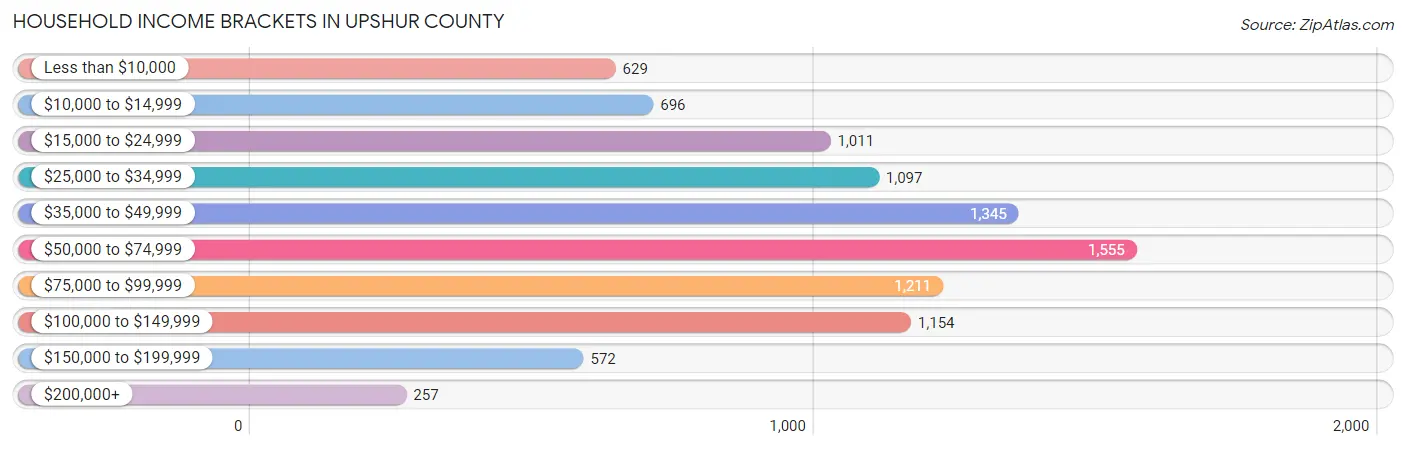
| Income Bracket | # Households | % Households |
| Less than $10,000 | 629 | 6.6% |
| $10,000 to $14,999 | 696 | 7.3% |
| $15,000 to $24,999 | 1,011 | 10.6% |
| $25,000 to $34,999 | 1,097 | 11.5% |
| $35,000 to $49,999 | 1,345 | 14.1% |
| $50,000 to $74,999 | 1,555 | 16.3% |
| $75,000 to $99,999 | 1,211 | 12.7% |
| $100,000 to $149,999 | 1,154 | 12.1% |
| $150,000 to $199,999 | 572 | 6.0% |
| $200,000+ | 257 | 2.7% |
Household Income by Householder Age in Upshur County
The median household income in Upshur County is $49,663, with the highest median household income of $57,904 found in the 25 to 44 years age bracket for the primary householder. A total of 2,485 households (26.1%) fall into this category. Meanwhile, the 15 to 24 years age bracket for the primary householder has the lowest median household income of $36,875, with 385 households (4.0%) in this group.
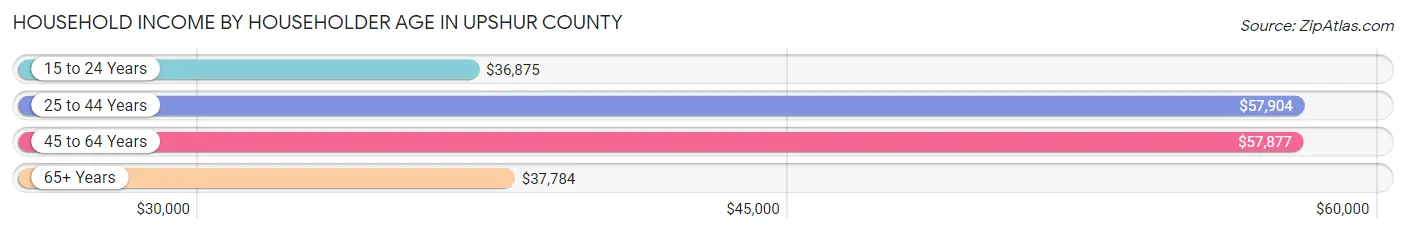
| Income Bracket | # Households | Median Income |
| 15 to 24 Years | 385 (4.0%) | $36,875 |
| 25 to 44 Years | 2,485 (26.1%) | $57,904 |
| 45 to 64 Years | 3,632 (38.1%) | $57,877 |
| 65+ Years | 3,035 (31.8%) | $37,784 |
| Total | 9,537 (100.0%) | $49,663 |
Poverty in Upshur County
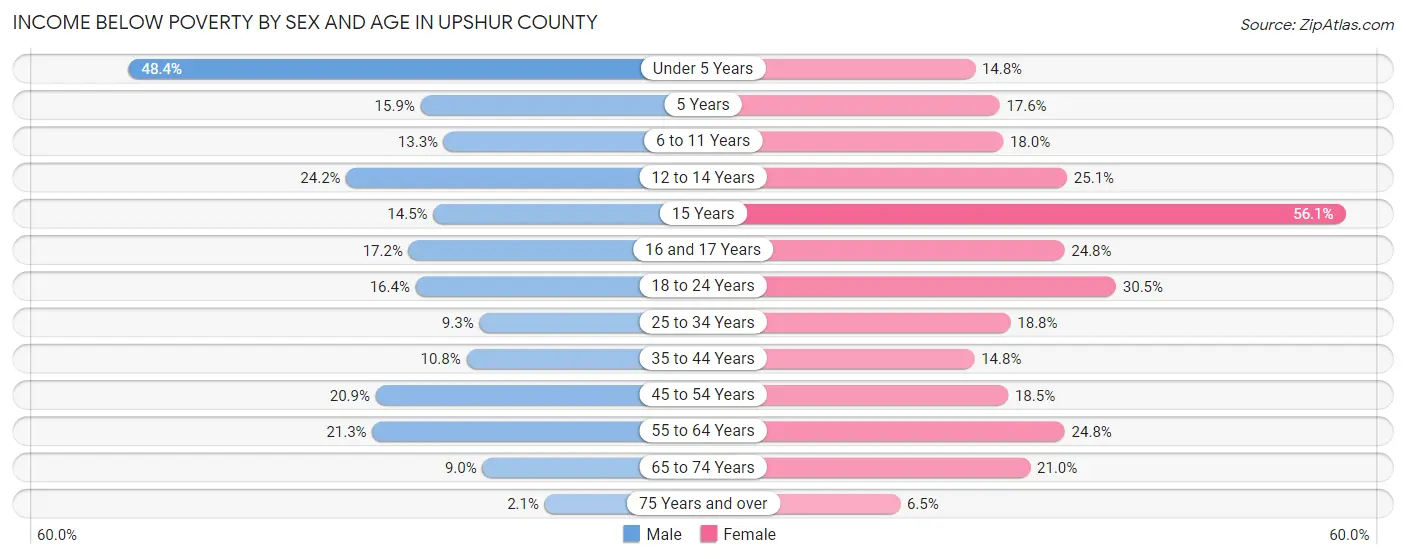
Income Below Poverty by Sex and Age in Upshur County
With 15.8% poverty level for males and 19.8% for females among the residents of Upshur County, under 5 year old males and 15 year old females are the most vulnerable to poverty, with 289 males (48.4%) and 120 females (56.1%) in their respective age groups living below the poverty level.
| Age Bracket | Male | Female |
| Under 5 Years | 289 (48.4%) | 85 (14.8%) |
| 5 Years | 17 (15.9%) | 23 (17.6%) |
| 6 to 11 Years | 123 (13.3%) | 159 (17.9%) |
| 12 to 14 Years | 86 (24.2%) | 92 (25.1%) |
| 15 Years | 33 (14.5%) | 120 (56.1%) |
| 16 and 17 Years | 36 (17.2%) | 59 (24.8%) |
| 18 to 24 Years | 119 (16.4%) | 228 (30.5%) |
| 25 to 34 Years | 122 (9.3%) | 239 (18.8%) |
| 35 to 44 Years | 143 (10.8%) | 189 (14.7%) |
| 45 to 54 Years | 309 (20.9%) | 261 (18.5%) |
| 55 to 64 Years | 354 (21.3%) | 404 (24.8%) |
| 65 to 74 Years | 129 (9.0%) | 303 (21.0%) |
| 75 Years and over | 18 (2.1%) | 69 (6.5%) |
| Total | 1,778 (15.8%) | 2,231 (19.8%) |
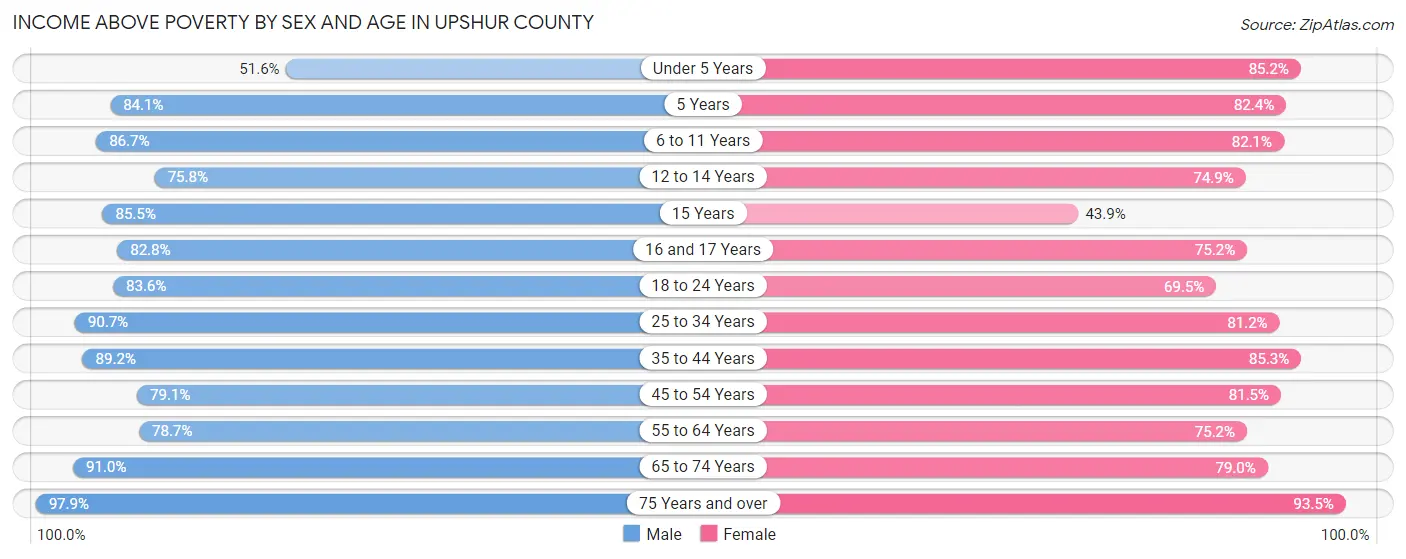
Income Above Poverty by Sex and Age in Upshur County
According to the poverty statistics in Upshur County, males aged 75 years and over and females aged 75 years and over are the age groups that are most secure financially, with 97.9% of males and 93.5% of females in these age groups living above the poverty line.
| Age Bracket | Male | Female |
| Under 5 Years | 308 (51.6%) | 488 (85.2%) |
| 5 Years | 90 (84.1%) | 108 (82.4%) |
| 6 to 11 Years | 802 (86.7%) | 727 (82.1%) |
| 12 to 14 Years | 270 (75.8%) | 275 (74.9%) |
| 15 Years | 195 (85.5%) | 94 (43.9%) |
| 16 and 17 Years | 173 (82.8%) | 179 (75.2%) |
| 18 to 24 Years | 605 (83.6%) | 519 (69.5%) |
| 25 to 34 Years | 1,184 (90.7%) | 1,034 (81.2%) |
| 35 to 44 Years | 1,183 (89.2%) | 1,092 (85.3%) |
| 45 to 54 Years | 1,170 (79.1%) | 1,149 (81.5%) |
| 55 to 64 Years | 1,311 (78.7%) | 1,224 (75.2%) |
| 65 to 74 Years | 1,305 (91.0%) | 1,142 (79.0%) |
| 75 Years and over | 853 (97.9%) | 996 (93.5%) |
| Total | 9,449 (84.2%) | 9,027 (80.2%) |
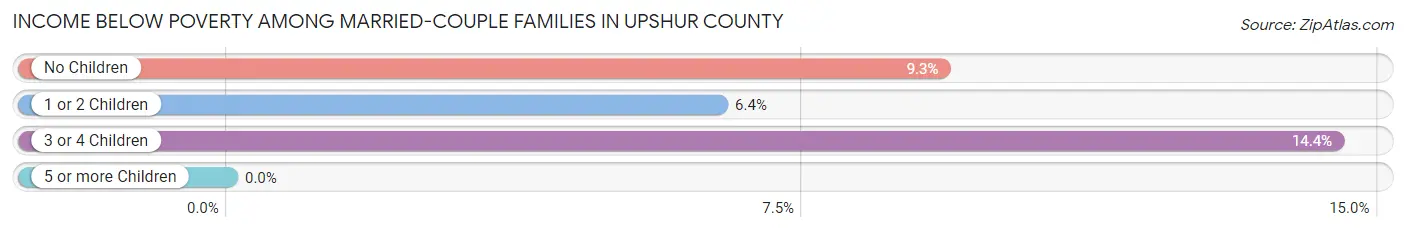
Income Below Poverty Among Married-Couple Families in Upshur County
The poverty statistics for married-couple families in Upshur County show that 8.9% or 400 of the total 4,487 families live below the poverty line. Families with 3 or 4 children have the highest poverty rate of 14.4%, comprising of 54 families. On the other hand, families with 5 or more children have the lowest poverty rate of 0.0%, which includes 0 families.
| Children | Above Poverty | Below Poverty |
| No Children | 2,711 (90.7%) | 278 (9.3%) |
| 1 or 2 Children | 994 (93.6%) | 68 (6.4%) |
| 3 or 4 Children | 320 (85.6%) | 54 (14.4%) |
| 5 or more Children | 62 (100.0%) | 0 (0.0%) |
| Total | 4,087 (91.1%) | 400 (8.9%) |
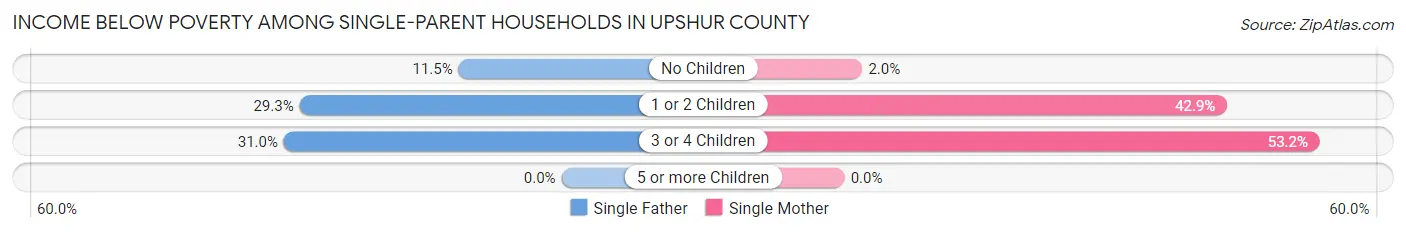
Income Below Poverty Among Single-Parent Households in Upshur County
According to the poverty data in Upshur County, 22.4% or 129 single-father households and 31.4% or 362 single-mother households are living below the poverty line. Among single-father households, those with 3 or 4 children have the highest poverty rate, with 9 households (31.0%) experiencing poverty. Likewise, among single-mother households, those with 3 or 4 children have the highest poverty rate, with 58 households (53.2%) falling below the poverty line.
| Children | Single Father | Single Mother |
| No Children | 26 (11.5%) | 7 (2.0%) |
| 1 or 2 Children | 94 (29.3%) | 297 (42.9%) |
| 3 or 4 Children | 9 (31.0%) | 58 (53.2%) |
| 5 or more Children | 0 (0.0%) | 0 (0.0%) |
| Total | 129 (22.4%) | 362 (31.4%) |
Income Below Poverty Among Married-Couple vs Single-Parent Households in Upshur County
The poverty data for Upshur County shows that 400 of the married-couple family households (8.9%) and 491 of the single-parent households (28.4%) are living below the poverty level. Within the married-couple family households, those with 3 or 4 children have the highest poverty rate, with 54 households (14.4%) falling below the poverty line. Among the single-parent households, those with 3 or 4 children have the highest poverty rate, with 67 household (48.5%) living below poverty.
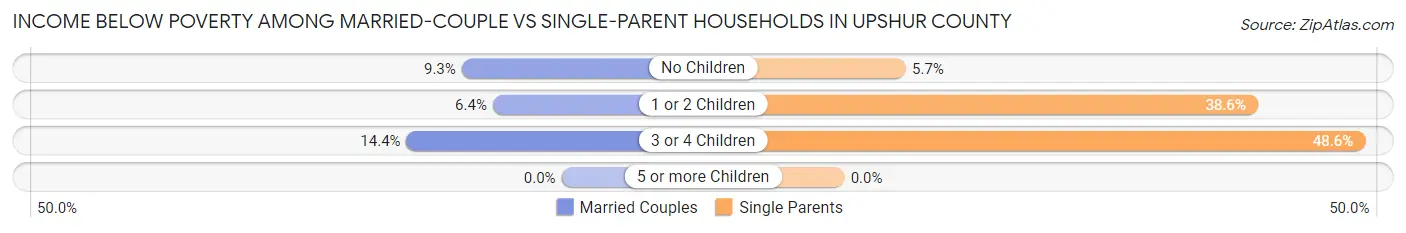
| Children | Married-Couple Families | Single-Parent Households |
| No Children | 278 (9.3%) | 33 (5.7%) |
| 1 or 2 Children | 68 (6.4%) | 391 (38.6%) |
| 3 or 4 Children | 54 (14.4%) | 67 (48.5%) |
| 5 or more Children | 0 (0.0%) | 0 (0.0%) |
| Total | 400 (8.9%) | 491 (28.4%) |
Employment Characteristics in Upshur County
Employment by Class of Employer in Upshur County
Among the 9,267 employed individuals in Upshur County, private company employees (6,311 | 68.1%), state government employees (722 | 7.8%), and not-for-profit organizations (699 | 7.5%) make up the most common classes of employment.
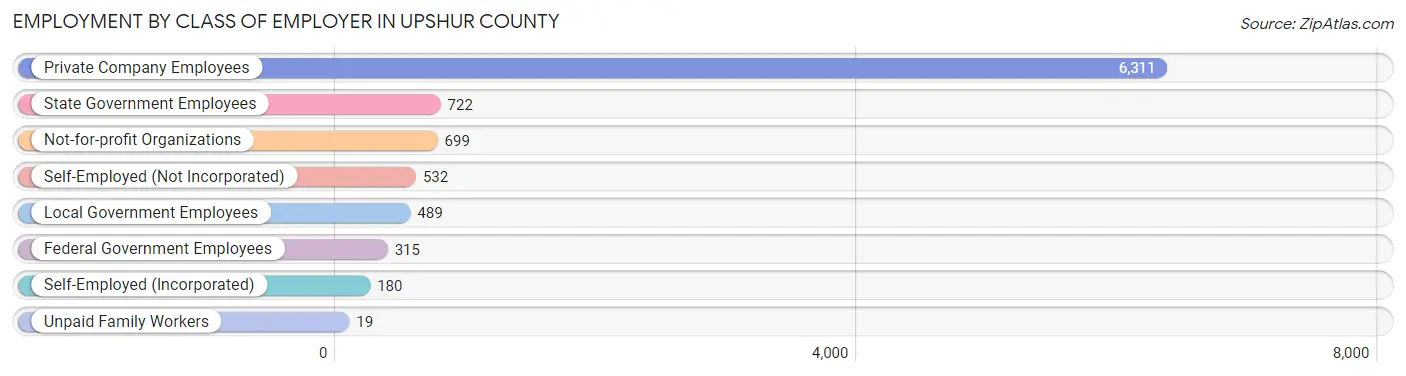
| Employer Class | # Employees | % Employees |
| Private Company Employees | 6,311 | 68.1% |
| Self-Employed (Incorporated) | 180 | 1.9% |
| Self-Employed (Not Incorporated) | 532 | 5.7% |
| Not-for-profit Organizations | 699 | 7.5% |
| Local Government Employees | 489 | 5.3% |
| State Government Employees | 722 | 7.8% |
| Federal Government Employees | 315 | 3.4% |
| Unpaid Family Workers | 19 | 0.2% |
| Total | 9,267 | 100.0% |
Employment Status by Age in Upshur County
According to the labor force statistics for Upshur County, out of the total population over 16 years of age (19,447), 52.2% or 10,151 individuals are in the labor force, with 5.8% or 589 of them unemployed. The age group with the highest labor force participation rate is 35 to 44 years, with 84.4% or 2,200 individuals in the labor force. Within the labor force, the 16 to 19 years age range has the highest percentage of unemployed individuals, with 14.9% or 42 of them being unemployed.
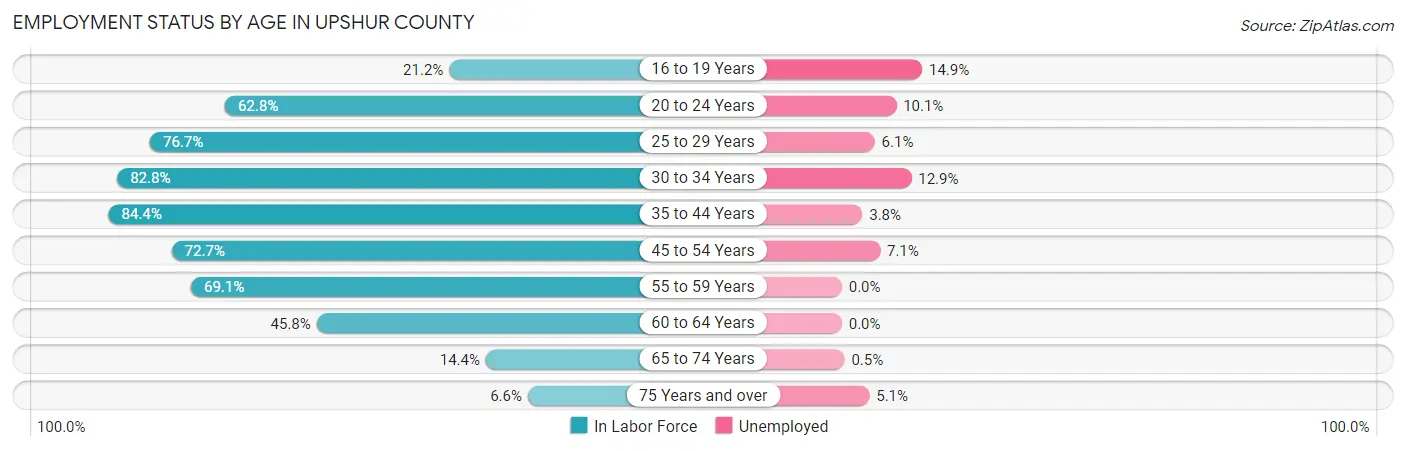
| Age Bracket | In Labor Force | Unemployed |
| 16 to 19 Years | 282 (21.2%) | 42 (14.9%) |
| 20 to 24 Years | 1,068 (62.8%) | 108 (10.1%) |
| 25 to 29 Years | 983 (76.7%) | 60 (6.1%) |
| 30 to 34 Years | 1,078 (82.8%) | 139 (12.9%) |
| 35 to 44 Years | 2,200 (84.4%) | 84 (3.8%) |
| 45 to 54 Years | 2,108 (72.7%) | 150 (7.1%) |
| 55 to 59 Years | 1,072 (69.1%) | 0 (0.0%) |
| 60 to 64 Years | 802 (45.8%) | 0 (0.0%) |
| 65 to 74 Years | 421 (14.4%) | 2 (0.5%) |
| 75 Years and over | 139 (6.6%) | 7 (5.1%) |
| Total | 10,151 (52.2%) | 589 (5.8%) |
Employment Status by Educational Attainment in Upshur County
According to labor force statistics for Upshur County, 72.3% of individuals (8,237) out of the total population between 25 and 64 years of age (11,393) are in the labor force, with 5.2% or 428 of them being unemployed. The group with the highest labor force participation rate are those with the educational attainment of bachelor's degree or higher, with 87.5% or 1,700 individuals in the labor force. Within the labor force, individuals with less than high school education have the highest percentage of unemployment, with 22.8% or 151 of them being unemployed.
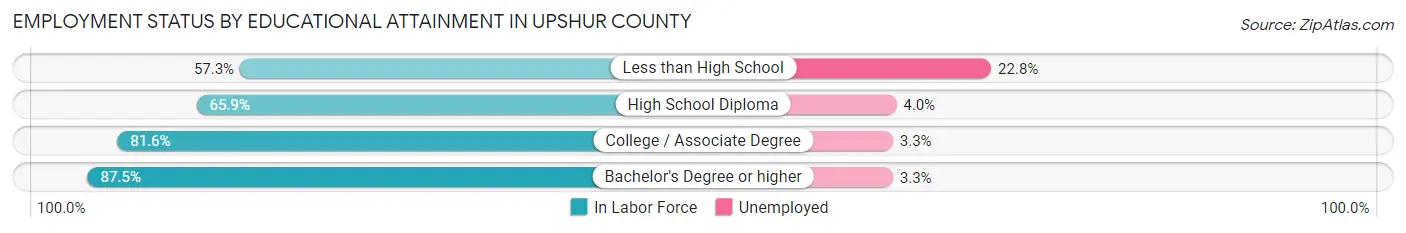
| Educational Attainment | In Labor Force | Unemployed |
| Less than High School | 662 (57.3%) | 264 (22.8%) |
| High School Diploma | 3,739 (65.9%) | 227 (4.0%) |
| College / Associate Degree | 2,139 (81.6%) | 86 (3.3%) |
| Bachelor's Degree or higher | 1,700 (87.5%) | 64 (3.3%) |
| Total | 8,237 (72.3%) | 592 (5.2%) |
Employment Occupations by Sex in Upshur County
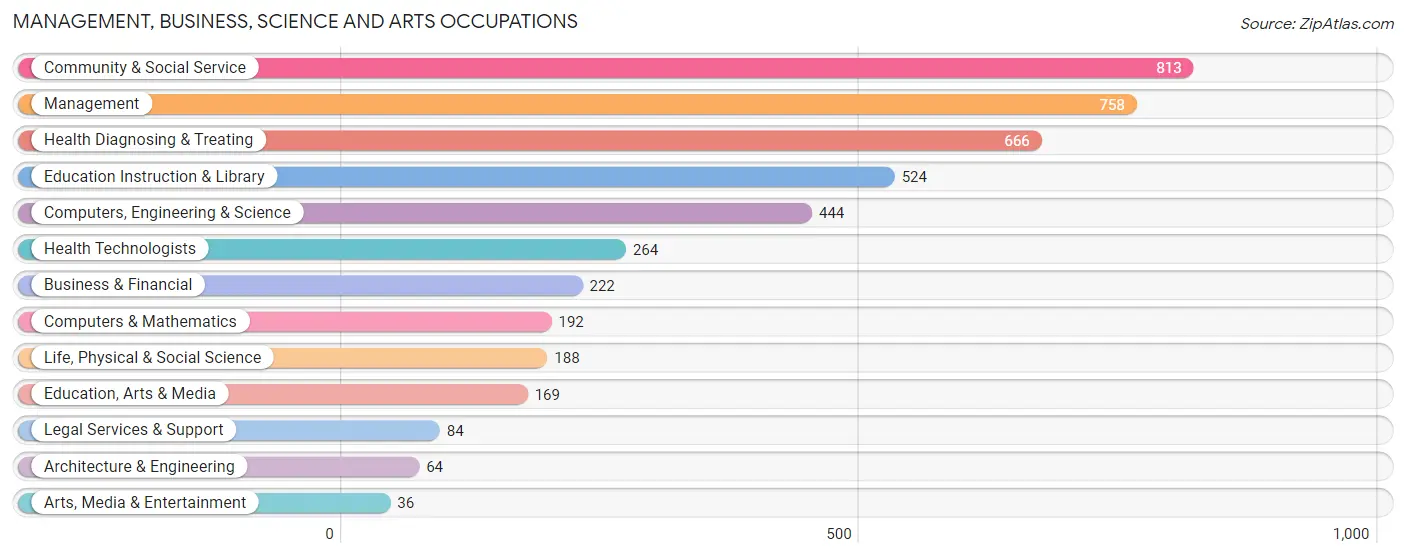
Management, Business, Science and Arts Occupations
The most common Management, Business, Science and Arts occupations in Upshur County are Community & Social Service (813 | 8.5%), Management (758 | 8.0%), Health Diagnosing & Treating (666 | 7.0%), Education Instruction & Library (524 | 5.5%), and Computers, Engineering & Science (444 | 4.7%).
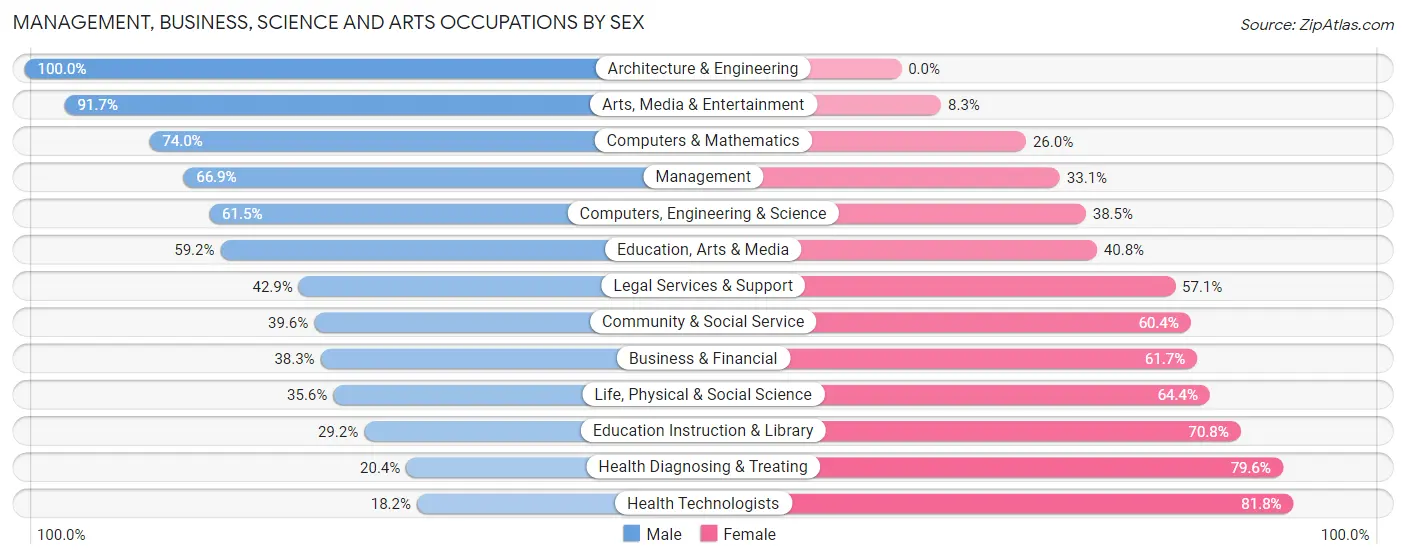
Management, Business, Science and Arts Occupations by Sex
Within the Management, Business, Science and Arts occupations in Upshur County, the most male-oriented occupations are Architecture & Engineering (100.0%), Arts, Media & Entertainment (91.7%), and Computers & Mathematics (74.0%), while the most female-oriented occupations are Health Technologists (81.8%), Health Diagnosing & Treating (79.6%), and Education Instruction & Library (70.8%).
| Occupation | Male | Female |
| Management | 507 (66.9%) | 251 (33.1%) |
| Business & Financial | 85 (38.3%) | 137 (61.7%) |
| Computers, Engineering & Science | 273 (61.5%) | 171 (38.5%) |
| Computers & Mathematics | 142 (74.0%) | 50 (26.0%) |
| Architecture & Engineering | 64 (100.0%) | 0 (0.0%) |
| Life, Physical & Social Science | 67 (35.6%) | 121 (64.4%) |
| Community & Social Service | 322 (39.6%) | 491 (60.4%) |
| Education, Arts & Media | 100 (59.2%) | 69 (40.8%) |
| Legal Services & Support | 36 (42.9%) | 48 (57.1%) |
| Education Instruction & Library | 153 (29.2%) | 371 (70.8%) |
| Arts, Media & Entertainment | 33 (91.7%) | 3 (8.3%) |
| Health Diagnosing & Treating | 136 (20.4%) | 530 (79.6%) |
| Health Technologists | 48 (18.2%) | 216 (81.8%) |
| Total (Category) | 1,323 (45.6%) | 1,580 (54.4%) |
| Total (Overall) | 5,079 (53.3%) | 4,457 (46.7%) |
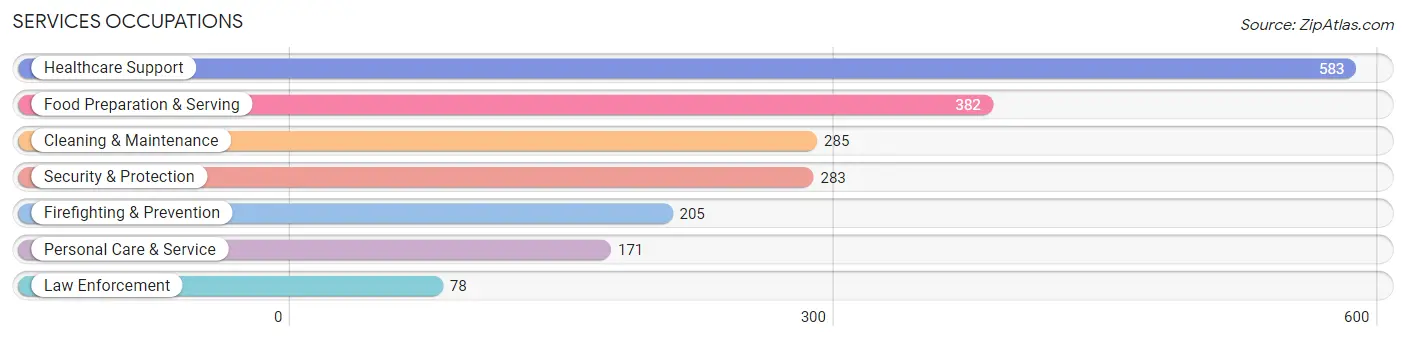
Services Occupations
The most common Services occupations in Upshur County are Healthcare Support (583 | 6.1%), Food Preparation & Serving (382 | 4.0%), Cleaning & Maintenance (285 | 3.0%), Security & Protection (283 | 3.0%), and Firefighting & Prevention (205 | 2.1%).
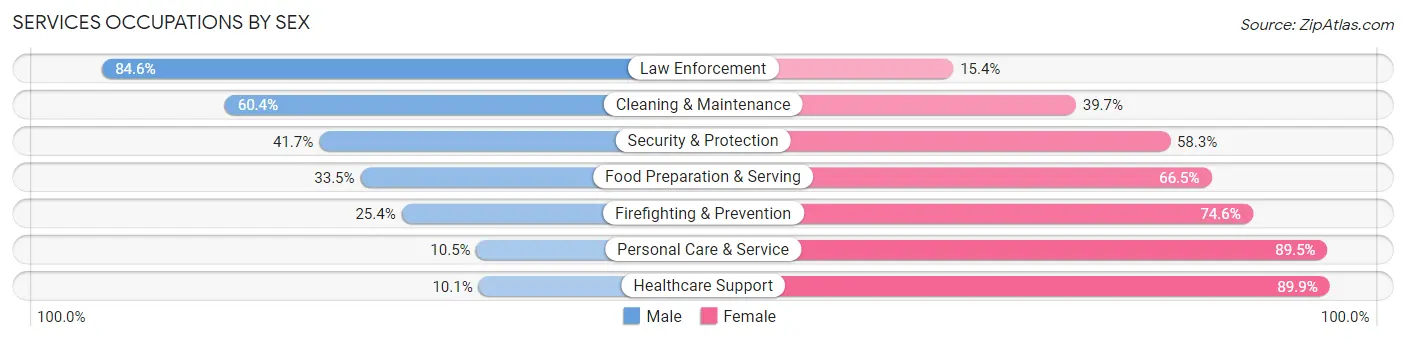
Services Occupations by Sex
Within the Services occupations in Upshur County, the most male-oriented occupations are Law Enforcement (84.6%), Cleaning & Maintenance (60.4%), and Security & Protection (41.7%), while the most female-oriented occupations are Healthcare Support (89.9%), Personal Care & Service (89.5%), and Firefighting & Prevention (74.6%).
| Occupation | Male | Female |
| Healthcare Support | 59 (10.1%) | 524 (89.9%) |
| Security & Protection | 118 (41.7%) | 165 (58.3%) |
| Firefighting & Prevention | 52 (25.4%) | 153 (74.6%) |
| Law Enforcement | 66 (84.6%) | 12 (15.4%) |
| Food Preparation & Serving | 128 (33.5%) | 254 (66.5%) |
| Cleaning & Maintenance | 172 (60.4%) | 113 (39.7%) |
| Personal Care & Service | 18 (10.5%) | 153 (89.5%) |
| Total (Category) | 495 (29.0%) | 1,209 (71.0%) |
| Total (Overall) | 5,079 (53.3%) | 4,457 (46.7%) |
Sales and Office Occupations
The most common Sales and Office occupations in Upshur County are Office & Administration (1,154 | 12.1%), and Sales & Related (876 | 9.2%).

Sales and Office Occupations by Sex
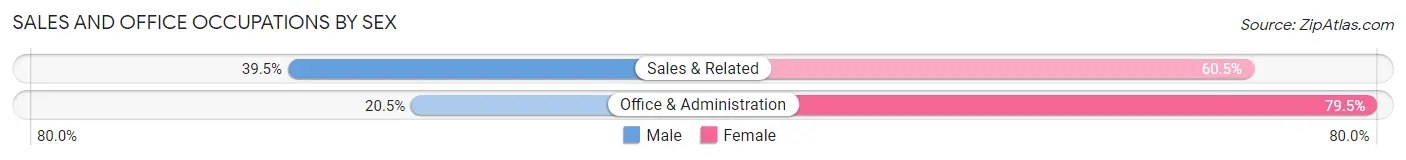
| Occupation | Male | Female |
| Sales & Related | 346 (39.5%) | 530 (60.5%) |
| Office & Administration | 237 (20.5%) | 917 (79.5%) |
| Total (Category) | 583 (28.7%) | 1,447 (71.3%) |
| Total (Overall) | 5,079 (53.3%) | 4,457 (46.7%) |
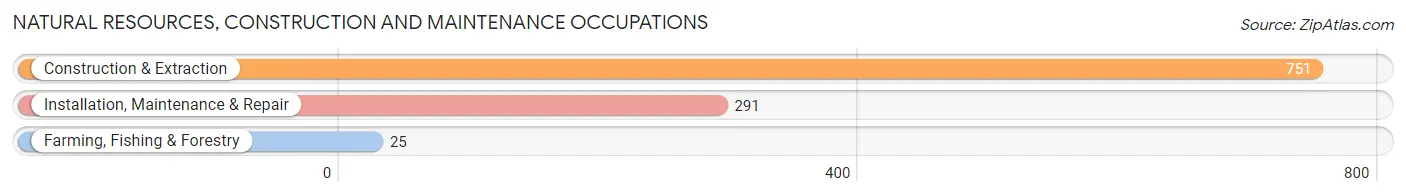
Natural Resources, Construction and Maintenance Occupations
The most common Natural Resources, Construction and Maintenance occupations in Upshur County are Construction & Extraction (751 | 7.9%), Installation, Maintenance & Repair (291 | 3.0%), and Farming, Fishing & Forestry (25 | 0.3%).
Natural Resources, Construction and Maintenance Occupations by Sex
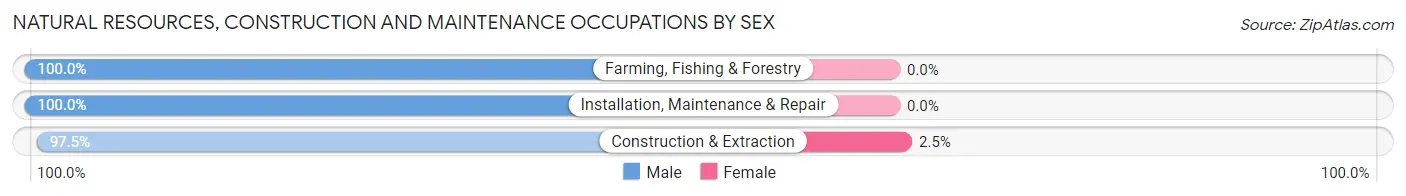
| Occupation | Male | Female |
| Farming, Fishing & Forestry | 25 (100.0%) | 0 (0.0%) |
| Construction & Extraction | 732 (97.5%) | 19 (2.5%) |
| Installation, Maintenance & Repair | 291 (100.0%) | 0 (0.0%) |
| Total (Category) | 1,048 (98.2%) | 19 (1.8%) |
| Total (Overall) | 5,079 (53.3%) | 4,457 (46.7%) |
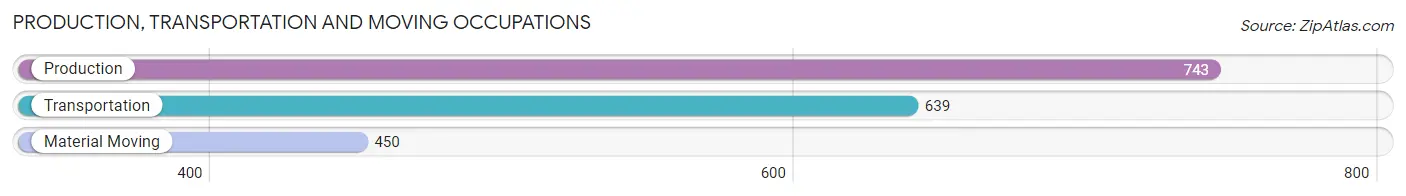
Production, Transportation and Moving Occupations
The most common Production, Transportation and Moving occupations in Upshur County are Production (743 | 7.8%), Transportation (639 | 6.7%), and Material Moving (450 | 4.7%).
Production, Transportation and Moving Occupations by Sex
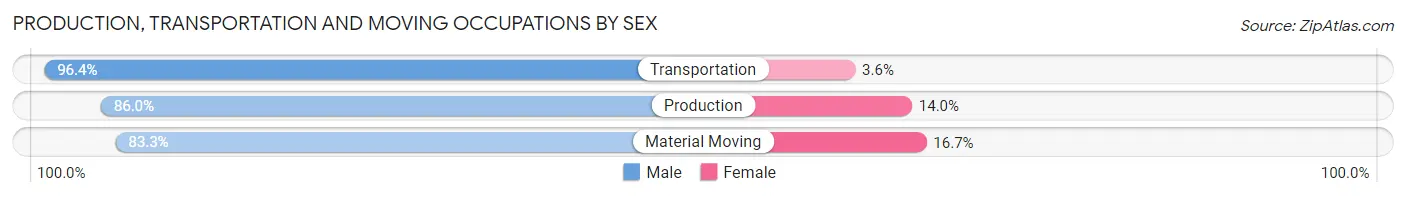
| Occupation | Male | Female |
| Production | 639 (86.0%) | 104 (14.0%) |
| Transportation | 616 (96.4%) | 23 (3.6%) |
| Material Moving | 375 (83.3%) | 75 (16.7%) |
| Total (Category) | 1,630 (89.0%) | 202 (11.0%) |
| Total (Overall) | 5,079 (53.3%) | 4,457 (46.7%) |
Employment Industries by Sex in Upshur County
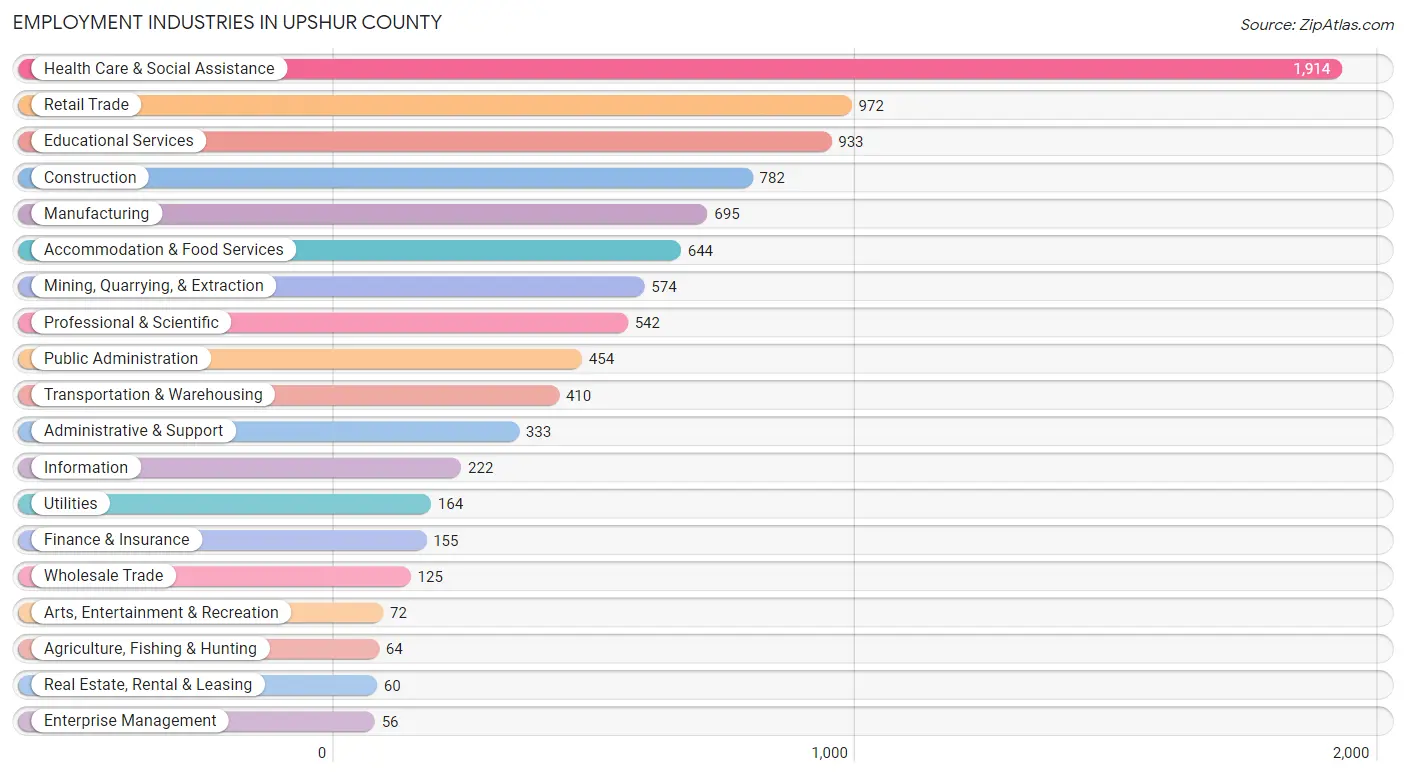
Employment Industries in Upshur County
The major employment industries in Upshur County include Health Care & Social Assistance (1,914 | 20.1%), Retail Trade (972 | 10.2%), Educational Services (933 | 9.8%), Construction (782 | 8.2%), and Manufacturing (695 | 7.3%).
Employment Industries by Sex in Upshur County
The Upshur County industries that see more men than women are Mining, Quarrying, & Extraction (100.0%), Real Estate, Rental & Leasing (100.0%), and Utilities (91.5%), whereas the industries that tend to have a higher number of women are Enterprise Management (100.0%), Health Care & Social Assistance (85.4%), and Administrative & Support (80.2%).
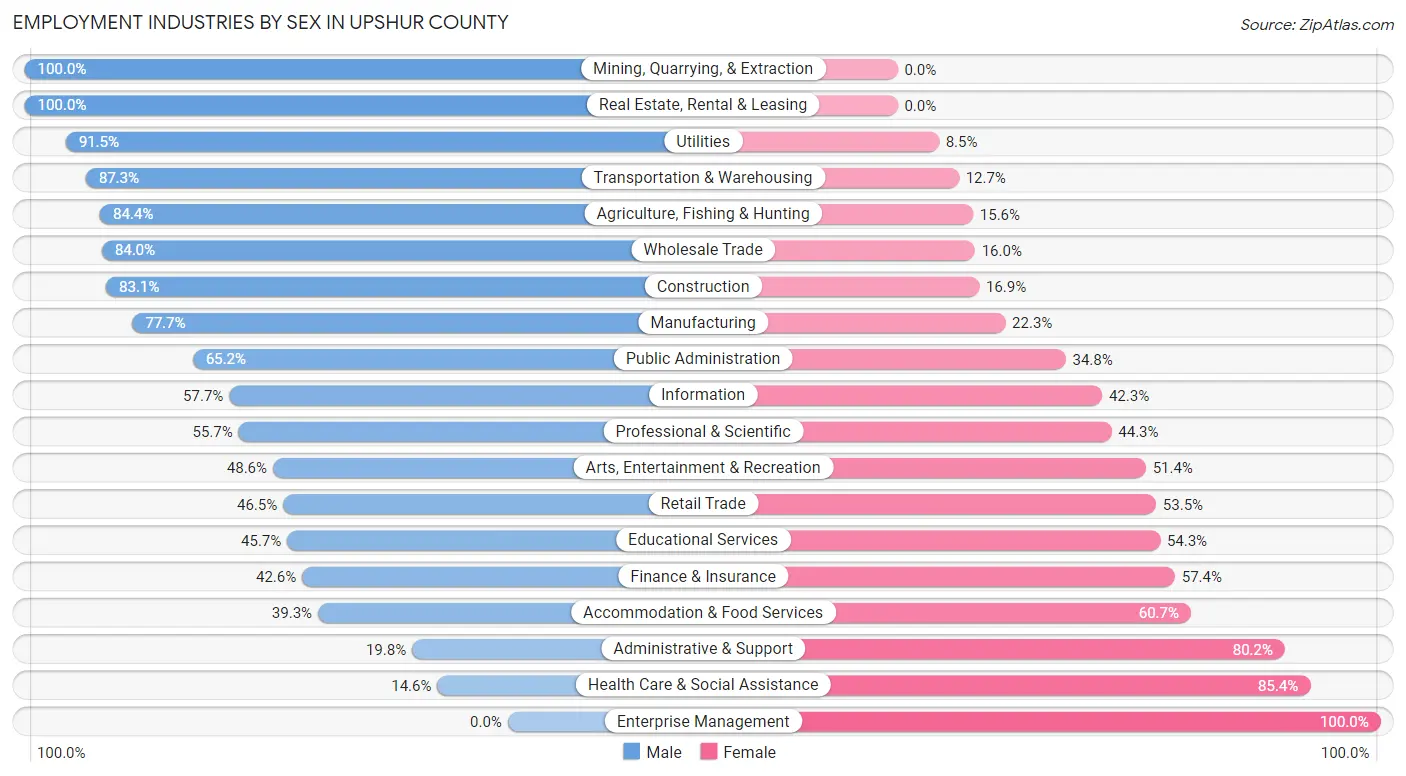
| Industry | Male | Female |
| Agriculture, Fishing & Hunting | 54 (84.4%) | 10 (15.6%) |
| Mining, Quarrying, & Extraction | 574 (100.0%) | 0 (0.0%) |
| Construction | 650 (83.1%) | 132 (16.9%) |
| Manufacturing | 540 (77.7%) | 155 (22.3%) |
| Wholesale Trade | 105 (84.0%) | 20 (16.0%) |
| Retail Trade | 452 (46.5%) | 520 (53.5%) |
| Transportation & Warehousing | 358 (87.3%) | 52 (12.7%) |
| Utilities | 150 (91.5%) | 14 (8.5%) |
| Information | 128 (57.7%) | 94 (42.3%) |
| Finance & Insurance | 66 (42.6%) | 89 (57.4%) |
| Real Estate, Rental & Leasing | 60 (100.0%) | 0 (0.0%) |
| Professional & Scientific | 302 (55.7%) | 240 (44.3%) |
| Enterprise Management | 0 (0.0%) | 56 (100.0%) |
| Administrative & Support | 66 (19.8%) | 267 (80.2%) |
| Educational Services | 426 (45.7%) | 507 (54.3%) |
| Health Care & Social Assistance | 279 (14.6%) | 1,635 (85.4%) |
| Arts, Entertainment & Recreation | 35 (48.6%) | 37 (51.4%) |
| Accommodation & Food Services | 253 (39.3%) | 391 (60.7%) |
| Public Administration | 296 (65.2%) | 158 (34.8%) |
| Total | 5,079 (53.3%) | 4,457 (46.7%) |
Education in Upshur County
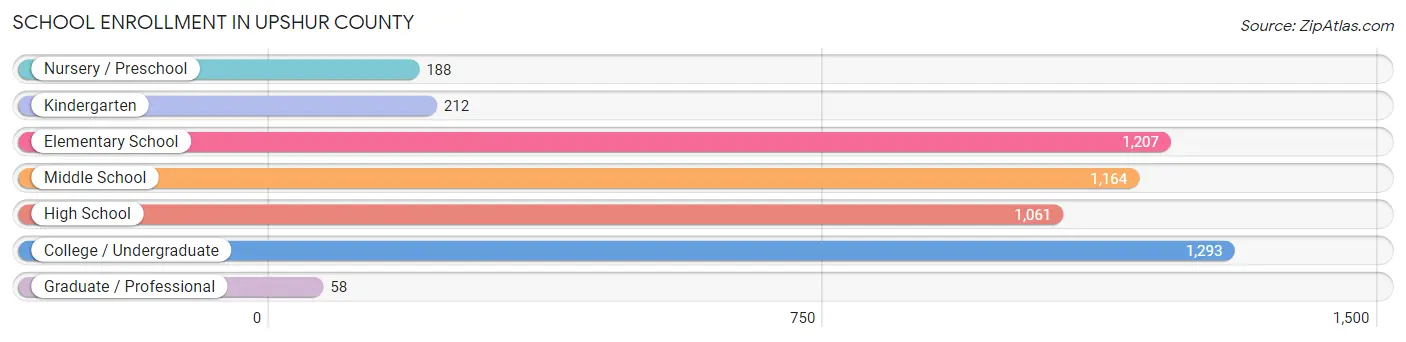
School Enrollment in Upshur County
The most common levels of schooling among the 5,183 students in Upshur County are college / undergraduate (1,293 | 24.9%), elementary school (1,207 | 23.3%), and middle school (1,164 | 22.5%).
| School Level | # Students | % Students |
| Nursery / Preschool | 188 | 3.6% |
| Kindergarten | 212 | 4.1% |
| Elementary School | 1,207 | 23.3% |
| Middle School | 1,164 | 22.5% |
| High School | 1,061 | 20.5% |
| College / Undergraduate | 1,293 | 24.9% |
| Graduate / Professional | 58 | 1.1% |
| Total | 5,183 | 100.0% |
School Enrollment by Age by Funding Source in Upshur County
Out of a total of 5,183 students who are enrolled in schools in Upshur County, 1,259 (24.3%) attend a private institution, while the remaining 3,924 (75.7%) are enrolled in public schools. The age group of 35 years and over has the highest likelihood of being enrolled in private schools, with 35 (100.0% in the age bracket) enrolled. Conversely, the age group of 10 to 14 year olds has the lowest likelihood of being enrolled in a private school, with 1,366 (97.0% in the age bracket) attending a public institution.
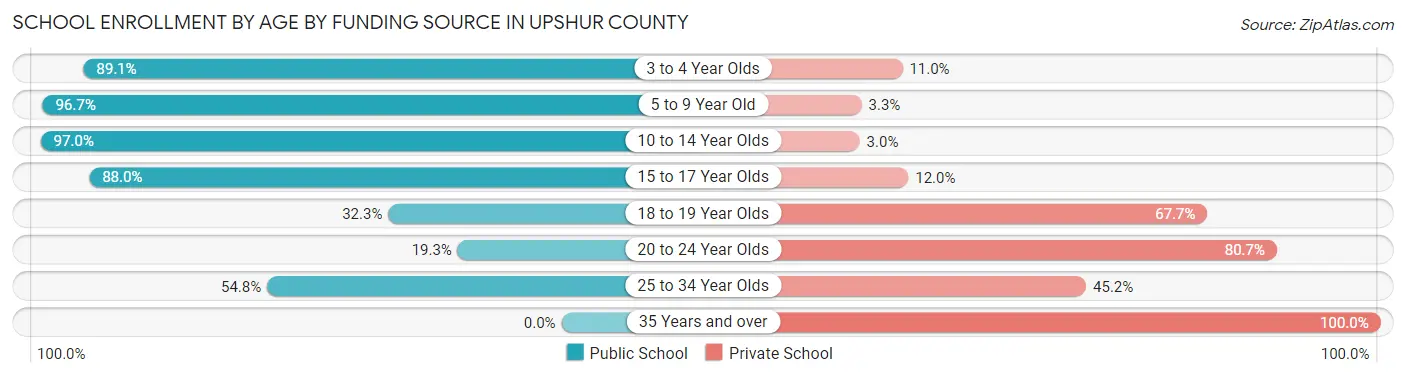
| Age Bracket | Public School | Private School |
| 3 to 4 Year Olds | 122 (89.0%) | 15 (11.0%) |
| 5 to 9 Year Old | 1,304 (96.7%) | 45 (3.3%) |
| 10 to 14 Year Olds | 1,366 (97.0%) | 42 (3.0%) |
| 15 to 17 Year Olds | 745 (88.0%) | 102 (12.0%) |
| 18 to 19 Year Olds | 232 (32.3%) | 487 (67.7%) |
| 20 to 24 Year Olds | 121 (19.3%) | 505 (80.7%) |
| 25 to 34 Year Olds | 34 (54.8%) | 28 (45.2%) |
| 35 Years and over | 0 (0.0%) | 35 (100.0%) |
| Total | 3,924 (75.7%) | 1,259 (24.3%) |
Educational Attainment by Field of Study in Upshur County
Education (651 | 21.7%), business (513 | 17.1%), science & technology (410 | 13.6%), arts & humanities (270 | 9.0%), and psychology (240 | 8.0%) are the most common fields of study among 3,006 individuals in Upshur County who have obtained a bachelor's degree or higher.
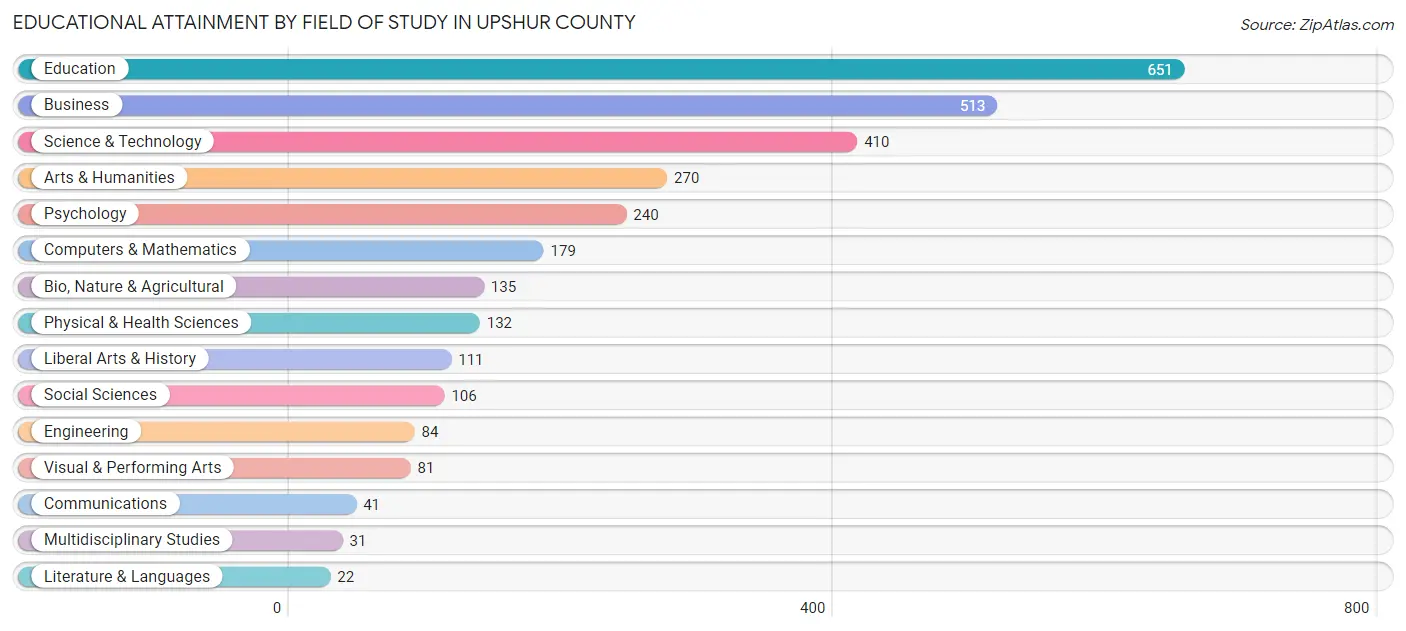
| Field of Study | # Graduates | % Graduates |
| Computers & Mathematics | 179 | 5.9% |
| Bio, Nature & Agricultural | 135 | 4.5% |
| Physical & Health Sciences | 132 | 4.4% |
| Psychology | 240 | 8.0% |
| Social Sciences | 106 | 3.5% |
| Engineering | 84 | 2.8% |
| Multidisciplinary Studies | 31 | 1.0% |
| Science & Technology | 410 | 13.6% |
| Business | 513 | 17.1% |
| Education | 651 | 21.7% |
| Literature & Languages | 22 | 0.7% |
| Liberal Arts & History | 111 | 3.7% |
| Visual & Performing Arts | 81 | 2.7% |
| Communications | 41 | 1.4% |
| Arts & Humanities | 270 | 9.0% |
| Total | 3,006 | 100.0% |
Transportation & Commute in Upshur County
Vehicle Availability by Sex in Upshur County
The most prevalent vehicle ownership categories in Upshur County are males with 2 vehicles (2,199, accounting for 45.2%) and females with 2 vehicles (1,548, making up 51.7%).
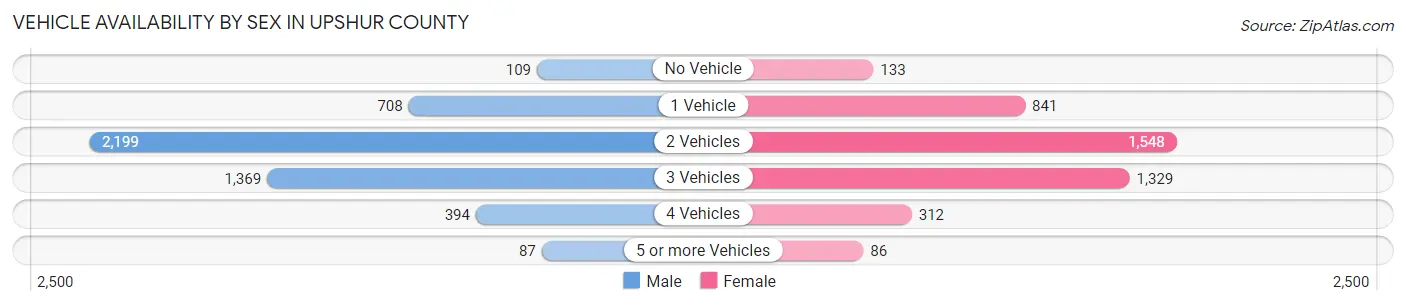
| Vehicles Available | Male | Female |
| No Vehicle | 109 (2.2%) | 133 (3.1%) |
| 1 Vehicle | 708 (14.5%) | 841 (19.8%) |
| 2 Vehicles | 2,199 (45.2%) | 1,548 (36.4%) |
| 3 Vehicles | 1,369 (28.1%) | 1,329 (31.3%) |
| 4 Vehicles | 394 (8.1%) | 312 (7.3%) |
| 5 or more Vehicles | 87 (1.8%) | 86 (2.0%) |
| Total | 4,866 (100.0%) | 4,249 (100.0%) |
Commute Time in Upshur County
The most frequently occuring commute durations in Upshur County are 10 to 14 minutes (1,363 commuters, 16.0%), 15 to 19 minutes (1,329 commuters, 15.6%), and 5 to 9 minutes (1,175 commuters, 13.8%).
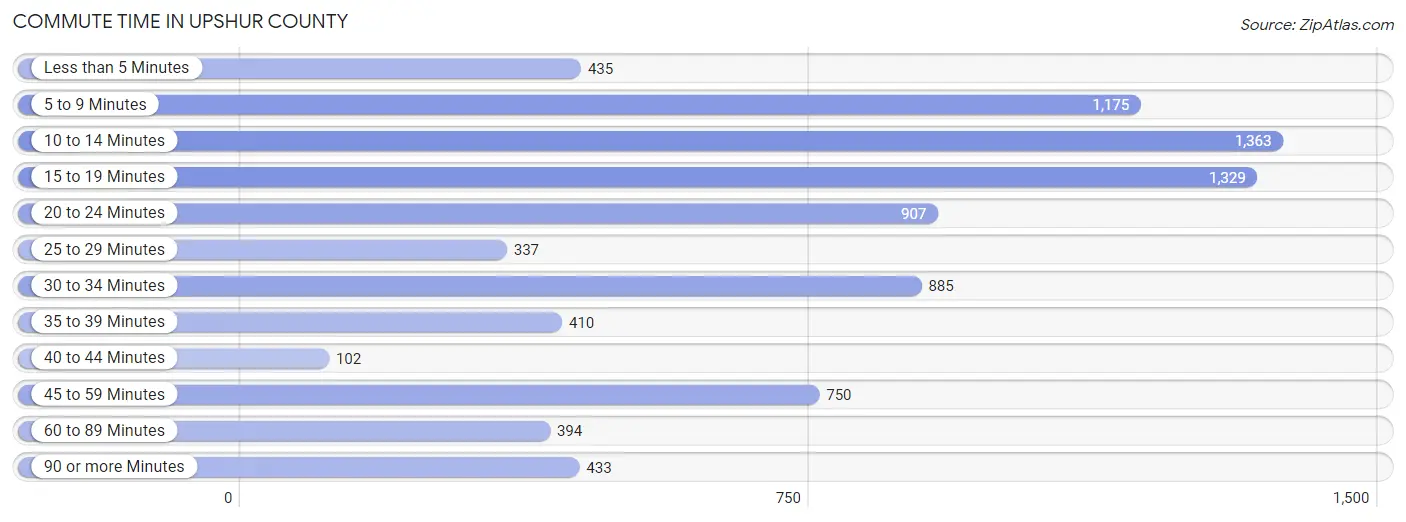
| Commute Time | # Commuters | % Commuters |
| Less than 5 Minutes | 435 | 5.1% |
| 5 to 9 Minutes | 1,175 | 13.8% |
| 10 to 14 Minutes | 1,363 | 16.0% |
| 15 to 19 Minutes | 1,329 | 15.6% |
| 20 to 24 Minutes | 907 | 10.6% |
| 25 to 29 Minutes | 337 | 4.0% |
| 30 to 34 Minutes | 885 | 10.4% |
| 35 to 39 Minutes | 410 | 4.8% |
| 40 to 44 Minutes | 102 | 1.2% |
| 45 to 59 Minutes | 750 | 8.8% |
| 60 to 89 Minutes | 394 | 4.6% |
| 90 or more Minutes | 433 | 5.1% |
Commute Time by Sex in Upshur County
The most common commute times in Upshur County are 15 to 19 minutes (659 commuters, 14.1%) for males and 10 to 14 minutes (868 commuters, 22.5%) for females.
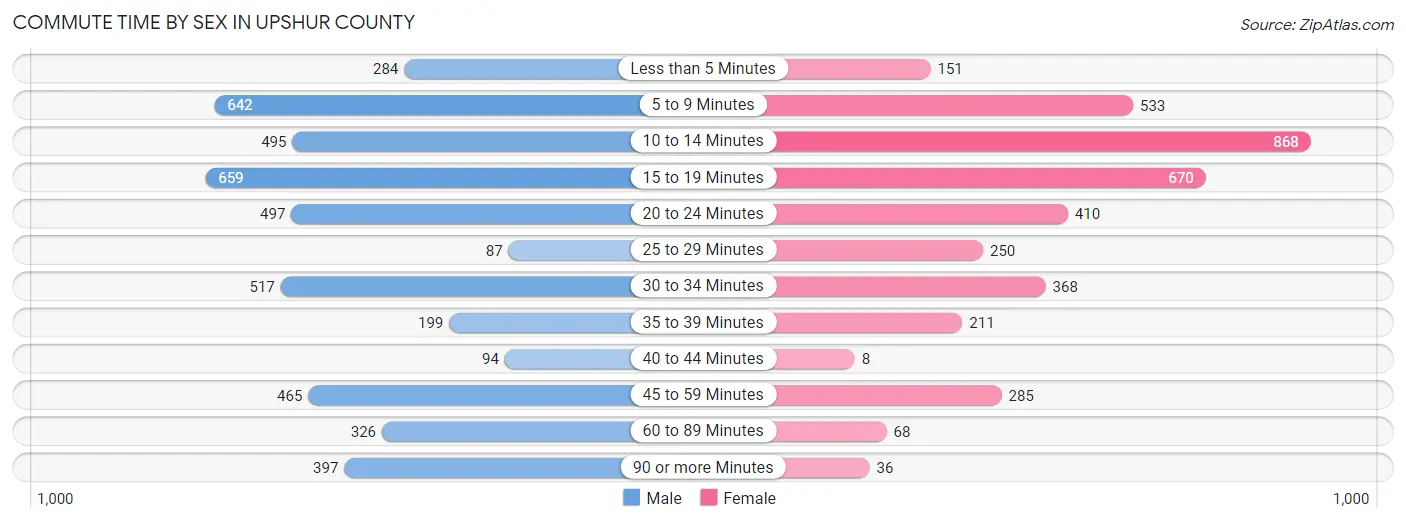
| Commute Time | Male | Female |
| Less than 5 Minutes | 284 (6.1%) | 151 (3.9%) |
| 5 to 9 Minutes | 642 (13.8%) | 533 (13.8%) |
| 10 to 14 Minutes | 495 (10.6%) | 868 (22.5%) |
| 15 to 19 Minutes | 659 (14.1%) | 670 (17.4%) |
| 20 to 24 Minutes | 497 (10.7%) | 410 (10.6%) |
| 25 to 29 Minutes | 87 (1.9%) | 250 (6.5%) |
| 30 to 34 Minutes | 517 (11.1%) | 368 (9.5%) |
| 35 to 39 Minutes | 199 (4.3%) | 211 (5.5%) |
| 40 to 44 Minutes | 94 (2.0%) | 8 (0.2%) |
| 45 to 59 Minutes | 465 (10.0%) | 285 (7.4%) |
| 60 to 89 Minutes | 326 (7.0%) | 68 (1.8%) |
| 90 or more Minutes | 397 (8.5%) | 36 (0.9%) |
Time of Departure to Work by Sex in Upshur County
The most frequent times of departure to work in Upshur County are 12:00 AM to 4:59 AM (653, 14.0%) for males and 7:00 AM to 7:29 AM (864, 22.4%) for females.
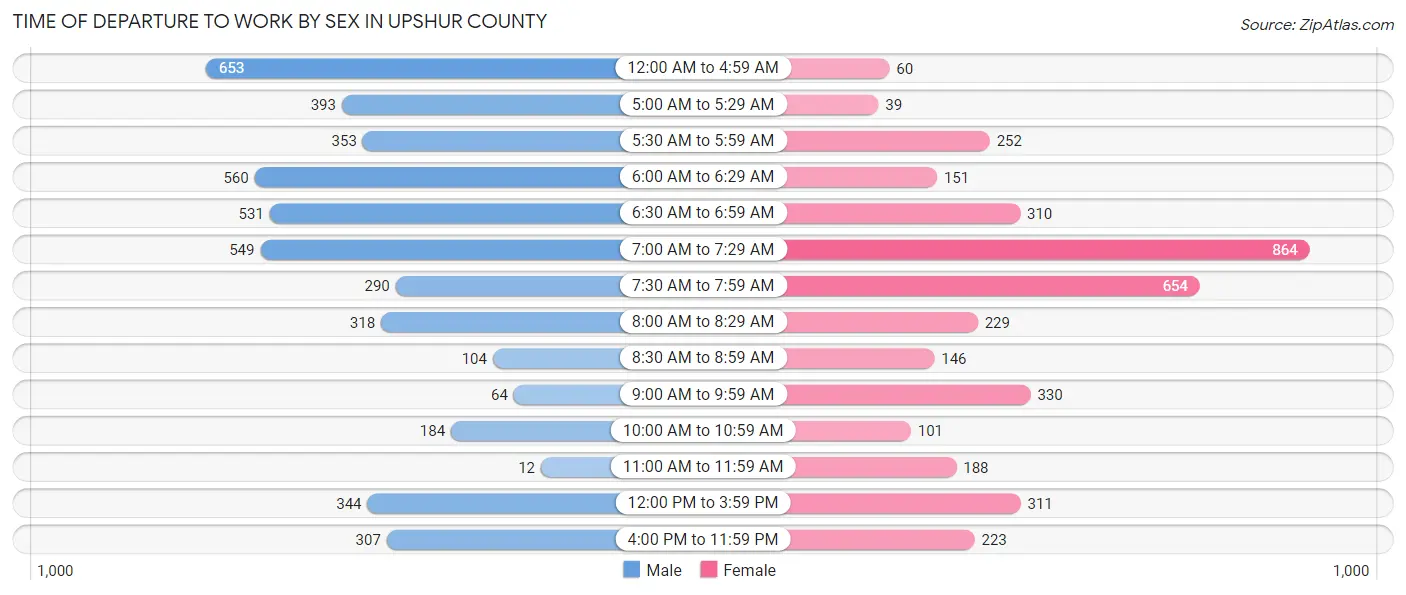
| Time of Departure | Male | Female |
| 12:00 AM to 4:59 AM | 653 (14.0%) | 60 (1.6%) |
| 5:00 AM to 5:29 AM | 393 (8.4%) | 39 (1.0%) |
| 5:30 AM to 5:59 AM | 353 (7.6%) | 252 (6.5%) |
| 6:00 AM to 6:29 AM | 560 (12.0%) | 151 (3.9%) |
| 6:30 AM to 6:59 AM | 531 (11.4%) | 310 (8.0%) |
| 7:00 AM to 7:29 AM | 549 (11.8%) | 864 (22.4%) |
| 7:30 AM to 7:59 AM | 290 (6.2%) | 654 (17.0%) |
| 8:00 AM to 8:29 AM | 318 (6.8%) | 229 (5.9%) |
| 8:30 AM to 8:59 AM | 104 (2.2%) | 146 (3.8%) |
| 9:00 AM to 9:59 AM | 64 (1.4%) | 330 (8.6%) |
| 10:00 AM to 10:59 AM | 184 (4.0%) | 101 (2.6%) |
| 11:00 AM to 11:59 AM | 12 (0.3%) | 188 (4.9%) |
| 12:00 PM to 3:59 PM | 344 (7.4%) | 311 (8.1%) |
| 4:00 PM to 11:59 PM | 307 (6.6%) | 223 (5.8%) |
| Total | 4,662 (100.0%) | 3,858 (100.0%) |
Housing Occupancy in Upshur County
Occupancy by Ownership in Upshur County
Of the total 9,537 dwellings in Upshur County, owner-occupied units account for 7,331 (76.9%), while renter-occupied units make up 2,206 (23.1%).
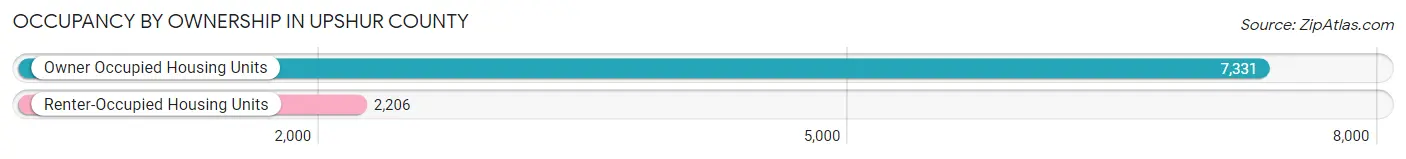
| Occupancy | # Housing Units | % Housing Units |
| Owner Occupied Housing Units | 7,331 | 76.9% |
| Renter-Occupied Housing Units | 2,206 | 23.1% |
| Total Occupied Housing Units | 9,537 | 100.0% |
Occupancy by Household Size in Upshur County
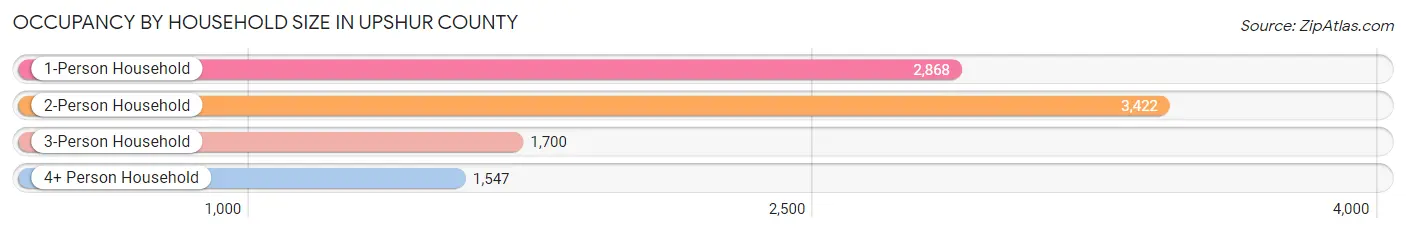
| Household Size | # Housing Units | % Housing Units |
| 1-Person Household | 2,868 | 30.1% |
| 2-Person Household | 3,422 | 35.9% |
| 3-Person Household | 1,700 | 17.8% |
| 4+ Person Household | 1,547 | 16.2% |
| Total Housing Units | 9,537 | 100.0% |
Occupancy by Ownership by Household Size in Upshur County
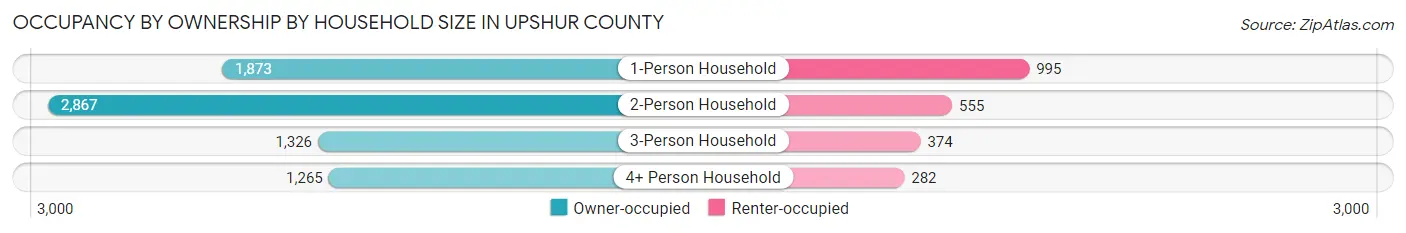
| Household Size | Owner-occupied | Renter-occupied |
| 1-Person Household | 1,873 (65.3%) | 995 (34.7%) |
| 2-Person Household | 2,867 (83.8%) | 555 (16.2%) |
| 3-Person Household | 1,326 (78.0%) | 374 (22.0%) |
| 4+ Person Household | 1,265 (81.8%) | 282 (18.2%) |
| Total Housing Units | 7,331 (76.9%) | 2,206 (23.1%) |
Occupancy by Educational Attainment in Upshur County
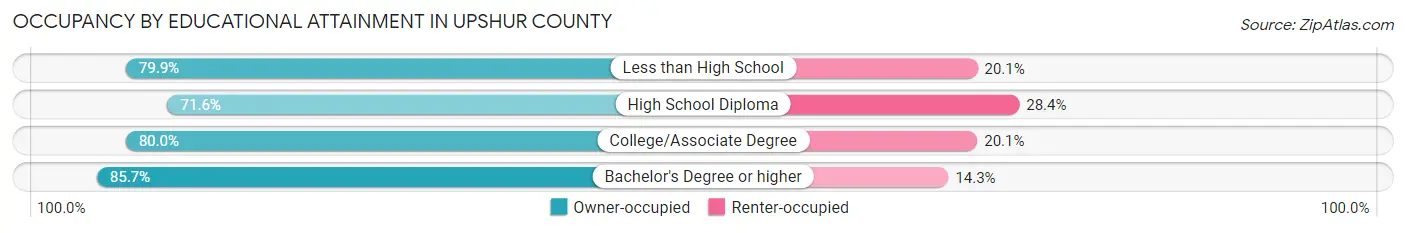
| Household Size | Owner-occupied | Renter-occupied |
| Less than High School | 911 (79.9%) | 229 (20.1%) |
| High School Diploma | 3,348 (71.6%) | 1,326 (28.4%) |
| College/Associate Degree | 1,643 (79.9%) | 412 (20.1%) |
| Bachelor's Degree or higher | 1,429 (85.7%) | 239 (14.3%) |
Occupancy by Age of Householder in Upshur County
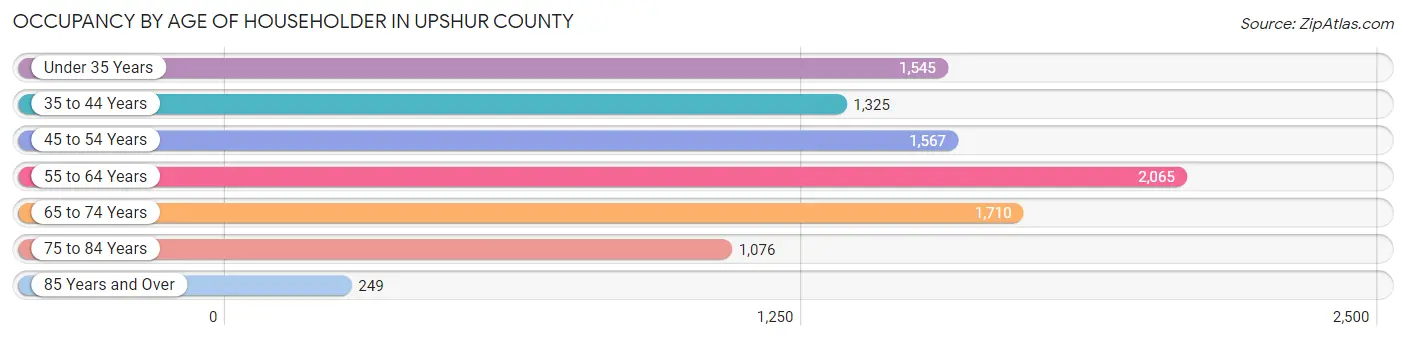
| Age Bracket | # Households | % Households |
| Under 35 Years | 1,545 | 16.2% |
| 35 to 44 Years | 1,325 | 13.9% |
| 45 to 54 Years | 1,567 | 16.4% |
| 55 to 64 Years | 2,065 | 21.6% |
| 65 to 74 Years | 1,710 | 17.9% |
| 75 to 84 Years | 1,076 | 11.3% |
| 85 Years and Over | 249 | 2.6% |
| Total | 9,537 | 100.0% |
Housing Finances in Upshur County
Median Income by Occupancy in Upshur County
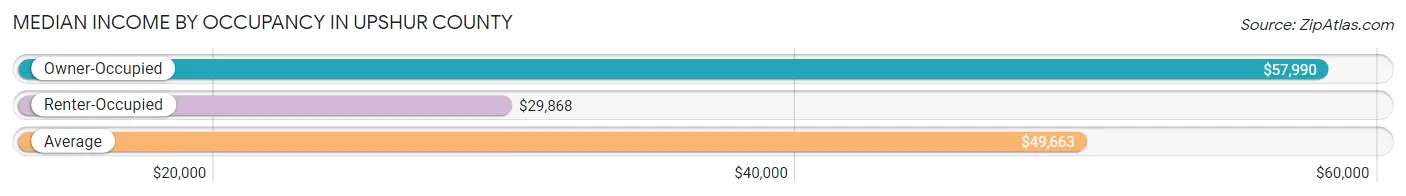
| Occupancy Type | # Households | Median Income |
| Owner-Occupied | 7,331 (76.9%) | $57,990 |
| Renter-Occupied | 2,206 (23.1%) | $29,868 |
| Average | 9,537 (100.0%) | $49,663 |
Occupancy by Householder Income Bracket in Upshur County
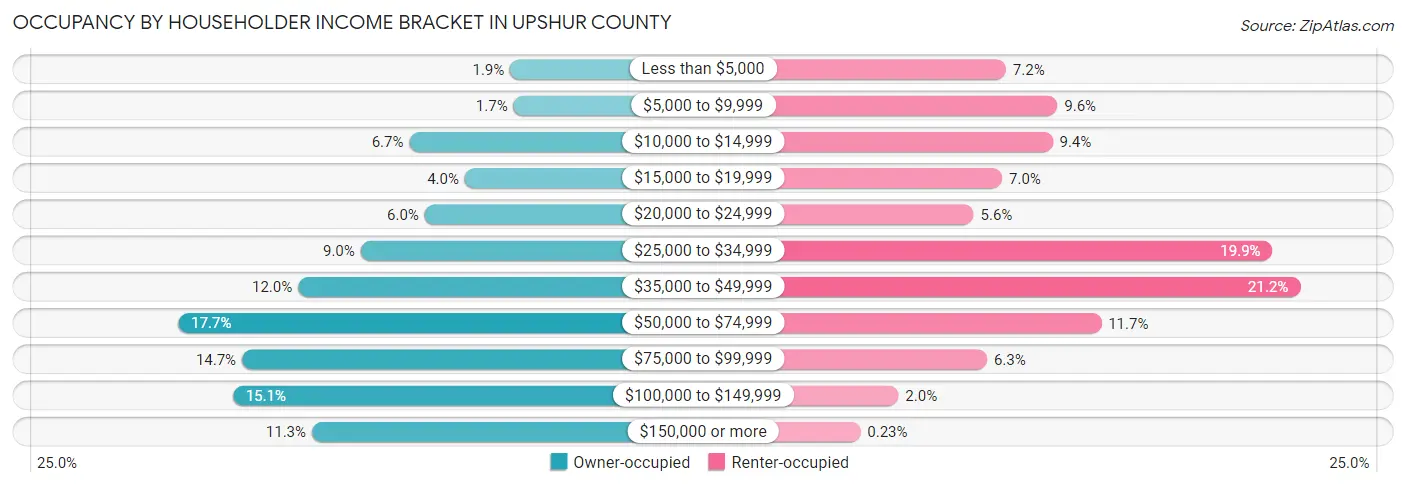
| Income Bracket | Owner-occupied | Renter-occupied |
| Less than $5,000 | 138 (1.9%) | 158 (7.2%) |
| $5,000 to $9,999 | 126 (1.7%) | 212 (9.6%) |
| $10,000 to $14,999 | 490 (6.7%) | 207 (9.4%) |
| $15,000 to $19,999 | 296 (4.0%) | 154 (7.0%) |
| $20,000 to $24,999 | 436 (5.9%) | 124 (5.6%) |
| $25,000 to $34,999 | 660 (9.0%) | 438 (19.9%) |
| $35,000 to $49,999 | 878 (12.0%) | 467 (21.2%) |
| $50,000 to $74,999 | 1,297 (17.7%) | 258 (11.7%) |
| $75,000 to $99,999 | 1,074 (14.6%) | 138 (6.3%) |
| $100,000 to $149,999 | 1,106 (15.1%) | 45 (2.0%) |
| $150,000 or more | 830 (11.3%) | 5 (0.2%) |
| Total | 7,331 (100.0%) | 2,206 (100.0%) |
Monthly Housing Cost Tiers in Upshur County
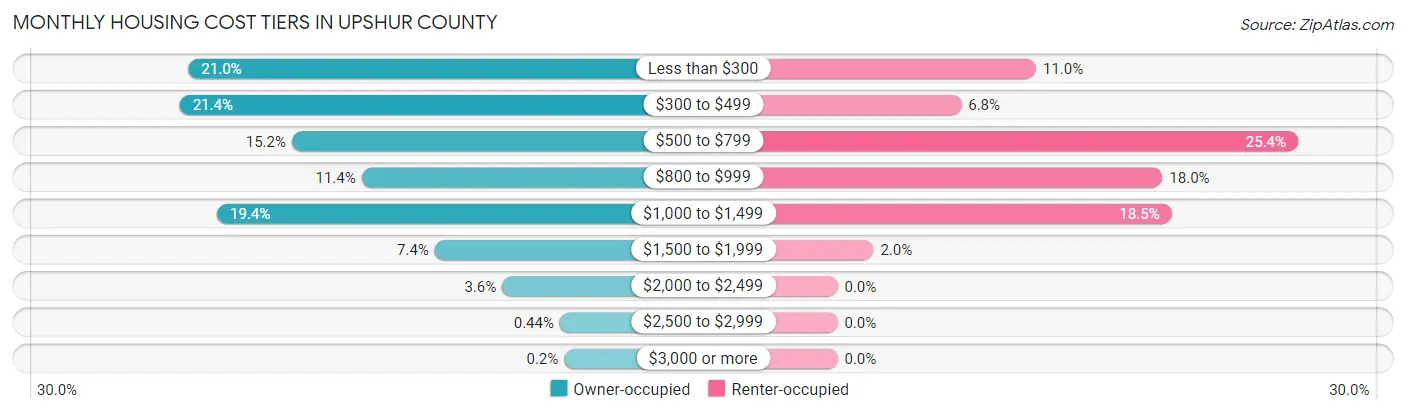
| Monthly Cost | Owner-occupied | Renter-occupied |
| Less than $300 | 1,536 (20.9%) | 242 (11.0%) |
| $300 to $499 | 1,571 (21.4%) | 151 (6.8%) |
| $500 to $799 | 1,117 (15.2%) | 561 (25.4%) |
| $800 to $999 | 835 (11.4%) | 396 (17.9%) |
| $1,000 to $1,499 | 1,420 (19.4%) | 407 (18.4%) |
| $1,500 to $1,999 | 539 (7.3%) | 44 (2.0%) |
| $2,000 to $2,499 | 266 (3.6%) | 0 (0.0%) |
| $2,500 to $2,999 | 32 (0.4%) | 0 (0.0%) |
| $3,000 or more | 15 (0.2%) | 0 (0.0%) |
| Total | 7,331 (100.0%) | 2,206 (100.0%) |
Physical Housing Characteristics in Upshur County
Housing Structures in Upshur County
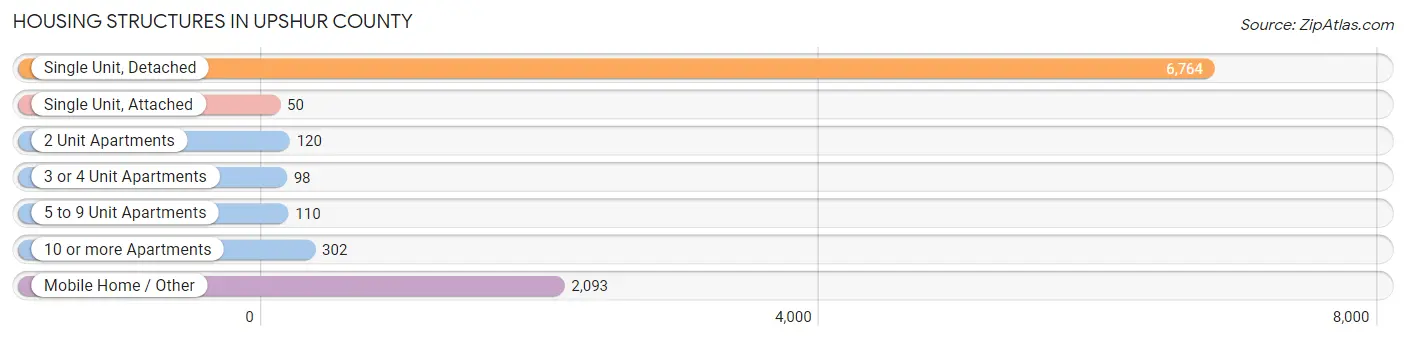
| Structure Type | # Housing Units | % Housing Units |
| Single Unit, Detached | 6,764 | 70.9% |
| Single Unit, Attached | 50 | 0.5% |
| 2 Unit Apartments | 120 | 1.3% |
| 3 or 4 Unit Apartments | 98 | 1.0% |
| 5 to 9 Unit Apartments | 110 | 1.1% |
| 10 or more Apartments | 302 | 3.2% |
| Mobile Home / Other | 2,093 | 22.0% |
| Total | 9,537 | 100.0% |
Housing Structures by Occupancy in Upshur County
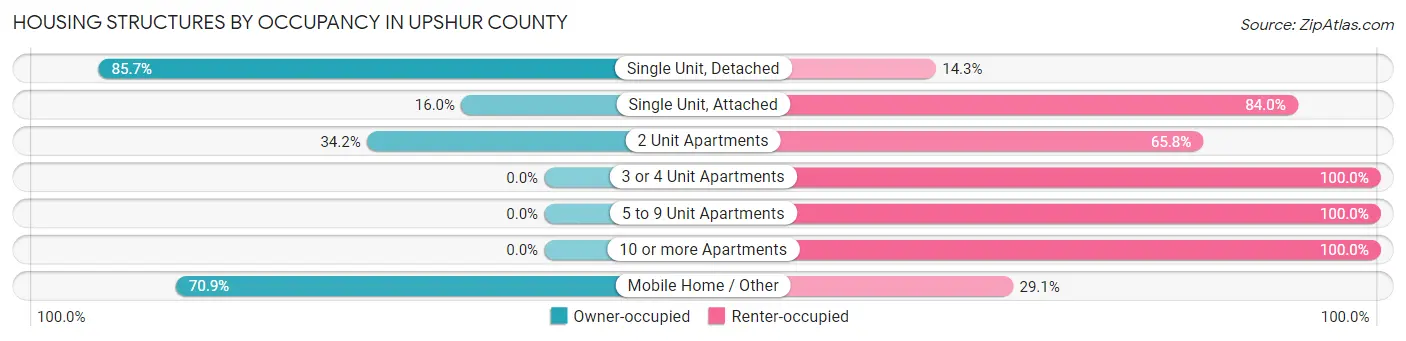
| Structure Type | Owner-occupied | Renter-occupied |
| Single Unit, Detached | 5,799 (85.7%) | 965 (14.3%) |
| Single Unit, Attached | 8 (16.0%) | 42 (84.0%) |
| 2 Unit Apartments | 41 (34.2%) | 79 (65.8%) |
| 3 or 4 Unit Apartments | 0 (0.0%) | 98 (100.0%) |
| 5 to 9 Unit Apartments | 0 (0.0%) | 110 (100.0%) |
| 10 or more Apartments | 0 (0.0%) | 302 (100.0%) |
| Mobile Home / Other | 1,483 (70.9%) | 610 (29.1%) |
| Total | 7,331 (76.9%) | 2,206 (23.1%) |
Housing Structures by Number of Rooms in Upshur County
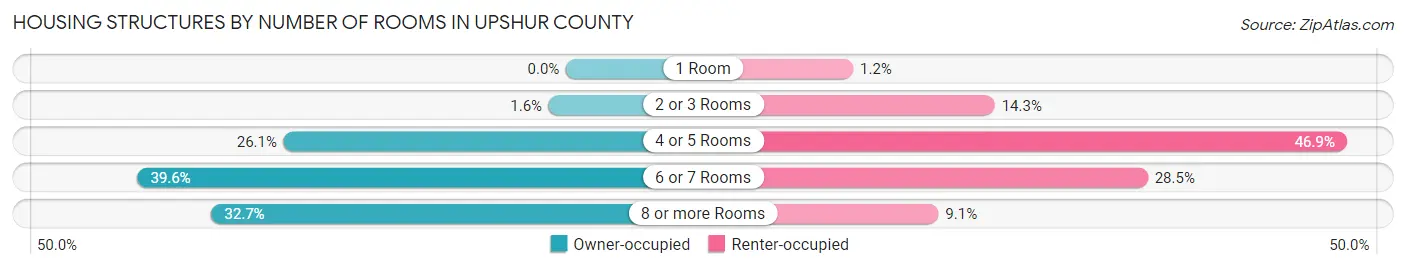
| Number of Rooms | Owner-occupied | Renter-occupied |
| 1 Room | 0 (0.0%) | 27 (1.2%) |
| 2 or 3 Rooms | 117 (1.6%) | 316 (14.3%) |
| 4 or 5 Rooms | 1,915 (26.1%) | 1,034 (46.9%) |
| 6 or 7 Rooms | 2,900 (39.6%) | 628 (28.5%) |
| 8 or more Rooms | 2,399 (32.7%) | 201 (9.1%) |
| Total | 7,331 (100.0%) | 2,206 (100.0%) |
Housing Structure by Heating Type in Upshur County
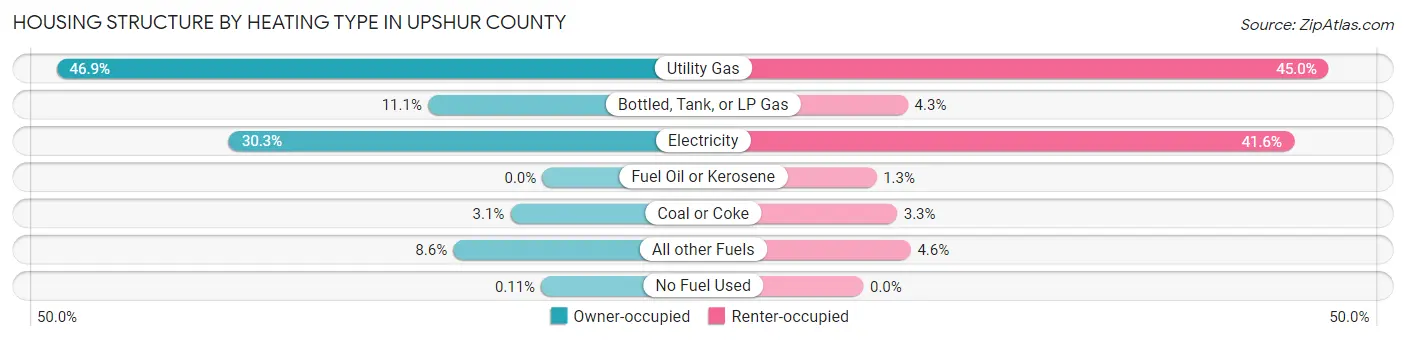
| Heating Type | Owner-occupied | Renter-occupied |
| Utility Gas | 3,438 (46.9%) | 992 (45.0%) |
| Bottled, Tank, or LP Gas | 810 (11.1%) | 95 (4.3%) |
| Electricity | 2,218 (30.3%) | 918 (41.6%) |
| Fuel Oil or Kerosene | 0 (0.0%) | 28 (1.3%) |
| Coal or Coke | 226 (3.1%) | 72 (3.3%) |
| All other Fuels | 631 (8.6%) | 101 (4.6%) |
| No Fuel Used | 8 (0.1%) | 0 (0.0%) |
| Total | 7,331 (100.0%) | 2,206 (100.0%) |
Household Vehicle Usage in Upshur County
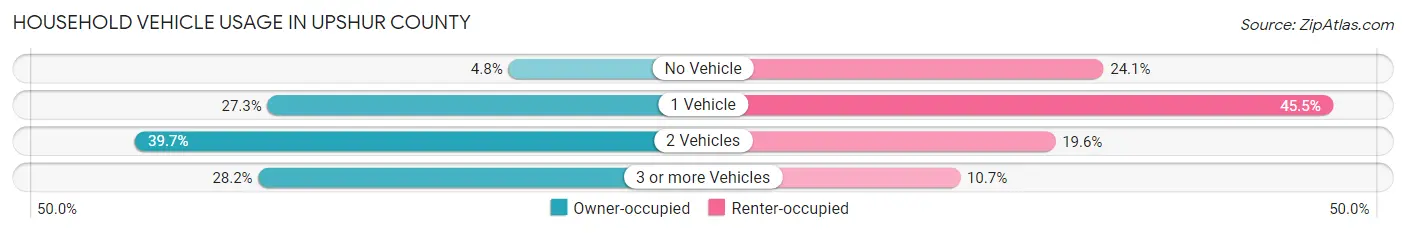
| Vehicles per Household | Owner-occupied | Renter-occupied |
| No Vehicle | 354 (4.8%) | 532 (24.1%) |
| 1 Vehicle | 2,003 (27.3%) | 1,004 (45.5%) |
| 2 Vehicles | 2,909 (39.7%) | 433 (19.6%) |
| 3 or more Vehicles | 2,065 (28.2%) | 237 (10.7%) |
| Total | 7,331 (100.0%) | 2,206 (100.0%) |
Real Estate & Mortgages in Upshur County
Real Estate and Mortgage Overview in Upshur County
| Characteristic | Without Mortgage | With Mortgage |
| Housing Units | 3,558 | 3,773 |
| Median Property Value | $143,100 | $158,300 |
| Median Household Income | $47,159 | $619 |
| Monthly Housing Costs | $325 | $7 |
| Real Estate Taxes | $604 | $110 |
Property Value by Mortgage Status in Upshur County
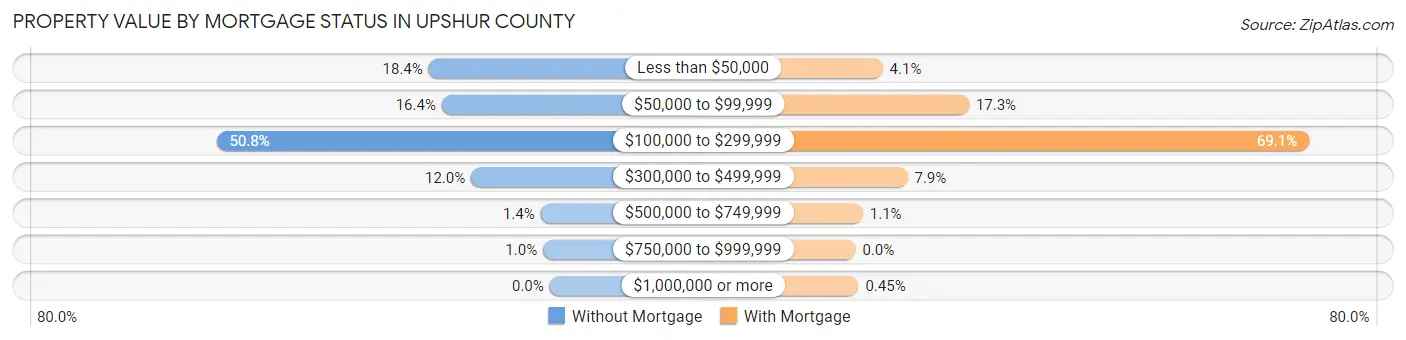
| Property Value | Without Mortgage | With Mortgage |
| Less than $50,000 | 656 (18.4%) | 156 (4.1%) |
| $50,000 to $99,999 | 585 (16.4%) | 652 (17.3%) |
| $100,000 to $299,999 | 1,806 (50.8%) | 2,607 (69.1%) |
| $300,000 to $499,999 | 426 (12.0%) | 299 (7.9%) |
| $500,000 to $749,999 | 49 (1.4%) | 42 (1.1%) |
| $750,000 to $999,999 | 36 (1.0%) | 0 (0.0%) |
| $1,000,000 or more | 0 (0.0%) | 17 (0.4%) |
| Total | 3,558 (100.0%) | 3,773 (100.0%) |
Household Income by Mortgage Status in Upshur County
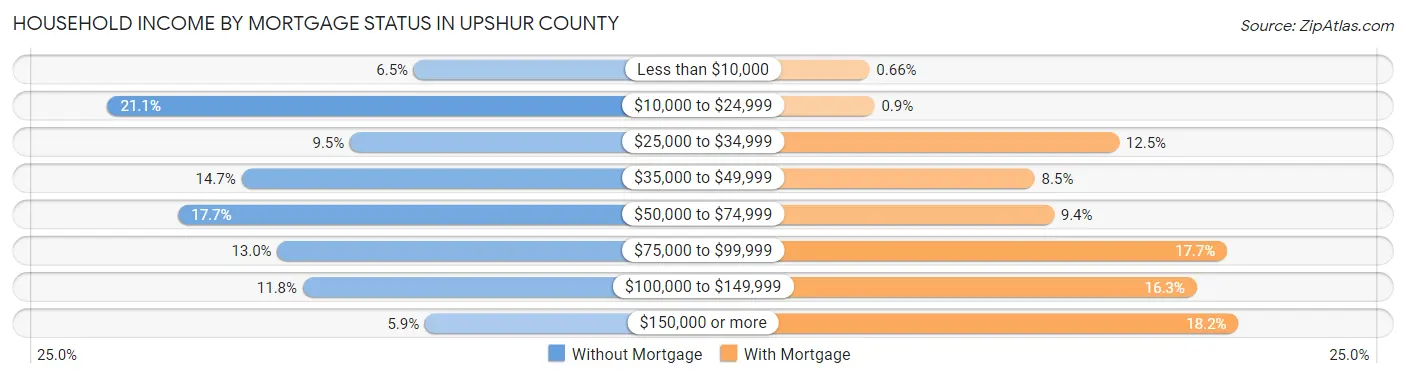
| Household Income | Without Mortgage | With Mortgage |
| Less than $10,000 | 230 (6.5%) | 25 (0.7%) |
| $10,000 to $24,999 | 749 (21.0%) | 34 (0.9%) |
| $25,000 to $34,999 | 338 (9.5%) | 473 (12.5%) |
| $35,000 to $49,999 | 522 (14.7%) | 322 (8.5%) |
| $50,000 to $74,999 | 629 (17.7%) | 356 (9.4%) |
| $75,000 to $99,999 | 461 (13.0%) | 668 (17.7%) |
| $100,000 to $149,999 | 418 (11.7%) | 613 (16.3%) |
| $150,000 or more | 211 (5.9%) | 688 (18.2%) |
| Total | 3,558 (100.0%) | 3,773 (100.0%) |
Property Value to Household Income Ratio in Upshur County
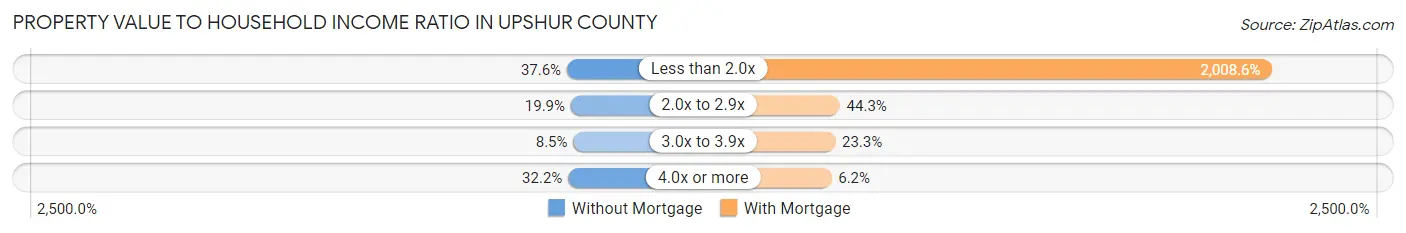
| Value-to-Income Ratio | Without Mortgage | With Mortgage |
| Less than 2.0x | 1,336 (37.6%) | 75,783 (2,008.6%) |
| 2.0x to 2.9x | 708 (19.9%) | 1,672 (44.3%) |
| 3.0x to 3.9x | 303 (8.5%) | 878 (23.3%) |
| 4.0x or more | 1,145 (32.2%) | 234 (6.2%) |
| Total | 3,558 (100.0%) | 3,773 (100.0%) |
Real Estate Taxes by Mortgage Status in Upshur County
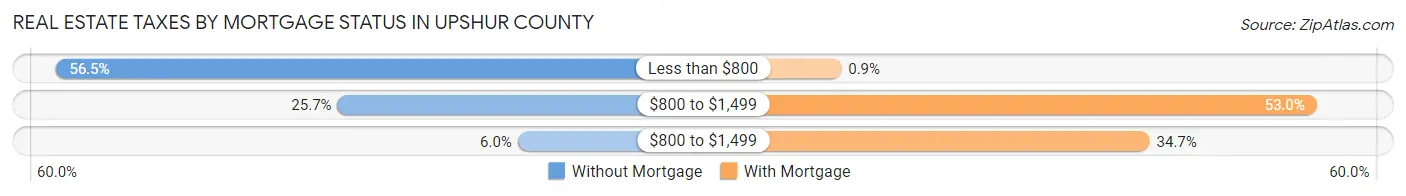
| Property Taxes | Without Mortgage | With Mortgage |
| Less than $800 | 2,011 (56.5%) | 34 (0.9%) |
| $800 to $1,499 | 915 (25.7%) | 2,000 (53.0%) |
| $800 to $1,499 | 212 (6.0%) | 1,309 (34.7%) |
| Total | 3,558 (100.0%) | 3,773 (100.0%) |
Health & Disability in Upshur County
Health Insurance Coverage by Age in Upshur County
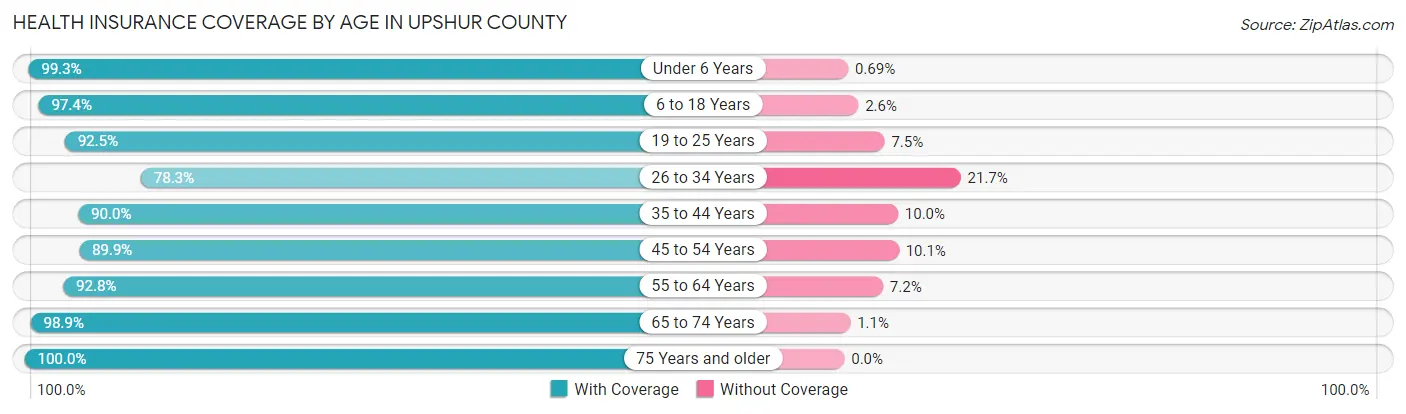
| Age Bracket | With Coverage | Without Coverage |
| Under 6 Years | 1,429 (99.3%) | 10 (0.7%) |
| 6 to 18 Years | 3,782 (97.4%) | 101 (2.6%) |
| 19 to 25 Years | 2,175 (92.5%) | 176 (7.5%) |
| 26 to 34 Years | 1,830 (78.3%) | 507 (21.7%) |
| 35 to 44 Years | 2,342 (90.0%) | 260 (10.0%) |
| 45 to 54 Years | 2,596 (89.9%) | 293 (10.1%) |
| 55 to 64 Years | 3,056 (92.8%) | 237 (7.2%) |
| 65 to 74 Years | 2,847 (98.9%) | 32 (1.1%) |
| 75 Years and older | 1,936 (100.0%) | 0 (0.0%) |
| Total | 21,993 (93.2%) | 1,616 (6.8%) |
Health Insurance Coverage by Citizenship Status in Upshur County
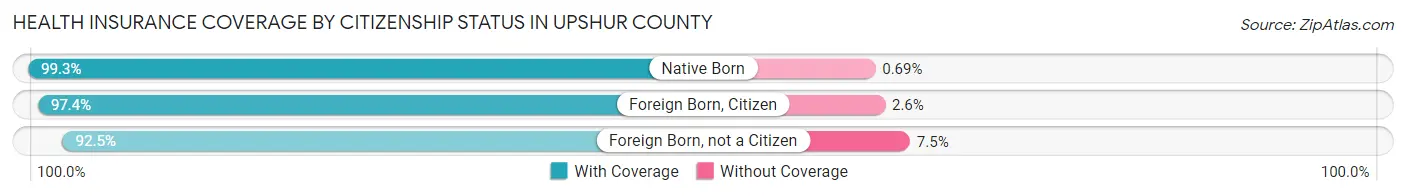
| Citizenship Status | With Coverage | Without Coverage |
| Native Born | 1,429 (99.3%) | 10 (0.7%) |
| Foreign Born, Citizen | 3,782 (97.4%) | 101 (2.6%) |
| Foreign Born, not a Citizen | 2,175 (92.5%) | 176 (7.5%) |
Health Insurance Coverage by Household Income in Upshur County
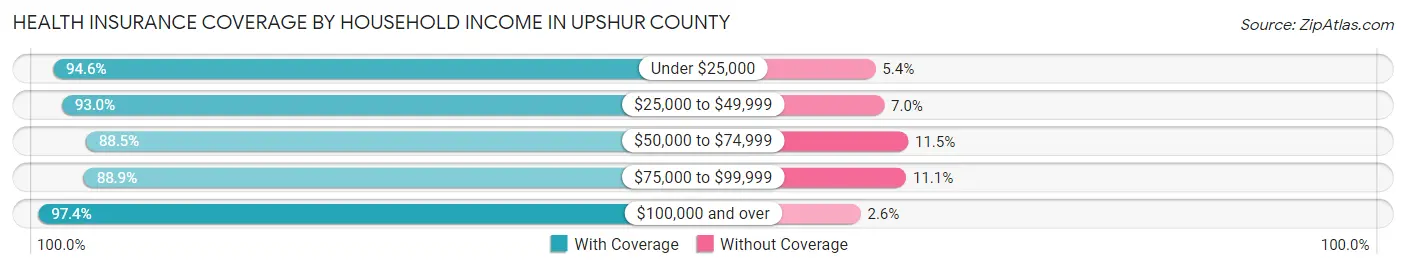
| Household Income | With Coverage | Without Coverage |
| Under $25,000 | 3,462 (94.6%) | 196 (5.4%) |
| $25,000 to $49,999 | 5,080 (93.0%) | 382 (7.0%) |
| $50,000 to $74,999 | 3,455 (88.5%) | 448 (11.5%) |
| $75,000 to $99,999 | 3,130 (88.9%) | 391 (11.1%) |
| $100,000 and over | 5,789 (97.4%) | 153 (2.6%) |
Public vs Private Health Insurance Coverage by Age in Upshur County
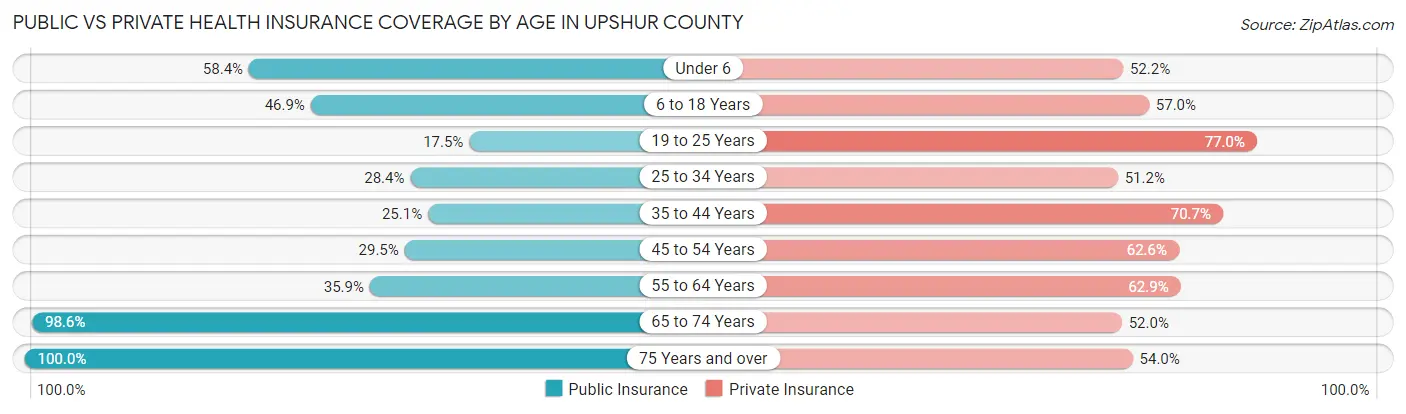
| Age Bracket | Public Insurance | Private Insurance |
| Under 6 | 840 (58.4%) | 751 (52.2%) |
| 6 to 18 Years | 1,821 (46.9%) | 2,213 (57.0%) |
| 19 to 25 Years | 411 (17.5%) | 1,811 (77.0%) |
| 25 to 34 Years | 664 (28.4%) | 1,197 (51.2%) |
| 35 to 44 Years | 654 (25.1%) | 1,840 (70.7%) |
| 45 to 54 Years | 851 (29.5%) | 1,807 (62.5%) |
| 55 to 64 Years | 1,183 (35.9%) | 2,070 (62.9%) |
| 65 to 74 Years | 2,839 (98.6%) | 1,496 (52.0%) |
| 75 Years and over | 1,936 (100.0%) | 1,045 (54.0%) |
| Total | 11,199 (47.4%) | 14,230 (60.3%) |
Disability Status by Sex by Age in Upshur County
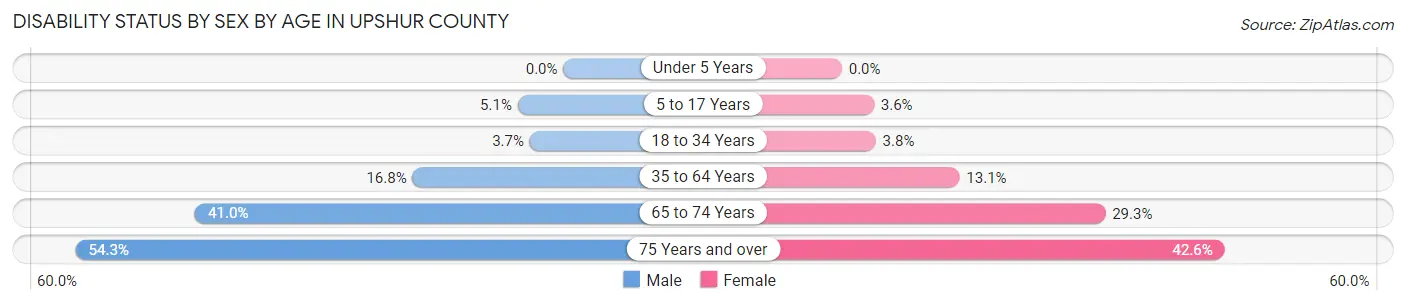
| Age Bracket | Male | Female |
| Under 5 Years | 0 (0.0%) | 0 (0.0%) |
| 5 to 17 Years | 93 (5.1%) | 66 (3.6%) |
| 18 to 34 Years | 100 (3.7%) | 93 (3.8%) |
| 35 to 64 Years | 750 (16.8%) | 566 (13.1%) |
| 65 to 74 Years | 588 (41.0%) | 424 (29.3%) |
| 75 Years and over | 473 (54.3%) | 454 (42.6%) |
Disability Class by Sex by Age in Upshur County
Disability Class: Hearing Difficulty
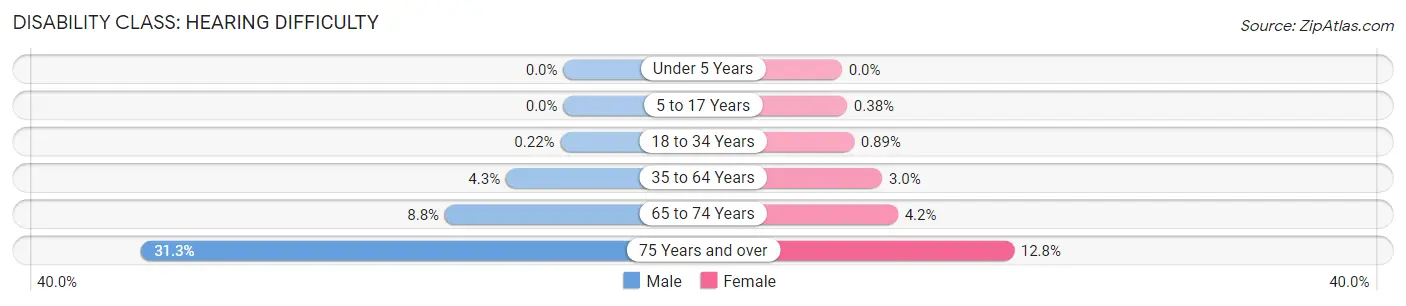
| Age Bracket | Male | Female |
| Under 5 Years | 0 (0.0%) | 0 (0.0%) |
| 5 to 17 Years | 0 (0.0%) | 7 (0.4%) |
| 18 to 34 Years | 6 (0.2%) | 22 (0.9%) |
| 35 to 64 Years | 190 (4.3%) | 129 (3.0%) |
| 65 to 74 Years | 126 (8.8%) | 60 (4.2%) |
| 75 Years and over | 273 (31.3%) | 136 (12.8%) |
Disability Class: Vision Difficulty
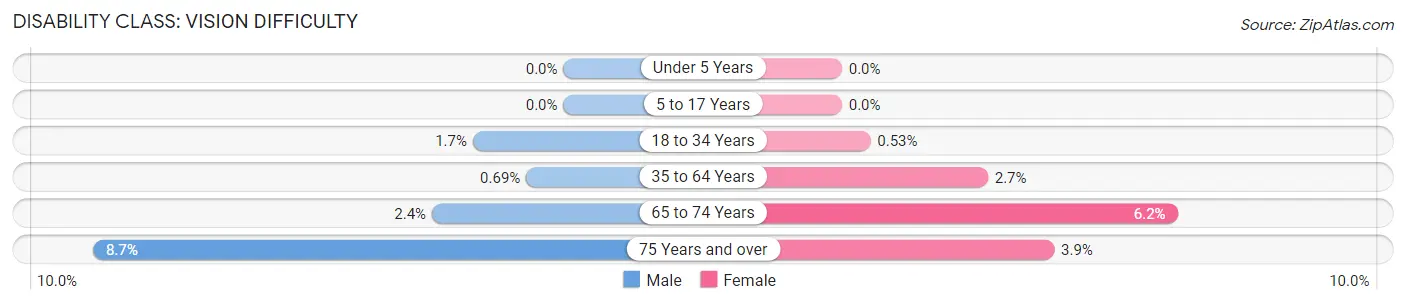
| Age Bracket | Male | Female |
| Under 5 Years | 0 (0.0%) | 0 (0.0%) |
| 5 to 17 Years | 0 (0.0%) | 0 (0.0%) |
| 18 to 34 Years | 45 (1.7%) | 13 (0.5%) |
| 35 to 64 Years | 31 (0.7%) | 117 (2.7%) |
| 65 to 74 Years | 35 (2.4%) | 90 (6.2%) |
| 75 Years and over | 76 (8.7%) | 42 (3.9%) |
Disability Class: Cognitive Difficulty
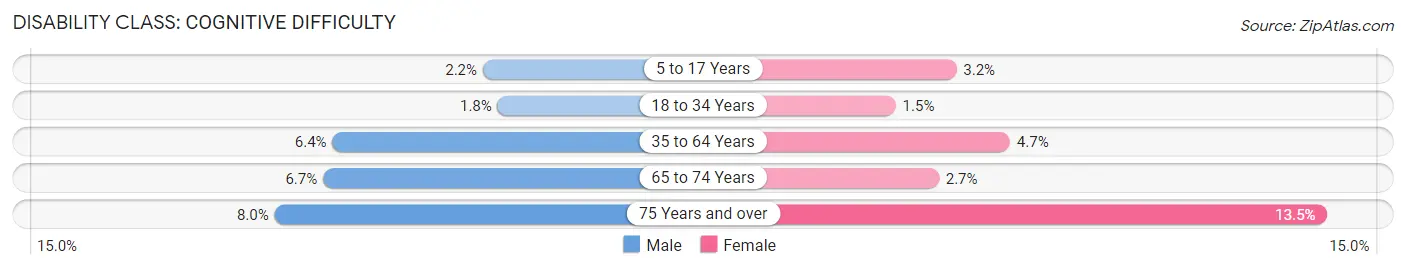
| Age Bracket | Male | Female |
| 5 to 17 Years | 41 (2.2%) | 59 (3.2%) |
| 18 to 34 Years | 49 (1.8%) | 37 (1.5%) |
| 35 to 64 Years | 287 (6.4%) | 202 (4.7%) |
| 65 to 74 Years | 96 (6.7%) | 39 (2.7%) |
| 75 Years and over | 70 (8.0%) | 144 (13.5%) |
Disability Class: Ambulatory Difficulty
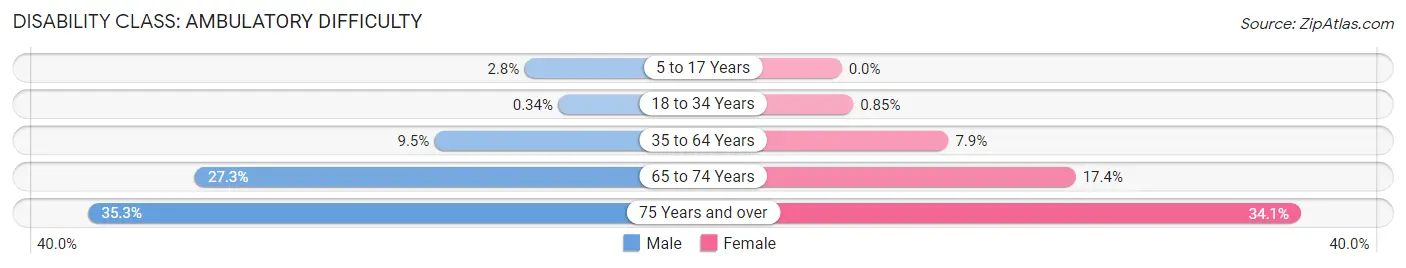
| Age Bracket | Male | Female |
| 5 to 17 Years | 52 (2.8%) | 0 (0.0%) |
| 18 to 34 Years | 9 (0.3%) | 21 (0.9%) |
| 35 to 64 Years | 425 (9.5%) | 342 (7.9%) |
| 65 to 74 Years | 392 (27.3%) | 251 (17.4%) |
| 75 Years and over | 307 (35.2%) | 363 (34.1%) |
Disability Class: Self-Care Difficulty
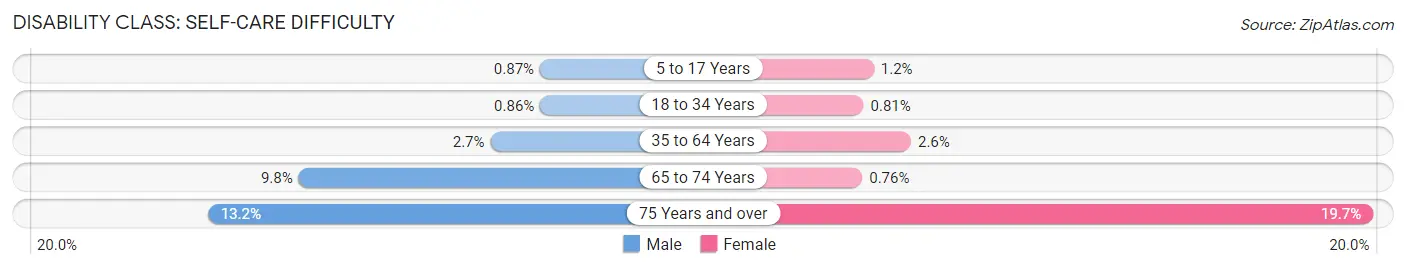
| Age Bracket | Male | Female |
| 5 to 17 Years | 16 (0.9%) | 22 (1.2%) |
| 18 to 34 Years | 23 (0.9%) | 20 (0.8%) |
| 35 to 64 Years | 121 (2.7%) | 111 (2.6%) |
| 65 to 74 Years | 141 (9.8%) | 11 (0.8%) |
| 75 Years and over | 115 (13.2%) | 210 (19.7%) |
Technology Access in Upshur County
Computing Device Access in Upshur County
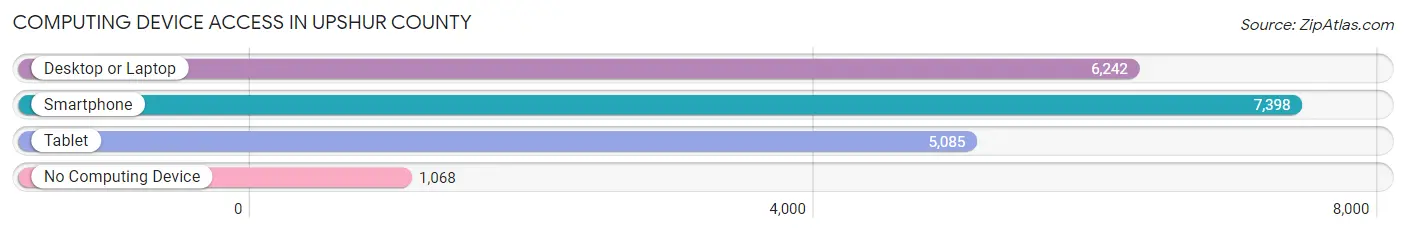
| Device Type | # Households | % Households |
| Desktop or Laptop | 6,242 | 65.4% |
| Smartphone | 7,398 | 77.6% |
| Tablet | 5,085 | 53.3% |
| No Computing Device | 1,068 | 11.2% |
| Total | 9,537 | 100.0% |
Internet Access in Upshur County
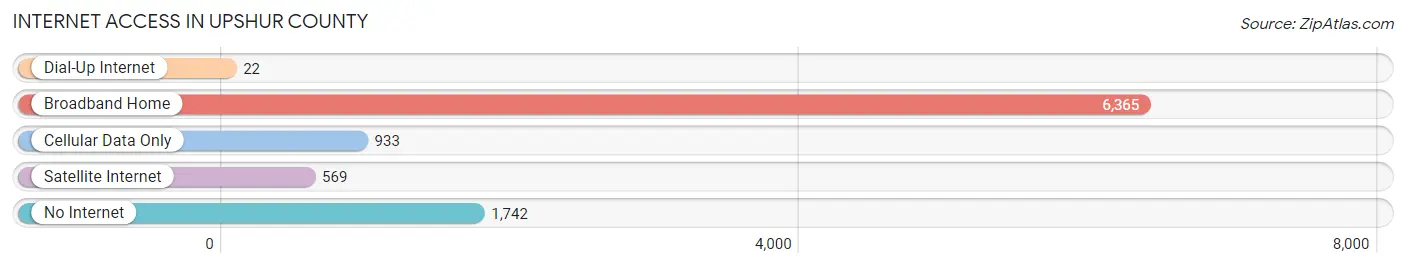
| Internet Type | # Households | % Households |
| Dial-Up Internet | 22 | 0.2% |
| Broadband Home | 6,365 | 66.7% |
| Cellular Data Only | 933 | 9.8% |
| Satellite Internet | 569 | 6.0% |
| No Internet | 1,742 | 18.3% |
| Total | 9,537 | 100.0% |
Upshur County Summary
Upshur County, West Virginia is located in the north-central part of the state, and is bordered by Randolph, Barbour, Lewis, and Webster counties. The county seat is Buckhannon, and the county was created in 1851 from parts of Randolph and Barbour counties. The county has a total area of 437 square miles, and a population of 24,254 as of the 2010 census.
Upshur County was named for Abel Parker Upshur, a prominent lawyer and politician from Virginia who served as Secretary of State under President John Tyler. The county was originally part of the vast holdings of Lord Fairfax, and was settled by German and Scotch-Irish immigrants in the late 1700s. The county was home to several Civil War battles, including the Battle of Buckhannon in 1861.
The geography of Upshur County is mostly mountainous, with the Allegheny Mountains running through the county. The highest point in the county is Spruce Knob, at 4,863 feet. The county is home to several rivers, including the Buckhannon River, the Little Kanawha River, and the Tygart Valley River. The county is also home to several state parks, including Audra State Park, Blackwater Falls State Park, and Watoga State Park.
The economy of Upshur County is largely based on agriculture and timber. The county is home to several large farms, and is the leading producer of apples in the state. The county is also home to several timber companies, and is the leading producer of hardwood lumber in the state. The county is also home to several manufacturing companies, including a paper mill, a furniture factory, and a plastics factory.
The demographics of Upshur County are largely white, with a population that is 97.3% white, 0.7% African American, 0.3% Native American, 0.4% Asian, and 0.3% from other races. The median household income in the county is $37,845, and the median home value is $97,400. The county has a high school graduation rate of 87.3%, and a poverty rate of 16.2%.
Upshur County is a rural county with a rich history and a strong economy. The county is home to several state parks, and is the leading producer of apples and hardwood lumber in the state. The county has a largely white population, with a median household income and home value that are slightly below the state average. The county has a high school graduation rate that is above the state average, and a poverty rate that is slightly below the state average.
Common Questions
What is the Total Population of Upshur County?
Total Population of Upshur County is 23,875.
What is the Total Male Population of Upshur County?
Total Male Population of Upshur County is 12,038.
What is the Total Female Population of Upshur County?
Total Female Population of Upshur County is 11,837.
What is the Ratio of Males per 100 Females in Upshur County?
There are 101.70 Males per 100 Females in Upshur County.
What is the Ratio of Females per 100 Males in Upshur County?
There are 98.33 Females per 100 Males in Upshur County.
What is the Median Population Age in Upshur County?
Median Population Age in Upshur County is 42.0 Years.
What is the Average Family Size in Upshur County
Average Family Size in Upshur County is 2.9 People.
What is the Average Household Size in Upshur County
Average Household Size in Upshur County is 2.4 People.
What is Per Capita Income in Upshur County?
Per Capita income in Upshur County is $28,855.
What is the Median Family Income in Upshur County?
Median Family Income in Upshur County is $64,231.
What is the Median Household income in Upshur County?
Median Household Income in Upshur County is $49,663.
What is Income or Wage Gap in Upshur County?
Income or Wage Gap in Upshur County is 29.7%.
Women in Upshur County earn 70.3 cents for every dollar earned by a man.
What is Family Income Deficit in Upshur County?
Family Income Deficit in Upshur County is $9,801.
Families that are below poverty line in Upshur County earn $9,801 less on average than the poverty threshold level.
What is Inequality or Gini Index in Upshur County?
Inequality or Gini Index in Upshur County is 0.47.
How Large is the Labor Force in Upshur County?
There are 10,151 People in the Labor Forcein in Upshur County.
What is the Percentage of People in the Labor Force in Upshur County?
52.2% of People are in the Labor Force in Upshur County.
What is the Unemployment Rate in Upshur County?
Unemployment Rate in Upshur County is 5.8%.