Tyler County, WV
Tyler County Map

Tyler County Overview
8,336
TOTAL POPULATION
4,173
MALE POPULATION
4,163
FEMALE POPULATION
100.24
MALES / 100 FEMALES
99.76
FEMALES / 100 MALES
48.6
MEDIAN AGE
3.8
AVG FAMILY SIZE
2.8
AVG HOUSEHOLD SIZE
$29,891
PER CAPITA INCOME
$79,181
AVG FAMILY INCOME
$59,167
AVG HOUSEHOLD INCOME
32.1%
WAGE / INCOME GAP [ % ]
67.9¢/ $1
WAGE / INCOME GAP [ $ ]
$10,803
FAMILY INCOME DEFICIT
0.44
INEQUALITY / GINI INDEX
3,162
LABOR FORCE [ PEOPLE ]
45.6%
PERCENT IN LABOR FORCE
4.9%
UNEMPLOYMENT RATE
Tyler County Area Codes
Race in Tyler County
The most populous races in Tyler County are White / Caucasian (8,046 | 96.5%), Two or more Races (228 | 2.7%), and Hispanic or Latino (137 | 1.6%).

| Race | # Population | % Population |
| Asian | 0 | 0.0% |
| Black / African American | 61 | 0.7% |
| Hawaiian / Pacific | 0 | 0.0% |
| Hispanic or Latino | 137 | 1.6% |
| Native / Alaskan | 1 | 0.0% |
| White / Caucasian | 8,046 | 96.5% |
| Two or more Races | 228 | 2.7% |
| Some other Race | 0 | 0.0% |
| Total | 8,336 | 100.0% |
Ancestry in Tyler County
The most populous ancestries reported in Tyler County are English (1,255 | 15.1%), German (1,073 | 12.9%), Irish (849 | 10.2%), American (664 | 8.0%), and French (244 | 2.9%), together accounting for 49.0% of all Tyler County residents.

| Ancestry | # Population | % Population |
| American | 664 | 8.0% |
| Arab | 8 | 0.1% |
| Austrian | 9 | 0.1% |
| Blackfeet | 32 | 0.4% |
| British | 21 | 0.3% |
| Canadian | 7 | 0.1% |
| Cherokee | 22 | 0.3% |
| Choctaw | 1 | 0.0% |
| Croatian | 6 | 0.1% |
| Cuban | 16 | 0.2% |
| Czech | 7 | 0.1% |
| Czechoslovakian | 7 | 0.1% |
| Danish | 9 | 0.1% |
| Dutch | 132 | 1.6% |
| Eastern European | 4 | 0.1% |
| English | 1,255 | 15.1% |
| European | 147 | 1.8% |
| French | 244 | 2.9% |
| German | 1,073 | 12.9% |
| Greek | 3 | 0.0% |
| Irish | 849 | 10.2% |
| Iroquois | 1 | 0.0% |
| Italian | 130 | 1.6% |
| Lebanese | 4 | 0.1% |
| Mexican | 5 | 0.1% |
| Norwegian | 10 | 0.1% |
| Polish | 55 | 0.7% |
| Romanian | 19 | 0.2% |
| Russian | 12 | 0.1% |
| Scandinavian | 20 | 0.2% |
| Scotch-Irish | 143 | 1.7% |
| Scottish | 87 | 1.0% |
| Sioux | 1 | 0.0% |
| Slovene | 59 | 0.7% |
| Spaniard | 16 | 0.2% |
| Spanish | 94 | 1.1% |
| Swedish | 86 | 1.0% |
| Swiss | 28 | 0.3% |
| Welsh | 54 | 0.6% | View All 39 Rows |
Immigrants in Tyler County
The most numerous immigrant groups reported in Tyler County came from Europe (20 | 0.2%), Eastern Europe (17 | 0.2%), Poland (17 | 0.2%), Canada (7 | 0.1%), and Greece (3 | 0.0%), together accounting for 0.8% of all Tyler County residents.

| Immigration Origin | # Population | % Population |
| Canada | 7 | 0.1% |
| Eastern Europe | 17 | 0.2% |
| Europe | 20 | 0.2% |
| Greece | 3 | 0.0% |
| Poland | 17 | 0.2% |
| Southern Europe | 3 | 0.0% | View All 6 Rows |
Sex and Age in Tyler County
Sex and Age in Tyler County
The most populous age groups in Tyler County are 60 to 64 Years (345 | 8.3%) for men and 50 to 54 Years (354 | 8.5%) for women.

| Age Bracket | Male | Female |
| Under 5 Years | 193 (4.6%) | 200 (4.8%) |
| 5 to 9 Years | 197 (4.7%) | 235 (5.6%) |
| 10 to 14 Years | 268 (6.4%) | 203 (4.9%) |
| 15 to 19 Years | 223 (5.3%) | 255 (6.1%) |
| 20 to 24 Years | 215 (5.1%) | 165 (4.0%) |
| 25 to 29 Years | 198 (4.7%) | 209 (5.0%) |
| 30 to 34 Years | 202 (4.8%) | 195 (4.7%) |
| 35 to 39 Years | 144 (3.5%) | 220 (5.3%) |
| 40 to 44 Years | 294 (7.0%) | 188 (4.5%) |
| 45 to 49 Years | 285 (6.8%) | 267 (6.4%) |
| 50 to 54 Years | 327 (7.8%) | 354 (8.5%) |
| 55 to 59 Years | 343 (8.2%) | 321 (7.7%) |
| 60 to 64 Years | 345 (8.3%) | 340 (8.2%) |
| 65 to 69 Years | 283 (6.8%) | 254 (6.1%) |
| 70 to 74 Years | 301 (7.2%) | 306 (7.3%) |
| 75 to 79 Years | 221 (5.3%) | 190 (4.6%) |
| 80 to 84 Years | 102 (2.4%) | 145 (3.5%) |
| 85 Years and over | 32 (0.8%) | 116 (2.8%) |
| Total | 4,173 (100.0%) | 4,163 (100.0%) |
Families and Households in Tyler County
Median Family Size in Tyler County
The median family size in Tyler County is 3.77 persons per family, with single female/mother families (199 | 11.1%) accounting for the largest median family size of 6.15 persons per family. On the other hand, married-couple families (1,491 | 83.3%) represent the smallest median family size with 3.32 persons per family.

| Family Type | # Families | Family Size |
| Married-Couple | 1,491 (83.3%) | 3.32 |
| Single Male/Father | 99 (5.5%) | 5.69 |
| Single Female/Mother | 199 (11.1%) | 6.15 |
| Total Families | 1,789 (100.0%) | 3.77 |
Median Household Size in Tyler County
The median household size in Tyler County is 2.80 persons per household, with single male/father households (99 | 3.4%) accounting for the largest median household size of 6.61 persons per household. non-family households (1,159 | 39.3%) represent the smallest median household size with 1.13 persons per household.

| Household Type | # Households | Household Size |
| Married-Couple | 1,491 (50.6%) | 3.33 |
| Single Male/Father | 99 (3.4%) | 6.61 |
| Single Female/Mother | 199 (6.8%) | 6.59 |
| Non-family | 1,159 (39.3%) | 1.13 |
| Total Households | 2,948 (100.0%) | 2.80 |
Household Size by Marriage Status in Tyler County
Out of a total of 2,948 households in Tyler County, 1,789 (60.7%) are family households, while 1,159 (39.3%) are nonfamily households. The most numerous type of family households are 2-person households, comprising 954, and the most common type of nonfamily households are 1-person households, comprising 1,064.

| Household Size | Family Households | Nonfamily Households |
| 1-Person Households | - | 1,064 (36.1%) |
| 2-Person Households | 954 (32.4%) | 86 (2.9%) |
| 3-Person Households | 233 (7.9%) | 9 (0.3%) |
| 4-Person Households | 413 (14.0%) | 0 (0.0%) |
| 5-Person Households | 133 (4.5%) | 0 (0.0%) |
| 6-Person Households | 34 (1.1%) | 0 (0.0%) |
| 7+ Person Households | 22 (0.7%) | 0 (0.0%) |
| Total | 1,789 (60.7%) | 1,159 (39.3%) |
Female Fertility in Tyler County
Fertility by Age in Tyler County
Average fertility rate in Tyler County is 53.0 births per 1,000 women. Women in the age bracket of 20 to 34 years have the highest fertility rate with 137.0 births per 1,000 women. Women in the age bracket of 20 to 34 years acount for 89.7% of all women with births.

| Age Bracket | Women with Births | Births / 1,000 Women |
| 15 to 19 years | 0 (0.0%) | 0.0 |
| 20 to 34 years | 78 (89.7%) | 137.0 |
| 35 to 50 years | 9 (10.3%) | 11.0 |
| Total | 87 (100.0%) | 53.0 |
Fertility by Age by Marriage Status in Tyler County
56.3% of women with births (87) in Tyler County are married. The highest percentage of unmarried women with births falls into 20 to 34 years age bracket with 48.7% of them unmarried at the time of birth, while the lowest percentage of unmarried women with births belong to 35 to 50 years age bracket with 0.0% of them unmarried.

| Age Bracket | Married | Unmarried |
| 15 to 19 years | 0 (0.0%) | 0 (0.0%) |
| 20 to 34 years | 40 (51.3%) | 38 (48.7%) |
| 35 to 50 years | 9 (100.0%) | 0 (0.0%) |
| Total | 49 (56.3%) | 38 (43.7%) |
Fertility by Education in Tyler County

| Educational Attainment | Women with Births | Births / 1,000 Women |
| Less than High School | 0 (0.0%) | 0.0 |
| High School Diploma | 12 (13.8%) | 22.0 |
| College or Associate's Degree | 41 (47.1%) | 67.0 |
| Bachelor's Degree | 0 (0.0%) | 0.0 |
| Graduate Degree | 34 (39.1%) | 453.0 |
| Total | 87 (100.0%) | 53.0 |
Fertility by Education by Marriage Status in Tyler County
43.7% of women with births in Tyler County are unmarried. Women with the educational attainment of graduate degree are most likely to be married with 100.0% of them married at childbirth, while women with the educational attainment of high school diploma are least likely to be married with 100.0% of them unmarried at childbirth.

| Educational Attainment | Married | Unmarried |
| Less than High School | 0 (0.0%) | 0 (0.0%) |
| High School Diploma | 0 (0.0%) | 12 (100.0%) |
| College or Associate's Degree | 15 (36.6%) | 26 (63.4%) |
| Bachelor's Degree | 0 (0.0%) | 0 (0.0%) |
| Graduate Degree | 34 (100.0%) | 0 (0.0%) |
| Total | 49 (56.3%) | 38 (43.7%) |
Income in Tyler County
Income Overview in Tyler County
Per Capita Income in Tyler County is $29,891, while median incomes of families and households are $79,181 and $59,167 respectively.
| Characteristic | Number | Measure |
| Per Capita Income | 8,336 | $29,891 |
| Median Family Income | 1,789 | $79,181 |
| Mean Family Income | 1,789 | $89,909 |
| Median Household Income | 2,948 | $59,167 |
| Mean Household Income | 2,948 | $73,976 |
| Income Deficit | 1,789 | $10,803 |
| Wage / Income Gap (%) | 8,336 | 32.11% |
| Wage / Income Gap ($) | 8,336 | 67.89¢ per $1 |
| Gini / Inequality Index | 8,336 | 0.44 |
Earnings by Sex in Tyler County
Average Earnings in Tyler County are $29,405, $33,995 for men and $23,079 for women, a difference of 32.1%.

| Sex | Number | Average Earnings |
| Male | 1,823 (54.8%) | $33,995 |
| Female | 1,501 (45.2%) | $23,079 |
| Total | 3,324 (100.0%) | $29,405 |
Earnings by Sex by Income Bracket in Tyler County
The most common earnings brackets in Tyler County are $100,000+ for men (240 | 13.2%) and $45,000 to $49,999 for women (230 | 15.3%).

| Income | Male | Female |
| $2,499 or less | 127 (7.0%) | 79 (5.3%) |
| $2,500 to $4,999 | 91 (5.0%) | 174 (11.6%) |
| $5,000 to $7,499 | 48 (2.6%) | 68 (4.5%) |
| $7,500 to $9,999 | 122 (6.7%) | 45 (3.0%) |
| $10,000 to $12,499 | 14 (0.8%) | 56 (3.7%) |
| $12,500 to $14,999 | 1 (0.1%) | 63 (4.2%) |
| $15,000 to $17,499 | 32 (1.8%) | 61 (4.1%) |
| $17,500 to $19,999 | 37 (2.0%) | 72 (4.8%) |
| $20,000 to $22,499 | 174 (9.5%) | 123 (8.2%) |
| $22,500 to $24,999 | 102 (5.6%) | 41 (2.7%) |
| $25,000 to $29,999 | 79 (4.3%) | 68 (4.5%) |
| $30,000 to $34,999 | 103 (5.7%) | 63 (4.2%) |
| $35,000 to $39,999 | 29 (1.6%) | 31 (2.1%) |
| $40,000 to $44,999 | 56 (3.1%) | 71 (4.7%) |
| $45,000 to $49,999 | 74 (4.1%) | 230 (15.3%) |
| $50,000 to $54,999 | 53 (2.9%) | 78 (5.2%) |
| $55,000 to $64,999 | 135 (7.4%) | 62 (4.1%) |
| $65,000 to $74,999 | 133 (7.3%) | 16 (1.1%) |
| $75,000 to $99,999 | 173 (9.5%) | 69 (4.6%) |
| $100,000+ | 240 (13.2%) | 31 (2.1%) |
| Total | 1,823 (100.0%) | 1,501 (100.0%) |
Earnings by Sex by Educational Attainment in Tyler County
Average earnings in Tyler County are $44,813 for men and $28,092 for women, a difference of 37.3%. Men with an educational attainment of bachelor's degree enjoy the highest average annual earnings of $86,316, while those with high school diploma education earn the least with $32,391. Women with an educational attainment of graduate degree earn the most with the average annual earnings of $53,875, while those with less than high school education have the smallest earnings of $3,918.

| Educational Attainment | Male Income | Female Income |
| Less than High School | $41,250 | $3,918 |
| High School Diploma | $32,391 | $21,045 |
| College or Associate's Degree | $67,500 | $28,158 |
| Bachelor's Degree | $86,316 | $46,354 |
| Graduate Degree | - | - |
| Total | $44,813 | $28,092 |
Family Income in Tyler County
Family Income Brackets in Tyler County
According to the Tyler County family income data, there are 537 families falling into the $100,000 to $149,999 income range, which is the most common income bracket and makes up 30.0% of all families. Conversely, the $10,000 to $14,999 income bracket is the least frequent group with only 18 families (1.0%) belonging to this category.

| Income Bracket | # Families | % Families |
| Less than $10,000 | 73 | 4.1% |
| $10,000 to $14,999 | 18 | 1.0% |
| $15,000 to $24,999 | 63 | 3.5% |
| $25,000 to $34,999 | 148 | 8.3% |
| $35,000 to $49,999 | 174 | 9.7% |
| $50,000 to $74,999 | 342 | 19.1% |
| $75,000 to $99,999 | 263 | 14.7% |
| $100,000 to $149,999 | 537 | 30.0% |
| $150,000 to $199,999 | 113 | 6.3% |
| $200,000+ | 57 | 3.2% |
Family Income by Famaliy Size in Tyler County
7+ person families (22 | 1.2%) account for the highest median family income in Tyler County with $100,000 per family, while 2-person families (963 | 53.8%) have the highest median income of $35,108 per family member.

| Income Bracket | # Families | Median Income |
| 2-Person Families | 963 (53.8%) | $70,216 |
| 3-Person Families | 327 (18.3%) | $86,875 |
| 4-Person Families | 370 (20.7%) | $93,750 |
| 5-Person Families | 102 (5.7%) | $0 |
| 6-Person Families | 5 (0.3%) | $76,250 |
| 7+ Person Families | 22 (1.2%) | $100,000 |
| Total | 1,789 (100.0%) | $79,181 |
Family Income by Number of Earners in Tyler County
The median family income in Tyler County is $79,181, with families comprising 3+ earners (165) having the highest median family income of $129,612, while families with no earners (564) have the lowest median family income of $55,192, accounting for 9.2% and 31.5% of families, respectively.

| Number of Earners | # Families | Median Income |
| No Earners | 564 (31.5%) | $55,192 |
| 1 Earner | 545 (30.5%) | $63,162 |
| 2 Earners | 515 (28.8%) | $107,981 |
| 3+ Earners | 165 (9.2%) | $129,612 |
| Total | 1,789 (100.0%) | $79,181 |
Household Income in Tyler County
Household Income Brackets in Tyler County
With 554 households falling in the category, the $100,000 to $149,999 income range is the most frequent in Tyler County, accounting for 18.8% of all households. In contrast, only 85 households (2.9%) fall into the $200,000+ income bracket, making it the least populous group.

| Income Bracket | # Households | % Households |
| Less than $10,000 | 209 | 7.1% |
| $10,000 to $14,999 | 209 | 7.1% |
| $15,000 to $24,999 | 177 | 6.0% |
| $25,000 to $34,999 | 336 | 11.4% |
| $35,000 to $49,999 | 301 | 10.2% |
| $50,000 to $74,999 | 534 | 18.1% |
| $75,000 to $99,999 | 398 | 13.5% |
| $100,000 to $149,999 | 554 | 18.8% |
| $150,000 to $199,999 | 144 | 4.9% |
| $200,000+ | 85 | 2.9% |
Household Income by Householder Age in Tyler County
The median household income in Tyler County is $59,167, with the highest median household income of $71,550 found in the 25 to 44 years age bracket for the primary householder. A total of 421 households (14.3%) fall into this category. Meanwhile, the 15 to 24 years age bracket for the primary householder has the lowest median household income of $0, with 11 households (0.4%) in this group.

| Income Bracket | # Households | Median Income |
| 15 to 24 Years | 11 (0.4%) | $0 |
| 25 to 44 Years | 421 (14.3%) | $71,550 |
| 45 to 64 Years | 1,347 (45.7%) | $64,934 |
| 65+ Years | 1,169 (39.7%) | $50,996 |
| Total | 2,948 (100.0%) | $59,167 |
Poverty in Tyler County
Income Below Poverty by Sex and Age in Tyler County
With 9.8% poverty level for males and 14.3% for females among the residents of Tyler County, 25 to 34 year old males and 5 year old females are the most vulnerable to poverty, with 88 males (22.0%) and 12 females (54.5%) in their respective age groups living below the poverty level.

| Age Bracket | Male | Female |
| Under 5 Years | 28 (20.7%) | 26 (13.0%) |
| 5 Years | 9 (15.5%) | 12 (54.5%) |
| 6 to 11 Years | 38 (19.3%) | 62 (20.9%) |
| 12 to 14 Years | 0 (0.0%) | 2 (1.7%) |
| 15 Years | 0 (0.0%) | 11 (40.7%) |
| 16 and 17 Years | 0 (0.0%) | 12 (10.5%) |
| 18 to 24 Years | 28 (9.5%) | 74 (26.5%) |
| 25 to 34 Years | 88 (22.0%) | 24 (5.9%) |
| 35 to 44 Years | 21 (4.8%) | 23 (5.6%) |
| 45 to 54 Years | 62 (10.2%) | 132 (21.4%) |
| 55 to 64 Years | 80 (11.7%) | 91 (13.9%) |
| 65 to 74 Years | 25 (4.4%) | 78 (14.3%) |
| 75 Years and over | 19 (5.6%) | 41 (9.5%) |
| Total | 398 (9.8%) | 588 (14.3%) |
Income Above Poverty by Sex and Age in Tyler County
According to the poverty statistics in Tyler County, males aged 12 to 14 years and females aged 12 to 14 years are the age groups that are most secure financially, with 100.0% of males and 98.3% of females in these age groups living above the poverty line.

| Age Bracket | Male | Female |
| Under 5 Years | 107 (79.3%) | 174 (87.0%) |
| 5 Years | 49 (84.5%) | 10 (45.5%) |
| 6 to 11 Years | 159 (80.7%) | 235 (79.1%) |
| 12 to 14 Years | 210 (100.0%) | 117 (98.3%) |
| 15 Years | 78 (100.0%) | 16 (59.3%) |
| 16 and 17 Years | 65 (100.0%) | 102 (89.5%) |
| 18 to 24 Years | 267 (90.5%) | 205 (73.5%) |
| 25 to 34 Years | 312 (78.0%) | 380 (94.1%) |
| 35 to 44 Years | 417 (95.2%) | 385 (94.4%) |
| 45 to 54 Years | 546 (89.8%) | 484 (78.6%) |
| 55 to 64 Years | 603 (88.3%) | 565 (86.1%) |
| 65 to 74 Years | 548 (95.6%) | 468 (85.7%) |
| 75 Years and over | 322 (94.4%) | 390 (90.5%) |
| Total | 3,683 (90.2%) | 3,531 (85.7%) |
Income Below Poverty Among Married-Couple Families in Tyler County
The poverty statistics for married-couple families in Tyler County show that 6.0% or 90 of the total 1,491 families live below the poverty line. Families with 1 or 2 children have the highest poverty rate of 6.8%, comprising of 27 families. On the other hand, families with 5 or more children have the lowest poverty rate of 0.0%, which includes 0 families.

| Children | Above Poverty | Below Poverty |
| No Children | 964 (94.0%) | 62 (6.0%) |
| 1 or 2 Children | 371 (93.2%) | 27 (6.8%) |
| 3 or 4 Children | 62 (98.4%) | 1 (1.6%) |
| 5 or more Children | 4 (100.0%) | 0 (0.0%) |
| Total | 1,401 (94.0%) | 90 (6.0%) |
Income Below Poverty Among Single-Parent Households in Tyler County
According to the poverty data in Tyler County, 13.1% or 13 single-father households and 14.6% or 29 single-mother households are living below the poverty line. Among single-father households, those with 1 or 2 children have the highest poverty rate, with 5 households (41.7%) experiencing poverty. Likewise, among single-mother households, those with 1 or 2 children have the highest poverty rate, with 23 households (26.1%) falling below the poverty line.

| Children | Single Father | Single Mother |
| No Children | 7 (9.0%) | 6 (6.7%) |
| 1 or 2 Children | 5 (41.7%) | 23 (26.1%) |
| 3 or 4 Children | 1 (11.1%) | 0 (0.0%) |
| 5 or more Children | 0 (0.0%) | 0 (0.0%) |
| Total | 13 (13.1%) | 29 (14.6%) |
Income Below Poverty Among Married-Couple vs Single-Parent Households in Tyler County
The poverty data for Tyler County shows that 90 of the married-couple family households (6.0%) and 42 of the single-parent households (14.1%) are living below the poverty level. Within the married-couple family households, those with 1 or 2 children have the highest poverty rate, with 27 households (6.8%) falling below the poverty line. Among the single-parent households, those with 1 or 2 children have the highest poverty rate, with 28 household (28.0%) living below poverty.

| Children | Married-Couple Families | Single-Parent Households |
| No Children | 62 (6.0%) | 13 (7.7%) |
| 1 or 2 Children | 27 (6.8%) | 28 (28.0%) |
| 3 or 4 Children | 1 (1.6%) | 1 (3.3%) |
| 5 or more Children | 0 (0.0%) | 0 (0.0%) |
| Total | 90 (6.0%) | 42 (14.1%) |
Employment Characteristics in Tyler County
Employment by Class of Employer in Tyler County
Among the 2,925 employed individuals in Tyler County, private company employees (1,843 | 63.0%), local government employees (469 | 16.0%), and not-for-profit organizations (220 | 7.5%) make up the most common classes of employment.

| Employer Class | # Employees | % Employees |
| Private Company Employees | 1,843 | 63.0% |
| Self-Employed (Incorporated) | 2 | 0.1% |
| Self-Employed (Not Incorporated) | 101 | 3.5% |
| Not-for-profit Organizations | 220 | 7.5% |
| Local Government Employees | 469 | 16.0% |
| State Government Employees | 181 | 6.2% |
| Federal Government Employees | 102 | 3.5% |
| Unpaid Family Workers | 7 | 0.2% |
| Total | 2,925 | 100.0% |
Employment Status by Age in Tyler County
According to the labor force statistics for Tyler County, out of the total population over 16 years of age (6,935), 45.6% or 3,162 individuals are in the labor force, with 4.9% or 155 of them unemployed. The age group with the highest labor force participation rate is 25 to 29 years, with 84.8% or 345 individuals in the labor force. Within the labor force, the 16 to 19 years age range has the highest percentage of unemployed individuals, with 12.7% or 21 of them being unemployed.

| Age Bracket | In Labor Force | Unemployed |
| 16 to 19 Years | 166 (44.5%) | 21 (12.7%) |
| 20 to 24 Years | 231 (60.8%) | 16 (6.9%) |
| 25 to 29 Years | 345 (84.8%) | 13 (3.8%) |
| 30 to 34 Years | 273 (68.8%) | 4 (1.5%) |
| 35 to 44 Years | 705 (83.3%) | 59 (8.4%) |
| 45 to 54 Years | 588 (47.7%) | 23 (3.9%) |
| 55 to 59 Years | 452 (68.1%) | 10 (2.2%) |
| 60 to 64 Years | 276 (40.3%) | 10 (3.6%) |
| 65 to 74 Years | 98 (8.6%) | 0 (0.0%) |
| 75 Years and over | 30 (3.7%) | 0 (0.0%) |
| Total | 3,162 (45.6%) | 155 (4.9%) |
Employment Status by Educational Attainment in Tyler County
According to labor force statistics for Tyler County, 62.4% of individuals (2,641) out of the total population between 25 and 64 years of age (4,232) are in the labor force, with 4.5% or 119 of them being unemployed. The group with the highest labor force participation rate are those with the educational attainment of bachelor's degree or higher, with 78.3% or 516 individuals in the labor force. Within the labor force, individuals with less than high school education have the highest percentage of unemployment, with 10.2% or 15 of them being unemployed.

| Educational Attainment | In Labor Force | Unemployed |
| Less than High School | 147 (51.8%) | 29 (10.2%) |
| High School Diploma | 1,202 (60.6%) | 97 (4.9%) |
| College / Associate Degree | 774 (59.3%) | 76 (5.8%) |
| Bachelor's Degree or higher | 516 (78.3%) | 0 (0.0%) |
| Total | 2,641 (62.4%) | 190 (4.5%) |
Employment Occupations by Sex in Tyler County
Management, Business, Science and Arts Occupations
The most common Management, Business, Science and Arts occupations in Tyler County are Community & Social Service (359 | 11.9%), Education Instruction & Library (299 | 9.9%), Health Diagnosing & Treating (274 | 9.1%), Management (147 | 4.9%), and Health Technologists (91 | 3.0%).

Management, Business, Science and Arts Occupations by Sex
Within the Management, Business, Science and Arts occupations in Tyler County, the most male-oriented occupations are Architecture & Engineering (100.0%), Computers, Engineering & Science (73.8%), and Management (53.7%), while the most female-oriented occupations are Health Diagnosing & Treating (100.0%), Health Technologists (100.0%), and Education, Arts & Media (90.0%).

| Occupation | Male | Female |
| Management | 79 (53.7%) | 68 (46.3%) |
| Business & Financial | 8 (11.4%) | 62 (88.6%) |
| Computers, Engineering & Science | 31 (73.8%) | 11 (26.2%) |
| Computers & Mathematics | 7 (38.9%) | 11 (61.1%) |
| Architecture & Engineering | 24 (100.0%) | 0 (0.0%) |
| Life, Physical & Social Science | 0 (0.0%) | 0 (0.0%) |
| Community & Social Service | 61 (17.0%) | 298 (83.0%) |
| Education, Arts & Media | 2 (10.0%) | 18 (90.0%) |
| Legal Services & Support | 11 (45.8%) | 13 (54.2%) |
| Education Instruction & Library | 44 (14.7%) | 255 (85.3%) |
| Arts, Media & Entertainment | 4 (25.0%) | 12 (75.0%) |
| Health Diagnosing & Treating | 0 (0.0%) | 274 (100.0%) |
| Health Technologists | 0 (0.0%) | 91 (100.0%) |
| Total (Category) | 179 (20.1%) | 713 (79.9%) |
| Total (Overall) | 1,596 (53.1%) | 1,412 (46.9%) |
Services Occupations
The most common Services occupations in Tyler County are Healthcare Support (290 | 9.6%), Food Preparation & Serving (83 | 2.8%), Cleaning & Maintenance (69 | 2.3%), Security & Protection (54 | 1.8%), and Law Enforcement (49 | 1.6%).
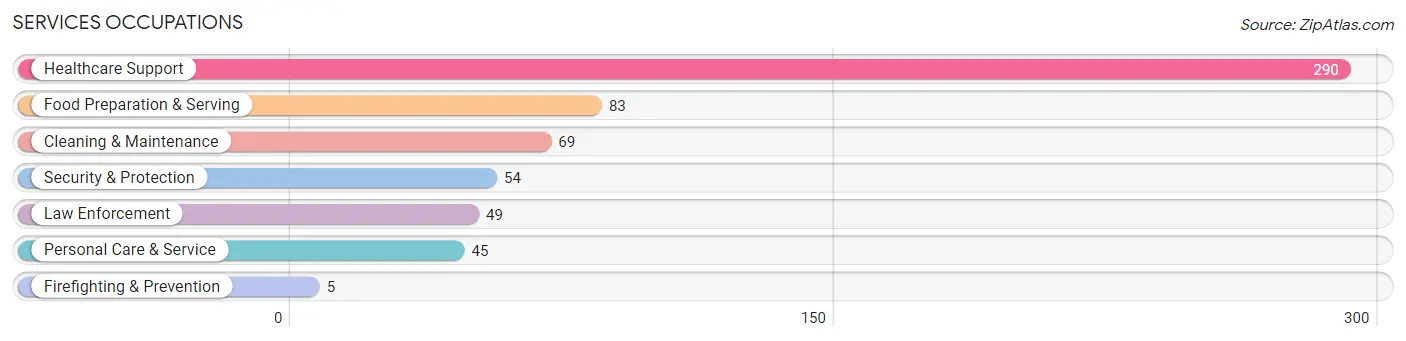
Services Occupations by Sex
Within the Services occupations in Tyler County, the most male-oriented occupations are Security & Protection (100.0%), Firefighting & Prevention (100.0%), and Law Enforcement (100.0%), while the most female-oriented occupations are Food Preparation & Serving (98.8%), Personal Care & Service (97.8%), and Healthcare Support (93.8%).

| Occupation | Male | Female |
| Healthcare Support | 18 (6.2%) | 272 (93.8%) |
| Security & Protection | 54 (100.0%) | 0 (0.0%) |
| Firefighting & Prevention | 5 (100.0%) | 0 (0.0%) |
| Law Enforcement | 49 (100.0%) | 0 (0.0%) |
| Food Preparation & Serving | 1 (1.2%) | 82 (98.8%) |
| Cleaning & Maintenance | 41 (59.4%) | 28 (40.6%) |
| Personal Care & Service | 1 (2.2%) | 44 (97.8%) |
| Total (Category) | 115 (21.3%) | 426 (78.7%) |
| Total (Overall) | 1,596 (53.1%) | 1,412 (46.9%) |
Sales and Office Occupations
The most common Sales and Office occupations in Tyler County are Sales & Related (261 | 8.7%), and Office & Administration (216 | 7.2%).

Sales and Office Occupations by Sex

| Occupation | Male | Female |
| Sales & Related | 182 (69.7%) | 79 (30.3%) |
| Office & Administration | 101 (46.8%) | 115 (53.2%) |
| Total (Category) | 283 (59.3%) | 194 (40.7%) |
| Total (Overall) | 1,596 (53.1%) | 1,412 (46.9%) |
Natural Resources, Construction and Maintenance Occupations
The most common Natural Resources, Construction and Maintenance occupations in Tyler County are Construction & Extraction (305 | 10.1%), Installation, Maintenance & Repair (149 | 5.0%), and Farming, Fishing & Forestry (32 | 1.1%).

Natural Resources, Construction and Maintenance Occupations by Sex

| Occupation | Male | Female |
| Farming, Fishing & Forestry | 32 (100.0%) | 0 (0.0%) |
| Construction & Extraction | 304 (99.7%) | 1 (0.3%) |
| Installation, Maintenance & Repair | 147 (98.7%) | 2 (1.3%) |
| Total (Category) | 483 (99.4%) | 3 (0.6%) |
| Total (Overall) | 1,596 (53.1%) | 1,412 (46.9%) |
Production, Transportation and Moving Occupations
The most common Production, Transportation and Moving occupations in Tyler County are Transportation (267 | 8.9%), Production (248 | 8.2%), and Material Moving (97 | 3.2%).

Production, Transportation and Moving Occupations by Sex

| Occupation | Male | Female |
| Production | 198 (79.8%) | 50 (20.2%) |
| Transportation | 251 (94.0%) | 16 (6.0%) |
| Material Moving | 87 (89.7%) | 10 (10.3%) |
| Total (Category) | 536 (87.6%) | 76 (12.4%) |
| Total (Overall) | 1,596 (53.1%) | 1,412 (46.9%) |
Employment Industries by Sex in Tyler County
Employment Industries in Tyler County
The major employment industries in Tyler County include Health Care & Social Assistance (608 | 20.2%), Educational Services (393 | 13.1%), Retail Trade (311 | 10.3%), Manufacturing (306 | 10.2%), and Transportation & Warehousing (269 | 8.9%).

Employment Industries by Sex in Tyler County
The Tyler County industries that see more men than women are Agriculture, Fishing & Hunting (100.0%), Wholesale Trade (100.0%), and Utilities (100.0%), whereas the industries that tend to have a higher number of women are Professional & Scientific (92.0%), Health Care & Social Assistance (90.5%), and Educational Services (83.0%).
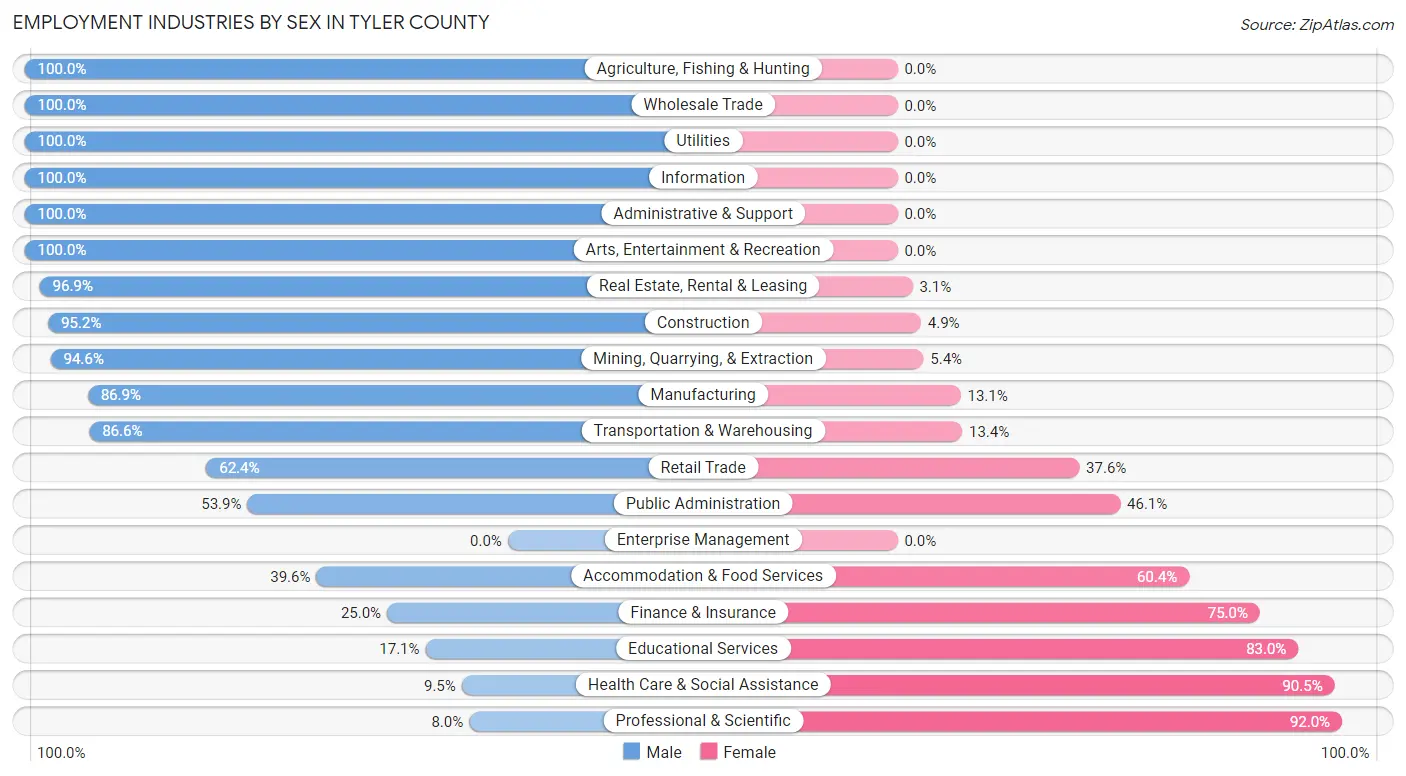
| Industry | Male | Female |
| Agriculture, Fishing & Hunting | 32 (100.0%) | 0 (0.0%) |
| Mining, Quarrying, & Extraction | 194 (94.6%) | 11 (5.4%) |
| Construction | 157 (95.2%) | 8 (4.9%) |
| Manufacturing | 266 (86.9%) | 40 (13.1%) |
| Wholesale Trade | 17 (100.0%) | 0 (0.0%) |
| Retail Trade | 194 (62.4%) | 117 (37.6%) |
| Transportation & Warehousing | 233 (86.6%) | 36 (13.4%) |
| Utilities | 51 (100.0%) | 0 (0.0%) |
| Information | 41 (100.0%) | 0 (0.0%) |
| Finance & Insurance | 12 (25.0%) | 36 (75.0%) |
| Real Estate, Rental & Leasing | 31 (96.9%) | 1 (3.1%) |
| Professional & Scientific | 8 (8.0%) | 92 (92.0%) |
| Enterprise Management | 0 (0.0%) | 0 (0.0%) |
| Administrative & Support | 18 (100.0%) | 0 (0.0%) |
| Educational Services | 67 (17.1%) | 326 (83.0%) |
| Health Care & Social Assistance | 58 (9.5%) | 550 (90.5%) |
| Arts, Entertainment & Recreation | 48 (100.0%) | 0 (0.0%) |
| Accommodation & Food Services | 42 (39.6%) | 64 (60.4%) |
| Public Administration | 69 (53.9%) | 59 (46.1%) |
| Total | 1,596 (53.1%) | 1,412 (46.9%) |
Education in Tyler County
School Enrollment in Tyler County
The most common levels of schooling among the 1,467 students in Tyler County are high school (433 | 29.5%), middle school (323 | 22.0%), and elementary school (289 | 19.7%).

| School Level | # Students | % Students |
| Nursery / Preschool | 25 | 1.7% |
| Kindergarten | 112 | 7.6% |
| Elementary School | 289 | 19.7% |
| Middle School | 323 | 22.0% |
| High School | 433 | 29.5% |
| College / Undergraduate | 253 | 17.2% |
| Graduate / Professional | 32 | 2.2% |
| Total | 1,467 | 100.0% |
School Enrollment by Age by Funding Source in Tyler County
Out of a total of 1,467 students who are enrolled in schools in Tyler County, 29 (2.0%) attend a private institution, while the remaining 1,438 (98.0%) are enrolled in public schools. The age group of 35 years and over has the highest likelihood of being enrolled in private schools, with 4 (30.8% in the age bracket) enrolled. Conversely, the age group of 3 to 4 year olds has the lowest likelihood of being enrolled in a private school, with 35 (100.0% in the age bracket) attending a public institution.

| Age Bracket | Public School | Private School |
| 3 to 4 Year Olds | 35 (100.0%) | 0 (0.0%) |
| 5 to 9 Year Old | 368 (99.5%) | 2 (0.5%) |
| 10 to 14 Year Olds | 462 (100.0%) | 0 (0.0%) |
| 15 to 17 Year Olds | 259 (98.9%) | 3 (1.1%) |
| 18 to 19 Year Olds | 130 (100.0%) | 0 (0.0%) |
| 20 to 24 Year Olds | 68 (97.1%) | 2 (2.9%) |
| 25 to 34 Year Olds | 106 (84.8%) | 19 (15.2%) |
| 35 Years and over | 9 (69.2%) | 4 (30.8%) |
| Total | 1,438 (98.0%) | 29 (2.0%) |
Educational Attainment by Field of Study in Tyler County
Education (284 | 25.1%), science & technology (148 | 13.1%), liberal arts & history (123 | 10.9%), arts & humanities (109 | 9.6%), and bio, nature & agricultural (107 | 9.5%) are the most common fields of study among 1,132 individuals in Tyler County who have obtained a bachelor's degree or higher.

| Field of Study | # Graduates | % Graduates |
| Computers & Mathematics | 32 | 2.8% |
| Bio, Nature & Agricultural | 107 | 9.5% |
| Physical & Health Sciences | 29 | 2.6% |
| Psychology | 55 | 4.9% |
| Social Sciences | 18 | 1.6% |
| Engineering | 51 | 4.5% |
| Multidisciplinary Studies | 0 | 0.0% |
| Science & Technology | 148 | 13.1% |
| Business | 104 | 9.2% |
| Education | 284 | 25.1% |
| Literature & Languages | 29 | 2.6% |
| Liberal Arts & History | 123 | 10.9% |
| Visual & Performing Arts | 40 | 3.5% |
| Communications | 3 | 0.3% |
| Arts & Humanities | 109 | 9.6% |
| Total | 1,132 | 100.0% |
Transportation & Commute in Tyler County
Vehicle Availability by Sex in Tyler County
The most prevalent vehicle ownership categories in Tyler County are males with 3 vehicles (694, accounting for 44.5%) and females with 3 vehicles (606, making up 50.9%).

| Vehicles Available | Male | Female |
| No Vehicle | 2 (0.1%) | 3 (0.2%) |
| 1 Vehicle | 156 (10.0%) | 187 (13.7%) |
| 2 Vehicles | 506 (32.4%) | 406 (29.8%) |
| 3 Vehicles | 694 (44.5%) | 606 (44.4%) |
| 4 Vehicles | 178 (11.4%) | 162 (11.9%) |
| 5 or more Vehicles | 25 (1.6%) | 0 (0.0%) |
| Total | 1,561 (100.0%) | 1,364 (100.0%) |
Commute Time in Tyler County
The most frequently occuring commute durations in Tyler County are 30 to 34 minutes (460 commuters, 16.3%), 45 to 59 minutes (294 commuters, 10.4%), and 15 to 19 minutes (286 commuters, 10.1%).

| Commute Time | # Commuters | % Commuters |
| Less than 5 Minutes | 88 | 3.1% |
| 5 to 9 Minutes | 247 | 8.7% |
| 10 to 14 Minutes | 227 | 8.0% |
| 15 to 19 Minutes | 286 | 10.1% |
| 20 to 24 Minutes | 286 | 10.1% |
| 25 to 29 Minutes | 151 | 5.3% |
| 30 to 34 Minutes | 460 | 16.3% |
| 35 to 39 Minutes | 217 | 7.7% |
| 40 to 44 Minutes | 152 | 5.4% |
| 45 to 59 Minutes | 294 | 10.4% |
| 60 to 89 Minutes | 167 | 5.9% |
| 90 or more Minutes | 255 | 9.0% |
Commute Time by Sex in Tyler County
The most common commute times in Tyler County are 45 to 59 minutes (251 commuters, 16.6%) for males and 30 to 34 minutes (248 commuters, 18.9%) for females.

| Commute Time | Male | Female |
| Less than 5 Minutes | 33 (2.2%) | 55 (4.2%) |
| 5 to 9 Minutes | 84 (5.5%) | 163 (12.4%) |
| 10 to 14 Minutes | 81 (5.3%) | 146 (11.1%) |
| 15 to 19 Minutes | 162 (10.7%) | 124 (9.4%) |
| 20 to 24 Minutes | 111 (7.3%) | 175 (13.3%) |
| 25 to 29 Minutes | 105 (6.9%) | 46 (3.5%) |
| 30 to 34 Minutes | 212 (14.0%) | 248 (18.9%) |
| 35 to 39 Minutes | 56 (3.7%) | 161 (12.3%) |
| 40 to 44 Minutes | 84 (5.5%) | 68 (5.2%) |
| 45 to 59 Minutes | 251 (16.6%) | 43 (3.3%) |
| 60 to 89 Minutes | 112 (7.4%) | 55 (4.2%) |
| 90 or more Minutes | 226 (14.9%) | 29 (2.2%) |
Time of Departure to Work by Sex in Tyler County
The most frequent times of departure to work in Tyler County are 12:00 PM to 3:59 PM (235, 15.5%) for males and 7:00 AM to 7:29 AM (254, 19.4%) for females.

| Time of Departure | Male | Female |
| 12:00 AM to 4:59 AM | 120 (7.9%) | 8 (0.6%) |
| 5:00 AM to 5:29 AM | 186 (12.3%) | 89 (6.8%) |
| 5:30 AM to 5:59 AM | 183 (12.1%) | 68 (5.2%) |
| 6:00 AM to 6:29 AM | 188 (12.4%) | 103 (7.8%) |
| 6:30 AM to 6:59 AM | 166 (10.9%) | 215 (16.4%) |
| 7:00 AM to 7:29 AM | 170 (11.2%) | 254 (19.4%) |
| 7:30 AM to 7:59 AM | 95 (6.3%) | 181 (13.8%) |
| 8:00 AM to 8:29 AM | 65 (4.3%) | 141 (10.7%) |
| 8:30 AM to 8:59 AM | 16 (1.1%) | 45 (3.4%) |
| 9:00 AM to 9:59 AM | 4 (0.3%) | 25 (1.9%) |
| 10:00 AM to 10:59 AM | 0 (0.0%) | 38 (2.9%) |
| 11:00 AM to 11:59 AM | 0 (0.0%) | 8 (0.6%) |
| 12:00 PM to 3:59 PM | 235 (15.5%) | 72 (5.5%) |
| 4:00 PM to 11:59 PM | 89 (5.9%) | 66 (5.0%) |
| Total | 1,517 (100.0%) | 1,313 (100.0%) |
Housing Occupancy in Tyler County
Occupancy by Ownership in Tyler County
Of the total 2,948 dwellings in Tyler County, owner-occupied units account for 2,614 (88.7%), while renter-occupied units make up 334 (11.3%).

| Occupancy | # Housing Units | % Housing Units |
| Owner Occupied Housing Units | 2,614 | 88.7% |
| Renter-Occupied Housing Units | 334 | 11.3% |
| Total Occupied Housing Units | 2,948 | 100.0% |
Occupancy by Household Size in Tyler County

| Household Size | # Housing Units | % Housing Units |
| 1-Person Household | 1,064 | 36.1% |
| 2-Person Household | 1,040 | 35.3% |
| 3-Person Household | 242 | 8.2% |
| 4+ Person Household | 602 | 20.4% |
| Total Housing Units | 2,948 | 100.0% |
Occupancy by Ownership by Household Size in Tyler County

| Household Size | Owner-occupied | Renter-occupied |
| 1-Person Household | 909 (85.4%) | 155 (14.6%) |
| 2-Person Household | 945 (90.9%) | 95 (9.1%) |
| 3-Person Household | 216 (89.3%) | 26 (10.7%) |
| 4+ Person Household | 544 (90.4%) | 58 (9.6%) |
| Total Housing Units | 2,614 (88.7%) | 334 (11.3%) |
Occupancy by Educational Attainment in Tyler County

| Household Size | Owner-occupied | Renter-occupied |
| Less than High School | 182 (79.1%) | 48 (20.9%) |
| High School Diploma | 1,227 (90.5%) | 128 (9.5%) |
| College/Associate Degree | 792 (87.5%) | 113 (12.5%) |
| Bachelor's Degree or higher | 413 (90.2%) | 45 (9.8%) |
Occupancy by Age of Householder in Tyler County

| Age Bracket | # Households | % Households |
| Under 35 Years | 179 | 6.1% |
| 35 to 44 Years | 253 | 8.6% |
| 45 to 54 Years | 593 | 20.1% |
| 55 to 64 Years | 754 | 25.6% |
| 65 to 74 Years | 731 | 24.8% |
| 75 to 84 Years | 348 | 11.8% |
| 85 Years and Over | 90 | 3.0% |
| Total | 2,948 | 100.0% |
Housing Finances in Tyler County
Median Income by Occupancy in Tyler County

| Occupancy Type | # Households | Median Income |
| Owner-Occupied | 2,614 (88.7%) | $65,850 |
| Renter-Occupied | 334 (11.3%) | $26,563 |
| Average | 2,948 (100.0%) | $59,167 |
Occupancy by Householder Income Bracket in Tyler County

| Income Bracket | Owner-occupied | Renter-occupied |
| Less than $5,000 | 124 (4.7%) | 18 (5.4%) |
| $5,000 to $9,999 | 38 (1.5%) | 29 (8.7%) |
| $10,000 to $14,999 | 132 (5.1%) | 77 (23.1%) |
| $15,000 to $19,999 | 94 (3.6%) | 27 (8.1%) |
| $20,000 to $24,999 | 44 (1.7%) | 11 (3.3%) |
| $25,000 to $34,999 | 299 (11.4%) | 37 (11.1%) |
| $35,000 to $49,999 | 242 (9.3%) | 60 (18.0%) |
| $50,000 to $74,999 | 489 (18.7%) | 46 (13.8%) |
| $75,000 to $99,999 | 368 (14.1%) | 29 (8.7%) |
| $100,000 to $149,999 | 554 (21.2%) | 0 (0.0%) |
| $150,000 or more | 230 (8.8%) | 0 (0.0%) |
| Total | 2,614 (100.0%) | 334 (100.0%) |
Monthly Housing Cost Tiers in Tyler County

| Monthly Cost | Owner-occupied | Renter-occupied |
| Less than $300 | 686 (26.2%) | 41 (12.3%) |
| $300 to $499 | 933 (35.7%) | 35 (10.5%) |
| $500 to $799 | 367 (14.0%) | 73 (21.9%) |
| $800 to $999 | 228 (8.7%) | 40 (12.0%) |
| $1,000 to $1,499 | 243 (9.3%) | 33 (9.9%) |
| $1,500 to $1,999 | 95 (3.6%) | 0 (0.0%) |
| $2,000 to $2,499 | 51 (1.9%) | 0 (0.0%) |
| $2,500 to $2,999 | 2 (0.1%) | 0 (0.0%) |
| $3,000 or more | 9 (0.3%) | 0 (0.0%) |
| Total | 2,614 (100.0%) | 334 (100.0%) |
Physical Housing Characteristics in Tyler County
Housing Structures in Tyler County

| Structure Type | # Housing Units | % Housing Units |
| Single Unit, Detached | 2,433 | 82.5% |
| Single Unit, Attached | 59 | 2.0% |
| 2 Unit Apartments | 12 | 0.4% |
| 3 or 4 Unit Apartments | 9 | 0.3% |
| 5 to 9 Unit Apartments | 25 | 0.9% |
| 10 or more Apartments | 37 | 1.3% |
| Mobile Home / Other | 373 | 12.7% |
| Total | 2,948 | 100.0% |
Housing Structures by Occupancy in Tyler County

| Structure Type | Owner-occupied | Renter-occupied |
| Single Unit, Detached | 2,250 (92.5%) | 183 (7.5%) |
| Single Unit, Attached | 58 (98.3%) | 1 (1.7%) |
| 2 Unit Apartments | 0 (0.0%) | 12 (100.0%) |
| 3 or 4 Unit Apartments | 0 (0.0%) | 9 (100.0%) |
| 5 to 9 Unit Apartments | 0 (0.0%) | 25 (100.0%) |
| 10 or more Apartments | 0 (0.0%) | 37 (100.0%) |
| Mobile Home / Other | 306 (82.0%) | 67 (18.0%) |
| Total | 2,614 (88.7%) | 334 (11.3%) |
Housing Structures by Number of Rooms in Tyler County

| Number of Rooms | Owner-occupied | Renter-occupied |
| 1 Room | 0 (0.0%) | 0 (0.0%) |
| 2 or 3 Rooms | 26 (1.0%) | 54 (16.2%) |
| 4 or 5 Rooms | 607 (23.2%) | 112 (33.5%) |
| 6 or 7 Rooms | 1,193 (45.6%) | 105 (31.4%) |
| 8 or more Rooms | 788 (30.1%) | 63 (18.9%) |
| Total | 2,614 (100.0%) | 334 (100.0%) |
Housing Structure by Heating Type in Tyler County

| Heating Type | Owner-occupied | Renter-occupied |
| Utility Gas | 1,871 (71.6%) | 206 (61.7%) |
| Bottled, Tank, or LP Gas | 238 (9.1%) | 14 (4.2%) |
| Electricity | 327 (12.5%) | 102 (30.5%) |
| Fuel Oil or Kerosene | 17 (0.6%) | 0 (0.0%) |
| Coal or Coke | 0 (0.0%) | 0 (0.0%) |
| All other Fuels | 161 (6.2%) | 2 (0.6%) |
| No Fuel Used | 0 (0.0%) | 10 (3.0%) |
| Total | 2,614 (100.0%) | 334 (100.0%) |
Household Vehicle Usage in Tyler County

| Vehicles per Household | Owner-occupied | Renter-occupied |
| No Vehicle | 156 (6.0%) | 58 (17.4%) |
| 1 Vehicle | 777 (29.7%) | 178 (53.3%) |
| 2 Vehicles | 823 (31.5%) | 84 (25.2%) |
| 3 or more Vehicles | 858 (32.8%) | 14 (4.2%) |
| Total | 2,614 (100.0%) | 334 (100.0%) |
Real Estate & Mortgages in Tyler County
Real Estate and Mortgage Overview in Tyler County
| Characteristic | Without Mortgage | With Mortgage |
| Housing Units | 1,817 | 797 |
| Median Property Value | $100,700 | $132,300 |
| Median Household Income | $56,775 | $136 |
| Monthly Housing Costs | $344 | $0 |
| Real Estate Taxes | $559 | $19 |
Property Value by Mortgage Status in Tyler County

| Property Value | Without Mortgage | With Mortgage |
| Less than $50,000 | 481 (26.5%) | 114 (14.3%) |
| $50,000 to $99,999 | 420 (23.1%) | 145 (18.2%) |
| $100,000 to $299,999 | 845 (46.5%) | 478 (60.0%) |
| $300,000 to $499,999 | 23 (1.3%) | 54 (6.8%) |
| $500,000 to $749,999 | 19 (1.1%) | 3 (0.4%) |
| $750,000 to $999,999 | 0 (0.0%) | 3 (0.4%) |
| $1,000,000 or more | 29 (1.6%) | 0 (0.0%) |
| Total | 1,817 (100.0%) | 797 (100.0%) |
Household Income by Mortgage Status in Tyler County

| Household Income | Without Mortgage | With Mortgage |
| Less than $10,000 | 161 (8.9%) | 32 (4.0%) |
| $10,000 to $24,999 | 233 (12.8%) | 1 (0.1%) |
| $25,000 to $34,999 | 202 (11.1%) | 37 (4.6%) |
| $35,000 to $49,999 | 170 (9.4%) | 97 (12.2%) |
| $50,000 to $74,999 | 375 (20.6%) | 72 (9.0%) |
| $75,000 to $99,999 | 220 (12.1%) | 114 (14.3%) |
| $100,000 to $149,999 | 362 (19.9%) | 148 (18.6%) |
| $150,000 or more | 94 (5.2%) | 192 (24.1%) |
| Total | 1,817 (100.0%) | 797 (100.0%) |
Property Value to Household Income Ratio in Tyler County

| Value-to-Income Ratio | Without Mortgage | With Mortgage |
| Less than 2.0x | 945 (52.0%) | 79,504 (9,975.4%) |
| 2.0x to 2.9x | 250 (13.8%) | 524 (65.7%) |
| 3.0x to 3.9x | 222 (12.2%) | 149 (18.7%) |
| 4.0x or more | 294 (16.2%) | 74 (9.3%) |
| Total | 1,817 (100.0%) | 797 (100.0%) |
Real Estate Taxes by Mortgage Status in Tyler County

| Property Taxes | Without Mortgage | With Mortgage |
| Less than $800 | 1,307 (71.9%) | 1 (0.1%) |
| $800 to $1,499 | 302 (16.6%) | 378 (47.4%) |
| $800 to $1,499 | 133 (7.3%) | 314 (39.4%) |
| Total | 1,817 (100.0%) | 797 (100.0%) |
Health & Disability in Tyler County
Health Insurance Coverage by Age in Tyler County

| Age Bracket | With Coverage | Without Coverage |
| Under 6 Years | 473 (100.0%) | 0 (0.0%) |
| 6 to 18 Years | 1,159 (98.8%) | 14 (1.2%) |
| 19 to 25 Years | 582 (96.8%) | 19 (3.2%) |
| 26 to 34 Years | 654 (92.0%) | 57 (8.0%) |
| 35 to 44 Years | 678 (80.1%) | 168 (19.9%) |
| 45 to 54 Years | 1,152 (94.1%) | 72 (5.9%) |
| 55 to 64 Years | 1,279 (95.5%) | 60 (4.5%) |
| 65 to 74 Years | 1,112 (99.4%) | 7 (0.6%) |
| 75 Years and older | 772 (100.0%) | 0 (0.0%) |
| Total | 7,861 (95.2%) | 397 (4.8%) |
Health Insurance Coverage by Citizenship Status in Tyler County

| Citizenship Status | With Coverage | Without Coverage |
| Native Born | 473 (100.0%) | 0 (0.0%) |
| Foreign Born, Citizen | 1,159 (98.8%) | 14 (1.2%) |
| Foreign Born, not a Citizen | 582 (96.8%) | 19 (3.2%) |
Health Insurance Coverage by Household Income in Tyler County
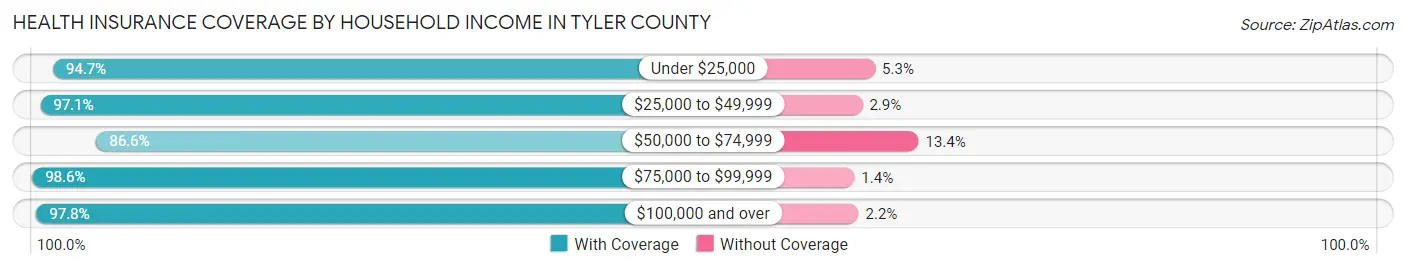
| Household Income | With Coverage | Without Coverage |
| Under $25,000 | 945 (94.7%) | 53 (5.3%) |
| $25,000 to $49,999 | 1,485 (97.1%) | 45 (2.9%) |
| $50,000 to $74,999 | 1,404 (86.6%) | 218 (13.4%) |
| $75,000 to $99,999 | 1,175 (98.6%) | 17 (1.4%) |
| $100,000 and over | 2,838 (97.8%) | 64 (2.2%) |
Public vs Private Health Insurance Coverage by Age in Tyler County

| Age Bracket | Public Insurance | Private Insurance |
| Under 6 | 222 (46.9%) | 251 (53.1%) |
| 6 to 18 Years | 515 (43.9%) | 816 (69.6%) |
| 19 to 25 Years | 224 (37.3%) | 401 (66.7%) |
| 25 to 34 Years | 300 (42.2%) | 355 (49.9%) |
| 35 to 44 Years | 334 (39.5%) | 406 (48.0%) |
| 45 to 54 Years | 600 (49.0%) | 610 (49.8%) |
| 55 to 64 Years | 480 (35.8%) | 909 (67.9%) |
| 65 to 74 Years | 1,109 (99.1%) | 751 (67.1%) |
| 75 Years and over | 772 (100.0%) | 442 (57.3%) |
| Total | 4,556 (55.2%) | 4,941 (59.8%) |
Disability Status by Sex by Age in Tyler County

| Age Bracket | Male | Female |
| Under 5 Years | 0 (0.0%) | 0 (0.0%) |
| 5 to 17 Years | 52 (8.6%) | 25 (4.3%) |
| 18 to 34 Years | 121 (17.4%) | 87 (12.7%) |
| 35 to 64 Years | 331 (19.1%) | 467 (27.8%) |
| 65 to 74 Years | 341 (59.5%) | 174 (31.9%) |
| 75 Years and over | 141 (41.3%) | 243 (56.4%) |
Disability Class by Sex by Age in Tyler County
Disability Class: Hearing Difficulty

| Age Bracket | Male | Female |
| Under 5 Years | 0 (0.0%) | 0 (0.0%) |
| 5 to 17 Years | 0 (0.0%) | 0 (0.0%) |
| 18 to 34 Years | 42 (6.0%) | 3 (0.4%) |
| 35 to 64 Years | 107 (6.2%) | 44 (2.6%) |
| 65 to 74 Years | 165 (28.8%) | 72 (13.2%) |
| 75 Years and over | 92 (27.0%) | 159 (36.9%) |
Disability Class: Vision Difficulty

| Age Bracket | Male | Female |
| Under 5 Years | 0 (0.0%) | 0 (0.0%) |
| 5 to 17 Years | 0 (0.0%) | 0 (0.0%) |
| 18 to 34 Years | 36 (5.2%) | 0 (0.0%) |
| 35 to 64 Years | 62 (3.6%) | 60 (3.6%) |
| 65 to 74 Years | 29 (5.1%) | 35 (6.4%) |
| 75 Years and over | 79 (23.2%) | 27 (6.3%) |
Disability Class: Cognitive Difficulty
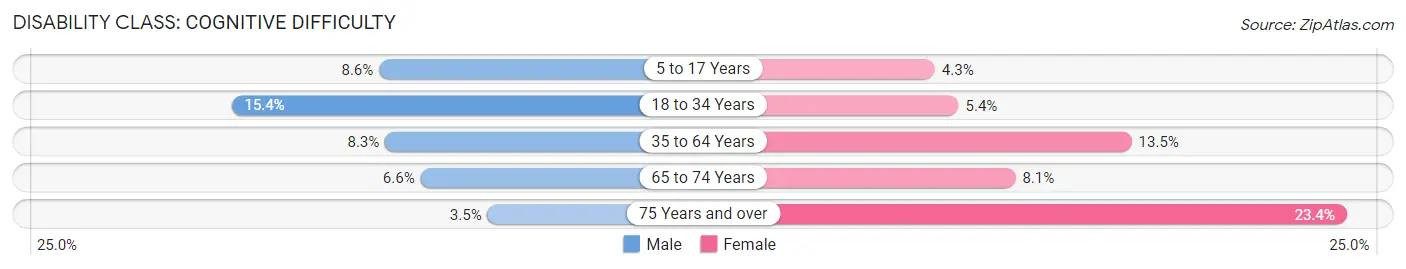
| Age Bracket | Male | Female |
| 5 to 17 Years | 52 (8.6%) | 25 (4.3%) |
| 18 to 34 Years | 107 (15.4%) | 37 (5.4%) |
| 35 to 64 Years | 143 (8.3%) | 226 (13.5%) |
| 65 to 74 Years | 38 (6.6%) | 44 (8.1%) |
| 75 Years and over | 12 (3.5%) | 101 (23.4%) |
Disability Class: Ambulatory Difficulty

| Age Bracket | Male | Female |
| 5 to 17 Years | 0 (0.0%) | 0 (0.0%) |
| 18 to 34 Years | 11 (1.6%) | 0 (0.0%) |
| 35 to 64 Years | 127 (7.3%) | 367 (21.8%) |
| 65 to 74 Years | 168 (29.3%) | 124 (22.7%) |
| 75 Years and over | 114 (33.4%) | 141 (32.7%) |
Disability Class: Self-Care Difficulty

| Age Bracket | Male | Female |
| 5 to 17 Years | 0 (0.0%) | 20 (3.5%) |
| 18 to 34 Years | 36 (5.2%) | 12 (1.8%) |
| 35 to 64 Years | 42 (2.4%) | 224 (13.3%) |
| 65 to 74 Years | 34 (5.9%) | 36 (6.6%) |
| 75 Years and over | 69 (20.2%) | 58 (13.5%) |
Technology Access in Tyler County
Computing Device Access in Tyler County

| Device Type | # Households | % Households |
| Desktop or Laptop | 2,178 | 73.9% |
| Smartphone | 2,013 | 68.3% |
| Tablet | 1,636 | 55.5% |
| No Computing Device | 308 | 10.4% |
| Total | 2,948 | 100.0% |
Internet Access in Tyler County

| Internet Type | # Households | % Households |
| Dial-Up Internet | 29 | 1.0% |
| Broadband Home | 1,800 | 61.1% |
| Cellular Data Only | 234 | 7.9% |
| Satellite Internet | 442 | 15.0% |
| No Internet | 509 | 17.3% |
| Total | 2,948 | 100.0% |
Tyler County Summary
Tyler County is a county located in the northern panhandle of West Virginia. It is bordered by Ohio to the north, Marshall County to the east, Wetzel County to the south, and Monroe County to the west. The county seat is Middlebourne. The county was created in 1814 and named for John Tyler, Sr., father of the tenth President of the United States, John Tyler.
History
The area that is now Tyler County was originally part of the Virginia Military District, which was created in 1784. The area was first settled in 1795 by John and William Tomlinson, who were the first permanent settlers in the county. The county was officially established in 1814 and named for John Tyler, Sr., father of the tenth President of the United States, John Tyler.
The county was largely agricultural in its early years, with the main crops being wheat, corn, and oats. The county also had a thriving timber industry, with the lumber being used to build homes and other structures.
In the late 19th century, the county began to develop its oil and gas industry. The first oil well was drilled in 1883, and by the early 20th century, the county was producing more oil than any other county in West Virginia.
Geography
Tyler County is located in the northern panhandle of West Virginia. It is bordered by Ohio to the north, Marshall County to the east, Wetzel County to the south, and Monroe County to the west. The county has a total area of 441 square miles, of which 437 square miles is land and 4 square miles is water.
The county is mostly hilly, with the highest point being Big Tyler Mountain at an elevation of 1,890 feet. The county is drained by the Middle Island Creek and the Little Kanawha River.
Economy
The economy of Tyler County is largely based on agriculture, oil and gas, and timber. The county is home to several large oil and gas companies, including Chesapeake Energy, Antero Resources, and EQT Corporation.
Agriculture is also an important part of the county’s economy. The main crops grown in the county are corn, wheat, and hay. Livestock production is also important, with the county being home to several large dairy farms.
The county also has a thriving timber industry, with the lumber being used to build homes and other structures.
Demographics
As of the 2010 census, the population of Tyler County was 9,208. The racial makeup of the county was 97.2% White, 0.7% African American, 0.2% Native American, 0.2% Asian, 0.1% Pacific Islander, 0.3% from other races, and 1.3% from two or more races. Hispanic or Latino of any race were 0.7% of the population.
The median income for a household in the county was $35,938, and the median income for a family was $41,944. The per capita income for the county was $17,845. About 14.2% of families and 17.7% of the population were below the poverty line, including 24.2% of those under age 18 and 11.2% of those age 65 or over.
Common Questions
What is the Total Population of Tyler County?
Total Population of Tyler County is 8,336.
What is the Total Male Population of Tyler County?
Total Male Population of Tyler County is 4,173.
What is the Total Female Population of Tyler County?
Total Female Population of Tyler County is 4,163.
What is the Ratio of Males per 100 Females in Tyler County?
There are 100.24 Males per 100 Females in Tyler County.
What is the Ratio of Females per 100 Males in Tyler County?
There are 99.76 Females per 100 Males in Tyler County.
What is the Median Population Age in Tyler County?
Median Population Age in Tyler County is 48.6 Years.
What is the Average Family Size in Tyler County
Average Family Size in Tyler County is 3.8 People.
What is the Average Household Size in Tyler County
Average Household Size in Tyler County is 2.8 People.
What is Per Capita Income in Tyler County?
Per Capita income in Tyler County is $29,891.
What is the Median Family Income in Tyler County?
Median Family Income in Tyler County is $79,181.
What is the Median Household income in Tyler County?
Median Household Income in Tyler County is $59,167.
What is Income or Wage Gap in Tyler County?
Income or Wage Gap in Tyler County is 32.1%.
Women in Tyler County earn 67.9 cents for every dollar earned by a man.
What is Family Income Deficit in Tyler County?
Family Income Deficit in Tyler County is $10,803.
Families that are below poverty line in Tyler County earn $10,803 less on average than the poverty threshold level.
What is Inequality or Gini Index in Tyler County?
Inequality or Gini Index in Tyler County is 0.44.
How Large is the Labor Force in Tyler County?
There are 3,162 People in the Labor Forcein in Tyler County.
What is the Percentage of People in the Labor Force in Tyler County?
45.6% of People are in the Labor Force in Tyler County.
What is the Unemployment Rate in Tyler County?
Unemployment Rate in Tyler County is 4.9%.