Tucker County, WV
Tucker County Map

Tucker County Overview
6,747
TOTAL POPULATION
3,402
MALE POPULATION
3,345
FEMALE POPULATION
101.70
MALES / 100 FEMALES
98.32
FEMALES / 100 MALES
50.9
MEDIAN AGE
3.0
AVG FAMILY SIZE
2.3
AVG HOUSEHOLD SIZE
$32,590
PER CAPITA INCOME
$69,038
AVG FAMILY INCOME
$54,053
AVG HOUSEHOLD INCOME
22.6%
WAGE / INCOME GAP [ % ]
77.4¢/ $1
WAGE / INCOME GAP [ $ ]
0.44
INEQUALITY / GINI INDEX
3,210
LABOR FORCE [ PEOPLE ]
54.1%
PERCENT IN LABOR FORCE
6.6%
UNEMPLOYMENT RATE
Race in Tucker County
The most populous races in Tucker County are White / Caucasian (6,555 | 97.2%), Two or more Races (159 | 2.4%), and Some other Race (19 | 0.3%).

| Race | # Population | % Population |
| Asian | 10 | 0.2% |
| Black / African American | 4 | 0.1% |
| Hawaiian / Pacific | 0 | 0.0% |
| Hispanic or Latino | 9 | 0.1% |
| Native / Alaskan | 0 | 0.0% |
| White / Caucasian | 6,555 | 97.2% |
| Two or more Races | 159 | 2.4% |
| Some other Race | 19 | 0.3% |
| Total | 6,747 | 100.0% |
Ancestry in Tucker County
The most populous ancestries reported in Tucker County are American (1,693 | 25.1%), German (1,482 | 22.0%), Irish (661 | 9.8%), English (650 | 9.6%), and Italian (337 | 5.0%), together accounting for 71.5% of all Tucker County residents.

| Ancestry | # Population | % Population |
| American | 1,693 | 25.1% |
| Belgian | 8 | 0.1% |
| British | 10 | 0.2% |
| Celtic | 8 | 0.1% |
| Cherokee | 82 | 1.2% |
| Croatian | 10 | 0.2% |
| Czech | 7 | 0.1% |
| Dutch | 81 | 1.2% |
| Eastern European | 29 | 0.4% |
| English | 650 | 9.6% |
| European | 183 | 2.7% |
| French | 130 | 1.9% |
| French Canadian | 14 | 0.2% |
| German | 1,482 | 22.0% |
| Hungarian | 5 | 0.1% |
| Irish | 661 | 9.8% |
| Italian | 337 | 5.0% |
| Korean | 19 | 0.3% |
| Lithuanian | 19 | 0.3% |
| Nigerian | 4 | 0.1% |
| Norwegian | 8 | 0.1% |
| Polish | 112 | 1.7% |
| Puerto Rican | 1 | 0.0% |
| Russian | 6 | 0.1% |
| Samoan | 8 | 0.1% |
| Scandinavian | 32 | 0.5% |
| Scotch-Irish | 138 | 2.1% |
| Scottish | 233 | 3.5% |
| Slovak | 8 | 0.1% |
| Slovene | 6 | 0.1% |
| Sri Lankan | 1 | 0.0% |
| Subsaharan African | 4 | 0.1% |
| Swedish | 34 | 0.5% |
| Swiss | 2 | 0.0% |
| Ukrainian | 8 | 0.1% |
| Welsh | 62 | 0.9% | View All 36 Rows |
Immigrants in Tucker County
The most numerous immigrant groups reported in Tucker County came from Asia (9 | 0.1%), Philippines (9 | 0.1%), South Eastern Asia (9 | 0.1%), Europe (3 | 0.0%), and Germany (3 | 0.0%), together accounting for 0.5% of all Tucker County residents.

| Immigration Origin | # Population | % Population |
| Asia | 9 | 0.1% |
| Europe | 3 | 0.0% |
| Germany | 3 | 0.0% |
| Philippines | 9 | 0.1% |
| South Eastern Asia | 9 | 0.1% |
| Western Europe | 3 | 0.0% | View All 6 Rows |
Sex and Age in Tucker County
Sex and Age in Tucker County
The most populous age groups in Tucker County are 60 to 64 Years (289 | 8.5%) for men and 60 to 64 Years (345 | 10.3%) for women.

| Age Bracket | Male | Female |
| Under 5 Years | 131 (3.8%) | 129 (3.9%) |
| 5 to 9 Years | 74 (2.2%) | 144 (4.3%) |
| 10 to 14 Years | 180 (5.3%) | 114 (3.4%) |
| 15 to 19 Years | 212 (6.2%) | 138 (4.1%) |
| 20 to 24 Years | 118 (3.5%) | 119 (3.6%) |
| 25 to 29 Years | 209 (6.1%) | 192 (5.7%) |
| 30 to 34 Years | 158 (4.6%) | 168 (5.0%) |
| 35 to 39 Years | 197 (5.8%) | 164 (4.9%) |
| 40 to 44 Years | 182 (5.3%) | 215 (6.4%) |
| 45 to 49 Years | 227 (6.7%) | 194 (5.8%) |
| 50 to 54 Years | 252 (7.4%) | 259 (7.7%) |
| 55 to 59 Years | 279 (8.2%) | 238 (7.1%) |
| 60 to 64 Years | 289 (8.5%) | 345 (10.3%) |
| 65 to 69 Years | 243 (7.1%) | 223 (6.7%) |
| 70 to 74 Years | 287 (8.4%) | 294 (8.8%) |
| 75 to 79 Years | 134 (3.9%) | 193 (5.8%) |
| 80 to 84 Years | 154 (4.5%) | 115 (3.4%) |
| 85 Years and over | 76 (2.2%) | 101 (3.0%) |
| Total | 3,402 (100.0%) | 3,345 (100.0%) |
Families and Households in Tucker County
Median Family Size in Tucker County
The median family size in Tucker County is 2.95 persons per family, with single female/mother families (164 | 9.4%) accounting for the largest median family size of 3.62 persons per family. On the other hand, married-couple families (1,432 | 81.8%) represent the smallest median family size with 2.83 persons per family.

| Family Type | # Families | Family Size |
| Married-Couple | 1,432 (81.8%) | 2.83 |
| Single Male/Father | 154 (8.8%) | 3.42 |
| Single Female/Mother | 164 (9.4%) | 3.62 |
| Total Families | 1,750 (100.0%) | 2.95 |
Median Household Size in Tucker County
The median household size in Tucker County is 2.32 persons per household, with single female/mother households (164 | 5.8%) accounting for the largest median household size of 3.9 persons per household. non-family households (1,086 | 38.3%) represent the smallest median household size with 1.18 persons per household.

| Household Type | # Households | Household Size |
| Married-Couple | 1,432 (50.5%) | 2.85 |
| Single Male/Father | 154 (5.4%) | 3.81 |
| Single Female/Mother | 164 (5.8%) | 3.90 |
| Non-family | 1,086 (38.3%) | 1.18 |
| Total Households | 2,836 (100.0%) | 2.32 |
Household Size by Marriage Status in Tucker County
Out of a total of 2,836 households in Tucker County, 1,750 (61.7%) are family households, while 1,086 (38.3%) are nonfamily households. The most numerous type of family households are 2-person households, comprising 988, and the most common type of nonfamily households are 1-person households, comprising 984.

| Household Size | Family Households | Nonfamily Households |
| 1-Person Households | - | 984 (34.7%) |
| 2-Person Households | 988 (34.8%) | 84 (3.0%) |
| 3-Person Households | 379 (13.4%) | 8 (0.3%) |
| 4-Person Households | 219 (7.7%) | 8 (0.3%) |
| 5-Person Households | 121 (4.3%) | 0 (0.0%) |
| 6-Person Households | 43 (1.5%) | 0 (0.0%) |
| 7+ Person Households | 0 (0.0%) | 2 (0.1%) |
| Total | 1,750 (61.7%) | 1,086 (38.3%) |
Female Fertility in Tucker County
Fertility by Age in Tucker County
Average fertility rate in Tucker County is 13.0 births per 1,000 women. Women in the age bracket of 20 to 34 years have the highest fertility rate with 27.0 births per 1,000 women. Women in the age bracket of 20 to 34 years acount for 81.2% of all women with births.

| Age Bracket | Women with Births | Births / 1,000 Women |
| 15 to 19 years | 0 (0.0%) | 0.0 |
| 20 to 34 years | 13 (81.2%) | 27.0 |
| 35 to 50 years | 3 (18.8%) | 5.0 |
| Total | 16 (100.0%) | 13.0 |
Fertility by Age by Marriage Status in Tucker County
68.8% of women with births (16) in Tucker County are married. The highest percentage of unmarried women with births falls into 20 to 34 years age bracket with 38.5% of them unmarried at the time of birth, while the lowest percentage of unmarried women with births belong to 35 to 50 years age bracket with 0.0% of them unmarried.

| Age Bracket | Married | Unmarried |
| 15 to 19 years | 0 (0.0%) | 0 (0.0%) |
| 20 to 34 years | 8 (61.5%) | 5 (38.5%) |
| 35 to 50 years | 3 (100.0%) | 0 (0.0%) |
| Total | 11 (68.8%) | 5 (31.2%) |
Fertility by Education in Tucker County

| Educational Attainment | Women with Births | Births / 1,000 Women |
| Less than High School | 0 (0.0%) | 0.0 |
| High School Diploma | 5 (31.2%) | 15.0 |
| College or Associate's Degree | 4 (25.0%) | 11.0 |
| Bachelor's Degree | 7 (43.8%) | 45.0 |
| Graduate Degree | 0 (0.0%) | 0.0 |
| Total | 16 (100.0%) | 13.0 |
Fertility by Education by Marriage Status in Tucker County
31.2% of women with births in Tucker County are unmarried. Women with the educational attainment of college or associate's degree are most likely to be married with 100.0% of them married at childbirth, while women with the educational attainment of high school diploma are least likely to be married with 100.0% of them unmarried at childbirth.

| Educational Attainment | Married | Unmarried |
| Less than High School | 0 (0.0%) | 0 (0.0%) |
| High School Diploma | 0 (0.0%) | 5 (100.0%) |
| College or Associate's Degree | 4 (100.0%) | 0 (0.0%) |
| Bachelor's Degree | 7 (100.0%) | 0 (0.0%) |
| Graduate Degree | 0 (0.0%) | 0 (0.0%) |
| Total | 11 (68.8%) | 5 (31.2%) |
Income in Tucker County
Income Overview in Tucker County
Per Capita Income in Tucker County is $32,590, while median incomes of families and households are $69,038 and $54,053 respectively.
| Characteristic | Number | Measure |
| Per Capita Income | 6,747 | $32,590 |
| Median Family Income | 1,750 | $69,038 |
| Mean Family Income | 1,750 | $88,006 |
| Median Household Income | 2,836 | $54,053 |
| Mean Household Income | 2,836 | $70,765 |
| Income Deficit | 1,750 | $0 |
| Wage / Income Gap (%) | 6,747 | 22.61% |
| Wage / Income Gap ($) | 6,747 | 77.39¢ per $1 |
| Gini / Inequality Index | 6,747 | 0.44 |
Earnings by Sex in Tucker County
Average Earnings in Tucker County are $34,126, $38,293 for men and $29,636 for women, a difference of 22.6%.

| Sex | Number | Average Earnings |
| Male | 1,755 (53.1%) | $38,293 |
| Female | 1,551 (46.9%) | $29,636 |
| Total | 3,306 (100.0%) | $34,126 |
Earnings by Sex by Income Bracket in Tucker County
The most common earnings brackets in Tucker County are $75,000 to $99,999 for men (198 | 11.3%) and $25,000 to $29,999 for women (149 | 9.6%).

| Income | Male | Female |
| $2,499 or less | 56 (3.2%) | 116 (7.5%) |
| $2,500 to $4,999 | 83 (4.7%) | 23 (1.5%) |
| $5,000 to $7,499 | 43 (2.5%) | 61 (3.9%) |
| $7,500 to $9,999 | 71 (4.1%) | 93 (6.0%) |
| $10,000 to $12,499 | 33 (1.9%) | 45 (2.9%) |
| $12,500 to $14,999 | 25 (1.4%) | 116 (7.5%) |
| $15,000 to $17,499 | 12 (0.7%) | 37 (2.4%) |
| $17,500 to $19,999 | 51 (2.9%) | 39 (2.5%) |
| $20,000 to $22,499 | 49 (2.8%) | 44 (2.8%) |
| $22,500 to $24,999 | 92 (5.2%) | 64 (4.1%) |
| $25,000 to $29,999 | 131 (7.5%) | 149 (9.6%) |
| $30,000 to $34,999 | 135 (7.7%) | 121 (7.8%) |
| $35,000 to $39,999 | 160 (9.1%) | 146 (9.4%) |
| $40,000 to $44,999 | 76 (4.3%) | 66 (4.3%) |
| $45,000 to $49,999 | 89 (5.1%) | 81 (5.2%) |
| $50,000 to $54,999 | 113 (6.4%) | 30 (1.9%) |
| $55,000 to $64,999 | 123 (7.0%) | 81 (5.2%) |
| $65,000 to $74,999 | 56 (3.2%) | 75 (4.8%) |
| $75,000 to $99,999 | 198 (11.3%) | 69 (4.4%) |
| $100,000+ | 159 (9.1%) | 95 (6.1%) |
| Total | 1,755 (100.0%) | 1,551 (100.0%) |
Earnings by Sex by Educational Attainment in Tucker County
Average earnings in Tucker County are $39,624 for men and $31,429 for women, a difference of 20.7%. Men with an educational attainment of graduate degree enjoy the highest average annual earnings of $71,250, while those with less than high school education earn the least with $29,934. Women with an educational attainment of graduate degree earn the most with the average annual earnings of $80,655, while those with high school diploma education have the smallest earnings of $25,994.
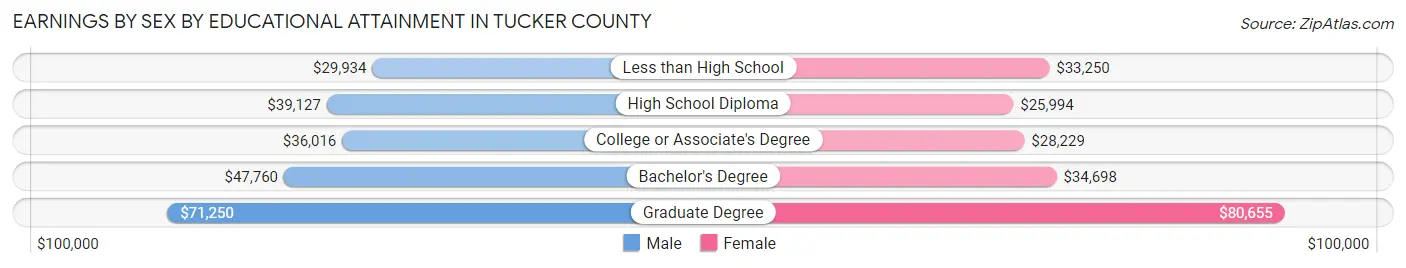
| Educational Attainment | Male Income | Female Income |
| Less than High School | $29,934 | $33,250 |
| High School Diploma | $39,127 | $25,994 |
| College or Associate's Degree | $36,016 | $28,229 |
| Bachelor's Degree | $47,760 | $34,698 |
| Graduate Degree | $71,250 | $80,655 |
| Total | $39,624 | $31,429 |
Family Income in Tucker County
Family Income Brackets in Tucker County
According to the Tucker County family income data, there are 362 families falling into the $50,000 to $74,999 income range, which is the most common income bracket and makes up 20.7% of all families. Conversely, the $10,000 to $14,999 income bracket is the least frequent group with only 19 families (1.1%) belonging to this category.

| Income Bracket | # Families | % Families |
| Less than $10,000 | 33 | 1.9% |
| $10,000 to $14,999 | 19 | 1.1% |
| $15,000 to $24,999 | 107 | 6.1% |
| $25,000 to $34,999 | 156 | 8.9% |
| $35,000 to $49,999 | 254 | 14.5% |
| $50,000 to $74,999 | 362 | 20.7% |
| $75,000 to $99,999 | 306 | 17.5% |
| $100,000 to $149,999 | 250 | 14.3% |
| $150,000 to $199,999 | 150 | 8.6% |
| $200,000+ | 112 | 6.4% |
Family Income by Famaliy Size in Tucker County
5-person families (109 | 6.2%) account for the highest median family income in Tucker County with $102,404 per family, while 2-person families (1,040 | 59.4%) have the highest median income of $29,354 per family member.

| Income Bracket | # Families | Median Income |
| 2-Person Families | 1,040 (59.4%) | $58,707 |
| 3-Person Families | 367 (21.0%) | $83,438 |
| 4-Person Families | 196 (11.2%) | $63,077 |
| 5-Person Families | 109 (6.2%) | $102,404 |
| 6-Person Families | 38 (2.2%) | $100,500 |
| 7+ Person Families | 0 (0.0%) | $0 |
| Total | 1,750 (100.0%) | $69,038 |
Family Income by Number of Earners in Tucker County
The median family income in Tucker County is $69,038, with families comprising 3+ earners (142) having the highest median family income of $150,132, while families with no earners (424) have the lowest median family income of $45,000, accounting for 8.1% and 24.2% of families, respectively.

| Number of Earners | # Families | Median Income |
| No Earners | 424 (24.2%) | $45,000 |
| 1 Earner | 580 (33.1%) | $58,731 |
| 2 Earners | 604 (34.5%) | $90,517 |
| 3+ Earners | 142 (8.1%) | $150,132 |
| Total | 1,750 (100.0%) | $69,038 |
Household Income in Tucker County
Household Income Brackets in Tucker County
With 516 households falling in the category, the $50,000 to $74,999 income range is the most frequent in Tucker County, accounting for 18.2% of all households. In contrast, only 111 households (3.9%) fall into the $200,000+ income bracket, making it the least populous group.

| Income Bracket | # Households | % Households |
| Less than $10,000 | 136 | 4.8% |
| $10,000 to $14,999 | 162 | 5.7% |
| $15,000 to $24,999 | 286 | 10.1% |
| $25,000 to $34,999 | 309 | 10.9% |
| $35,000 to $49,999 | 414 | 14.6% |
| $50,000 to $74,999 | 516 | 18.2% |
| $75,000 to $99,999 | 383 | 13.5% |
| $100,000 to $149,999 | 352 | 12.4% |
| $150,000 to $199,999 | 162 | 5.7% |
| $200,000+ | 111 | 3.9% |
Household Income by Householder Age in Tucker County
The median household income in Tucker County is $54,053, with the highest median household income of $64,130 found in the 45 to 64 years age bracket for the primary householder. A total of 1,034 households (36.5%) fall into this category. Meanwhile, the 65+ years age bracket for the primary householder has the lowest median household income of $38,375, with 1,148 households (40.5%) in this group.

| Income Bracket | # Households | Median Income |
| 15 to 24 Years | 25 (0.9%) | $63,375 |
| 25 to 44 Years | 629 (22.2%) | $59,485 |
| 45 to 64 Years | 1,034 (36.5%) | $64,130 |
| 65+ Years | 1,148 (40.5%) | $38,375 |
| Total | 2,836 (100.0%) | $54,053 |
Poverty in Tucker County
Income Below Poverty by Sex and Age in Tucker County
With 9.8% poverty level for males and 9.8% for females among the residents of Tucker County, 5 year old males and 15 year old females are the most vulnerable to poverty, with 4 males (40.0%) and 21 females (87.5%) in their respective age groups living below the poverty level.
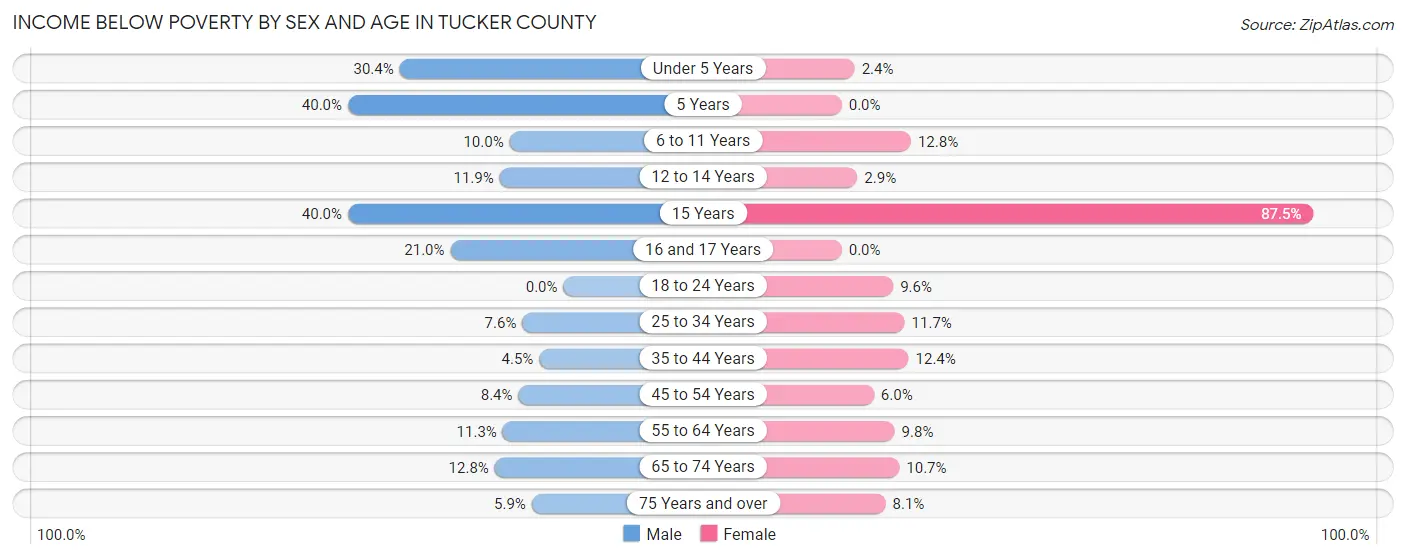
| Age Bracket | Male | Female |
| Under 5 Years | 38 (30.4%) | 3 (2.4%) |
| 5 Years | 4 (40.0%) | 0 (0.0%) |
| 6 to 11 Years | 9 (10.0%) | 19 (12.8%) |
| 12 to 14 Years | 16 (11.8%) | 2 (2.9%) |
| 15 Years | 6 (40.0%) | 21 (87.5%) |
| 16 and 17 Years | 13 (21.0%) | 0 (0.0%) |
| 18 to 24 Years | 0 (0.0%) | 17 (9.6%) |
| 25 to 34 Years | 28 (7.6%) | 42 (11.7%) |
| 35 to 44 Years | 17 (4.5%) | 47 (12.4%) |
| 45 to 54 Years | 40 (8.4%) | 27 (6.0%) |
| 55 to 64 Years | 64 (11.3%) | 56 (9.8%) |
| 65 to 74 Years | 65 (12.8%) | 54 (10.7%) |
| 75 Years and over | 21 (5.9%) | 30 (8.1%) |
| Total | 321 (9.8%) | 318 (9.8%) |
Income Above Poverty by Sex and Age in Tucker County
According to the poverty statistics in Tucker County, males aged 18 to 24 years and females aged 5 years are the age groups that are most secure financially, with 100.0% of males and 100.0% of females in these age groups living above the poverty line.

| Age Bracket | Male | Female |
| Under 5 Years | 87 (69.6%) | 122 (97.6%) |
| 5 Years | 6 (60.0%) | 25 (100.0%) |
| 6 to 11 Years | 81 (90.0%) | 129 (87.2%) |
| 12 to 14 Years | 119 (88.1%) | 67 (97.1%) |
| 15 Years | 9 (60.0%) | 3 (12.5%) |
| 16 and 17 Years | 49 (79.0%) | 54 (100.0%) |
| 18 to 24 Years | 193 (100.0%) | 161 (90.4%) |
| 25 to 34 Years | 339 (92.4%) | 318 (88.3%) |
| 35 to 44 Years | 362 (95.5%) | 332 (87.6%) |
| 45 to 54 Years | 439 (91.6%) | 426 (94.0%) |
| 55 to 64 Years | 504 (88.7%) | 515 (90.2%) |
| 65 to 74 Years | 445 (87.3%) | 451 (89.3%) |
| 75 Years and over | 336 (94.1%) | 339 (91.9%) |
| Total | 2,969 (90.2%) | 2,942 (90.2%) |
Income Below Poverty Among Married-Couple Families in Tucker County
The poverty statistics for married-couple families in Tucker County show that 4.3% or 62 of the total 1,432 families live below the poverty line. Families with 1 or 2 children have the highest poverty rate of 7.5%, comprising of 23 families. On the other hand, families with 3 or 4 children have the lowest poverty rate of 0.0%, which includes 0 families.

| Children | Above Poverty | Below Poverty |
| No Children | 1,009 (96.3%) | 39 (3.7%) |
| 1 or 2 Children | 282 (92.5%) | 23 (7.5%) |
| 3 or 4 Children | 79 (100.0%) | 0 (0.0%) |
| 5 or more Children | 0 (0.0%) | 0 (0.0%) |
| Total | 1,370 (95.7%) | 62 (4.3%) |
Income Below Poverty Among Single-Parent Households in Tucker County
According to the poverty data in Tucker County, 8.4% or 13 single-father households and 22.6% or 37 single-mother households are living below the poverty line. Among single-father households, those with 1 or 2 children have the highest poverty rate, with 13 households (14.9%) experiencing poverty. Likewise, among single-mother households, those with 5 or more children have the highest poverty rate, with 4 households (100.0%) falling below the poverty line.

| Children | Single Father | Single Mother |
| No Children | 0 (0.0%) | 5 (5.4%) |
| 1 or 2 Children | 13 (14.9%) | 28 (46.7%) |
| 3 or 4 Children | 0 (0.0%) | 0 (0.0%) |
| 5 or more Children | 0 (0.0%) | 4 (100.0%) |
| Total | 13 (8.4%) | 37 (22.6%) |
Income Below Poverty Among Married-Couple vs Single-Parent Households in Tucker County
The poverty data for Tucker County shows that 62 of the married-couple family households (4.3%) and 50 of the single-parent households (15.7%) are living below the poverty level. Within the married-couple family households, those with 1 or 2 children have the highest poverty rate, with 23 households (7.5%) falling below the poverty line. Among the single-parent households, those with 5 or more children have the highest poverty rate, with 4 household (100.0%) living below poverty.

| Children | Married-Couple Families | Single-Parent Households |
| No Children | 39 (3.7%) | 5 (3.4%) |
| 1 or 2 Children | 23 (7.5%) | 41 (27.9%) |
| 3 or 4 Children | 0 (0.0%) | 0 (0.0%) |
| 5 or more Children | 0 (0.0%) | 4 (100.0%) |
| Total | 62 (4.3%) | 50 (15.7%) |
Employment Characteristics in Tucker County
Employment by Class of Employer in Tucker County
Among the 2,972 employed individuals in Tucker County, private company employees (1,477 | 49.7%), not-for-profit organizations (454 | 15.3%), and local government employees (324 | 10.9%) make up the most common classes of employment.

| Employer Class | # Employees | % Employees |
| Private Company Employees | 1,477 | 49.7% |
| Self-Employed (Incorporated) | 71 | 2.4% |
| Self-Employed (Not Incorporated) | 187 | 6.3% |
| Not-for-profit Organizations | 454 | 15.3% |
| Local Government Employees | 324 | 10.9% |
| State Government Employees | 309 | 10.4% |
| Federal Government Employees | 148 | 5.0% |
| Unpaid Family Workers | 2 | 0.1% |
| Total | 2,972 | 100.0% |
Employment Status by Age in Tucker County
According to the labor force statistics for Tucker County, out of the total population over 16 years of age (5,934), 54.1% or 3,210 individuals are in the labor force, with 6.6% or 212 of them unemployed. The age group with the highest labor force participation rate is 25 to 29 years, with 92.5% or 371 individuals in the labor force. Within the labor force, the 30 to 34 years age range has the highest percentage of unemployed individuals, with 28.2% or 75 of them being unemployed.

| Age Bracket | In Labor Force | Unemployed |
| 16 to 19 Years | 107 (34.6%) | 10 (9.3%) |
| 20 to 24 Years | 216 (91.1%) | 12 (5.6%) |
| 25 to 29 Years | 371 (92.5%) | 41 (11.1%) |
| 30 to 34 Years | 266 (81.6%) | 75 (28.2%) |
| 35 to 44 Years | 648 (85.5%) | 33 (5.1%) |
| 45 to 54 Years | 666 (71.5%) | 20 (3.0%) |
| 55 to 59 Years | 390 (75.4%) | 13 (3.3%) |
| 60 to 64 Years | 316 (49.8%) | 0 (0.0%) |
| 65 to 74 Years | 170 (16.2%) | 7 (4.1%) |
| 75 Years and over | 61 (7.9%) | 0 (0.0%) |
| Total | 3,210 (54.1%) | 212 (6.6%) |
Employment Status by Educational Attainment in Tucker County
According to labor force statistics for Tucker County, 74.5% of individuals (2,658) out of the total population between 25 and 64 years of age (3,568) are in the labor force, with 6.8% or 181 of them being unemployed. The group with the highest labor force participation rate are those with the educational attainment of bachelor's degree or higher, with 84.7% or 788 individuals in the labor force. Within the labor force, individuals with less than high school education have the highest percentage of unemployment, with 15.5% or 15 of them being unemployed.
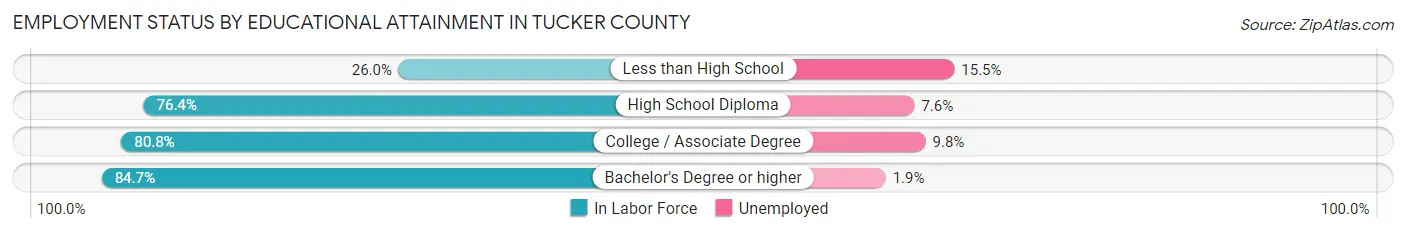
| Educational Attainment | In Labor Force | Unemployed |
| Less than High School | 97 (26.0%) | 58 (15.5%) |
| High School Diploma | 999 (76.4%) | 99 (7.6%) |
| College / Associate Degree | 774 (80.8%) | 94 (9.8%) |
| Bachelor's Degree or higher | 788 (84.7%) | 18 (1.9%) |
| Total | 2,658 (74.5%) | 243 (6.8%) |
Employment Occupations by Sex in Tucker County
Management, Business, Science and Arts Occupations
The most common Management, Business, Science and Arts occupations in Tucker County are Community & Social Service (310 | 10.3%), Health Diagnosing & Treating (286 | 9.5%), Management (252 | 8.4%), Health Technologists (175 | 5.8%), and Education Instruction & Library (144 | 4.8%).

Management, Business, Science and Arts Occupations by Sex
Within the Management, Business, Science and Arts occupations in Tucker County, the most male-oriented occupations are Computers & Mathematics (100.0%), Architecture & Engineering (100.0%), and Legal Services & Support (76.5%), while the most female-oriented occupations are Life, Physical & Social Science (88.0%), Health Technologists (82.3%), and Business & Financial (77.4%).

| Occupation | Male | Female |
| Management | 117 (46.4%) | 135 (53.6%) |
| Business & Financial | 12 (22.6%) | 41 (77.4%) |
| Computers, Engineering & Science | 32 (59.3%) | 22 (40.7%) |
| Computers & Mathematics | 13 (100.0%) | 0 (0.0%) |
| Architecture & Engineering | 16 (100.0%) | 0 (0.0%) |
| Life, Physical & Social Science | 3 (12.0%) | 22 (88.0%) |
| Community & Social Service | 145 (46.8%) | 165 (53.2%) |
| Education, Arts & Media | 64 (64.6%) | 35 (35.3%) |
| Legal Services & Support | 13 (76.5%) | 4 (23.5%) |
| Education Instruction & Library | 45 (31.2%) | 99 (68.8%) |
| Arts, Media & Entertainment | 23 (46.0%) | 27 (54.0%) |
| Health Diagnosing & Treating | 108 (37.8%) | 178 (62.2%) |
| Health Technologists | 31 (17.7%) | 144 (82.3%) |
| Total (Category) | 414 (43.3%) | 541 (56.7%) |
| Total (Overall) | 1,572 (52.4%) | 1,428 (47.6%) |
Services Occupations
The most common Services occupations in Tucker County are Food Preparation & Serving (190 | 6.3%), Cleaning & Maintenance (135 | 4.5%), Healthcare Support (90 | 3.0%), Security & Protection (83 | 2.8%), and Personal Care & Service (83 | 2.8%).

Services Occupations by Sex
Within the Services occupations in Tucker County, the most male-oriented occupations are Law Enforcement (95.2%), Security & Protection (77.1%), and Cleaning & Maintenance (55.6%), while the most female-oriented occupations are Healthcare Support (97.8%), Personal Care & Service (90.4%), and Food Preparation & Serving (86.8%).

| Occupation | Male | Female |
| Healthcare Support | 2 (2.2%) | 88 (97.8%) |
| Security & Protection | 64 (77.1%) | 19 (22.9%) |
| Firefighting & Prevention | 5 (23.8%) | 16 (76.2%) |
| Law Enforcement | 59 (95.2%) | 3 (4.8%) |
| Food Preparation & Serving | 25 (13.2%) | 165 (86.8%) |
| Cleaning & Maintenance | 75 (55.6%) | 60 (44.4%) |
| Personal Care & Service | 8 (9.6%) | 75 (90.4%) |
| Total (Category) | 174 (29.9%) | 407 (70.1%) |
| Total (Overall) | 1,572 (52.4%) | 1,428 (47.6%) |
Sales and Office Occupations
The most common Sales and Office occupations in Tucker County are Office & Administration (428 | 14.3%), and Sales & Related (136 | 4.5%).

Sales and Office Occupations by Sex

| Occupation | Male | Female |
| Sales & Related | 111 (81.6%) | 25 (18.4%) |
| Office & Administration | 57 (13.3%) | 371 (86.7%) |
| Total (Category) | 168 (29.8%) | 396 (70.2%) |
| Total (Overall) | 1,572 (52.4%) | 1,428 (47.6%) |
Natural Resources, Construction and Maintenance Occupations
The most common Natural Resources, Construction and Maintenance occupations in Tucker County are Construction & Extraction (250 | 8.3%), Installation, Maintenance & Repair (150 | 5.0%), and Farming, Fishing & Forestry (39 | 1.3%).

Natural Resources, Construction and Maintenance Occupations by Sex

| Occupation | Male | Female |
| Farming, Fishing & Forestry | 20 (51.3%) | 19 (48.7%) |
| Construction & Extraction | 250 (100.0%) | 0 (0.0%) |
| Installation, Maintenance & Repair | 150 (100.0%) | 0 (0.0%) |
| Total (Category) | 420 (95.7%) | 19 (4.3%) |
| Total (Overall) | 1,572 (52.4%) | 1,428 (47.6%) |
Production, Transportation and Moving Occupations
The most common Production, Transportation and Moving occupations in Tucker County are Production (237 | 7.9%), Material Moving (133 | 4.4%), and Transportation (91 | 3.0%).

Production, Transportation and Moving Occupations by Sex
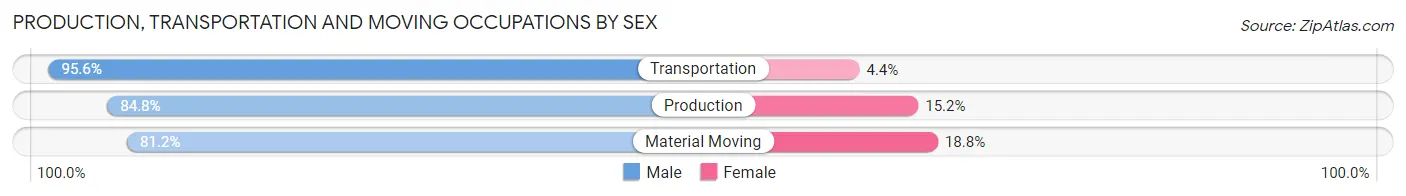
| Occupation | Male | Female |
| Production | 201 (84.8%) | 36 (15.2%) |
| Transportation | 87 (95.6%) | 4 (4.4%) |
| Material Moving | 108 (81.2%) | 25 (18.8%) |
| Total (Category) | 396 (85.9%) | 65 (14.1%) |
| Total (Overall) | 1,572 (52.4%) | 1,428 (47.6%) |
Employment Industries by Sex in Tucker County
Employment Industries in Tucker County
The major employment industries in Tucker County include Health Care & Social Assistance (608 | 20.3%), Manufacturing (322 | 10.7%), Public Administration (276 | 9.2%), Construction (274 | 9.1%), and Educational Services (186 | 6.2%).

Employment Industries by Sex in Tucker County
The Tucker County industries that see more men than women are Mining, Quarrying, & Extraction (100.0%), Wholesale Trade (100.0%), and Utilities (91.0%), whereas the industries that tend to have a higher number of women are Educational Services (78.0%), Health Care & Social Assistance (70.9%), and Accommodation & Food Services (69.0%).

| Industry | Male | Female |
| Agriculture, Fishing & Hunting | 41 (58.6%) | 29 (41.4%) |
| Mining, Quarrying, & Extraction | 81 (100.0%) | 0 (0.0%) |
| Construction | 248 (90.5%) | 26 (9.5%) |
| Manufacturing | 285 (88.5%) | 37 (11.5%) |
| Wholesale Trade | 3 (100.0%) | 0 (0.0%) |
| Retail Trade | 71 (39.7%) | 108 (60.3%) |
| Transportation & Warehousing | 51 (53.7%) | 44 (46.3%) |
| Utilities | 81 (91.0%) | 8 (9.0%) |
| Information | 25 (73.5%) | 9 (26.5%) |
| Finance & Insurance | 18 (72.0%) | 7 (28.0%) |
| Real Estate, Rental & Leasing | 20 (76.9%) | 6 (23.1%) |
| Professional & Scientific | 63 (67.0%) | 31 (33.0%) |
| Enterprise Management | 0 (0.0%) | 0 (0.0%) |
| Administrative & Support | 28 (34.2%) | 54 (65.8%) |
| Educational Services | 41 (22.0%) | 145 (78.0%) |
| Health Care & Social Assistance | 177 (29.1%) | 431 (70.9%) |
| Arts, Entertainment & Recreation | 74 (52.1%) | 68 (47.9%) |
| Accommodation & Food Services | 57 (31.0%) | 127 (69.0%) |
| Public Administration | 138 (50.0%) | 138 (50.0%) |
| Total | 1,572 (52.4%) | 1,428 (47.6%) |
Education in Tucker County
School Enrollment in Tucker County
The most common levels of schooling among the 883 students in Tucker County are high school (303 | 34.3%), middle school (235 | 26.6%), and elementary school (166 | 18.8%).

| School Level | # Students | % Students |
| Nursery / Preschool | 34 | 3.8% |
| Kindergarten | 48 | 5.4% |
| Elementary School | 166 | 18.8% |
| Middle School | 235 | 26.6% |
| High School | 303 | 34.3% |
| College / Undergraduate | 92 | 10.4% |
| Graduate / Professional | 5 | 0.6% |
| Total | 883 | 100.0% |
School Enrollment by Age by Funding Source in Tucker County
Out of a total of 883 students who are enrolled in schools in Tucker County, 138 (15.6%) attend a private institution, while the remaining 745 (84.4%) are enrolled in public schools. The age group of 3 to 4 year olds has the highest likelihood of being enrolled in private schools, with 16 (69.6% in the age bracket) enrolled. Conversely, the age group of 25 to 34 year olds has the lowest likelihood of being enrolled in a private school, with 3 (100.0% in the age bracket) attending a public institution.

| Age Bracket | Public School | Private School |
| 3 to 4 Year Olds | 7 (30.4%) | 16 (69.6%) |
| 5 to 9 Year Old | 201 (92.2%) | 17 (7.8%) |
| 10 to 14 Year Olds | 233 (84.1%) | 44 (15.9%) |
| 15 to 17 Year Olds | 148 (87.1%) | 22 (12.9%) |
| 18 to 19 Year Olds | 62 (71.3%) | 25 (28.7%) |
| 20 to 24 Year Olds | 80 (96.4%) | 3 (3.6%) |
| 25 to 34 Year Olds | 3 (100.0%) | 0 (0.0%) |
| 35 Years and over | 11 (50.0%) | 11 (50.0%) |
| Total | 745 (84.4%) | 138 (15.6%) |
Educational Attainment by Field of Study in Tucker County
Education (220 | 14.8%), business (216 | 14.6%), social sciences (187 | 12.6%), bio, nature & agricultural (174 | 11.7%), and science & technology (142 | 9.6%) are the most common fields of study among 1,481 individuals in Tucker County who have obtained a bachelor's degree or higher.

| Field of Study | # Graduates | % Graduates |
| Computers & Mathematics | 13 | 0.9% |
| Bio, Nature & Agricultural | 174 | 11.7% |
| Physical & Health Sciences | 5 | 0.3% |
| Psychology | 46 | 3.1% |
| Social Sciences | 187 | 12.6% |
| Engineering | 95 | 6.4% |
| Multidisciplinary Studies | 13 | 0.9% |
| Science & Technology | 142 | 9.6% |
| Business | 216 | 14.6% |
| Education | 220 | 14.8% |
| Literature & Languages | 91 | 6.1% |
| Liberal Arts & History | 39 | 2.6% |
| Visual & Performing Arts | 67 | 4.5% |
| Communications | 67 | 4.5% |
| Arts & Humanities | 106 | 7.2% |
| Total | 1,481 | 100.0% |
Transportation & Commute in Tucker County
Vehicle Availability by Sex in Tucker County
The most prevalent vehicle ownership categories in Tucker County are males with 2 vehicles (511, accounting for 32.8%) and females with 2 vehicles (640, making up 36.1%).

| Vehicles Available | Male | Female |
| No Vehicle | 29 (1.9%) | 16 (1.1%) |
| 1 Vehicle | 309 (19.8%) | 247 (17.5%) |
| 2 Vehicles | 511 (32.8%) | 640 (45.3%) |
| 3 Vehicles | 418 (26.8%) | 355 (25.1%) |
| 4 Vehicles | 255 (16.4%) | 128 (9.0%) |
| 5 or more Vehicles | 36 (2.3%) | 28 (2.0%) |
| Total | 1,558 (100.0%) | 1,414 (100.0%) |
Commute Time in Tucker County
The most frequently occuring commute durations in Tucker County are 5 to 9 minutes (396 commuters, 15.1%), 30 to 34 minutes (393 commuters, 14.9%), and 15 to 19 minutes (326 commuters, 12.4%).

| Commute Time | # Commuters | % Commuters |
| Less than 5 Minutes | 240 | 9.1% |
| 5 to 9 Minutes | 396 | 15.1% |
| 10 to 14 Minutes | 181 | 6.9% |
| 15 to 19 Minutes | 326 | 12.4% |
| 20 to 24 Minutes | 278 | 10.6% |
| 25 to 29 Minutes | 135 | 5.1% |
| 30 to 34 Minutes | 393 | 14.9% |
| 35 to 39 Minutes | 33 | 1.3% |
| 40 to 44 Minutes | 114 | 4.3% |
| 45 to 59 Minutes | 257 | 9.8% |
| 60 to 89 Minutes | 95 | 3.6% |
| 90 or more Minutes | 182 | 6.9% |
Commute Time by Sex in Tucker County
The most common commute times in Tucker County are 30 to 34 minutes (221 commuters, 15.7%) for males and 5 to 9 minutes (223 commuters, 18.2%) for females.

| Commute Time | Male | Female |
| Less than 5 Minutes | 108 (7.7%) | 132 (10.8%) |
| 5 to 9 Minutes | 173 (12.3%) | 223 (18.2%) |
| 10 to 14 Minutes | 89 (6.3%) | 92 (7.5%) |
| 15 to 19 Minutes | 148 (10.5%) | 178 (14.5%) |
| 20 to 24 Minutes | 107 (7.6%) | 171 (14.0%) |
| 25 to 29 Minutes | 66 (4.7%) | 69 (5.6%) |
| 30 to 34 Minutes | 221 (15.7%) | 172 (14.0%) |
| 35 to 39 Minutes | 25 (1.8%) | 8 (0.6%) |
| 40 to 44 Minutes | 87 (6.2%) | 27 (2.2%) |
| 45 to 59 Minutes | 153 (10.9%) | 104 (8.5%) |
| 60 to 89 Minutes | 52 (3.7%) | 43 (3.5%) |
| 90 or more Minutes | 175 (12.5%) | 7 (0.6%) |
Time of Departure to Work by Sex in Tucker County
The most frequent times of departure to work in Tucker County are 6:00 AM to 6:29 AM (219, 15.6%) for males and 7:00 AM to 7:29 AM (381, 31.1%) for females.

| Time of Departure | Male | Female |
| 12:00 AM to 4:59 AM | 108 (7.7%) | 0 (0.0%) |
| 5:00 AM to 5:29 AM | 127 (9.0%) | 3 (0.2%) |
| 5:30 AM to 5:59 AM | 187 (13.3%) | 5 (0.4%) |
| 6:00 AM to 6:29 AM | 219 (15.6%) | 76 (6.2%) |
| 6:30 AM to 6:59 AM | 160 (11.4%) | 73 (5.9%) |
| 7:00 AM to 7:29 AM | 181 (12.9%) | 381 (31.1%) |
| 7:30 AM to 7:59 AM | 76 (5.4%) | 247 (20.2%) |
| 8:00 AM to 8:29 AM | 73 (5.2%) | 121 (9.9%) |
| 8:30 AM to 8:59 AM | 28 (2.0%) | 17 (1.4%) |
| 9:00 AM to 9:59 AM | 38 (2.7%) | 69 (5.6%) |
| 10:00 AM to 10:59 AM | 25 (1.8%) | 95 (7.7%) |
| 11:00 AM to 11:59 AM | 21 (1.5%) | 13 (1.1%) |
| 12:00 PM to 3:59 PM | 44 (3.1%) | 44 (3.6%) |
| 4:00 PM to 11:59 PM | 117 (8.3%) | 82 (6.7%) |
| Total | 1,404 (100.0%) | 1,226 (100.0%) |
Housing Occupancy in Tucker County
Occupancy by Ownership in Tucker County
Of the total 2,836 dwellings in Tucker County, owner-occupied units account for 2,276 (80.2%), while renter-occupied units make up 560 (19.8%).

| Occupancy | # Housing Units | % Housing Units |
| Owner Occupied Housing Units | 2,276 | 80.2% |
| Renter-Occupied Housing Units | 560 | 19.8% |
| Total Occupied Housing Units | 2,836 | 100.0% |
Occupancy by Household Size in Tucker County

| Household Size | # Housing Units | % Housing Units |
| 1-Person Household | 984 | 34.7% |
| 2-Person Household | 1,072 | 37.8% |
| 3-Person Household | 387 | 13.7% |
| 4+ Person Household | 393 | 13.9% |
| Total Housing Units | 2,836 | 100.0% |
Occupancy by Ownership by Household Size in Tucker County

| Household Size | Owner-occupied | Renter-occupied |
| 1-Person Household | 720 (73.2%) | 264 (26.8%) |
| 2-Person Household | 955 (89.1%) | 117 (10.9%) |
| 3-Person Household | 311 (80.4%) | 76 (19.6%) |
| 4+ Person Household | 290 (73.8%) | 103 (26.2%) |
| Total Housing Units | 2,276 (80.2%) | 560 (19.8%) |
Occupancy by Educational Attainment in Tucker County

| Household Size | Owner-occupied | Renter-occupied |
| Less than High School | 215 (78.2%) | 60 (21.8%) |
| High School Diploma | 893 (76.8%) | 269 (23.2%) |
| College/Associate Degree | 501 (79.5%) | 129 (20.5%) |
| Bachelor's Degree or higher | 667 (86.7%) | 102 (13.3%) |
Occupancy by Age of Householder in Tucker County

| Age Bracket | # Households | % Households |
| Under 35 Years | 312 | 11.0% |
| 35 to 44 Years | 342 | 12.1% |
| 45 to 54 Years | 357 | 12.6% |
| 55 to 64 Years | 677 | 23.9% |
| 65 to 74 Years | 652 | 23.0% |
| 75 to 84 Years | 379 | 13.4% |
| 85 Years and Over | 117 | 4.1% |
| Total | 2,836 | 100.0% |
Housing Finances in Tucker County
Median Income by Occupancy in Tucker County

| Occupancy Type | # Households | Median Income |
| Owner-Occupied | 2,276 (80.2%) | $59,184 |
| Renter-Occupied | 560 (19.8%) | $32,578 |
| Average | 2,836 (100.0%) | $54,053 |
Occupancy by Householder Income Bracket in Tucker County

| Income Bracket | Owner-occupied | Renter-occupied |
| Less than $5,000 | 51 (2.2%) | 38 (6.8%) |
| $5,000 to $9,999 | 34 (1.5%) | 14 (2.5%) |
| $10,000 to $14,999 | 108 (4.8%) | 55 (9.8%) |
| $15,000 to $19,999 | 65 (2.9%) | 99 (17.7%) |
| $20,000 to $24,999 | 87 (3.8%) | 36 (6.4%) |
| $25,000 to $34,999 | 241 (10.6%) | 69 (12.3%) |
| $35,000 to $49,999 | 333 (14.6%) | 82 (14.6%) |
| $50,000 to $74,999 | 419 (18.4%) | 96 (17.1%) |
| $75,000 to $99,999 | 343 (15.1%) | 40 (7.1%) |
| $100,000 to $149,999 | 332 (14.6%) | 21 (3.7%) |
| $150,000 or more | 263 (11.6%) | 10 (1.8%) |
| Total | 2,276 (100.0%) | 560 (100.0%) |
Monthly Housing Cost Tiers in Tucker County

| Monthly Cost | Owner-occupied | Renter-occupied |
| Less than $300 | 485 (21.3%) | 37 (6.6%) |
| $300 to $499 | 562 (24.7%) | 40 (7.1%) |
| $500 to $799 | 442 (19.4%) | 104 (18.6%) |
| $800 to $999 | 233 (10.2%) | 103 (18.4%) |
| $1,000 to $1,499 | 368 (16.2%) | 59 (10.5%) |
| $1,500 to $1,999 | 161 (7.1%) | 15 (2.7%) |
| $2,000 to $2,499 | 5 (0.2%) | 0 (0.0%) |
| $2,500 to $2,999 | 3 (0.1%) | 0 (0.0%) |
| $3,000 or more | 17 (0.7%) | 0 (0.0%) |
| Total | 2,276 (100.0%) | 560 (100.0%) |
Physical Housing Characteristics in Tucker County
Housing Structures in Tucker County

| Structure Type | # Housing Units | % Housing Units |
| Single Unit, Detached | 2,418 | 85.3% |
| Single Unit, Attached | 13 | 0.5% |
| 2 Unit Apartments | 30 | 1.1% |
| 3 or 4 Unit Apartments | 38 | 1.3% |
| 5 to 9 Unit Apartments | 50 | 1.8% |
| 10 or more Apartments | 33 | 1.2% |
| Mobile Home / Other | 254 | 9.0% |
| Total | 2,836 | 100.0% |
Housing Structures by Occupancy in Tucker County

| Structure Type | Owner-occupied | Renter-occupied |
| Single Unit, Detached | 2,030 (84.0%) | 388 (16.1%) |
| Single Unit, Attached | 10 (76.9%) | 3 (23.1%) |
| 2 Unit Apartments | 12 (40.0%) | 18 (60.0%) |
| 3 or 4 Unit Apartments | 11 (28.9%) | 27 (71.1%) |
| 5 to 9 Unit Apartments | 0 (0.0%) | 50 (100.0%) |
| 10 or more Apartments | 0 (0.0%) | 33 (100.0%) |
| Mobile Home / Other | 213 (83.9%) | 41 (16.1%) |
| Total | 2,276 (80.2%) | 560 (19.8%) |
Housing Structures by Number of Rooms in Tucker County

| Number of Rooms | Owner-occupied | Renter-occupied |
| 1 Room | 15 (0.7%) | 0 (0.0%) |
| 2 or 3 Rooms | 47 (2.1%) | 77 (13.8%) |
| 4 or 5 Rooms | 767 (33.7%) | 193 (34.5%) |
| 6 or 7 Rooms | 790 (34.7%) | 186 (33.2%) |
| 8 or more Rooms | 657 (28.9%) | 104 (18.6%) |
| Total | 2,276 (100.0%) | 560 (100.0%) |
Housing Structure by Heating Type in Tucker County

| Heating Type | Owner-occupied | Renter-occupied |
| Utility Gas | 1,187 (52.1%) | 276 (49.3%) |
| Bottled, Tank, or LP Gas | 279 (12.3%) | 23 (4.1%) |
| Electricity | 354 (15.5%) | 157 (28.0%) |
| Fuel Oil or Kerosene | 39 (1.7%) | 30 (5.4%) |
| Coal or Coke | 33 (1.5%) | 9 (1.6%) |
| All other Fuels | 383 (16.8%) | 65 (11.6%) |
| No Fuel Used | 1 (0.0%) | 0 (0.0%) |
| Total | 2,276 (100.0%) | 560 (100.0%) |
Household Vehicle Usage in Tucker County

| Vehicles per Household | Owner-occupied | Renter-occupied |
| No Vehicle | 180 (7.9%) | 97 (17.3%) |
| 1 Vehicle | 682 (30.0%) | 265 (47.3%) |
| 2 Vehicles | 832 (36.6%) | 162 (28.9%) |
| 3 or more Vehicles | 582 (25.6%) | 36 (6.4%) |
| Total | 2,276 (100.0%) | 560 (100.0%) |
Real Estate & Mortgages in Tucker County
Real Estate and Mortgage Overview in Tucker County
| Characteristic | Without Mortgage | With Mortgage |
| Housing Units | 1,302 | 974 |
| Median Property Value | $126,000 | $146,700 |
| Median Household Income | $53,857 | $204 |
| Monthly Housing Costs | $343 | $13 |
| Real Estate Taxes | $482 | $15 |
Property Value by Mortgage Status in Tucker County

| Property Value | Without Mortgage | With Mortgage |
| Less than $50,000 | 221 (17.0%) | 54 (5.5%) |
| $50,000 to $99,999 | 274 (21.0%) | 254 (26.1%) |
| $100,000 to $299,999 | 641 (49.2%) | 535 (54.9%) |
| $300,000 to $499,999 | 113 (8.7%) | 62 (6.4%) |
| $500,000 to $749,999 | 36 (2.8%) | 26 (2.7%) |
| $750,000 to $999,999 | 5 (0.4%) | 36 (3.7%) |
| $1,000,000 or more | 12 (0.9%) | 7 (0.7%) |
| Total | 1,302 (100.0%) | 974 (100.0%) |
Household Income by Mortgage Status in Tucker County

| Household Income | Without Mortgage | With Mortgage |
| Less than $10,000 | 49 (3.8%) | 17 (1.8%) |
| $10,000 to $24,999 | 220 (16.9%) | 36 (3.7%) |
| $25,000 to $34,999 | 151 (11.6%) | 40 (4.1%) |
| $35,000 to $49,999 | 194 (14.9%) | 90 (9.2%) |
| $50,000 to $74,999 | 245 (18.8%) | 139 (14.3%) |
| $75,000 to $99,999 | 194 (14.9%) | 174 (17.9%) |
| $100,000 to $149,999 | 190 (14.6%) | 149 (15.3%) |
| $150,000 or more | 59 (4.5%) | 142 (14.6%) |
| Total | 1,302 (100.0%) | 974 (100.0%) |
Property Value to Household Income Ratio in Tucker County

| Value-to-Income Ratio | Without Mortgage | With Mortgage |
| Less than 2.0x | 500 (38.4%) | 76,818 (7,886.9%) |
| 2.0x to 2.9x | 233 (17.9%) | 561 (57.6%) |
| 3.0x to 3.9x | 149 (11.4%) | 163 (16.7%) |
| 4.0x or more | 414 (31.8%) | 76 (7.8%) |
| Total | 1,302 (100.0%) | 974 (100.0%) |
Real Estate Taxes by Mortgage Status in Tucker County

| Property Taxes | Without Mortgage | With Mortgage |
| Less than $800 | 862 (66.2%) | 23 (2.4%) |
| $800 to $1,499 | 229 (17.6%) | 651 (66.8%) |
| $800 to $1,499 | 119 (9.1%) | 245 (25.2%) |
| Total | 1,302 (100.0%) | 974 (100.0%) |
Health & Disability in Tucker County
Health Insurance Coverage by Age in Tucker County

| Age Bracket | With Coverage | Without Coverage |
| Under 6 Years | 286 (96.3%) | 11 (3.7%) |
| 6 to 18 Years | 708 (96.2%) | 28 (3.8%) |
| 19 to 25 Years | 360 (99.2%) | 3 (0.8%) |
| 26 to 34 Years | 478 (76.4%) | 148 (23.6%) |
| 35 to 44 Years | 700 (92.3%) | 58 (7.6%) |
| 45 to 54 Years | 883 (94.7%) | 49 (5.3%) |
| 55 to 64 Years | 1,100 (96.6%) | 39 (3.4%) |
| 65 to 74 Years | 1,011 (99.6%) | 4 (0.4%) |
| 75 Years and older | 726 (100.0%) | 0 (0.0%) |
| Total | 6,252 (94.8%) | 340 (5.2%) |
Health Insurance Coverage by Citizenship Status in Tucker County

| Citizenship Status | With Coverage | Without Coverage |
| Native Born | 286 (96.3%) | 11 (3.7%) |
| Foreign Born, Citizen | 708 (96.2%) | 28 (3.8%) |
| Foreign Born, not a Citizen | 360 (99.2%) | 3 (0.8%) |
Health Insurance Coverage by Household Income in Tucker County

| Household Income | With Coverage | Without Coverage |
| Under $25,000 | 801 (97.5%) | 21 (2.5%) |
| $25,000 to $49,999 | 1,413 (93.5%) | 98 (6.5%) |
| $50,000 to $74,999 | 1,197 (91.4%) | 113 (8.6%) |
| $75,000 to $99,999 | 982 (98.2%) | 18 (1.8%) |
| $100,000 and over | 1,859 (95.4%) | 90 (4.6%) |
Public vs Private Health Insurance Coverage by Age in Tucker County

| Age Bracket | Public Insurance | Private Insurance |
| Under 6 | 147 (49.5%) | 158 (53.2%) |
| 6 to 18 Years | 385 (52.3%) | 387 (52.6%) |
| 19 to 25 Years | 55 (15.1%) | 319 (87.9%) |
| 25 to 34 Years | 194 (31.0%) | 298 (47.6%) |
| 35 to 44 Years | 172 (22.7%) | 542 (71.5%) |
| 45 to 54 Years | 244 (26.2%) | 721 (77.4%) |
| 55 to 64 Years | 348 (30.5%) | 845 (74.2%) |
| 65 to 74 Years | 999 (98.4%) | 680 (67.0%) |
| 75 Years and over | 721 (99.3%) | 486 (66.9%) |
| Total | 3,265 (49.5%) | 4,436 (67.3%) |
Disability Status by Sex by Age in Tucker County

| Age Bracket | Male | Female |
| Under 5 Years | 0 (0.0%) | 7 (5.4%) |
| 5 to 17 Years | 26 (7.9%) | 30 (8.9%) |
| 18 to 34 Years | 48 (8.6%) | 74 (13.8%) |
| 35 to 64 Years | 261 (18.3%) | 330 (23.5%) |
| 65 to 74 Years | 124 (24.3%) | 113 (22.4%) |
| 75 Years and over | 264 (74.0%) | 172 (46.6%) |
Disability Class by Sex by Age in Tucker County
Disability Class: Hearing Difficulty

| Age Bracket | Male | Female |
| Under 5 Years | 0 (0.0%) | 7 (5.4%) |
| 5 to 17 Years | 0 (0.0%) | 0 (0.0%) |
| 18 to 34 Years | 0 (0.0%) | 30 (5.6%) |
| 35 to 64 Years | 140 (9.8%) | 46 (3.3%) |
| 65 to 74 Years | 62 (12.2%) | 24 (4.8%) |
| 75 Years and over | 198 (55.5%) | 76 (20.6%) |
Disability Class: Vision Difficulty

| Age Bracket | Male | Female |
| Under 5 Years | 0 (0.0%) | 0 (0.0%) |
| 5 to 17 Years | 0 (0.0%) | 8 (2.4%) |
| 18 to 34 Years | 0 (0.0%) | 20 (3.7%) |
| 35 to 64 Years | 27 (1.9%) | 43 (3.1%) |
| 65 to 74 Years | 3 (0.6%) | 16 (3.2%) |
| 75 Years and over | 31 (8.7%) | 23 (6.2%) |
Disability Class: Cognitive Difficulty

| Age Bracket | Male | Female |
| 5 to 17 Years | 26 (7.9%) | 30 (8.9%) |
| 18 to 34 Years | 42 (7.5%) | 40 (7.4%) |
| 35 to 64 Years | 143 (10.0%) | 90 (6.4%) |
| 65 to 74 Years | 28 (5.5%) | 32 (6.3%) |
| 75 Years and over | 73 (20.4%) | 52 (14.1%) |
Disability Class: Ambulatory Difficulty

| Age Bracket | Male | Female |
| 5 to 17 Years | 0 (0.0%) | 8 (2.4%) |
| 18 to 34 Years | 6 (1.1%) | 8 (1.5%) |
| 35 to 64 Years | 70 (4.9%) | 216 (15.4%) |
| 65 to 74 Years | 49 (9.6%) | 102 (20.2%) |
| 75 Years and over | 90 (25.2%) | 127 (34.4%) |
Disability Class: Self-Care Difficulty

| Age Bracket | Male | Female |
| 5 to 17 Years | 0 (0.0%) | 8 (2.4%) |
| 18 to 34 Years | 13 (2.3%) | 8 (1.5%) |
| 35 to 64 Years | 71 (5.0%) | 68 (4.9%) |
| 65 to 74 Years | 13 (2.5%) | 31 (6.1%) |
| 75 Years and over | 48 (13.5%) | 44 (11.9%) |
Technology Access in Tucker County
Computing Device Access in Tucker County

| Device Type | # Households | % Households |
| Desktop or Laptop | 1,950 | 68.8% |
| Smartphone | 2,081 | 73.4% |
| Tablet | 1,532 | 54.0% |
| No Computing Device | 402 | 14.2% |
| Total | 2,836 | 100.0% |
Internet Access in Tucker County

| Internet Type | # Households | % Households |
| Dial-Up Internet | 3 | 0.1% |
| Broadband Home | 1,859 | 65.5% |
| Cellular Data Only | 206 | 7.3% |
| Satellite Internet | 167 | 5.9% |
| No Internet | 630 | 22.2% |
| Total | 2,836 | 100.0% |
Tucker County Summary
Tucker County, West Virginia is located in the eastern part of the state, in the Appalachian Mountains. It is bordered by Preston County to the north, Randolph County to the east, and Grant County to the south. The county seat is Parsons, and the county was created in 1856 from parts of Randolph and Barbour counties.
Tucker County has a total area of 441 square miles, of which 439 square miles is land and 2 square miles is water. The county is home to the highest point in the state, Spruce Knob, which has an elevation of 4,863 feet. The county is also home to the Blackwater Canyon, a National Wild and Scenic River.
The population of Tucker County was 7,141 in 2000, a decrease of 4.3% from the 1990 census. The population density was 16 people per square mile. The racial makeup of the county was 98.3% White, 0.3% African American, 0.2% Native American, 0.2% Asian, 0.1% Pacific Islander, 0.2% from other races, and 0.7% from two or more races. Hispanic or Latino of any race were 0.5% of the population.
The median income for a household in the county was $25,944, and the median income for a family was $31,944. Males had a median income of $25,000 versus $19,964 for females. The per capita income for the county was $14,845. About 16.2% of families and 20.2% of the population were below the poverty line, including 28.2% of those under age 18 and 11.2% of those age 65 or over.
The economy of Tucker County is largely based on tourism, with the Blackwater Canyon and Spruce Knob being popular attractions. The county is also home to several ski resorts, including Canaan Valley Resort and Timberline Four Seasons Resort. The county is also home to several state parks, including Blackwater Falls State Park and Canaan Valley State Park.
The county is served by the Tucker County School System, which consists of four elementary schools, one middle school, and one high school. The county is also home to Davis & Elkins College, a private liberal arts college.
Tucker County is a rural county with a rich history and culture. It is home to some of the most beautiful scenery in the state, and its economy is largely based on tourism. The county is served by a strong school system, and is home to a private college. With its unique geography and culture, Tucker County is a great place to live and visit.
Common Questions
What is the Total Population of Tucker County?
Total Population of Tucker County is 6,747.
What is the Total Male Population of Tucker County?
Total Male Population of Tucker County is 3,402.
What is the Total Female Population of Tucker County?
Total Female Population of Tucker County is 3,345.
What is the Ratio of Males per 100 Females in Tucker County?
There are 101.70 Males per 100 Females in Tucker County.
What is the Ratio of Females per 100 Males in Tucker County?
There are 98.32 Females per 100 Males in Tucker County.
What is the Median Population Age in Tucker County?
Median Population Age in Tucker County is 50.9 Years.
What is the Average Family Size in Tucker County
Average Family Size in Tucker County is 3.0 People.
What is the Average Household Size in Tucker County
Average Household Size in Tucker County is 2.3 People.
What is Per Capita Income in Tucker County?
Per Capita income in Tucker County is $32,590.
What is the Median Family Income in Tucker County?
Median Family Income in Tucker County is $69,038.
What is the Median Household income in Tucker County?
Median Household Income in Tucker County is $54,053.
What is Income or Wage Gap in Tucker County?
Income or Wage Gap in Tucker County is 22.6%.
Women in Tucker County earn 77.4 cents for every dollar earned by a man.
What is Inequality or Gini Index in Tucker County?
Inequality or Gini Index in Tucker County is 0.44.
How Large is the Labor Force in Tucker County?
There are 3,210 People in the Labor Forcein in Tucker County.
What is the Percentage of People in the Labor Force in Tucker County?
54.1% of People are in the Labor Force in Tucker County.
What is the Unemployment Rate in Tucker County?
Unemployment Rate in Tucker County is 6.6%.