Taylor County, WV
Taylor County Map

Taylor County Overview
16,602
TOTAL POPULATION
8,283
MALE POPULATION
8,319
FEMALE POPULATION
99.57
MALES / 100 FEMALES
100.43
FEMALES / 100 MALES
44.3
MEDIAN AGE
3.0
AVG FAMILY SIZE
2.4
AVG HOUSEHOLD SIZE
$30,095
PER CAPITA INCOME
$68,553
AVG FAMILY INCOME
$52,946
AVG HOUSEHOLD INCOME
36.5%
WAGE / INCOME GAP [ % ]
63.5¢/ $1
WAGE / INCOME GAP [ $ ]
$13,278
FAMILY INCOME DEFICIT
0.44
INEQUALITY / GINI INDEX
7,373
LABOR FORCE [ PEOPLE ]
54.2%
PERCENT IN LABOR FORCE
9.3%
UNEMPLOYMENT RATE
Taylor County Area Codes
Race in Taylor County
The most populous races in Taylor County are White / Caucasian (15,954 | 96.1%), Two or more Races (413 | 2.5%), and Black / African American (194 | 1.2%).

| Race | # Population | % Population |
| Asian | 13 | 0.1% |
| Black / African American | 194 | 1.2% |
| Hawaiian / Pacific | 0 | 0.0% |
| Hispanic or Latino | 161 | 1.0% |
| Native / Alaskan | 28 | 0.2% |
| White / Caucasian | 15,954 | 96.1% |
| Two or more Races | 413 | 2.5% |
| Some other Race | 0 | 0.0% |
| Total | 16,602 | 100.0% |
Ancestry in Taylor County
The most populous ancestries reported in Taylor County are German (3,640 | 21.9%), American (3,150 | 19.0%), Irish (2,192 | 13.2%), English (1,637 | 9.9%), and Italian (1,106 | 6.7%), together accounting for 70.6% of all Taylor County residents.

| Ancestry | # Population | % Population |
| African | 4 | 0.0% |
| American | 3,150 | 19.0% |
| Arab | 24 | 0.1% |
| Austrian | 29 | 0.2% |
| Blackfeet | 3 | 0.0% |
| British | 56 | 0.3% |
| Cherokee | 34 | 0.2% |
| Choctaw | 18 | 0.1% |
| Cuban | 3 | 0.0% |
| Delaware | 20 | 0.1% |
| Dutch | 298 | 1.8% |
| Eastern European | 9 | 0.1% |
| English | 1,637 | 9.9% |
| Ethiopian | 31 | 0.2% |
| European | 50 | 0.3% |
| French | 383 | 2.3% |
| German | 3,640 | 21.9% |
| Greek | 29 | 0.2% |
| Hungarian | 120 | 0.7% |
| Indian (Asian) | 13 | 0.1% |
| Irish | 2,192 | 13.2% |
| Italian | 1,106 | 6.7% |
| Korean | 38 | 0.2% |
| Lebanese | 24 | 0.1% |
| Mexican | 100 | 0.6% |
| Northern European | 16 | 0.1% |
| Norwegian | 72 | 0.4% |
| Polish | 163 | 1.0% |
| Puerto Rican | 22 | 0.1% |
| Romanian | 17 | 0.1% |
| Russian | 11 | 0.1% |
| Scandinavian | 3 | 0.0% |
| Scotch-Irish | 398 | 2.4% |
| Scottish | 449 | 2.7% |
| Slovak | 40 | 0.2% |
| Spanish | 25 | 0.2% |
| Subsaharan African | 35 | 0.2% |
| Swiss | 8 | 0.1% |
| Thai | 3 | 0.0% |
| Welsh | 85 | 0.5% | View All 40 Rows |
Immigrants in Taylor County
The most numerous immigrant groups reported in Taylor County came from Africa (23 | 0.1%), Eastern Africa (23 | 0.1%), Ethiopia (23 | 0.1%), Canada (17 | 0.1%), and Eastern Europe (14 | 0.1%), together accounting for 0.6% of all Taylor County residents.

| Immigration Origin | # Population | % Population |
| Africa | 23 | 0.1% |
| Asia | 13 | 0.1% |
| Canada | 17 | 0.1% |
| China | 13 | 0.1% |
| Eastern Africa | 23 | 0.1% |
| Eastern Asia | 13 | 0.1% |
| Eastern Europe | 14 | 0.1% |
| Ethiopia | 23 | 0.1% |
| Europe | 14 | 0.1% |
| Poland | 14 | 0.1% | View All 10 Rows |
Sex and Age in Taylor County
Sex and Age in Taylor County
The most populous age groups in Taylor County are 55 to 59 Years (843 | 10.2%) for men and 55 to 59 Years (630 | 7.6%) for women.

| Age Bracket | Male | Female |
| Under 5 Years | 379 (4.6%) | 425 (5.1%) |
| 5 to 9 Years | 475 (5.7%) | 384 (4.6%) |
| 10 to 14 Years | 506 (6.1%) | 601 (7.2%) |
| 15 to 19 Years | 488 (5.9%) | 451 (5.4%) |
| 20 to 24 Years | 372 (4.5%) | 334 (4.0%) |
| 25 to 29 Years | 535 (6.5%) | 460 (5.5%) |
| 30 to 34 Years | 537 (6.5%) | 512 (6.1%) |
| 35 to 39 Years | 454 (5.5%) | 365 (4.4%) |
| 40 to 44 Years | 593 (7.2%) | 618 (7.4%) |
| 45 to 49 Years | 557 (6.7%) | 546 (6.6%) |
| 50 to 54 Years | 593 (7.2%) | 583 (7.0%) |
| 55 to 59 Years | 843 (10.2%) | 630 (7.6%) |
| 60 to 64 Years | 378 (4.6%) | 579 (7.0%) |
| 65 to 69 Years | 601 (7.3%) | 623 (7.5%) |
| 70 to 74 Years | 399 (4.8%) | 437 (5.2%) |
| 75 to 79 Years | 276 (3.3%) | 314 (3.8%) |
| 80 to 84 Years | 192 (2.3%) | 203 (2.4%) |
| 85 Years and over | 105 (1.3%) | 254 (3.0%) |
| Total | 8,283 (100.0%) | 8,319 (100.0%) |
Families and Households in Taylor County
Median Family Size in Taylor County
The median family size in Taylor County is 2.99 persons per family, with single male/father families (282 | 6.5%) accounting for the largest median family size of 3.15 persons per family. On the other hand, single female/mother families (737 | 17.1%) represent the smallest median family size with 2.62 persons per family.

| Family Type | # Families | Family Size |
| Married-Couple | 3,294 (76.4%) | 3.07 |
| Single Male/Father | 282 (6.5%) | 3.15 |
| Single Female/Mother | 737 (17.1%) | 2.62 |
| Total Families | 4,313 (100.0%) | 2.99 |
Median Household Size in Taylor County
The median household size in Taylor County is 2.42 persons per household, with single male/father households (282 | 4.2%) accounting for the largest median household size of 3.93 persons per household. non-family households (2,389 | 35.6%) represent the smallest median household size with 1.16 persons per household.

| Household Type | # Households | Household Size |
| Married-Couple | 3,294 (49.1%) | 3.07 |
| Single Male/Father | 282 (4.2%) | 3.93 |
| Single Female/Mother | 737 (11.0%) | 2.96 |
| Non-family | 2,389 (35.6%) | 1.16 |
| Total Households | 6,702 (100.0%) | 2.42 |
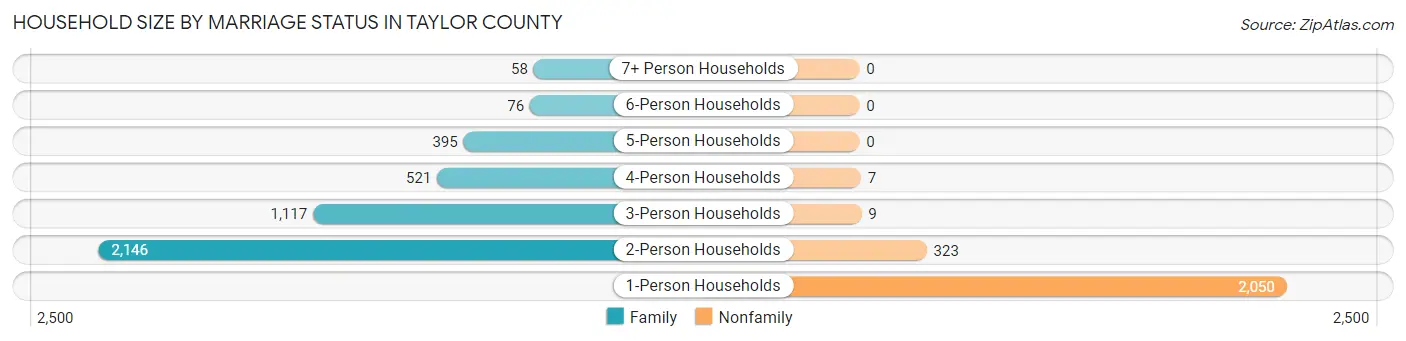
Household Size by Marriage Status in Taylor County
Out of a total of 6,702 households in Taylor County, 4,313 (64.3%) are family households, while 2,389 (35.6%) are nonfamily households. The most numerous type of family households are 2-person households, comprising 2,146, and the most common type of nonfamily households are 1-person households, comprising 2,050.
| Household Size | Family Households | Nonfamily Households |
| 1-Person Households | - | 2,050 (30.6%) |
| 2-Person Households | 2,146 (32.0%) | 323 (4.8%) |
| 3-Person Households | 1,117 (16.7%) | 9 (0.1%) |
| 4-Person Households | 521 (7.8%) | 7 (0.1%) |
| 5-Person Households | 395 (5.9%) | 0 (0.0%) |
| 6-Person Households | 76 (1.1%) | 0 (0.0%) |
| 7+ Person Households | 58 (0.9%) | 0 (0.0%) |
| Total | 4,313 (64.3%) | 2,389 (35.6%) |
Female Fertility in Taylor County
Fertility by Age in Taylor County
Average fertility rate in Taylor County is 51.0 births per 1,000 women. Women in the age bracket of 20 to 34 years have the highest fertility rate with 90.0 births per 1,000 women. Women in the age bracket of 20 to 34 years acount for 66.9% of all women with births.

| Age Bracket | Women with Births | Births / 1,000 Women |
| 15 to 19 years | 15 (8.6%) | 33.0 |
| 20 to 34 years | 117 (66.9%) | 90.0 |
| 35 to 50 years | 43 (24.6%) | 26.0 |
| Total | 175 (100.0%) | 51.0 |
Fertility by Age by Marriage Status in Taylor County
78.9% of women with births (175) in Taylor County are married. The highest percentage of unmarried women with births falls into 15 to 19 years age bracket with 100.0% of them unmarried at the time of birth, while the lowest percentage of unmarried women with births belong to 35 to 50 years age bracket with 0.0% of them unmarried.

| Age Bracket | Married | Unmarried |
| 15 to 19 years | 0 (0.0%) | 15 (100.0%) |
| 20 to 34 years | 95 (81.2%) | 22 (18.8%) |
| 35 to 50 years | 43 (100.0%) | 0 (0.0%) |
| Total | 138 (78.9%) | 37 (21.1%) |
Fertility by Education in Taylor County

| Educational Attainment | Women with Births | Births / 1,000 Women |
| Less than High School | 38 (21.7%) | 55.0 |
| High School Diploma | 40 (22.9%) | 41.0 |
| College or Associate's Degree | 43 (24.6%) | 43.0 |
| Bachelor's Degree | 54 (30.9%) | 96.0 |
| Graduate Degree | 0 (0.0%) | 0.0 |
| Total | 175 (100.0%) | 51.0 |
Fertility by Education by Marriage Status in Taylor County
21.1% of women with births in Taylor County are unmarried. Women with the educational attainment of college or associate's degree are most likely to be married with 100.0% of them married at childbirth, while women with the educational attainment of high school diploma are least likely to be married with 55.0% of them unmarried at childbirth.

| Educational Attainment | Married | Unmarried |
| Less than High School | 23 (60.5%) | 15 (39.5%) |
| High School Diploma | 18 (45.0%) | 22 (55.0%) |
| College or Associate's Degree | 43 (100.0%) | 0 (0.0%) |
| Bachelor's Degree | 54 (100.0%) | 0 (0.0%) |
| Graduate Degree | 0 (0.0%) | 0 (0.0%) |
| Total | 138 (78.9%) | 37 (21.1%) |
Income in Taylor County
Income Overview in Taylor County
Per Capita Income in Taylor County is $30,095, while median incomes of families and households are $68,553 and $52,946 respectively.
| Characteristic | Number | Measure |
| Per Capita Income | 16,602 | $30,095 |
| Median Family Income | 4,313 | $68,553 |
| Mean Family Income | 4,313 | $86,475 |
| Median Household Income | 6,702 | $52,946 |
| Mean Household Income | 6,702 | $72,801 |
| Income Deficit | 4,313 | $13,278 |
| Wage / Income Gap (%) | 16,602 | 36.48% |
| Wage / Income Gap ($) | 16,602 | 63.52¢ per $1 |
| Gini / Inequality Index | 16,602 | 0.44 |
Earnings by Sex in Taylor County
Average Earnings in Taylor County are $34,453, $44,739 for men and $28,419 for women, a difference of 36.5%.

| Sex | Number | Average Earnings |
| Male | 4,131 (53.2%) | $44,739 |
| Female | 3,632 (46.8%) | $28,419 |
| Total | 7,763 (100.0%) | $34,453 |
Earnings by Sex by Income Bracket in Taylor County
The most common earnings brackets in Taylor County are $100,000+ for men (658 | 15.9%) and $25,000 to $29,999 for women (577 | 15.9%).

| Income | Male | Female |
| $2,499 or less | 223 (5.4%) | 121 (3.3%) |
| $2,500 to $4,999 | 207 (5.0%) | 137 (3.8%) |
| $5,000 to $7,499 | 129 (3.1%) | 123 (3.4%) |
| $7,500 to $9,999 | 207 (5.0%) | 105 (2.9%) |
| $10,000 to $12,499 | 239 (5.8%) | 141 (3.9%) |
| $12,500 to $14,999 | 46 (1.1%) | 167 (4.6%) |
| $15,000 to $17,499 | 122 (2.9%) | 143 (3.9%) |
| $17,500 to $19,999 | 34 (0.8%) | 138 (3.8%) |
| $20,000 to $22,499 | 113 (2.7%) | 211 (5.8%) |
| $22,500 to $24,999 | 64 (1.5%) | 249 (6.9%) |
| $25,000 to $29,999 | 148 (3.6%) | 577 (15.9%) |
| $30,000 to $34,999 | 183 (4.4%) | 95 (2.6%) |
| $35,000 to $39,999 | 159 (3.8%) | 293 (8.1%) |
| $40,000 to $44,999 | 203 (4.9%) | 121 (3.3%) |
| $45,000 to $49,999 | 180 (4.4%) | 372 (10.2%) |
| $50,000 to $54,999 | 75 (1.8%) | 120 (3.3%) |
| $55,000 to $64,999 | 245 (5.9%) | 132 (3.6%) |
| $65,000 to $74,999 | 317 (7.7%) | 65 (1.8%) |
| $75,000 to $99,999 | 579 (14.0%) | 76 (2.1%) |
| $100,000+ | 658 (15.9%) | 246 (6.8%) |
| Total | 4,131 (100.0%) | 3,632 (100.0%) |
Earnings by Sex by Educational Attainment in Taylor County
Average earnings in Taylor County are $51,136 for men and $29,124 for women, a difference of 43.0%. Men with an educational attainment of bachelor's degree enjoy the highest average annual earnings of $91,017, while those with less than high school education earn the least with $15,372. Women with an educational attainment of graduate degree earn the most with the average annual earnings of $90,350, while those with less than high school education have the smallest earnings of $19,722.

| Educational Attainment | Male Income | Female Income |
| Less than High School | $15,372 | $19,722 |
| High School Diploma | $43,775 | $24,167 |
| College or Associate's Degree | $59,452 | $29,297 |
| Bachelor's Degree | $91,017 | $45,208 |
| Graduate Degree | $72,895 | $90,350 |
| Total | $51,136 | $29,124 |
Family Income in Taylor County
Family Income Brackets in Taylor County
According to the Taylor County family income data, there are 815 families falling into the $100,000 to $149,999 income range, which is the most common income bracket and makes up 18.9% of all families. Conversely, the $10,000 to $14,999 income bracket is the least frequent group with only 147 families (3.4%) belonging to this category.

| Income Bracket | # Families | % Families |
| Less than $10,000 | 181 | 4.2% |
| $10,000 to $14,999 | 147 | 3.4% |
| $15,000 to $24,999 | 168 | 3.9% |
| $25,000 to $34,999 | 505 | 11.7% |
| $35,000 to $49,999 | 604 | 14.0% |
| $50,000 to $74,999 | 738 | 17.1% |
| $75,000 to $99,999 | 522 | 12.1% |
| $100,000 to $149,999 | 815 | 18.9% |
| $150,000 to $199,999 | 336 | 7.8% |
| $200,000+ | 293 | 6.8% |
Family Income by Famaliy Size in Taylor County
6-person families (41 | 0.9%) account for the highest median family income in Taylor County with $90,529 per family, while 2-person families (2,390 | 55.4%) have the highest median income of $29,772 per family member.

| Income Bracket | # Families | Median Income |
| 2-Person Families | 2,390 (55.4%) | $59,545 |
| 3-Person Families | 977 (22.7%) | $84,948 |
| 4-Person Families | 500 (11.6%) | $85,682 |
| 5-Person Families | 347 (8.1%) | $0 |
| 6-Person Families | 41 (0.9%) | $90,529 |
| 7+ Person Families | 58 (1.3%) | $0 |
| Total | 4,313 (100.0%) | $68,553 |
Family Income by Number of Earners in Taylor County
The median family income in Taylor County is $68,553, with families comprising 3+ earners (380) having the highest median family income of $138,095, while families with no earners (838) have the lowest median family income of $47,719, accounting for 8.8% and 19.4% of families, respectively.

| Number of Earners | # Families | Median Income |
| No Earners | 838 (19.4%) | $47,719 |
| 1 Earner | 1,734 (40.2%) | $48,125 |
| 2 Earners | 1,361 (31.6%) | $130,243 |
| 3+ Earners | 380 (8.8%) | $138,095 |
| Total | 4,313 (100.0%) | $68,553 |
Household Income in Taylor County
Household Income Brackets in Taylor County
With 1,146 households falling in the category, the $50,000 to $74,999 income range is the most frequent in Taylor County, accounting for 17.1% of all households. In contrast, only 308 households (4.6%) fall into the $200,000+ income bracket, making it the least populous group.

| Income Bracket | # Households | % Households |
| Less than $10,000 | 349 | 5.2% |
| $10,000 to $14,999 | 409 | 6.1% |
| $15,000 to $24,999 | 724 | 10.8% |
| $25,000 to $34,999 | 764 | 11.4% |
| $35,000 to $49,999 | 938 | 14.0% |
| $50,000 to $74,999 | 1,146 | 17.1% |
| $75,000 to $99,999 | 610 | 9.1% |
| $100,000 to $149,999 | 1,086 | 16.2% |
| $150,000 to $199,999 | 369 | 5.5% |
| $200,000+ | 308 | 4.6% |
Household Income by Householder Age in Taylor County
The median household income in Taylor County is $52,946, with the highest median household income of $73,295 found in the 45 to 64 years age bracket for the primary householder. A total of 2,671 households (39.9%) fall into this category. Meanwhile, the 15 to 24 years age bracket for the primary householder has the lowest median household income of $0, with 81 households (1.2%) in this group.

| Income Bracket | # Households | Median Income |
| 15 to 24 Years | 81 (1.2%) | $0 |
| 25 to 44 Years | 1,735 (25.9%) | $49,479 |
| 45 to 64 Years | 2,671 (39.9%) | $73,295 |
| 65+ Years | 2,215 (33.1%) | $47,584 |
| Total | 6,702 (100.0%) | $52,946 |
Poverty in Taylor County
Income Below Poverty by Sex and Age in Taylor County
With 18.5% poverty level for males and 15.2% for females among the residents of Taylor County, 6 to 11 year old males and 15 year old females are the most vulnerable to poverty, with 231 males (39.2%) and 65 females (59.1%) in their respective age groups living below the poverty level.

| Age Bracket | Male | Female |
| Under 5 Years | 105 (27.7%) | 96 (22.6%) |
| 5 Years | 11 (12.1%) | 4 (13.3%) |
| 6 to 11 Years | 231 (39.2%) | 149 (29.3%) |
| 12 to 14 Years | 70 (23.8%) | 38 (9.3%) |
| 15 Years | 26 (21.8%) | 65 (59.1%) |
| 16 and 17 Years | 13 (7.0%) | 15 (8.7%) |
| 18 to 24 Years | 161 (29.2%) | 213 (42.4%) |
| 25 to 34 Years | 165 (17.5%) | 238 (24.5%) |
| 35 to 44 Years | 185 (18.7%) | 116 (12.0%) |
| 45 to 54 Years | 183 (16.8%) | 152 (13.5%) |
| 55 to 64 Years | 241 (20.4%) | 88 (7.3%) |
| 65 to 74 Years | 50 (5.1%) | 19 (1.8%) |
| 75 Years and over | 28 (5.2%) | 60 (8.2%) |
| Total | 1,469 (18.5%) | 1,253 (15.2%) |
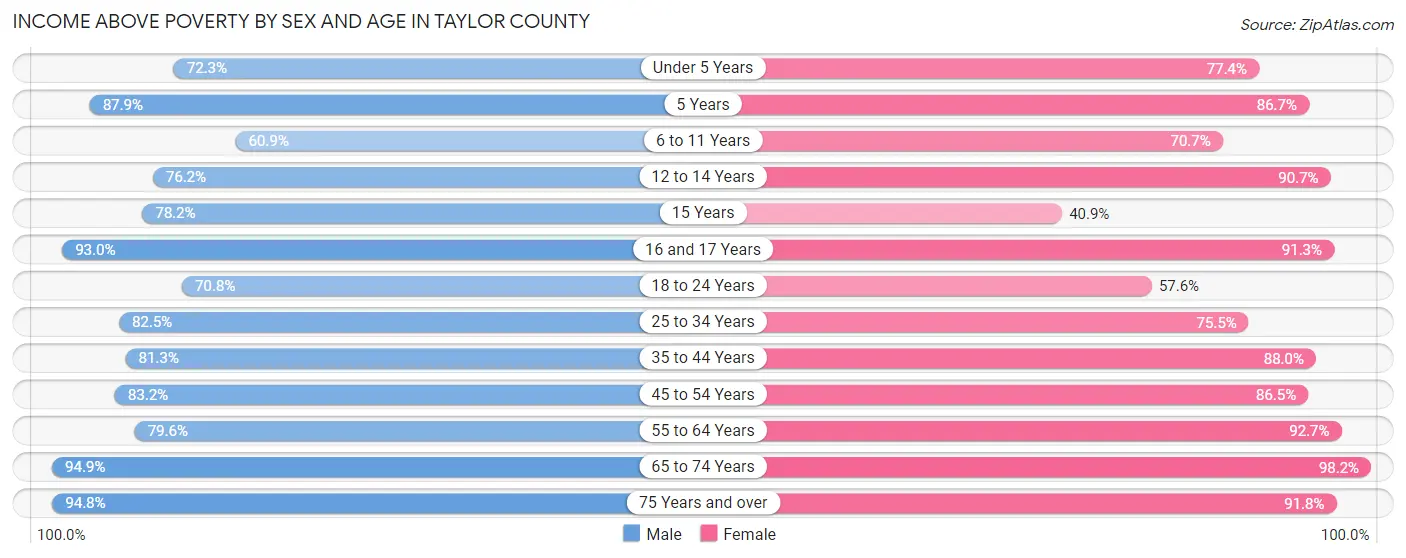
Income Above Poverty by Sex and Age in Taylor County
According to the poverty statistics in Taylor County, males aged 65 to 74 years and females aged 65 to 74 years are the age groups that are most secure financially, with 94.9% of males and 98.2% of females in these age groups living above the poverty line.
| Age Bracket | Male | Female |
| Under 5 Years | 274 (72.3%) | 329 (77.4%) |
| 5 Years | 80 (87.9%) | 26 (86.7%) |
| 6 to 11 Years | 359 (60.9%) | 359 (70.7%) |
| 12 to 14 Years | 224 (76.2%) | 370 (90.7%) |
| 15 Years | 93 (78.1%) | 45 (40.9%) |
| 16 and 17 Years | 173 (93.0%) | 158 (91.3%) |
| 18 to 24 Years | 390 (70.8%) | 289 (57.6%) |
| 25 to 34 Years | 777 (82.5%) | 734 (75.5%) |
| 35 to 44 Years | 802 (81.3%) | 849 (88.0%) |
| 45 to 54 Years | 908 (83.2%) | 977 (86.5%) |
| 55 to 64 Years | 938 (79.6%) | 1,121 (92.7%) |
| 65 to 74 Years | 929 (94.9%) | 1,041 (98.2%) |
| 75 Years and over | 515 (94.8%) | 670 (91.8%) |
| Total | 6,462 (81.5%) | 6,968 (84.8%) |
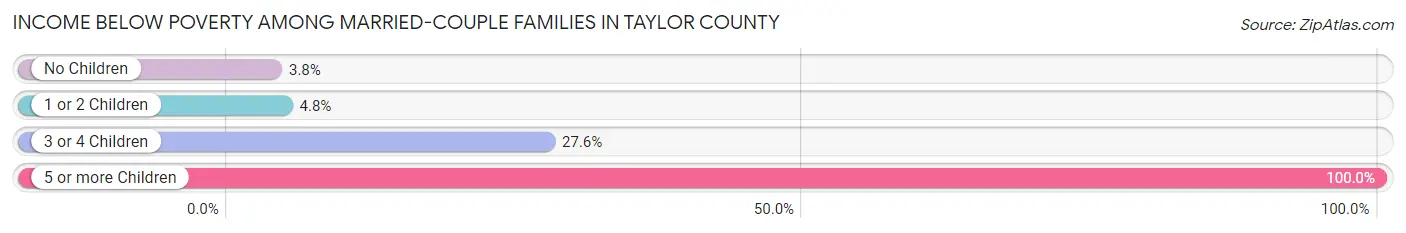
Income Below Poverty Among Married-Couple Families in Taylor County
The poverty statistics for married-couple families in Taylor County show that 6.5% or 214 of the total 3,294 families live below the poverty line. Families with 5 or more children have the highest poverty rate of 100.0%, comprising of 16 families. On the other hand, families with no children have the lowest poverty rate of 3.8%, which includes 89 families.
| Children | Above Poverty | Below Poverty |
| No Children | 2,237 (96.2%) | 89 (3.8%) |
| 1 or 2 Children | 641 (95.3%) | 32 (4.8%) |
| 3 or 4 Children | 202 (72.4%) | 77 (27.6%) |
| 5 or more Children | 0 (0.0%) | 16 (100.0%) |
| Total | 3,080 (93.5%) | 214 (6.5%) |
Income Below Poverty Among Single-Parent Households in Taylor County
According to the poverty data in Taylor County, 28.0% or 79 single-father households and 23.6% or 174 single-mother households are living below the poverty line. Among single-father households, those with 3 or 4 children have the highest poverty rate, with 30 households (100.0%) experiencing poverty. Likewise, among single-mother households, those with 3 or 4 children have the highest poverty rate, with 17 households (32.1%) falling below the poverty line.

| Children | Single Father | Single Mother |
| No Children | 5 (5.4%) | 27 (11.3%) |
| 1 or 2 Children | 44 (27.5%) | 130 (29.3%) |
| 3 or 4 Children | 30 (100.0%) | 17 (32.1%) |
| 5 or more Children | 0 (0.0%) | 0 (0.0%) |
| Total | 79 (28.0%) | 174 (23.6%) |
Income Below Poverty Among Married-Couple vs Single-Parent Households in Taylor County
The poverty data for Taylor County shows that 214 of the married-couple family households (6.5%) and 253 of the single-parent households (24.8%) are living below the poverty level. Within the married-couple family households, those with 5 or more children have the highest poverty rate, with 16 households (100.0%) falling below the poverty line. Among the single-parent households, those with 3 or 4 children have the highest poverty rate, with 47 household (56.6%) living below poverty.

| Children | Married-Couple Families | Single-Parent Households |
| No Children | 89 (3.8%) | 32 (9.6%) |
| 1 or 2 Children | 32 (4.8%) | 174 (28.8%) |
| 3 or 4 Children | 77 (27.6%) | 47 (56.6%) |
| 5 or more Children | 16 (100.0%) | 0 (0.0%) |
| Total | 214 (6.5%) | 253 (24.8%) |
Employment Characteristics in Taylor County
Employment by Class of Employer in Taylor County
Among the 6,456 employed individuals in Taylor County, private company employees (4,408 | 68.3%), state government employees (515 | 8.0%), and federal government employees (446 | 6.9%) make up the most common classes of employment.

| Employer Class | # Employees | % Employees |
| Private Company Employees | 4,408 | 68.3% |
| Self-Employed (Incorporated) | 57 | 0.9% |
| Self-Employed (Not Incorporated) | 292 | 4.5% |
| Not-for-profit Organizations | 300 | 4.6% |
| Local Government Employees | 438 | 6.8% |
| State Government Employees | 515 | 8.0% |
| Federal Government Employees | 446 | 6.9% |
| Unpaid Family Workers | 0 | 0.0% |
| Total | 6,456 | 100.0% |
Employment Status by Age in Taylor County
According to the labor force statistics for Taylor County, out of the total population over 16 years of age (13,603), 54.2% or 7,373 individuals are in the labor force, with 9.3% or 686 of them unemployed. The age group with the highest labor force participation rate is 35 to 44 years, with 79.6% or 1,616 individuals in the labor force. Within the labor force, the 16 to 19 years age range has the highest percentage of unemployed individuals, with 37.6% or 96 of them being unemployed.

| Age Bracket | In Labor Force | Unemployed |
| 16 to 19 Years | 255 (35.9%) | 96 (37.6%) |
| 20 to 24 Years | 326 (46.2%) | 96 (29.4%) |
| 25 to 29 Years | 750 (75.4%) | 122 (16.3%) |
| 30 to 34 Years | 768 (73.2%) | 58 (7.6%) |
| 35 to 44 Years | 1,616 (79.6%) | 149 (9.2%) |
| 45 to 54 Years | 1,714 (75.2%) | 19 (1.1%) |
| 55 to 59 Years | 1,027 (69.7%) | 45 (4.4%) |
| 60 to 64 Years | 434 (45.4%) | 17 (3.9%) |
| 65 to 74 Years | 424 (20.6%) | 86 (20.3%) |
| 75 Years and over | 60 (4.5%) | 0 (0.0%) |
| Total | 7,373 (54.2%) | 686 (9.3%) |
Employment Status by Educational Attainment in Taylor County
According to labor force statistics for Taylor County, 71.8% of individuals (6,306) out of the total population between 25 and 64 years of age (8,783) are in the labor force, with 6.5% or 410 of them being unemployed. The group with the highest labor force participation rate are those with the educational attainment of bachelor's degree or higher, with 89.0% or 1,486 individuals in the labor force. Within the labor force, individuals with less than high school education have the highest percentage of unemployment, with 19.8% or 113 of them being unemployed.

| Educational Attainment | In Labor Force | Unemployed |
| Less than High School | 570 (48.5%) | 233 (19.8%) |
| High School Diploma | 2,403 (69.2%) | 229 (6.6%) |
| College / Associate Degree | 1,847 (74.9%) | 158 (6.4%) |
| Bachelor's Degree or higher | 1,486 (89.0%) | 22 (1.3%) |
| Total | 6,306 (71.8%) | 571 (6.5%) |
Employment Occupations by Sex in Taylor County
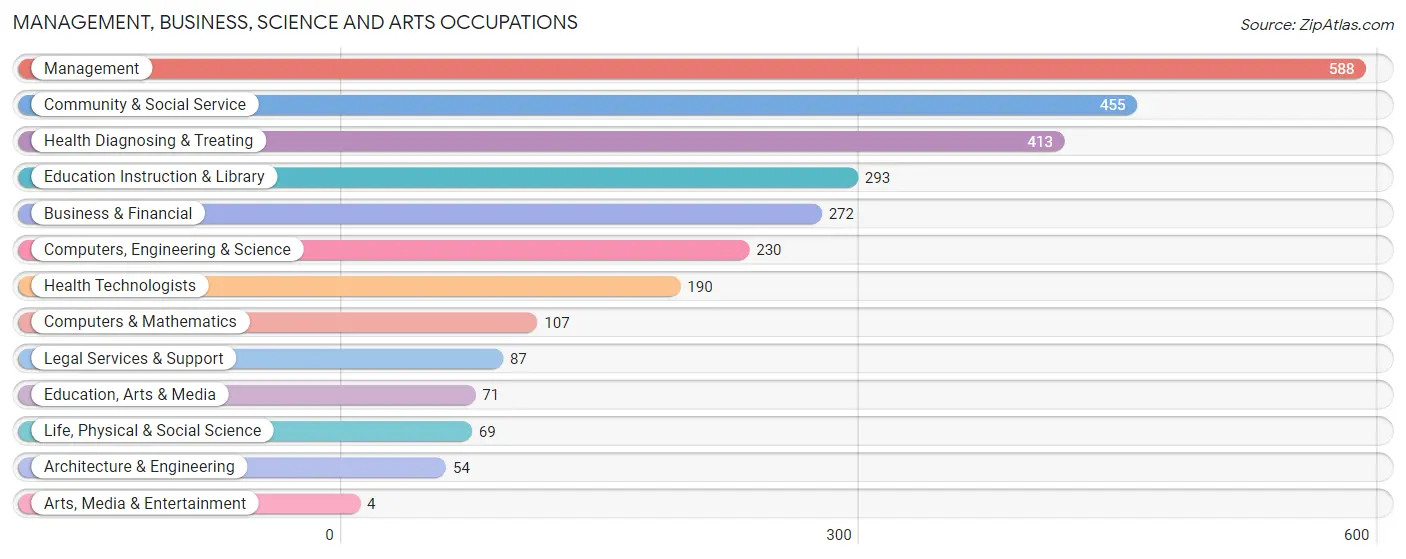
Management, Business, Science and Arts Occupations
The most common Management, Business, Science and Arts occupations in Taylor County are Management (588 | 8.8%), Community & Social Service (455 | 6.8%), Health Diagnosing & Treating (413 | 6.2%), Education Instruction & Library (293 | 4.4%), and Business & Financial (272 | 4.1%).
Management, Business, Science and Arts Occupations by Sex
Within the Management, Business, Science and Arts occupations in Taylor County, the most male-oriented occupations are Computers & Mathematics (100.0%), Computers, Engineering & Science (76.5%), and Life, Physical & Social Science (73.9%), while the most female-oriented occupations are Arts, Media & Entertainment (100.0%), Health Technologists (92.6%), and Education Instruction & Library (90.4%).

| Occupation | Male | Female |
| Management | 426 (72.5%) | 162 (27.6%) |
| Business & Financial | 114 (41.9%) | 158 (58.1%) |
| Computers, Engineering & Science | 176 (76.5%) | 54 (23.5%) |
| Computers & Mathematics | 107 (100.0%) | 0 (0.0%) |
| Architecture & Engineering | 18 (33.3%) | 36 (66.7%) |
| Life, Physical & Social Science | 51 (73.9%) | 18 (26.1%) |
| Community & Social Service | 124 (27.3%) | 331 (72.8%) |
| Education, Arts & Media | 41 (57.8%) | 30 (42.2%) |
| Legal Services & Support | 55 (63.2%) | 32 (36.8%) |
| Education Instruction & Library | 28 (9.6%) | 265 (90.4%) |
| Arts, Media & Entertainment | 0 (0.0%) | 4 (100.0%) |
| Health Diagnosing & Treating | 51 (12.3%) | 362 (87.6%) |
| Health Technologists | 14 (7.4%) | 176 (92.6%) |
| Total (Category) | 891 (45.5%) | 1,067 (54.5%) |
| Total (Overall) | 3,420 (51.3%) | 3,244 (48.7%) |
Services Occupations
The most common Services occupations in Taylor County are Healthcare Support (432 | 6.5%), Food Preparation & Serving (388 | 5.8%), Cleaning & Maintenance (190 | 2.9%), Security & Protection (82 | 1.2%), and Law Enforcement (46 | 0.7%).

Services Occupations by Sex
Within the Services occupations in Taylor County, the most male-oriented occupations are Law Enforcement (80.4%), Security & Protection (75.6%), and Firefighting & Prevention (69.4%), while the most female-oriented occupations are Personal Care & Service (100.0%), Healthcare Support (91.4%), and Cleaning & Maintenance (60.5%).

| Occupation | Male | Female |
| Healthcare Support | 37 (8.6%) | 395 (91.4%) |
| Security & Protection | 62 (75.6%) | 20 (24.4%) |
| Firefighting & Prevention | 25 (69.4%) | 11 (30.6%) |
| Law Enforcement | 37 (80.4%) | 9 (19.6%) |
| Food Preparation & Serving | 179 (46.1%) | 209 (53.9%) |
| Cleaning & Maintenance | 75 (39.5%) | 115 (60.5%) |
| Personal Care & Service | 0 (0.0%) | 45 (100.0%) |
| Total (Category) | 353 (31.0%) | 784 (69.0%) |
| Total (Overall) | 3,420 (51.3%) | 3,244 (48.7%) |
Sales and Office Occupations
The most common Sales and Office occupations in Taylor County are Office & Administration (943 | 14.1%), and Sales & Related (594 | 8.9%).

Sales and Office Occupations by Sex

| Occupation | Male | Female |
| Sales & Related | 261 (43.9%) | 333 (56.1%) |
| Office & Administration | 66 (7.0%) | 877 (93.0%) |
| Total (Category) | 327 (21.3%) | 1,210 (78.7%) |
| Total (Overall) | 3,420 (51.3%) | 3,244 (48.7%) |
Natural Resources, Construction and Maintenance Occupations
The most common Natural Resources, Construction and Maintenance occupations in Taylor County are Construction & Extraction (819 | 12.3%), Installation, Maintenance & Repair (210 | 3.2%), and Farming, Fishing & Forestry (9 | 0.1%).

Natural Resources, Construction and Maintenance Occupations by Sex

| Occupation | Male | Female |
| Farming, Fishing & Forestry | 9 (100.0%) | 0 (0.0%) |
| Construction & Extraction | 797 (97.3%) | 22 (2.7%) |
| Installation, Maintenance & Repair | 191 (90.9%) | 19 (9.0%) |
| Total (Category) | 997 (96.1%) | 41 (4.0%) |
| Total (Overall) | 3,420 (51.3%) | 3,244 (48.7%) |
Production, Transportation and Moving Occupations
The most common Production, Transportation and Moving occupations in Taylor County are Transportation (459 | 6.9%), Production (321 | 4.8%), and Material Moving (214 | 3.2%).

Production, Transportation and Moving Occupations by Sex

| Occupation | Male | Female |
| Production | 266 (82.9%) | 55 (17.1%) |
| Transportation | 455 (99.1%) | 4 (0.9%) |
| Material Moving | 131 (61.2%) | 83 (38.8%) |
| Total (Category) | 852 (85.7%) | 142 (14.3%) |
| Total (Overall) | 3,420 (51.3%) | 3,244 (48.7%) |
Employment Industries by Sex in Taylor County
Employment Industries in Taylor County
The major employment industries in Taylor County include Health Care & Social Assistance (1,339 | 20.1%), Retail Trade (860 | 12.9%), Construction (742 | 11.1%), Public Administration (591 | 8.9%), and Educational Services (475 | 7.1%).

Employment Industries by Sex in Taylor County
The Taylor County industries that see more men than women are Agriculture, Fishing & Hunting (100.0%), Mining, Quarrying, & Extraction (100.0%), and Utilities (93.4%), whereas the industries that tend to have a higher number of women are Health Care & Social Assistance (89.2%), Educational Services (76.6%), and Arts, Entertainment & Recreation (75.0%).

| Industry | Male | Female |
| Agriculture, Fishing & Hunting | 22 (100.0%) | 0 (0.0%) |
| Mining, Quarrying, & Extraction | 302 (100.0%) | 0 (0.0%) |
| Construction | 646 (87.1%) | 96 (12.9%) |
| Manufacturing | 227 (90.4%) | 24 (9.6%) |
| Wholesale Trade | 28 (84.9%) | 5 (15.1%) |
| Retail Trade | 320 (37.2%) | 540 (62.8%) |
| Transportation & Warehousing | 302 (91.2%) | 29 (8.8%) |
| Utilities | 213 (93.4%) | 15 (6.6%) |
| Information | 26 (68.4%) | 12 (31.6%) |
| Finance & Insurance | 30 (31.6%) | 65 (68.4%) |
| Real Estate, Rental & Leasing | 24 (68.6%) | 11 (31.4%) |
| Professional & Scientific | 289 (66.7%) | 144 (33.3%) |
| Enterprise Management | 0 (0.0%) | 0 (0.0%) |
| Administrative & Support | 73 (36.1%) | 129 (63.9%) |
| Educational Services | 111 (23.4%) | 364 (76.6%) |
| Health Care & Social Assistance | 144 (10.7%) | 1,195 (89.2%) |
| Arts, Entertainment & Recreation | 5 (25.0%) | 15 (75.0%) |
| Accommodation & Food Services | 226 (51.1%) | 216 (48.9%) |
| Public Administration | 302 (51.1%) | 289 (48.9%) |
| Total | 3,420 (51.3%) | 3,244 (48.7%) |
Education in Taylor County
School Enrollment in Taylor County
The most common levels of schooling among the 3,342 students in Taylor County are high school (1,002 | 30.0%), middle school (857 | 25.6%), and elementary school (597 | 17.9%).

| School Level | # Students | % Students |
| Nursery / Preschool | 87 | 2.6% |
| Kindergarten | 165 | 4.9% |
| Elementary School | 597 | 17.9% |
| Middle School | 857 | 25.6% |
| High School | 1,002 | 30.0% |
| College / Undergraduate | 475 | 14.2% |
| Graduate / Professional | 159 | 4.8% |
| Total | 3,342 | 100.0% |
School Enrollment by Age by Funding Source in Taylor County
Out of a total of 3,342 students who are enrolled in schools in Taylor County, 555 (16.6%) attend a private institution, while the remaining 2,787 (83.4%) are enrolled in public schools. The age group of 35 years and over has the highest likelihood of being enrolled in private schools, with 74 (38.5% in the age bracket) enrolled. Conversely, the age group of 3 to 4 year olds has the lowest likelihood of being enrolled in a private school, with 39 (100.0% in the age bracket) attending a public institution.

| Age Bracket | Public School | Private School |
| 3 to 4 Year Olds | 39 (100.0%) | 0 (0.0%) |
| 5 to 9 Year Old | 617 (87.9%) | 85 (12.1%) |
| 10 to 14 Year Olds | 974 (89.1%) | 119 (10.9%) |
| 15 to 17 Year Olds | 434 (75.9%) | 138 (24.1%) |
| 18 to 19 Year Olds | 209 (71.8%) | 82 (28.2%) |
| 20 to 24 Year Olds | 290 (87.1%) | 43 (12.9%) |
| 25 to 34 Year Olds | 107 (89.2%) | 13 (10.8%) |
| 35 Years and over | 118 (61.5%) | 74 (38.5%) |
| Total | 2,787 (83.4%) | 555 (16.6%) |
Educational Attainment by Field of Study in Taylor County
Education (520 | 22.2%), business (365 | 15.6%), science & technology (310 | 13.3%), engineering (220 | 9.4%), and arts & humanities (193 | 8.3%) are the most common fields of study among 2,339 individuals in Taylor County who have obtained a bachelor's degree or higher.

| Field of Study | # Graduates | % Graduates |
| Computers & Mathematics | 106 | 4.5% |
| Bio, Nature & Agricultural | 54 | 2.3% |
| Physical & Health Sciences | 98 | 4.2% |
| Psychology | 123 | 5.3% |
| Social Sciences | 140 | 6.0% |
| Engineering | 220 | 9.4% |
| Multidisciplinary Studies | 0 | 0.0% |
| Science & Technology | 310 | 13.3% |
| Business | 365 | 15.6% |
| Education | 520 | 22.2% |
| Literature & Languages | 92 | 3.9% |
| Liberal Arts & History | 73 | 3.1% |
| Visual & Performing Arts | 45 | 1.9% |
| Communications | 0 | 0.0% |
| Arts & Humanities | 193 | 8.3% |
| Total | 2,339 | 100.0% |
Transportation & Commute in Taylor County
Vehicle Availability by Sex in Taylor County
The most prevalent vehicle ownership categories in Taylor County are males with 2 vehicles (1,405, accounting for 42.6%) and females with 2 vehicles (1,223, making up 44.5%).

| Vehicles Available | Male | Female |
| No Vehicle | 65 (2.0%) | 110 (3.5%) |
| 1 Vehicle | 439 (13.3%) | 704 (22.3%) |
| 2 Vehicles | 1,405 (42.6%) | 1,223 (38.8%) |
| 3 Vehicles | 806 (24.4%) | 709 (22.5%) |
| 4 Vehicles | 390 (11.8%) | 227 (7.2%) |
| 5 or more Vehicles | 194 (5.9%) | 183 (5.8%) |
| Total | 3,299 (100.0%) | 3,156 (100.0%) |
Commute Time in Taylor County
The most frequently occuring commute durations in Taylor County are 15 to 19 minutes (1,012 commuters, 16.7%), 20 to 24 minutes (962 commuters, 15.9%), and 30 to 34 minutes (700 commuters, 11.6%).

| Commute Time | # Commuters | % Commuters |
| Less than 5 Minutes | 70 | 1.2% |
| 5 to 9 Minutes | 619 | 10.2% |
| 10 to 14 Minutes | 652 | 10.8% |
| 15 to 19 Minutes | 1,012 | 16.7% |
| 20 to 24 Minutes | 962 | 15.9% |
| 25 to 29 Minutes | 321 | 5.3% |
| 30 to 34 Minutes | 700 | 11.6% |
| 35 to 39 Minutes | 255 | 4.2% |
| 40 to 44 Minutes | 282 | 4.7% |
| 45 to 59 Minutes | 666 | 11.0% |
| 60 to 89 Minutes | 347 | 5.7% |
| 90 or more Minutes | 164 | 2.7% |
Commute Time by Sex in Taylor County
The most common commute times in Taylor County are 20 to 24 minutes (612 commuters, 19.3%) for males and 15 to 19 minutes (509 commuters, 17.6%) for females.

| Commute Time | Male | Female |
| Less than 5 Minutes | 31 (1.0%) | 39 (1.3%) |
| 5 to 9 Minutes | 320 (10.1%) | 299 (10.4%) |
| 10 to 14 Minutes | 225 (7.1%) | 427 (14.8%) |
| 15 to 19 Minutes | 503 (15.9%) | 509 (17.6%) |
| 20 to 24 Minutes | 612 (19.3%) | 350 (12.1%) |
| 25 to 29 Minutes | 164 (5.2%) | 157 (5.4%) |
| 30 to 34 Minutes | 344 (10.9%) | 356 (12.3%) |
| 35 to 39 Minutes | 119 (3.8%) | 136 (4.7%) |
| 40 to 44 Minutes | 123 (3.9%) | 159 (5.5%) |
| 45 to 59 Minutes | 381 (12.0%) | 285 (9.9%) |
| 60 to 89 Minutes | 271 (8.6%) | 76 (2.6%) |
| 90 or more Minutes | 73 (2.3%) | 91 (3.2%) |
Time of Departure to Work by Sex in Taylor County
The most frequent times of departure to work in Taylor County are 6:30 AM to 6:59 AM (518, 16.4%) for males and 7:30 AM to 7:59 AM (440, 15.3%) for females.

| Time of Departure | Male | Female |
| 12:00 AM to 4:59 AM | 405 (12.8%) | 165 (5.7%) |
| 5:00 AM to 5:29 AM | 182 (5.8%) | 81 (2.8%) |
| 5:30 AM to 5:59 AM | 191 (6.0%) | 311 (10.8%) |
| 6:00 AM to 6:29 AM | 457 (14.4%) | 222 (7.7%) |
| 6:30 AM to 6:59 AM | 518 (16.4%) | 302 (10.5%) |
| 7:00 AM to 7:29 AM | 150 (4.7%) | 439 (15.2%) |
| 7:30 AM to 7:59 AM | 333 (10.5%) | 440 (15.3%) |
| 8:00 AM to 8:29 AM | 140 (4.4%) | 387 (13.4%) |
| 8:30 AM to 8:59 AM | 96 (3.0%) | 86 (3.0%) |
| 9:00 AM to 9:59 AM | 216 (6.8%) | 179 (6.2%) |
| 10:00 AM to 10:59 AM | 27 (0.9%) | 30 (1.0%) |
| 11:00 AM to 11:59 AM | 5 (0.2%) | 31 (1.1%) |
| 12:00 PM to 3:59 PM | 292 (9.2%) | 40 (1.4%) |
| 4:00 PM to 11:59 PM | 154 (4.9%) | 171 (5.9%) |
| Total | 3,166 (100.0%) | 2,884 (100.0%) |
Housing Occupancy in Taylor County
Occupancy by Ownership in Taylor County
Of the total 6,702 dwellings in Taylor County, owner-occupied units account for 5,380 (80.3%), while renter-occupied units make up 1,322 (19.7%).

| Occupancy | # Housing Units | % Housing Units |
| Owner Occupied Housing Units | 5,380 | 80.3% |
| Renter-Occupied Housing Units | 1,322 | 19.7% |
| Total Occupied Housing Units | 6,702 | 100.0% |
Occupancy by Household Size in Taylor County

| Household Size | # Housing Units | % Housing Units |
| 1-Person Household | 2,050 | 30.6% |
| 2-Person Household | 2,469 | 36.8% |
| 3-Person Household | 1,126 | 16.8% |
| 4+ Person Household | 1,057 | 15.8% |
| Total Housing Units | 6,702 | 100.0% |
Occupancy by Ownership by Household Size in Taylor County

| Household Size | Owner-occupied | Renter-occupied |
| 1-Person Household | 1,524 (74.3%) | 526 (25.7%) |
| 2-Person Household | 2,113 (85.6%) | 356 (14.4%) |
| 3-Person Household | 912 (81.0%) | 214 (19.0%) |
| 4+ Person Household | 831 (78.6%) | 226 (21.4%) |
| Total Housing Units | 5,380 (80.3%) | 1,322 (19.7%) |
Occupancy by Educational Attainment in Taylor County

| Household Size | Owner-occupied | Renter-occupied |
| Less than High School | 663 (75.3%) | 217 (24.7%) |
| High School Diploma | 2,052 (77.9%) | 583 (22.1%) |
| College/Associate Degree | 1,368 (75.0%) | 455 (25.0%) |
| Bachelor's Degree or higher | 1,297 (95.1%) | 67 (4.9%) |
Occupancy by Age of Householder in Taylor County

| Age Bracket | # Households | % Households |
| Under 35 Years | 776 | 11.6% |
| 35 to 44 Years | 1,040 | 15.5% |
| 45 to 54 Years | 1,195 | 17.8% |
| 55 to 64 Years | 1,476 | 22.0% |
| 65 to 74 Years | 1,308 | 19.5% |
| 75 to 84 Years | 645 | 9.6% |
| 85 Years and Over | 262 | 3.9% |
| Total | 6,702 | 100.0% |
Housing Finances in Taylor County
Median Income by Occupancy in Taylor County

| Occupancy Type | # Households | Median Income |
| Owner-Occupied | 5,380 (80.3%) | $60,862 |
| Renter-Occupied | 1,322 (19.7%) | $32,139 |
| Average | 6,702 (100.0%) | $52,946 |
Occupancy by Householder Income Bracket in Taylor County

| Income Bracket | Owner-occupied | Renter-occupied |
| Less than $5,000 | 126 (2.3%) | 65 (4.9%) |
| $5,000 to $9,999 | 18 (0.3%) | 137 (10.4%) |
| $10,000 to $14,999 | 321 (6.0%) | 85 (6.4%) |
| $15,000 to $19,999 | 154 (2.9%) | 20 (1.5%) |
| $20,000 to $24,999 | 316 (5.9%) | 235 (17.8%) |
| $25,000 to $34,999 | 575 (10.7%) | 189 (14.3%) |
| $35,000 to $49,999 | 843 (15.7%) | 98 (7.4%) |
| $50,000 to $74,999 | 884 (16.4%) | 259 (19.6%) |
| $75,000 to $99,999 | 580 (10.8%) | 30 (2.3%) |
| $100,000 to $149,999 | 948 (17.6%) | 141 (10.7%) |
| $150,000 or more | 615 (11.4%) | 63 (4.8%) |
| Total | 5,380 (100.0%) | 1,322 (100.0%) |
Monthly Housing Cost Tiers in Taylor County

| Monthly Cost | Owner-occupied | Renter-occupied |
| Less than $300 | 978 (18.2%) | 99 (7.5%) |
| $300 to $499 | 1,351 (25.1%) | 312 (23.6%) |
| $500 to $799 | 1,273 (23.7%) | 251 (19.0%) |
| $800 to $999 | 537 (10.0%) | 144 (10.9%) |
| $1,000 to $1,499 | 554 (10.3%) | 289 (21.9%) |
| $1,500 to $1,999 | 359 (6.7%) | 75 (5.7%) |
| $2,000 to $2,499 | 216 (4.0%) | 0 (0.0%) |
| $2,500 to $2,999 | 42 (0.8%) | 0 (0.0%) |
| $3,000 or more | 70 (1.3%) | 0 (0.0%) |
| Total | 5,380 (100.0%) | 1,322 (100.0%) |
Physical Housing Characteristics in Taylor County
Housing Structures in Taylor County

| Structure Type | # Housing Units | % Housing Units |
| Single Unit, Detached | 5,169 | 77.1% |
| Single Unit, Attached | 44 | 0.7% |
| 2 Unit Apartments | 16 | 0.2% |
| 3 or 4 Unit Apartments | 157 | 2.3% |
| 5 to 9 Unit Apartments | 397 | 5.9% |
| 10 or more Apartments | 112 | 1.7% |
| Mobile Home / Other | 807 | 12.0% |
| Total | 6,702 | 100.0% |
Housing Structures by Occupancy in Taylor County

| Structure Type | Owner-occupied | Renter-occupied |
| Single Unit, Detached | 4,676 (90.5%) | 493 (9.5%) |
| Single Unit, Attached | 23 (52.3%) | 21 (47.7%) |
| 2 Unit Apartments | 0 (0.0%) | 16 (100.0%) |
| 3 or 4 Unit Apartments | 0 (0.0%) | 157 (100.0%) |
| 5 to 9 Unit Apartments | 0 (0.0%) | 397 (100.0%) |
| 10 or more Apartments | 0 (0.0%) | 112 (100.0%) |
| Mobile Home / Other | 681 (84.4%) | 126 (15.6%) |
| Total | 5,380 (80.3%) | 1,322 (19.7%) |
Housing Structures by Number of Rooms in Taylor County

| Number of Rooms | Owner-occupied | Renter-occupied |
| 1 Room | 0 (0.0%) | 133 (10.1%) |
| 2 or 3 Rooms | 58 (1.1%) | 172 (13.0%) |
| 4 or 5 Rooms | 1,625 (30.2%) | 655 (49.5%) |
| 6 or 7 Rooms | 2,013 (37.4%) | 233 (17.6%) |
| 8 or more Rooms | 1,684 (31.3%) | 129 (9.8%) |
| Total | 5,380 (100.0%) | 1,322 (100.0%) |
Housing Structure by Heating Type in Taylor County

| Heating Type | Owner-occupied | Renter-occupied |
| Utility Gas | 2,684 (49.9%) | 667 (50.4%) |
| Bottled, Tank, or LP Gas | 979 (18.2%) | 40 (3.0%) |
| Electricity | 1,094 (20.3%) | 584 (44.2%) |
| Fuel Oil or Kerosene | 68 (1.3%) | 23 (1.7%) |
| Coal or Coke | 45 (0.8%) | 0 (0.0%) |
| All other Fuels | 503 (9.3%) | 0 (0.0%) |
| No Fuel Used | 7 (0.1%) | 8 (0.6%) |
| Total | 5,380 (100.0%) | 1,322 (100.0%) |
Household Vehicle Usage in Taylor County

| Vehicles per Household | Owner-occupied | Renter-occupied |
| No Vehicle | 175 (3.3%) | 299 (22.6%) |
| 1 Vehicle | 1,621 (30.1%) | 491 (37.1%) |
| 2 Vehicles | 2,033 (37.8%) | 425 (32.2%) |
| 3 or more Vehicles | 1,551 (28.8%) | 107 (8.1%) |
| Total | 5,380 (100.0%) | 1,322 (100.0%) |
Real Estate & Mortgages in Taylor County
Real Estate and Mortgage Overview in Taylor County
| Characteristic | Without Mortgage | With Mortgage |
| Housing Units | 3,128 | 2,252 |
| Median Property Value | $106,600 | $182,800 |
| Median Household Income | $46,351 | $420 |
| Monthly Housing Costs | $374 | $53 |
| Real Estate Taxes | $623 | $38 |
Property Value by Mortgage Status in Taylor County

| Property Value | Without Mortgage | With Mortgage |
| Less than $50,000 | 815 (26.1%) | 163 (7.2%) |
| $50,000 to $99,999 | 669 (21.4%) | 343 (15.2%) |
| $100,000 to $299,999 | 1,044 (33.4%) | 1,223 (54.3%) |
| $300,000 to $499,999 | 251 (8.0%) | 399 (17.7%) |
| $500,000 to $749,999 | 274 (8.8%) | 118 (5.2%) |
| $750,000 to $999,999 | 62 (2.0%) | 0 (0.0%) |
| $1,000,000 or more | 13 (0.4%) | 6 (0.3%) |
| Total | 3,128 (100.0%) | 2,252 (100.0%) |
Household Income by Mortgage Status in Taylor County

| Household Income | Without Mortgage | With Mortgage |
| Less than $10,000 | 123 (3.9%) | 20 (0.9%) |
| $10,000 to $24,999 | 602 (19.3%) | 21 (0.9%) |
| $25,000 to $34,999 | 460 (14.7%) | 189 (8.4%) |
| $35,000 to $49,999 | 456 (14.6%) | 115 (5.1%) |
| $50,000 to $74,999 | 536 (17.1%) | 387 (17.2%) |
| $75,000 to $99,999 | 312 (10.0%) | 348 (15.4%) |
| $100,000 to $149,999 | 444 (14.2%) | 268 (11.9%) |
| $150,000 or more | 195 (6.2%) | 504 (22.4%) |
| Total | 3,128 (100.0%) | 2,252 (100.0%) |
Property Value to Household Income Ratio in Taylor County

| Value-to-Income Ratio | Without Mortgage | With Mortgage |
| Less than 2.0x | 1,495 (47.8%) | 80,081 (3,556.0%) |
| 2.0x to 2.9x | 522 (16.7%) | 900 (40.0%) |
| 3.0x to 3.9x | 280 (8.9%) | 754 (33.5%) |
| 4.0x or more | 764 (24.4%) | 203 (9.0%) |
| Total | 3,128 (100.0%) | 2,252 (100.0%) |
Real Estate Taxes by Mortgage Status in Taylor County

| Property Taxes | Without Mortgage | With Mortgage |
| Less than $800 | 1,670 (53.4%) | 0 (0.0%) |
| $800 to $1,499 | 692 (22.1%) | 978 (43.4%) |
| $800 to $1,499 | 431 (13.8%) | 571 (25.4%) |
| Total | 3,128 (100.0%) | 2,252 (100.0%) |
Health & Disability in Taylor County
Health Insurance Coverage by Age in Taylor County

| Age Bracket | With Coverage | Without Coverage |
| Under 6 Years | 925 (100.0%) | 0 (0.0%) |
| 6 to 18 Years | 2,617 (98.8%) | 31 (1.2%) |
| 19 to 25 Years | 1,095 (96.1%) | 45 (4.0%) |
| 26 to 34 Years | 1,367 (86.0%) | 223 (14.0%) |
| 35 to 44 Years | 1,819 (93.2%) | 133 (6.8%) |
| 45 to 54 Years | 1,952 (87.9%) | 268 (12.1%) |
| 55 to 64 Years | 2,193 (91.8%) | 195 (8.2%) |
| 65 to 74 Years | 2,022 (99.2%) | 17 (0.8%) |
| 75 Years and older | 1,273 (100.0%) | 0 (0.0%) |
| Total | 15,263 (94.4%) | 912 (5.6%) |
Health Insurance Coverage by Citizenship Status in Taylor County
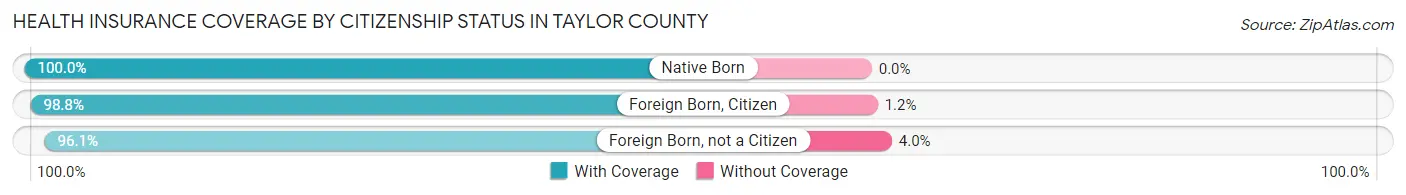
| Citizenship Status | With Coverage | Without Coverage |
| Native Born | 925 (100.0%) | 0 (0.0%) |
| Foreign Born, Citizen | 2,617 (98.8%) | 31 (1.2%) |
| Foreign Born, not a Citizen | 1,095 (96.1%) | 45 (4.0%) |
Health Insurance Coverage by Household Income in Taylor County

| Household Income | With Coverage | Without Coverage |
| Under $25,000 | 2,727 (96.7%) | 94 (3.3%) |
| $25,000 to $49,999 | 3,183 (89.0%) | 394 (11.0%) |
| $50,000 to $74,999 | 2,543 (92.4%) | 210 (7.6%) |
| $75,000 to $99,999 | 1,672 (98.4%) | 28 (1.7%) |
| $100,000 and over | 5,135 (96.5%) | 185 (3.5%) |
Public vs Private Health Insurance Coverage by Age in Taylor County

| Age Bracket | Public Insurance | Private Insurance |
| Under 6 | 626 (67.7%) | 445 (48.1%) |
| 6 to 18 Years | 1,054 (39.8%) | 1,676 (63.3%) |
| 19 to 25 Years | 500 (43.9%) | 595 (52.2%) |
| 25 to 34 Years | 637 (40.1%) | 791 (49.7%) |
| 35 to 44 Years | 660 (33.8%) | 1,304 (66.8%) |
| 45 to 54 Years | 486 (21.9%) | 1,477 (66.5%) |
| 55 to 64 Years | 676 (28.3%) | 1,644 (68.8%) |
| 65 to 74 Years | 2,006 (98.4%) | 1,331 (65.3%) |
| 75 Years and over | 1,273 (100.0%) | 948 (74.5%) |
| Total | 7,918 (48.9%) | 10,211 (63.1%) |
Disability Status by Sex by Age in Taylor County

| Age Bracket | Male | Female |
| Under 5 Years | 0 (0.0%) | 0 (0.0%) |
| 5 to 17 Years | 83 (6.5%) | 136 (10.7%) |
| 18 to 34 Years | 131 (8.9%) | 188 (12.8%) |
| 35 to 64 Years | 731 (22.4%) | 544 (16.5%) |
| 65 to 74 Years | 352 (36.0%) | 482 (45.5%) |
| 75 Years and over | 155 (28.5%) | 476 (65.2%) |
Disability Class by Sex by Age in Taylor County
Disability Class: Hearing Difficulty

| Age Bracket | Male | Female |
| Under 5 Years | 0 (0.0%) | 0 (0.0%) |
| 5 to 17 Years | 0 (0.0%) | 0 (0.0%) |
| 18 to 34 Years | 78 (5.3%) | 0 (0.0%) |
| 35 to 64 Years | 284 (8.7%) | 55 (1.7%) |
| 65 to 74 Years | 213 (21.8%) | 203 (19.2%) |
| 75 Years and over | 107 (19.7%) | 222 (30.4%) |
Disability Class: Vision Difficulty

| Age Bracket | Male | Female |
| Under 5 Years | 0 (0.0%) | 0 (0.0%) |
| 5 to 17 Years | 0 (0.0%) | 7 (0.5%) |
| 18 to 34 Years | 0 (0.0%) | 0 (0.0%) |
| 35 to 64 Years | 131 (4.0%) | 79 (2.4%) |
| 65 to 74 Years | 22 (2.2%) | 18 (1.7%) |
| 75 Years and over | 0 (0.0%) | 63 (8.6%) |
Disability Class: Cognitive Difficulty

| Age Bracket | Male | Female |
| 5 to 17 Years | 83 (6.5%) | 61 (4.8%) |
| 18 to 34 Years | 42 (2.9%) | 21 (1.4%) |
| 35 to 64 Years | 222 (6.8%) | 129 (3.9%) |
| 65 to 74 Years | 92 (9.4%) | 22 (2.1%) |
| 75 Years and over | 9 (1.7%) | 115 (15.8%) |
Disability Class: Ambulatory Difficulty

| Age Bracket | Male | Female |
| 5 to 17 Years | 0 (0.0%) | 0 (0.0%) |
| 18 to 34 Years | 11 (0.7%) | 173 (11.7%) |
| 35 to 64 Years | 455 (14.0%) | 360 (10.9%) |
| 65 to 74 Years | 180 (18.4%) | 335 (31.6%) |
| 75 Years and over | 66 (12.1%) | 377 (51.6%) |
Disability Class: Self-Care Difficulty

| Age Bracket | Male | Female |
| 5 to 17 Years | 28 (2.2%) | 0 (0.0%) |
| 18 to 34 Years | 6 (0.4%) | 98 (6.7%) |
| 35 to 64 Years | 67 (2.1%) | 57 (1.7%) |
| 65 to 74 Years | 12 (1.2%) | 17 (1.6%) |
| 75 Years and over | 17 (3.1%) | 106 (14.5%) |
Technology Access in Taylor County
Computing Device Access in Taylor County

| Device Type | # Households | % Households |
| Desktop or Laptop | 4,373 | 65.2% |
| Smartphone | 5,267 | 78.6% |
| Tablet | 4,087 | 61.0% |
| No Computing Device | 803 | 12.0% |
| Total | 6,702 | 100.0% |
Internet Access in Taylor County

| Internet Type | # Households | % Households |
| Dial-Up Internet | 7 | 0.1% |
| Broadband Home | 4,136 | 61.7% |
| Cellular Data Only | 921 | 13.7% |
| Satellite Internet | 492 | 7.3% |
| No Internet | 1,170 | 17.5% |
| Total | 6,702 | 100.0% |
Taylor County Summary
Taylor County is a county located in the state of West Virginia. It is part of the North Central West Virginia region and is bordered by Barbour, Harrison, Marion, Monongalia, Preston, and Upshur counties. The county seat is Grafton. As of the 2010 census, the population was 16,895.
History
The area that is now Taylor County was first settled in the late 1700s by European settlers. The county was created in 1844 from parts of Barbour, Harrison, and Marion counties. It was named for Senator John Taylor of Caroline, Virginia.
The county was home to several Civil War battles, including the Battle of Philippi, the first land battle of the war. The county was also home to the West Virginia State Fair, which was held in Grafton from 1875 to 1916.
Geography
Taylor County is located in the north-central part of West Virginia. It is bordered by Barbour County to the north, Harrison County to the east, Marion County to the south, Monongalia County to the southwest, Preston County to the west, and Upshur County to the northwest.
The county is mostly mountainous, with the Allegheny Mountains running through the center of the county. The Tygart Valley River runs through the county, and the county is home to several state parks, including Tygart Lake State Park and Prickett's Fort State Park.
Economy
The economy of Taylor County is largely based on agriculture and tourism. The county is home to several farms, and the county's main agricultural products are beef, dairy, and poultry.
The county is also home to several tourist attractions, including the West Virginia State Fairgrounds, the Tygart Valley River, and several state parks. The county is also home to several wineries and breweries, as well as several historic sites.
Demographics
As of the 2010 census, the population of Taylor County was 16,895. The racial makeup of the county was 95.3% White, 2.2% African American, 0.3% Native American, 0.3% Asian, 0.1% Pacific Islander, 0.4% from other races, and 1.4% from two or more races. Hispanic or Latino of any race were 1.2% of the population.
The median income for a household in the county was $35,945, and the median income for a family was $41,945. The per capita income for the county was $17,845. About 13.2% of families and 16.2% of the population were below the poverty line, including 22.2% of those under age 18 and 11.2% of those age 65 or over.
Common Questions
What is the Total Population of Taylor County?
Total Population of Taylor County is 16,602.
What is the Total Male Population of Taylor County?
Total Male Population of Taylor County is 8,283.
What is the Total Female Population of Taylor County?
Total Female Population of Taylor County is 8,319.
What is the Ratio of Males per 100 Females in Taylor County?
There are 99.57 Males per 100 Females in Taylor County.
What is the Ratio of Females per 100 Males in Taylor County?
There are 100.43 Females per 100 Males in Taylor County.
What is the Median Population Age in Taylor County?
Median Population Age in Taylor County is 44.3 Years.
What is the Average Family Size in Taylor County
Average Family Size in Taylor County is 3.0 People.
What is the Average Household Size in Taylor County
Average Household Size in Taylor County is 2.4 People.
What is Per Capita Income in Taylor County?
Per Capita income in Taylor County is $30,095.
What is the Median Family Income in Taylor County?
Median Family Income in Taylor County is $68,553.
What is the Median Household income in Taylor County?
Median Household Income in Taylor County is $52,946.
What is Income or Wage Gap in Taylor County?
Income or Wage Gap in Taylor County is 36.5%.
Women in Taylor County earn 63.5 cents for every dollar earned by a man.
What is Family Income Deficit in Taylor County?
Family Income Deficit in Taylor County is $13,278.
Families that are below poverty line in Taylor County earn $13,278 less on average than the poverty threshold level.
What is Inequality or Gini Index in Taylor County?
Inequality or Gini Index in Taylor County is 0.44.
How Large is the Labor Force in Taylor County?
There are 7,373 People in the Labor Forcein in Taylor County.
What is the Percentage of People in the Labor Force in Taylor County?
54.2% of People are in the Labor Force in Taylor County.
What is the Unemployment Rate in Taylor County?
Unemployment Rate in Taylor County is 9.3%.