Summers County, WV
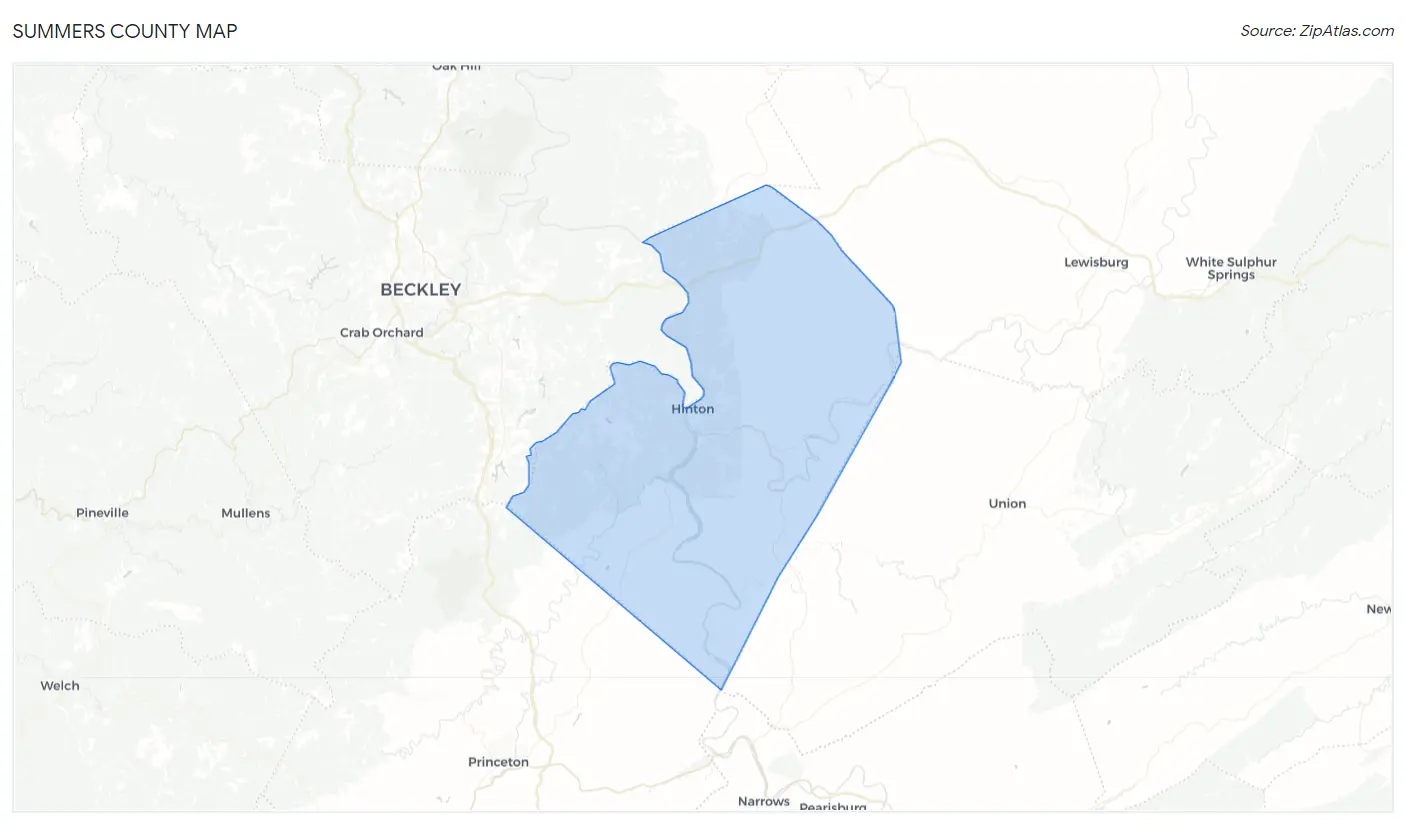
Summers County Map
Summers County Overview
11,985
TOTAL POPULATION
5,650
MALE POPULATION
6,335
FEMALE POPULATION
89.19
MALES / 100 FEMALES
112.12
FEMALES / 100 MALES
49.9
MEDIAN AGE
3.0
AVG FAMILY SIZE
2.3
AVG HOUSEHOLD SIZE
$24,507
PER CAPITA INCOME
$61,955
AVG FAMILY INCOME
$42,991
AVG HOUSEHOLD INCOME
25.2%
WAGE / INCOME GAP [ % ]
74.8¢/ $1
WAGE / INCOME GAP [ $ ]
$10,286
FAMILY INCOME DEFICIT
0.42
INEQUALITY / GINI INDEX
3,838
LABOR FORCE [ PEOPLE ]
37.3%
PERCENT IN LABOR FORCE
7.6%
UNEMPLOYMENT RATE
Summers County Area Codes
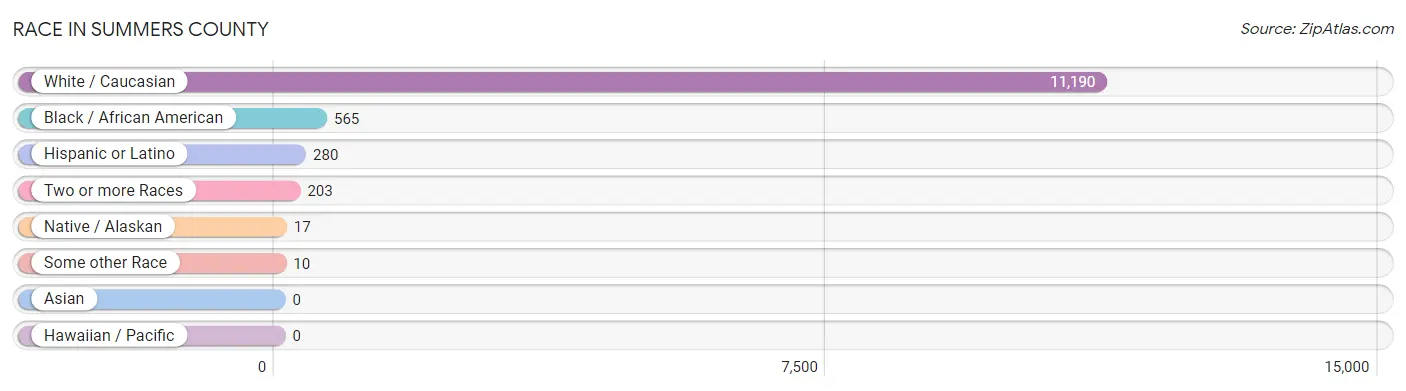
Race in Summers County
The most populous races in Summers County are White / Caucasian (11,190 | 93.4%), Black / African American (565 | 4.7%), and Hispanic or Latino (280 | 2.3%).
| Race | # Population | % Population |
| Asian | 0 | 0.0% |
| Black / African American | 565 | 4.7% |
| Hawaiian / Pacific | 0 | 0.0% |
| Hispanic or Latino | 280 | 2.3% |
| Native / Alaskan | 17 | 0.1% |
| White / Caucasian | 11,190 | 93.4% |
| Two or more Races | 203 | 1.7% |
| Some other Race | 10 | 0.1% |
| Total | 11,985 | 100.0% |
Ancestry in Summers County
The most populous ancestries reported in Summers County are English (1,490 | 12.4%), German (1,195 | 10.0%), Irish (1,163 | 9.7%), American (1,079 | 9.0%), and Scottish (370 | 3.1%), together accounting for 44.2% of all Summers County residents.

| Ancestry | # Population | % Population |
| African | 72 | 0.6% |
| American | 1,079 | 9.0% |
| Apache | 5 | 0.0% |
| Austrian | 102 | 0.9% |
| British | 36 | 0.3% |
| Canadian | 8 | 0.1% |
| Cherokee | 43 | 0.4% |
| Colombian | 53 | 0.4% |
| Crow | 3 | 0.0% |
| Cuban | 24 | 0.2% |
| Czechoslovakian | 7 | 0.1% |
| Dutch | 247 | 2.1% |
| English | 1,490 | 12.4% |
| European | 76 | 0.6% |
| French | 63 | 0.5% |
| French Canadian | 37 | 0.3% |
| German | 1,195 | 10.0% |
| Greek | 11 | 0.1% |
| Irish | 1,163 | 9.7% |
| Italian | 174 | 1.5% |
| Latvian | 3 | 0.0% |
| Lithuanian | 22 | 0.2% |
| Mexican | 23 | 0.2% |
| Northern European | 5 | 0.0% |
| Norwegian | 18 | 0.2% |
| Polish | 164 | 1.4% |
| Puerto Rican | 103 | 0.9% |
| Romanian | 6 | 0.1% |
| Russian | 48 | 0.4% |
| Scandinavian | 26 | 0.2% |
| Scotch-Irish | 273 | 2.3% |
| Scottish | 370 | 3.1% |
| South American | 53 | 0.4% |
| Spaniard | 49 | 0.4% |
| Subsaharan African | 72 | 0.6% |
| Swedish | 28 | 0.2% |
| Swiss | 11 | 0.1% |
| Ukrainian | 8 | 0.1% |
| Welsh | 72 | 0.6% | View All 39 Rows |
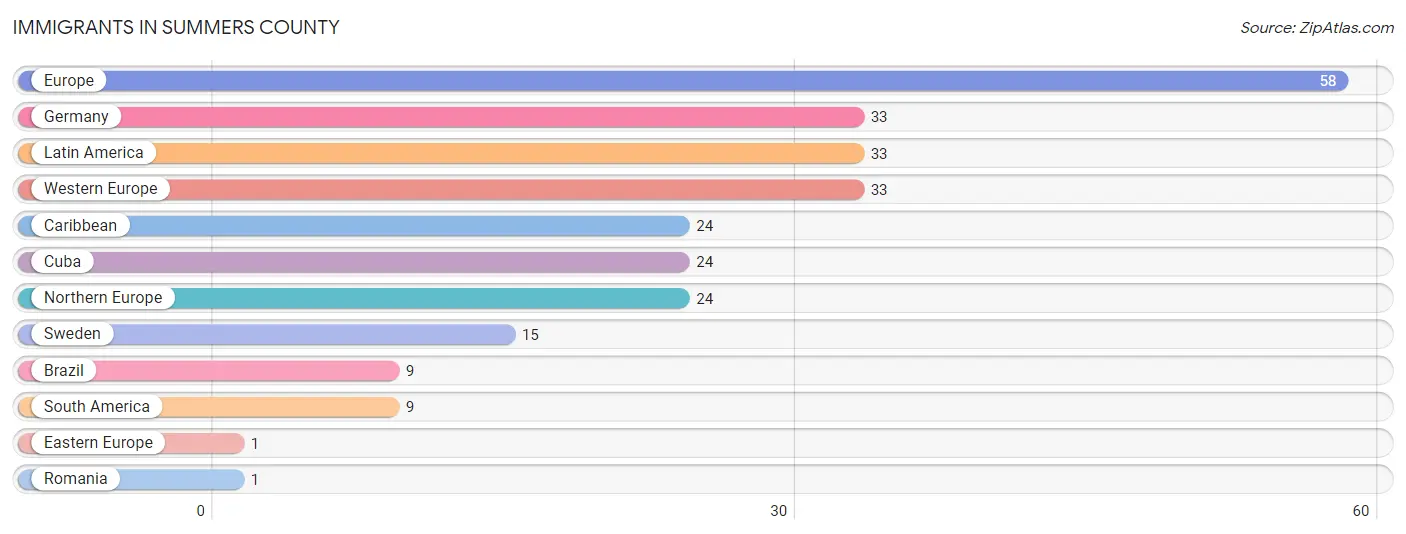
Immigrants in Summers County
The most numerous immigrant groups reported in Summers County came from Europe (58 | 0.5%), Germany (33 | 0.3%), Latin America (33 | 0.3%), Western Europe (33 | 0.3%), and Caribbean (24 | 0.2%), together accounting for 1.5% of all Summers County residents.
| Immigration Origin | # Population | % Population |
| Brazil | 9 | 0.1% |
| Caribbean | 24 | 0.2% |
| Cuba | 24 | 0.2% |
| Eastern Europe | 1 | 0.0% |
| Europe | 58 | 0.5% |
| Germany | 33 | 0.3% |
| Latin America | 33 | 0.3% |
| Northern Europe | 24 | 0.2% |
| Romania | 1 | 0.0% |
| South America | 9 | 0.1% |
| Sweden | 15 | 0.1% |
| Western Europe | 33 | 0.3% | View All 12 Rows |
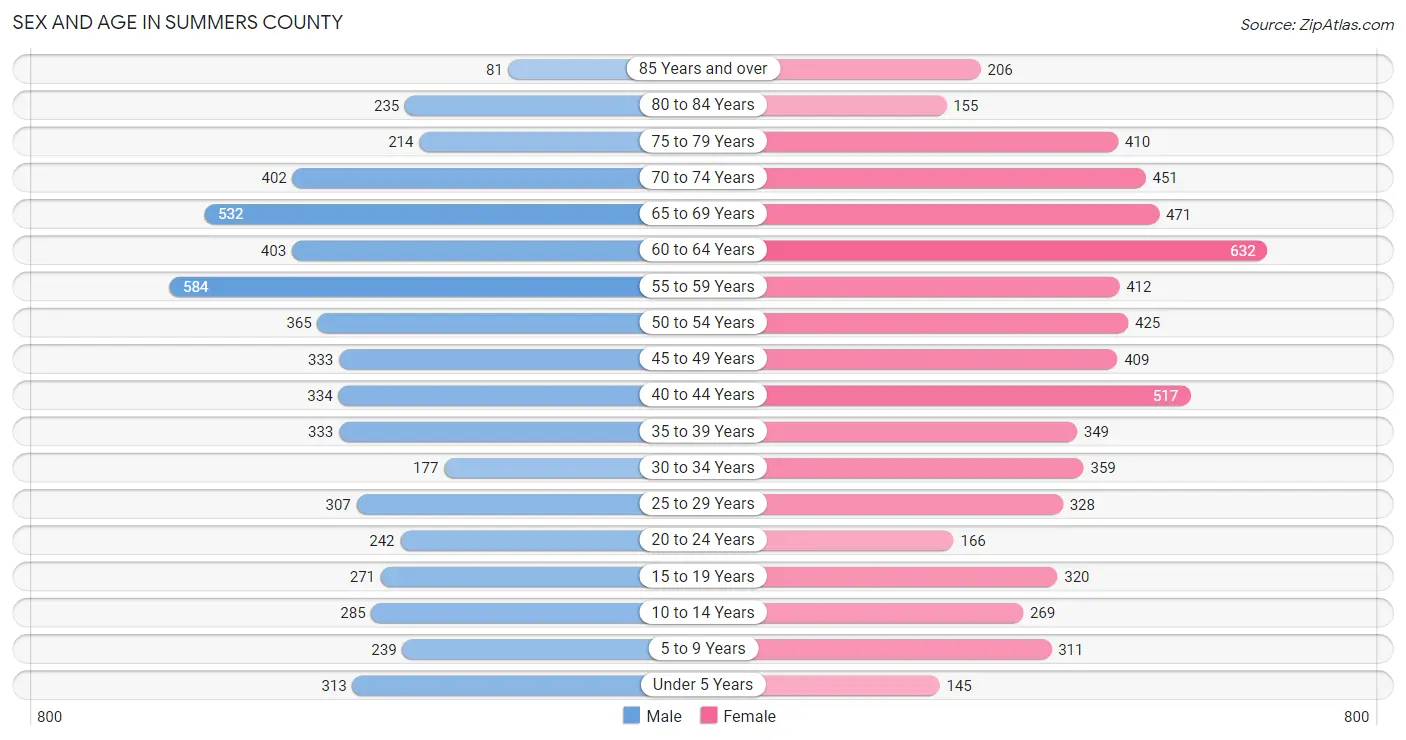
Sex and Age in Summers County
Sex and Age in Summers County
The most populous age groups in Summers County are 55 to 59 Years (584 | 10.3%) for men and 60 to 64 Years (632 | 10.0%) for women.
| Age Bracket | Male | Female |
| Under 5 Years | 313 (5.5%) | 145 (2.3%) |
| 5 to 9 Years | 239 (4.2%) | 311 (4.9%) |
| 10 to 14 Years | 285 (5.0%) | 269 (4.3%) |
| 15 to 19 Years | 271 (4.8%) | 320 (5.1%) |
| 20 to 24 Years | 242 (4.3%) | 166 (2.6%) |
| 25 to 29 Years | 307 (5.4%) | 328 (5.2%) |
| 30 to 34 Years | 177 (3.1%) | 359 (5.7%) |
| 35 to 39 Years | 333 (5.9%) | 349 (5.5%) |
| 40 to 44 Years | 334 (5.9%) | 517 (8.2%) |
| 45 to 49 Years | 333 (5.9%) | 409 (6.5%) |
| 50 to 54 Years | 365 (6.5%) | 425 (6.7%) |
| 55 to 59 Years | 584 (10.3%) | 412 (6.5%) |
| 60 to 64 Years | 403 (7.1%) | 632 (10.0%) |
| 65 to 69 Years | 532 (9.4%) | 471 (7.4%) |
| 70 to 74 Years | 402 (7.1%) | 451 (7.1%) |
| 75 to 79 Years | 214 (3.8%) | 410 (6.5%) |
| 80 to 84 Years | 235 (4.2%) | 155 (2.5%) |
| 85 Years and over | 81 (1.4%) | 206 (3.3%) |
| Total | 5,650 (100.0%) | 6,335 (100.0%) |
Families and Households in Summers County
Median Family Size in Summers County
The median family size in Summers County is 2.96 persons per family, with single female/mother families (378 | 13.2%) accounting for the largest median family size of 3.28 persons per family. On the other hand, single male/father families (360 | 12.6%) represent the smallest median family size with 2.61 persons per family.

| Family Type | # Families | Family Size |
| Married-Couple | 2,120 (74.2%) | 2.96 |
| Single Male/Father | 360 (12.6%) | 2.61 |
| Single Female/Mother | 378 (13.2%) | 3.28 |
| Total Families | 2,858 (100.0%) | 2.96 |
Median Household Size in Summers County
The median household size in Summers County is 2.27 persons per household, with single female/mother households (378 | 7.7%) accounting for the largest median household size of 3.69 persons per household. non-family households (2,032 | 41.5%) represent the smallest median household size with 1.11 persons per household.

| Household Type | # Households | Household Size |
| Married-Couple | 2,120 (43.3%) | 3.03 |
| Single Male/Father | 360 (7.4%) | 2.79 |
| Single Female/Mother | 378 (7.7%) | 3.69 |
| Non-family | 2,032 (41.5%) | 1.11 |
| Total Households | 4,890 (100.0%) | 2.27 |
Household Size by Marriage Status in Summers County
Out of a total of 4,890 households in Summers County, 2,858 (58.5%) are family households, while 2,032 (41.5%) are nonfamily households. The most numerous type of family households are 2-person households, comprising 1,511, and the most common type of nonfamily households are 1-person households, comprising 1,844.
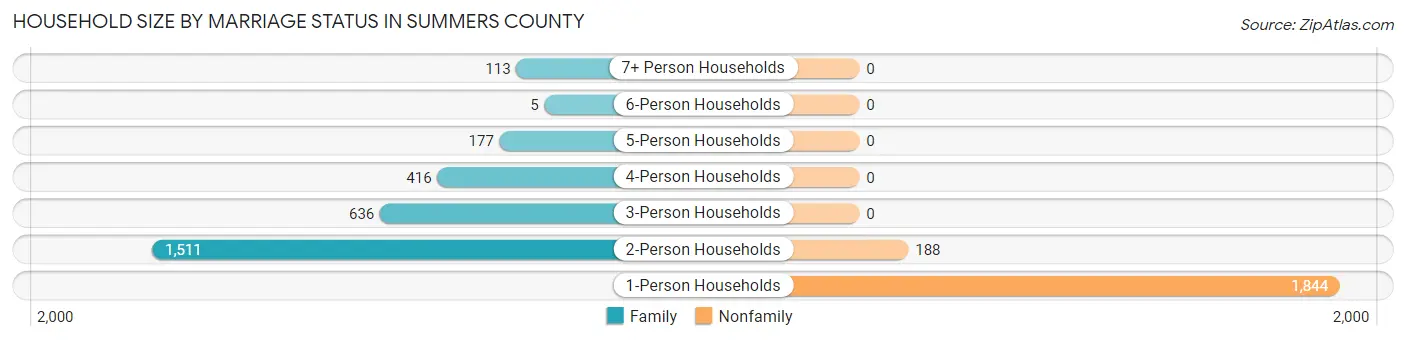
| Household Size | Family Households | Nonfamily Households |
| 1-Person Households | - | 1,844 (37.7%) |
| 2-Person Households | 1,511 (30.9%) | 188 (3.8%) |
| 3-Person Households | 636 (13.0%) | 0 (0.0%) |
| 4-Person Households | 416 (8.5%) | 0 (0.0%) |
| 5-Person Households | 177 (3.6%) | 0 (0.0%) |
| 6-Person Households | 5 (0.1%) | 0 (0.0%) |
| 7+ Person Households | 113 (2.3%) | 0 (0.0%) |
| Total | 2,858 (58.5%) | 2,032 (41.5%) |
Female Fertility in Summers County
Fertility by Age in Summers County
Average fertility rate in Summers County is 25.0 births per 1,000 women. Women in the age bracket of 20 to 34 years have the highest fertility rate with 62.0 births per 1,000 women. Women in the age bracket of 20 to 34 years acount for 85.5% of all women with births.

| Age Bracket | Women with Births | Births / 1,000 Women |
| 15 to 19 years | 0 (0.0%) | 0.0 |
| 20 to 34 years | 53 (85.5%) | 62.0 |
| 35 to 50 years | 9 (14.5%) | 7.0 |
| Total | 62 (100.0%) | 25.0 |
Fertility by Age by Marriage Status in Summers County
48.4% of women with births (62) in Summers County are married. The highest percentage of unmarried women with births falls into 20 to 34 years age bracket with 60.4% of them unmarried at the time of birth, while the lowest percentage of unmarried women with births belong to 35 to 50 years age bracket with 0.0% of them unmarried.

| Age Bracket | Married | Unmarried |
| 15 to 19 years | 0 (0.0%) | 0 (0.0%) |
| 20 to 34 years | 21 (39.6%) | 32 (60.4%) |
| 35 to 50 years | 9 (100.0%) | 0 (0.0%) |
| Total | 30 (48.4%) | 32 (51.6%) |
Fertility by Education in Summers County
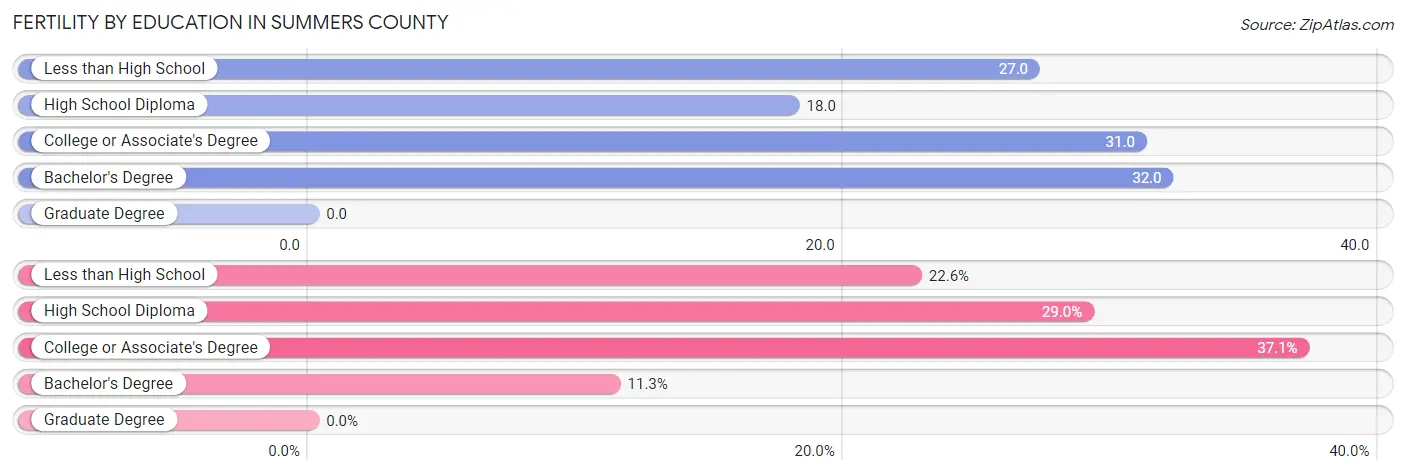
| Educational Attainment | Women with Births | Births / 1,000 Women |
| Less than High School | 14 (22.6%) | 27.0 |
| High School Diploma | 18 (29.0%) | 18.0 |
| College or Associate's Degree | 23 (37.1%) | 31.0 |
| Bachelor's Degree | 7 (11.3%) | 32.0 |
| Graduate Degree | 0 (0.0%) | 0.0 |
| Total | 62 (100.0%) | 25.0 |
Fertility by Education by Marriage Status in Summers County
51.6% of women with births in Summers County are unmarried. Women with the educational attainment of less than high school are most likely to be married with 100.0% of them married at childbirth, while women with the educational attainment of college or associate's degree are least likely to be married with 100.0% of them unmarried at childbirth.
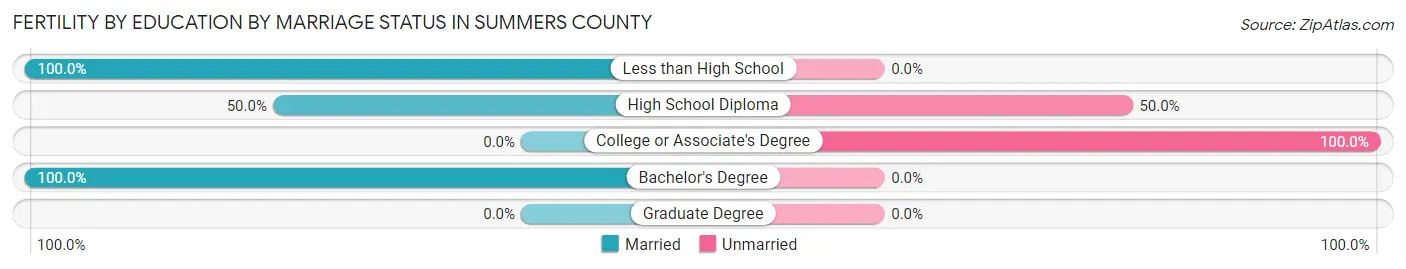
| Educational Attainment | Married | Unmarried |
| Less than High School | 14 (100.0%) | 0 (0.0%) |
| High School Diploma | 9 (50.0%) | 9 (50.0%) |
| College or Associate's Degree | 0 (0.0%) | 23 (100.0%) |
| Bachelor's Degree | 7 (100.0%) | 0 (0.0%) |
| Graduate Degree | 0 (0.0%) | 0 (0.0%) |
| Total | 30 (48.4%) | 32 (51.6%) |
Income in Summers County
Income Overview in Summers County
Per Capita Income in Summers County is $24,507, while median incomes of families and households are $61,955 and $42,991 respectively.
| Characteristic | Number | Measure |
| Per Capita Income | 11,985 | $24,507 |
| Median Family Income | 2,858 | $61,955 |
| Mean Family Income | 2,858 | $73,050 |
| Median Household Income | 4,890 | $42,991 |
| Mean Household Income | 4,890 | $57,446 |
| Income Deficit | 2,858 | $10,286 |
| Wage / Income Gap (%) | 11,985 | 25.19% |
| Wage / Income Gap ($) | 11,985 | 74.81¢ per $1 |
| Gini / Inequality Index | 11,985 | 0.42 |
Earnings by Sex in Summers County
Average Earnings in Summers County are $32,318, $39,250 for men and $29,364 for women, a difference of 25.2%.
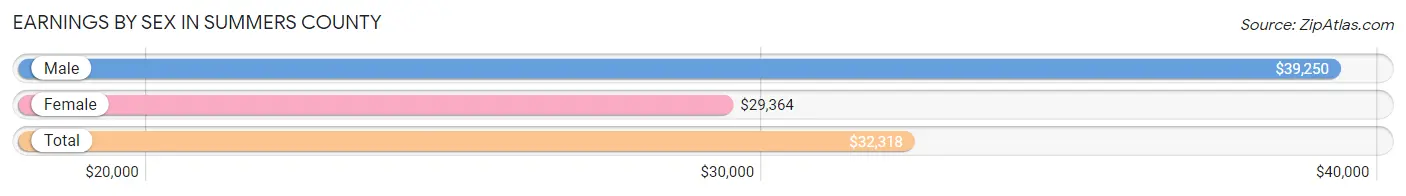
| Sex | Number | Average Earnings |
| Male | 2,193 (51.9%) | $39,250 |
| Female | 2,028 (48.0%) | $29,364 |
| Total | 4,221 (100.0%) | $32,318 |
Earnings by Sex by Income Bracket in Summers County
The most common earnings brackets in Summers County are $40,000 to $44,999 for men (229 | 10.4%) and $25,000 to $29,999 for women (236 | 11.6%).

| Income | Male | Female |
| $2,499 or less | 96 (4.4%) | 152 (7.5%) |
| $2,500 to $4,999 | 208 (9.5%) | 47 (2.3%) |
| $5,000 to $7,499 | 36 (1.6%) | 116 (5.7%) |
| $7,500 to $9,999 | 73 (3.3%) | 49 (2.4%) |
| $10,000 to $12,499 | 65 (3.0%) | 126 (6.2%) |
| $12,500 to $14,999 | 27 (1.2%) | 47 (2.3%) |
| $15,000 to $17,499 | 44 (2.0%) | 104 (5.1%) |
| $17,500 to $19,999 | 29 (1.3%) | 37 (1.8%) |
| $20,000 to $22,499 | 123 (5.6%) | 46 (2.3%) |
| $22,500 to $24,999 | 88 (4.0%) | 82 (4.0%) |
| $25,000 to $29,999 | 95 (4.3%) | 236 (11.6%) |
| $30,000 to $34,999 | 181 (8.3%) | 147 (7.2%) |
| $35,000 to $39,999 | 45 (2.1%) | 144 (7.1%) |
| $40,000 to $44,999 | 229 (10.4%) | 65 (3.2%) |
| $45,000 to $49,999 | 149 (6.8%) | 95 (4.7%) |
| $50,000 to $54,999 | 149 (6.8%) | 108 (5.3%) |
| $55,000 to $64,999 | 179 (8.2%) | 164 (8.1%) |
| $65,000 to $74,999 | 109 (5.0%) | 61 (3.0%) |
| $75,000 to $99,999 | 121 (5.5%) | 52 (2.6%) |
| $100,000+ | 147 (6.7%) | 150 (7.4%) |
| Total | 2,193 (100.0%) | 2,028 (100.0%) |
Earnings by Sex by Educational Attainment in Summers County
Average earnings in Summers County are $41,209 for men and $32,543 for women, a difference of 21.0%. Men with an educational attainment of high school diploma enjoy the highest average annual earnings of $45,913, while those with bachelor's degree education earn the least with $40,228. Women with an educational attainment of graduate degree earn the most with the average annual earnings of $112,917, while those with high school diploma education have the smallest earnings of $24,311.
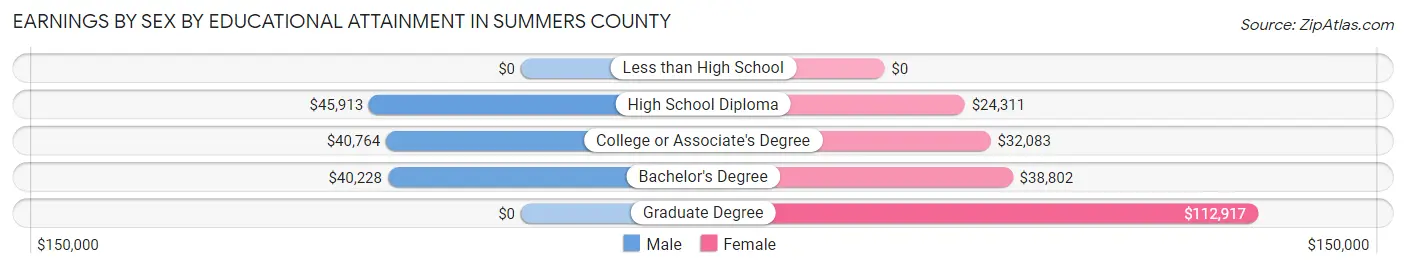
| Educational Attainment | Male Income | Female Income |
| Less than High School | - | - |
| High School Diploma | $45,913 | $24,311 |
| College or Associate's Degree | $40,764 | $32,083 |
| Bachelor's Degree | $40,228 | $38,802 |
| Graduate Degree | - | - |
| Total | $41,209 | $32,543 |
Family Income in Summers County
Family Income Brackets in Summers County
According to the Summers County family income data, there are 603 families falling into the $50,000 to $74,999 income range, which is the most common income bracket and makes up 21.1% of all families. Conversely, the $150,000 to $199,999 income bracket is the least frequent group with only 74 families (2.6%) belonging to this category.

| Income Bracket | # Families | % Families |
| Less than $10,000 | 149 | 5.2% |
| $10,000 to $14,999 | 97 | 3.4% |
| $15,000 to $24,999 | 223 | 7.8% |
| $25,000 to $34,999 | 174 | 6.1% |
| $35,000 to $49,999 | 420 | 14.7% |
| $50,000 to $74,999 | 603 | 21.1% |
| $75,000 to $99,999 | 432 | 15.1% |
| $100,000 to $149,999 | 583 | 20.4% |
| $150,000 to $199,999 | 74 | 2.6% |
| $200,000+ | 100 | 3.5% |
Family Income by Famaliy Size in Summers County
7+ person families (113 | 4.0%) account for the highest median family income in Summers County with $128,958 per family, while 2-person families (1,581 | 55.3%) have the highest median income of $30,739 per family member.
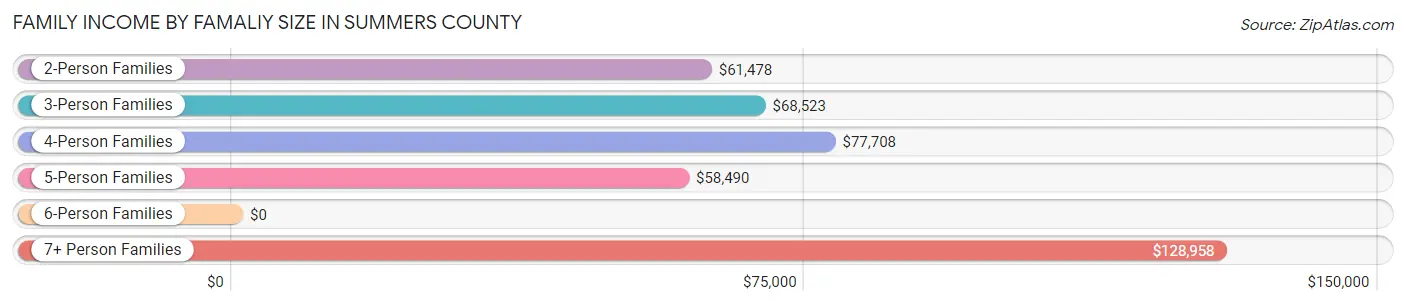
| Income Bracket | # Families | Median Income |
| 2-Person Families | 1,581 (55.3%) | $61,478 |
| 3-Person Families | 653 (22.9%) | $68,523 |
| 4-Person Families | 382 (13.4%) | $77,708 |
| 5-Person Families | 124 (4.3%) | $58,490 |
| 6-Person Families | 5 (0.2%) | $0 |
| 7+ Person Families | 113 (4.0%) | $128,958 |
| Total | 2,858 (100.0%) | $61,955 |
Family Income by Number of Earners in Summers County
The median family income in Summers County is $61,955, with families comprising 3+ earners (158) having the highest median family income of $112,569, while families with no earners (872) have the lowest median family income of $42,670, accounting for 5.5% and 30.5% of families, respectively.

| Number of Earners | # Families | Median Income |
| No Earners | 872 (30.5%) | $42,670 |
| 1 Earner | 1,059 (37.0%) | $54,464 |
| 2 Earners | 769 (26.9%) | $102,969 |
| 3+ Earners | 158 (5.5%) | $112,569 |
| Total | 2,858 (100.0%) | $61,955 |
Household Income in Summers County
Household Income Brackets in Summers County
With 890 households falling in the category, the $50,000 to $74,999 income range is the most frequent in Summers County, accounting for 18.2% of all households. In contrast, only 88 households (1.8%) fall into the $150,000 to $199,999 income bracket, making it the least populous group.
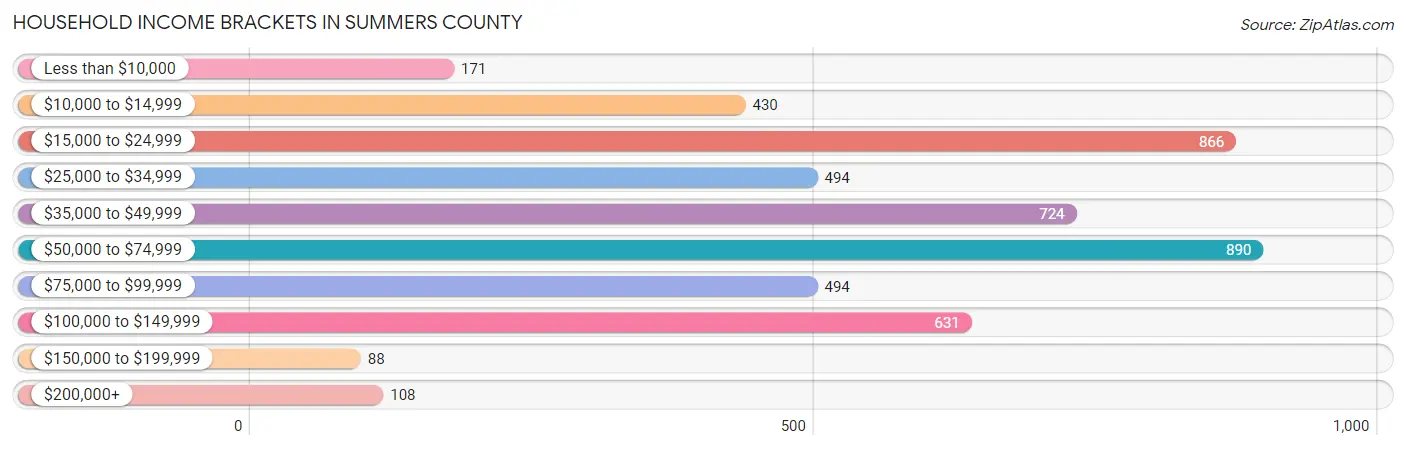
| Income Bracket | # Households | % Households |
| Less than $10,000 | 171 | 3.5% |
| $10,000 to $14,999 | 430 | 8.8% |
| $15,000 to $24,999 | 866 | 17.7% |
| $25,000 to $34,999 | 494 | 10.1% |
| $35,000 to $49,999 | 724 | 14.8% |
| $50,000 to $74,999 | 890 | 18.2% |
| $75,000 to $99,999 | 494 | 10.1% |
| $100,000 to $149,999 | 631 | 12.9% |
| $150,000 to $199,999 | 88 | 1.8% |
| $200,000+ | 108 | 2.2% |
Household Income by Householder Age in Summers County
The median household income in Summers County is $42,991, with the highest median household income of $58,385 found in the 25 to 44 years age bracket for the primary householder. A total of 856 households (17.5%) fall into this category. Meanwhile, the 65+ years age bracket for the primary householder has the lowest median household income of $33,682, with 1,842 households (37.7%) in this group.
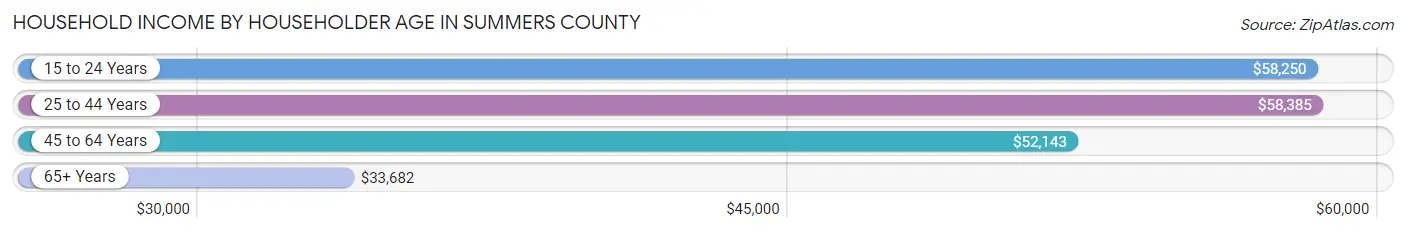
| Income Bracket | # Households | Median Income |
| 15 to 24 Years | 88 (1.8%) | $58,250 |
| 25 to 44 Years | 856 (17.5%) | $58,385 |
| 45 to 64 Years | 2,104 (43.0%) | $52,143 |
| 65+ Years | 1,842 (37.7%) | $33,682 |
| Total | 4,890 (100.0%) | $42,991 |
Poverty in Summers County
Income Below Poverty by Sex and Age in Summers County
With 19.5% poverty level for males and 22.8% for females among the residents of Summers County, under 5 year old males and 15 year old females are the most vulnerable to poverty, with 161 males (54.2%) and 34 females (46.6%) in their respective age groups living below the poverty level.

| Age Bracket | Male | Female |
| Under 5 Years | 161 (54.2%) | 58 (40.0%) |
| 5 Years | 0 (0.0%) | 20 (34.5%) |
| 6 to 11 Years | 136 (43.2%) | 142 (42.6%) |
| 12 to 14 Years | 34 (19.8%) | 80 (42.3%) |
| 15 Years | 0 (0.0%) | 34 (46.6%) |
| 16 and 17 Years | 18 (15.8%) | 10 (11.0%) |
| 18 to 24 Years | 43 (12.7%) | 125 (39.6%) |
| 25 to 34 Years | 83 (17.2%) | 178 (33.7%) |
| 35 to 44 Years | 128 (19.2%) | 124 (21.3%) |
| 45 to 54 Years | 123 (17.8%) | 166 (24.3%) |
| 55 to 64 Years | 228 (23.3%) | 156 (16.6%) |
| 65 to 74 Years | 72 (7.9%) | 88 (9.8%) |
| 75 Years and over | 62 (12.4%) | 82 (11.9%) |
| Total | 1,088 (19.5%) | 1,263 (22.8%) |
Income Above Poverty by Sex and Age in Summers County
According to the poverty statistics in Summers County, males aged 5 years and females aged 65 to 74 years are the age groups that are most secure financially, with 100.0% of males and 90.2% of females in these age groups living above the poverty line.
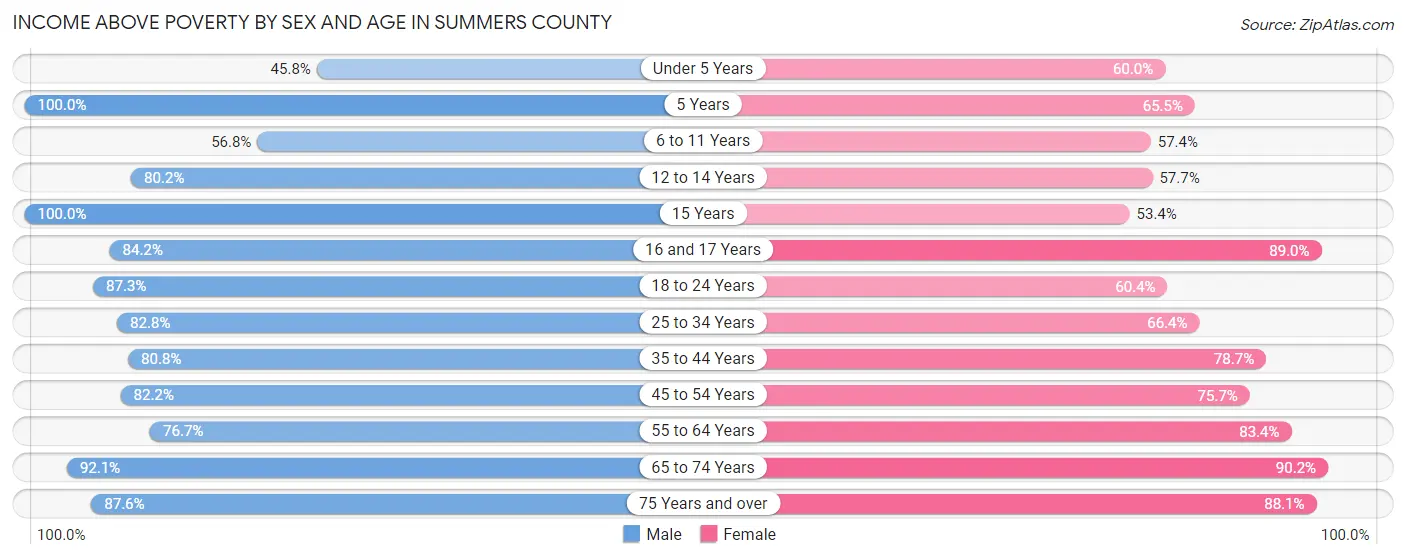
| Age Bracket | Male | Female |
| Under 5 Years | 136 (45.8%) | 87 (60.0%) |
| 5 Years | 37 (100.0%) | 38 (65.5%) |
| 6 to 11 Years | 179 (56.8%) | 191 (57.4%) |
| 12 to 14 Years | 138 (80.2%) | 109 (57.7%) |
| 15 Years | 61 (100.0%) | 39 (53.4%) |
| 16 and 17 Years | 96 (84.2%) | 81 (89.0%) |
| 18 to 24 Years | 295 (87.3%) | 191 (60.4%) |
| 25 to 34 Years | 400 (82.8%) | 351 (66.3%) |
| 35 to 44 Years | 538 (80.8%) | 459 (78.7%) |
| 45 to 54 Years | 567 (82.2%) | 517 (75.7%) |
| 55 to 64 Years | 750 (76.7%) | 786 (83.4%) |
| 65 to 74 Years | 844 (92.1%) | 812 (90.2%) |
| 75 Years and over | 438 (87.6%) | 606 (88.1%) |
| Total | 4,479 (80.5%) | 4,267 (77.2%) |
Income Below Poverty Among Married-Couple Families in Summers County
The poverty statistics for married-couple families in Summers County show that 10.1% or 213 of the total 2,120 families live below the poverty line. Families with 5 or more children have the highest poverty rate of 43.5%, comprising of 30 families. On the other hand, families with no children have the lowest poverty rate of 4.8%, which includes 70 families.

| Children | Above Poverty | Below Poverty |
| No Children | 1,375 (95.2%) | 70 (4.8%) |
| 1 or 2 Children | 419 (80.6%) | 101 (19.4%) |
| 3 or 4 Children | 74 (86.1%) | 12 (14.0%) |
| 5 or more Children | 39 (56.5%) | 30 (43.5%) |
| Total | 1,907 (89.9%) | 213 (10.1%) |
Income Below Poverty Among Single-Parent Households in Summers County
According to the poverty data in Summers County, 24.7% or 89 single-father households and 42.9% or 162 single-mother households are living below the poverty line. Among single-father households, those with 1 or 2 children have the highest poverty rate, with 63 households (67.7%) experiencing poverty. Likewise, among single-mother households, those with 3 or 4 children have the highest poverty rate, with 48 households (100.0%) falling below the poverty line.
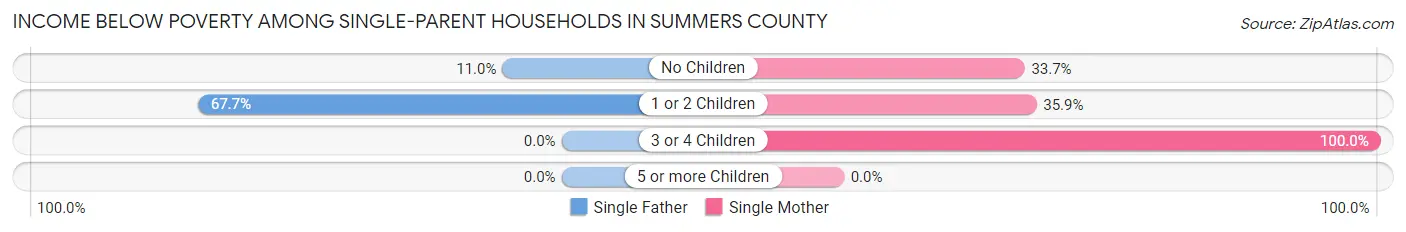
| Children | Single Father | Single Mother |
| No Children | 26 (11.0%) | 67 (33.7%) |
| 1 or 2 Children | 63 (67.7%) | 47 (35.9%) |
| 3 or 4 Children | 0 (0.0%) | 48 (100.0%) |
| 5 or more Children | 0 (0.0%) | 0 (0.0%) |
| Total | 89 (24.7%) | 162 (42.9%) |
Income Below Poverty Among Married-Couple vs Single-Parent Households in Summers County
The poverty data for Summers County shows that 213 of the married-couple family households (10.1%) and 251 of the single-parent households (34.0%) are living below the poverty level. Within the married-couple family households, those with 5 or more children have the highest poverty rate, with 30 households (43.5%) falling below the poverty line. Among the single-parent households, those with 3 or 4 children have the highest poverty rate, with 48 household (60.8%) living below poverty.
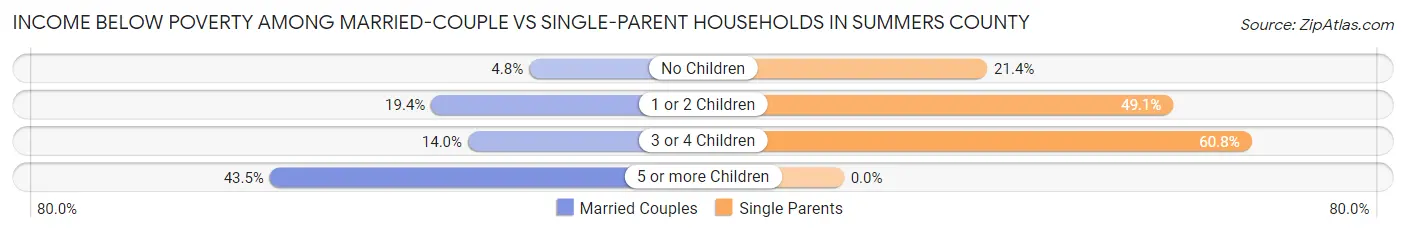
| Children | Married-Couple Families | Single-Parent Households |
| No Children | 70 (4.8%) | 93 (21.4%) |
| 1 or 2 Children | 101 (19.4%) | 110 (49.1%) |
| 3 or 4 Children | 12 (14.0%) | 48 (60.8%) |
| 5 or more Children | 30 (43.5%) | 0 (0.0%) |
| Total | 213 (10.1%) | 251 (34.0%) |
Employment Characteristics in Summers County
Employment by Class of Employer in Summers County
Among the 3,356 employed individuals in Summers County, private company employees (1,753 | 52.2%), local government employees (549 | 16.4%), and self-employed (not incorporated) (306 | 9.1%) make up the most common classes of employment.
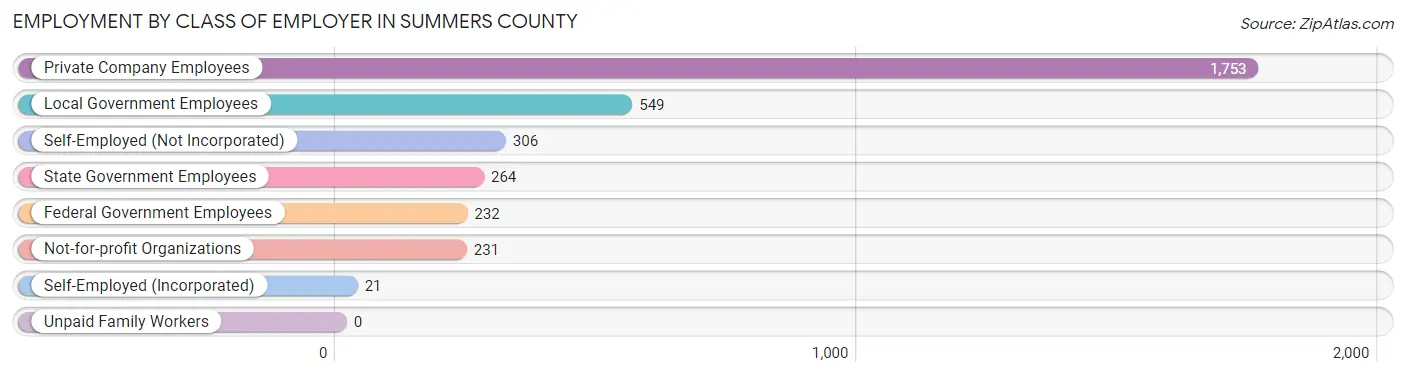
| Employer Class | # Employees | % Employees |
| Private Company Employees | 1,753 | 52.2% |
| Self-Employed (Incorporated) | 21 | 0.6% |
| Self-Employed (Not Incorporated) | 306 | 9.1% |
| Not-for-profit Organizations | 231 | 6.9% |
| Local Government Employees | 549 | 16.4% |
| State Government Employees | 264 | 7.9% |
| Federal Government Employees | 232 | 6.9% |
| Unpaid Family Workers | 0 | 0.0% |
| Total | 3,356 | 100.0% |
Employment Status by Age in Summers County
According to the labor force statistics for Summers County, out of the total population over 16 years of age (10,289), 37.3% or 3,838 individuals are in the labor force, with 7.6% or 292 of them unemployed. The age group with the highest labor force participation rate is 20 to 24 years, with 73.0% or 298 individuals in the labor force. Within the labor force, the 20 to 24 years age range has the highest percentage of unemployed individuals, with 24.8% or 74 of them being unemployed.
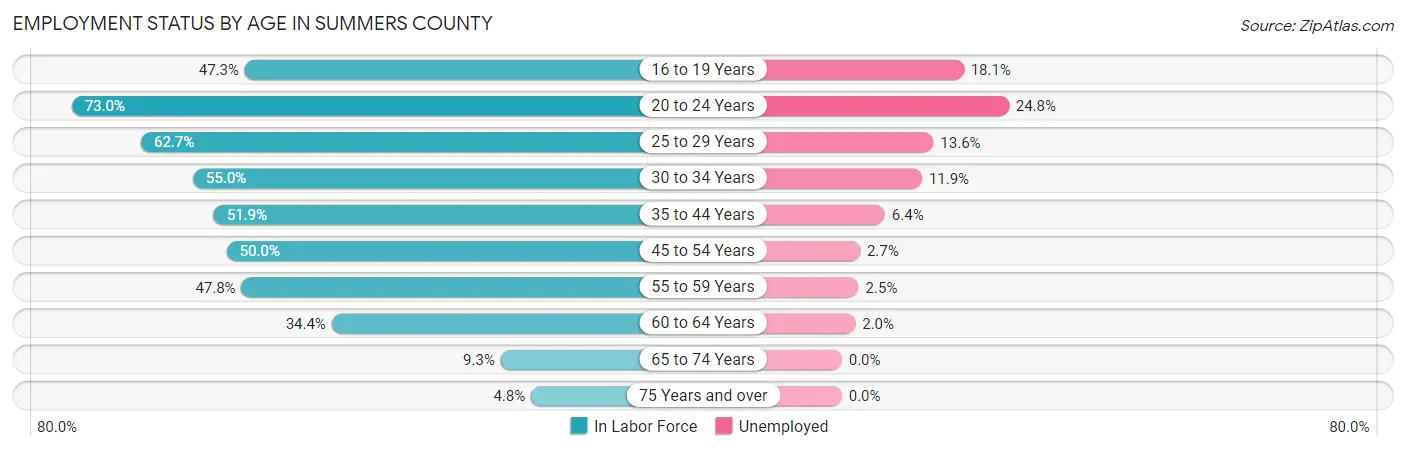
| Age Bracket | In Labor Force | Unemployed |
| 16 to 19 Years | 216 (47.3%) | 39 (18.1%) |
| 20 to 24 Years | 298 (73.0%) | 74 (24.8%) |
| 25 to 29 Years | 398 (62.7%) | 54 (13.6%) |
| 30 to 34 Years | 295 (55.0%) | 35 (11.9%) |
| 35 to 44 Years | 796 (51.9%) | 51 (6.4%) |
| 45 to 54 Years | 766 (50.0%) | 21 (2.7%) |
| 55 to 59 Years | 476 (47.8%) | 12 (2.5%) |
| 60 to 64 Years | 356 (34.4%) | 7 (2.0%) |
| 65 to 74 Years | 173 (9.3%) | 0 (0.0%) |
| 75 Years and over | 62 (4.8%) | 0 (0.0%) |
| Total | 3,838 (37.3%) | 292 (7.6%) |
Employment Status by Educational Attainment in Summers County
According to labor force statistics for Summers County, 49.3% of individuals (3,090) out of the total population between 25 and 64 years of age (6,267) are in the labor force, with 5.8% or 179 of them being unemployed. The group with the highest labor force participation rate are those with the educational attainment of bachelor's degree or higher, with 77.9% or 783 individuals in the labor force. Within the labor force, individuals with bachelor's degree or higher education have the highest percentage of unemployment, with 9.5% or 74 of them being unemployed.
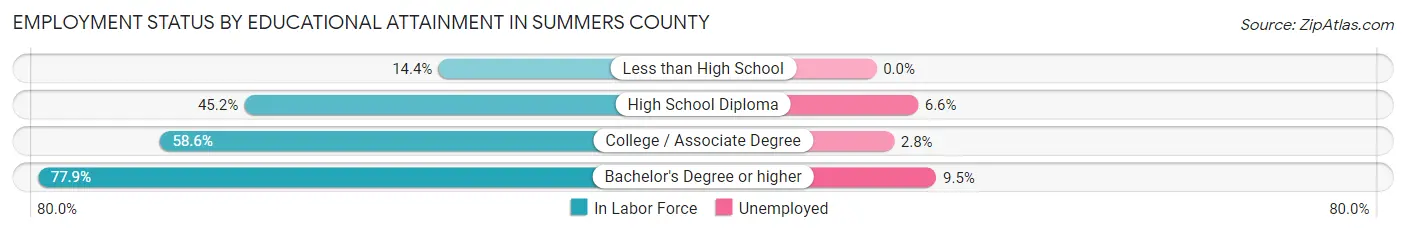
| Educational Attainment | In Labor Force | Unemployed |
| Less than High School | 141 (14.4%) | 0 (0.0%) |
| High School Diploma | 1,175 (45.2%) | 172 (6.6%) |
| College / Associate Degree | 989 (58.6%) | 47 (2.8%) |
| Bachelor's Degree or higher | 783 (77.9%) | 95 (9.5%) |
| Total | 3,090 (49.3%) | 363 (5.8%) |
Employment Occupations by Sex in Summers County
Management, Business, Science and Arts Occupations
The most common Management, Business, Science and Arts occupations in Summers County are Management (386 | 10.9%), Community & Social Service (302 | 8.5%), Health Diagnosing & Treating (235 | 6.6%), Computers, Engineering & Science (212 | 6.0%), and Computers & Mathematics (200 | 5.6%).

Management, Business, Science and Arts Occupations by Sex
Within the Management, Business, Science and Arts occupations in Summers County, the most male-oriented occupations are Arts, Media & Entertainment (89.3%), Architecture & Engineering (85.7%), and Computers & Mathematics (73.0%), while the most female-oriented occupations are Life, Physical & Social Science (100.0%), Health Technologists (95.0%), and Health Diagnosing & Treating (88.1%).

| Occupation | Male | Female |
| Management | 247 (64.0%) | 139 (36.0%) |
| Business & Financial | 32 (40.5%) | 47 (59.5%) |
| Computers, Engineering & Science | 152 (71.7%) | 60 (28.3%) |
| Computers & Mathematics | 146 (73.0%) | 54 (27.0%) |
| Architecture & Engineering | 6 (85.7%) | 1 (14.3%) |
| Life, Physical & Social Science | 0 (0.0%) | 5 (100.0%) |
| Community & Social Service | 86 (28.5%) | 216 (71.5%) |
| Education, Arts & Media | 26 (34.2%) | 50 (65.8%) |
| Legal Services & Support | 13 (46.4%) | 15 (53.6%) |
| Education Instruction & Library | 22 (12.9%) | 148 (87.1%) |
| Arts, Media & Entertainment | 25 (89.3%) | 3 (10.7%) |
| Health Diagnosing & Treating | 28 (11.9%) | 207 (88.1%) |
| Health Technologists | 7 (5.0%) | 134 (95.0%) |
| Total (Category) | 545 (44.9%) | 669 (55.1%) |
| Total (Overall) | 1,884 (53.2%) | 1,659 (46.8%) |
Services Occupations
The most common Services occupations in Summers County are Security & Protection (261 | 7.4%), Healthcare Support (164 | 4.6%), Law Enforcement (160 | 4.5%), Cleaning & Maintenance (143 | 4.0%), and Firefighting & Prevention (101 | 2.9%).

Services Occupations by Sex
Within the Services occupations in Summers County, the most male-oriented occupations are Law Enforcement (83.8%), Security & Protection (79.7%), and Firefighting & Prevention (73.3%), while the most female-oriented occupations are Healthcare Support (75.0%), Personal Care & Service (52.3%), and Food Preparation & Serving (49.0%).
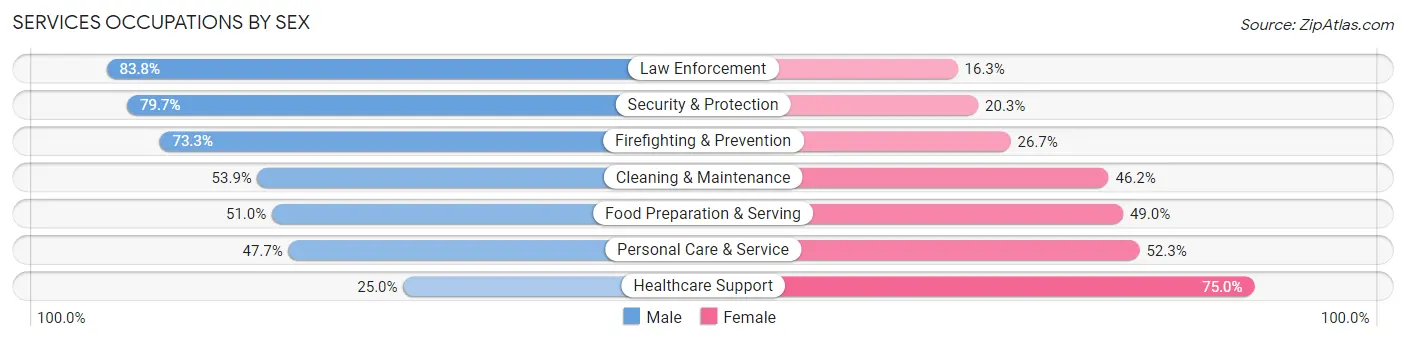
| Occupation | Male | Female |
| Healthcare Support | 41 (25.0%) | 123 (75.0%) |
| Security & Protection | 208 (79.7%) | 53 (20.3%) |
| Firefighting & Prevention | 74 (73.3%) | 27 (26.7%) |
| Law Enforcement | 134 (83.8%) | 26 (16.3%) |
| Food Preparation & Serving | 51 (51.0%) | 49 (49.0%) |
| Cleaning & Maintenance | 77 (53.8%) | 66 (46.2%) |
| Personal Care & Service | 21 (47.7%) | 23 (52.3%) |
| Total (Category) | 398 (55.9%) | 314 (44.1%) |
| Total (Overall) | 1,884 (53.2%) | 1,659 (46.8%) |
Sales and Office Occupations
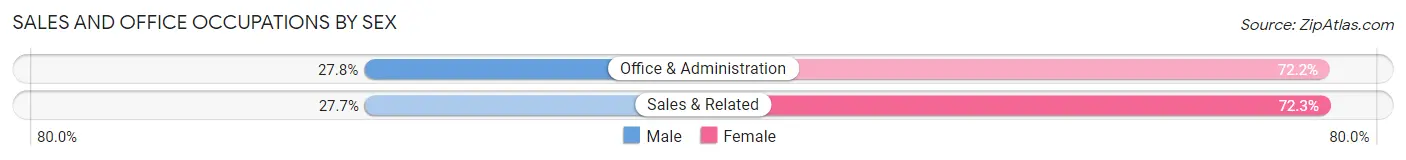
The most common Sales and Office occupations in Summers County are Office & Administration (421 | 11.9%), and Sales & Related (365 | 10.3%).

Sales and Office Occupations by Sex
| Occupation | Male | Female |
| Sales & Related | 101 (27.7%) | 264 (72.3%) |
| Office & Administration | 117 (27.8%) | 304 (72.2%) |
| Total (Category) | 218 (27.7%) | 568 (72.3%) |
| Total (Overall) | 1,884 (53.2%) | 1,659 (46.8%) |
Natural Resources, Construction and Maintenance Occupations
The most common Natural Resources, Construction and Maintenance occupations in Summers County are Construction & Extraction (229 | 6.5%), Installation, Maintenance & Repair (181 | 5.1%), and Farming, Fishing & Forestry (36 | 1.0%).

Natural Resources, Construction and Maintenance Occupations by Sex
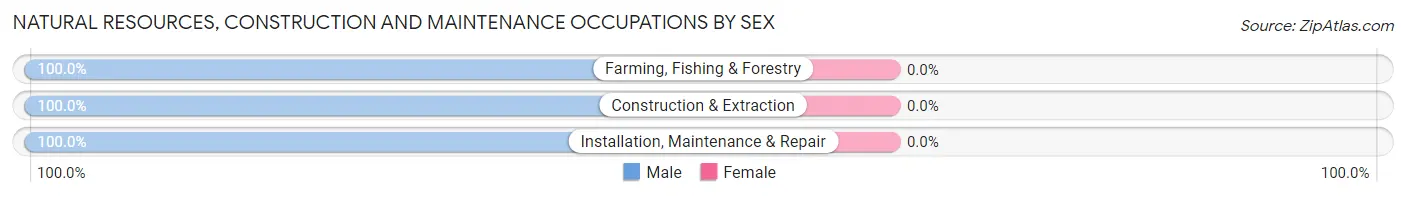
| Occupation | Male | Female |
| Farming, Fishing & Forestry | 36 (100.0%) | 0 (0.0%) |
| Construction & Extraction | 229 (100.0%) | 0 (0.0%) |
| Installation, Maintenance & Repair | 181 (100.0%) | 0 (0.0%) |
| Total (Category) | 446 (100.0%) | 0 (0.0%) |
| Total (Overall) | 1,884 (53.2%) | 1,659 (46.8%) |
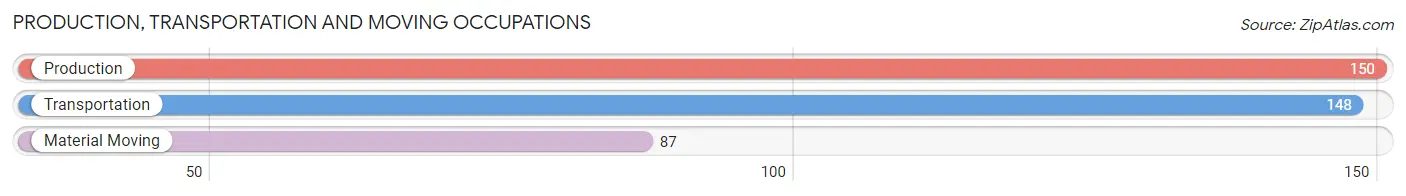
Production, Transportation and Moving Occupations
The most common Production, Transportation and Moving occupations in Summers County are Production (150 | 4.2%), Transportation (148 | 4.2%), and Material Moving (87 | 2.5%).
Production, Transportation and Moving Occupations by Sex
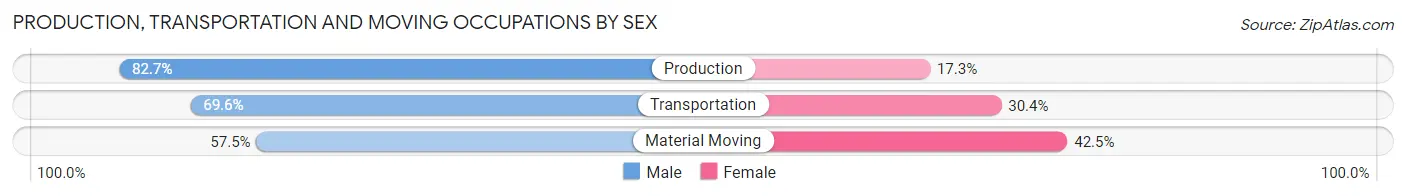
| Occupation | Male | Female |
| Production | 124 (82.7%) | 26 (17.3%) |
| Transportation | 103 (69.6%) | 45 (30.4%) |
| Material Moving | 50 (57.5%) | 37 (42.5%) |
| Total (Category) | 277 (72.0%) | 108 (28.1%) |
| Total (Overall) | 1,884 (53.2%) | 1,659 (46.8%) |
Employment Industries by Sex in Summers County
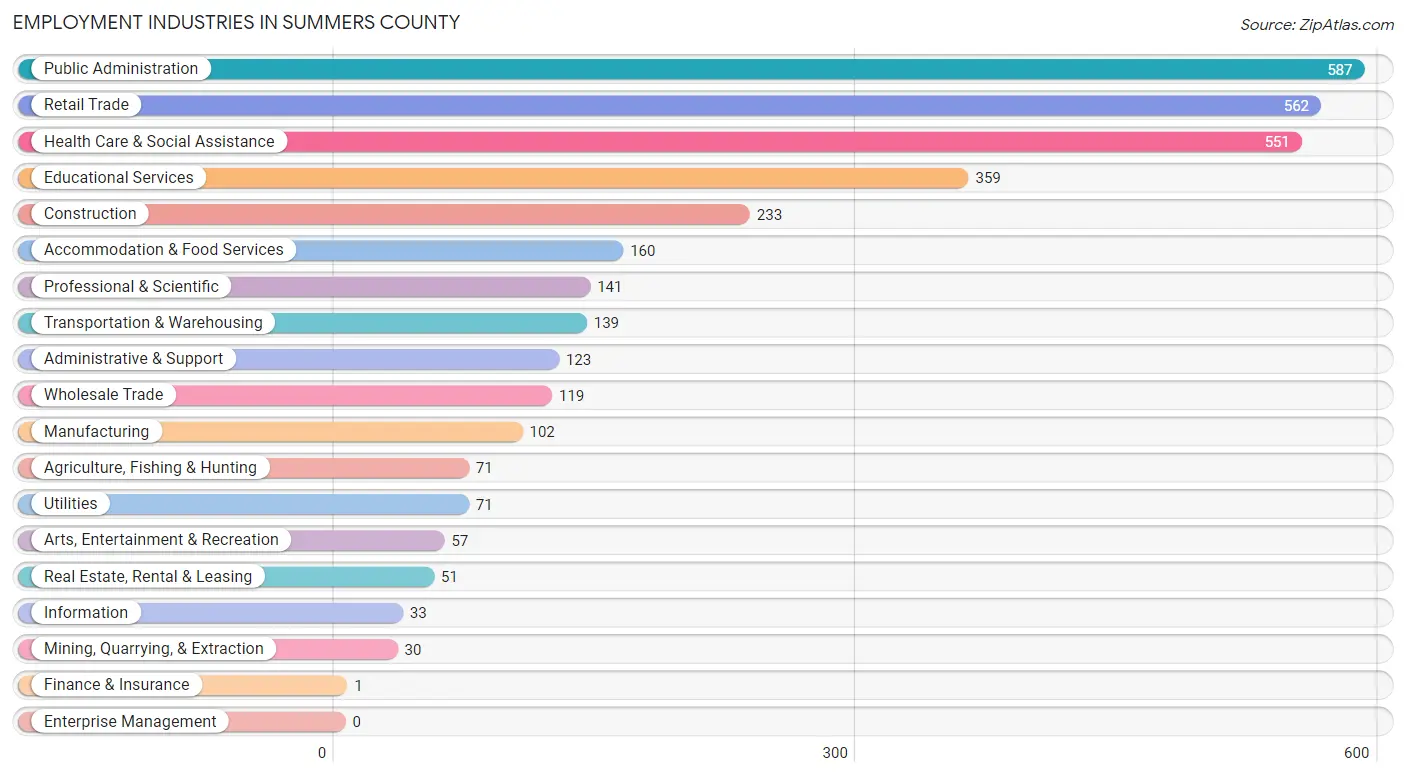
Employment Industries in Summers County
The major employment industries in Summers County include Public Administration (587 | 16.6%), Retail Trade (562 | 15.9%), Health Care & Social Assistance (551 | 15.5%), Educational Services (359 | 10.1%), and Construction (233 | 6.6%).
Employment Industries by Sex in Summers County
The Summers County industries that see more men than women are Agriculture, Fishing & Hunting (100.0%), Construction (100.0%), and Utilities (100.0%), whereas the industries that tend to have a higher number of women are Health Care & Social Assistance (89.1%), Educational Services (77.4%), and Accommodation & Food Services (64.4%).

| Industry | Male | Female |
| Agriculture, Fishing & Hunting | 71 (100.0%) | 0 (0.0%) |
| Mining, Quarrying, & Extraction | 29 (96.7%) | 1 (3.3%) |
| Construction | 233 (100.0%) | 0 (0.0%) |
| Manufacturing | 79 (77.4%) | 23 (22.6%) |
| Wholesale Trade | 61 (51.3%) | 58 (48.7%) |
| Retail Trade | 252 (44.8%) | 310 (55.2%) |
| Transportation & Warehousing | 132 (95.0%) | 7 (5.0%) |
| Utilities | 71 (100.0%) | 0 (0.0%) |
| Information | 33 (100.0%) | 0 (0.0%) |
| Finance & Insurance | 1 (100.0%) | 0 (0.0%) |
| Real Estate, Rental & Leasing | 26 (51.0%) | 25 (49.0%) |
| Professional & Scientific | 67 (47.5%) | 74 (52.5%) |
| Enterprise Management | 0 (0.0%) | 0 (0.0%) |
| Administrative & Support | 71 (57.7%) | 52 (42.3%) |
| Educational Services | 81 (22.6%) | 278 (77.4%) |
| Health Care & Social Assistance | 60 (10.9%) | 491 (89.1%) |
| Arts, Entertainment & Recreation | 33 (57.9%) | 24 (42.1%) |
| Accommodation & Food Services | 57 (35.6%) | 103 (64.4%) |
| Public Administration | 400 (68.1%) | 187 (31.9%) |
| Total | 1,884 (53.2%) | 1,659 (46.8%) |
Education in Summers County
School Enrollment in Summers County
The most common levels of schooling among the 1,615 students in Summers County are middle school (479 | 29.7%), high school (452 | 28.0%), and elementary school (347 | 21.5%).
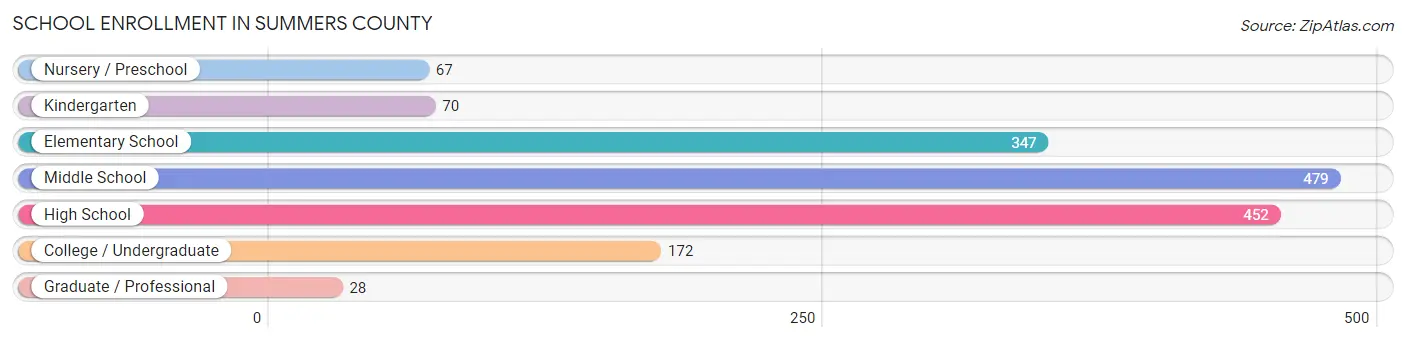
| School Level | # Students | % Students |
| Nursery / Preschool | 67 | 4.2% |
| Kindergarten | 70 | 4.3% |
| Elementary School | 347 | 21.5% |
| Middle School | 479 | 29.7% |
| High School | 452 | 28.0% |
| College / Undergraduate | 172 | 10.6% |
| Graduate / Professional | 28 | 1.7% |
| Total | 1,615 | 100.0% |
School Enrollment by Age by Funding Source in Summers County
Out of a total of 1,615 students who are enrolled in schools in Summers County, 278 (17.2%) attend a private institution, while the remaining 1,337 (82.8%) are enrolled in public schools. The age group of 3 to 4 year olds has the highest likelihood of being enrolled in private schools, with 41 (100.0% in the age bracket) enrolled. Conversely, the age group of 25 to 34 year olds has the lowest likelihood of being enrolled in a private school, with 57 (100.0% in the age bracket) attending a public institution.
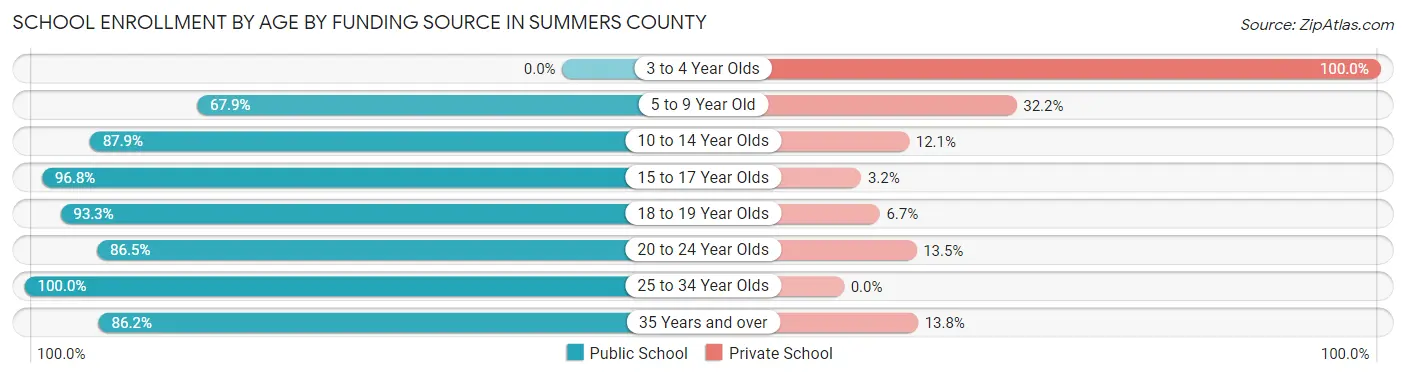
| Age Bracket | Public School | Private School |
| 3 to 4 Year Olds | 0 (0.0%) | 41 (100.0%) |
| 5 to 9 Year Old | 287 (67.8%) | 136 (32.2%) |
| 10 to 14 Year Olds | 442 (87.9%) | 61 (12.1%) |
| 15 to 17 Year Olds | 300 (96.8%) | 10 (3.2%) |
| 18 to 19 Year Olds | 112 (93.3%) | 8 (6.7%) |
| 20 to 24 Year Olds | 64 (86.5%) | 10 (13.5%) |
| 25 to 34 Year Olds | 57 (100.0%) | 0 (0.0%) |
| 35 Years and over | 75 (86.2%) | 12 (13.8%) |
| Total | 1,337 (82.8%) | 278 (17.2%) |
Educational Attainment by Field of Study in Summers County
Business (400 | 22.4%), science & technology (341 | 19.1%), education (311 | 17.4%), arts & humanities (193 | 10.8%), and social sciences (147 | 8.2%) are the most common fields of study among 1,786 individuals in Summers County who have obtained a bachelor's degree or higher.

| Field of Study | # Graduates | % Graduates |
| Computers & Mathematics | 14 | 0.8% |
| Bio, Nature & Agricultural | 82 | 4.6% |
| Physical & Health Sciences | 19 | 1.1% |
| Psychology | 127 | 7.1% |
| Social Sciences | 147 | 8.2% |
| Engineering | 1 | 0.1% |
| Multidisciplinary Studies | 0 | 0.0% |
| Science & Technology | 341 | 19.1% |
| Business | 400 | 22.4% |
| Education | 311 | 17.4% |
| Literature & Languages | 42 | 2.4% |
| Liberal Arts & History | 45 | 2.5% |
| Visual & Performing Arts | 24 | 1.3% |
| Communications | 40 | 2.2% |
| Arts & Humanities | 193 | 10.8% |
| Total | 1,786 | 100.0% |
Transportation & Commute in Summers County
Vehicle Availability by Sex in Summers County
The most prevalent vehicle ownership categories in Summers County are males with 2 vehicles (840, accounting for 48.8%) and females with 2 vehicles (735, making up 51.8%).
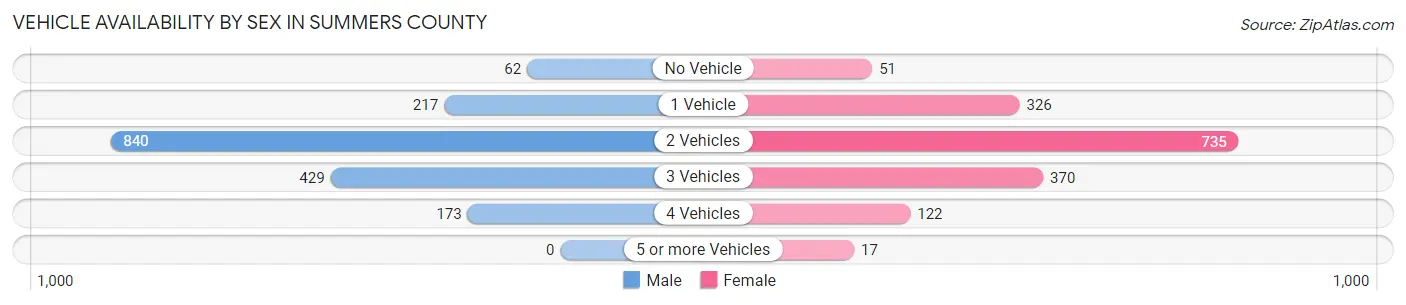
| Vehicles Available | Male | Female |
| No Vehicle | 62 (3.6%) | 51 (3.2%) |
| 1 Vehicle | 217 (12.6%) | 326 (20.1%) |
| 2 Vehicles | 840 (48.8%) | 735 (45.3%) |
| 3 Vehicles | 429 (24.9%) | 370 (22.8%) |
| 4 Vehicles | 173 (10.1%) | 122 (7.5%) |
| 5 or more Vehicles | 0 (0.0%) | 17 (1.1%) |
| Total | 1,721 (100.0%) | 1,621 (100.0%) |
Commute Time in Summers County
The most frequently occuring commute durations in Summers County are 45 to 59 minutes (569 commuters, 18.2%), 30 to 34 minutes (455 commuters, 14.6%), and 15 to 19 minutes (453 commuters, 14.5%).
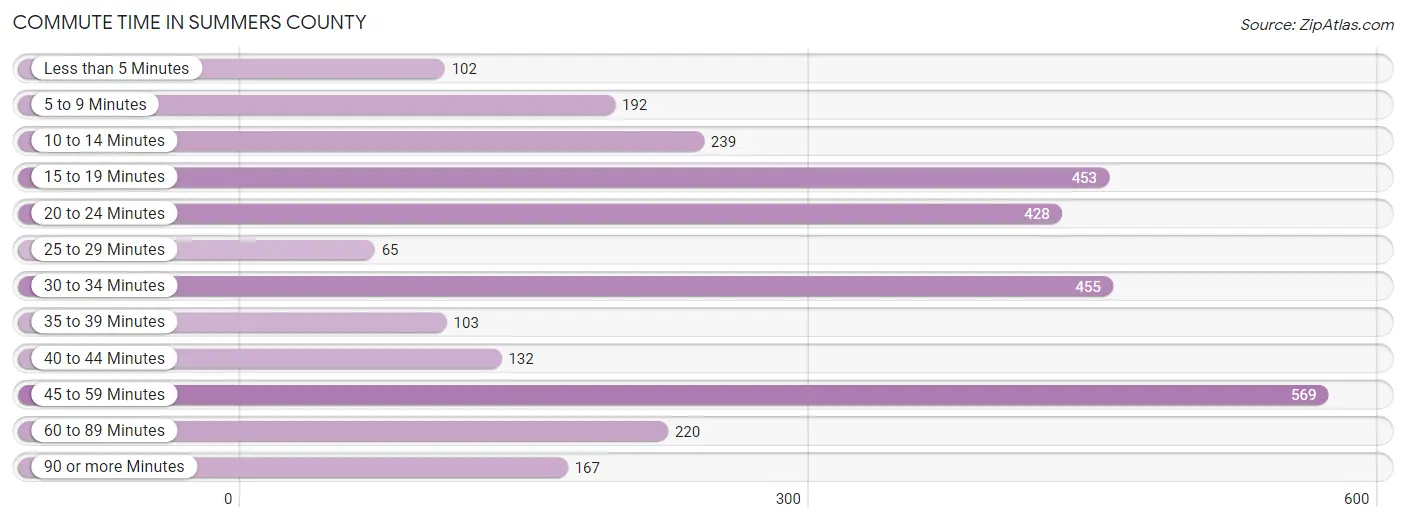
| Commute Time | # Commuters | % Commuters |
| Less than 5 Minutes | 102 | 3.3% |
| 5 to 9 Minutes | 192 | 6.1% |
| 10 to 14 Minutes | 239 | 7.6% |
| 15 to 19 Minutes | 453 | 14.5% |
| 20 to 24 Minutes | 428 | 13.7% |
| 25 to 29 Minutes | 65 | 2.1% |
| 30 to 34 Minutes | 455 | 14.6% |
| 35 to 39 Minutes | 103 | 3.3% |
| 40 to 44 Minutes | 132 | 4.2% |
| 45 to 59 Minutes | 569 | 18.2% |
| 60 to 89 Minutes | 220 | 7.0% |
| 90 or more Minutes | 167 | 5.3% |
Commute Time by Sex in Summers County
The most common commute times in Summers County are 45 to 59 minutes (309 commuters, 19.0%) for males and 45 to 59 minutes (260 commuters, 17.3%) for females.
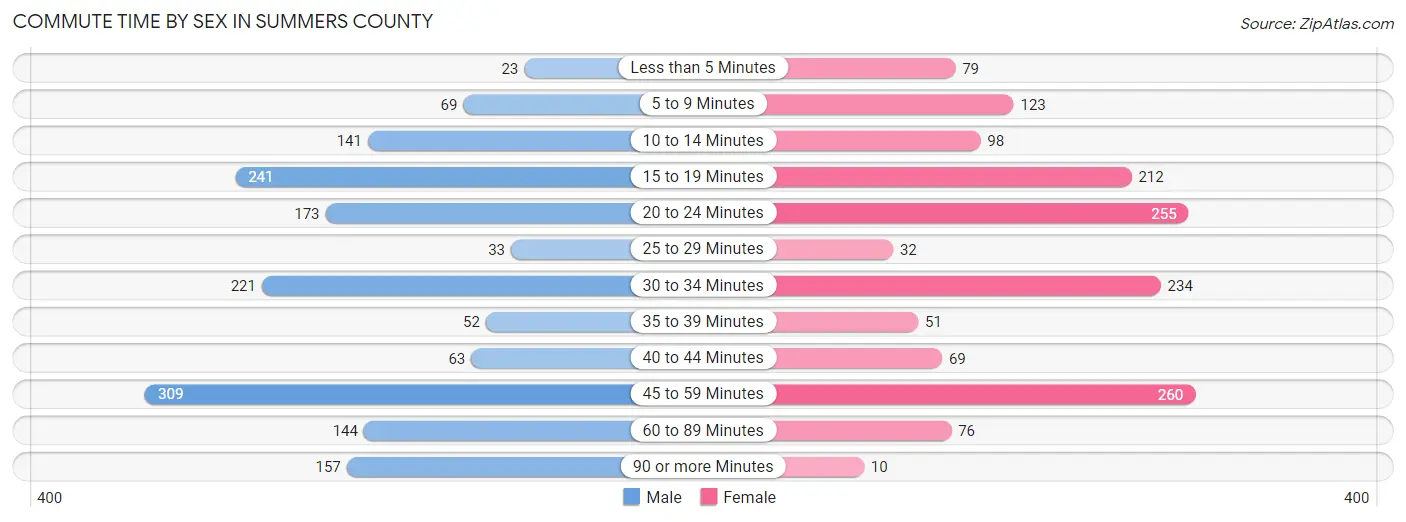
| Commute Time | Male | Female |
| Less than 5 Minutes | 23 (1.4%) | 79 (5.3%) |
| 5 to 9 Minutes | 69 (4.2%) | 123 (8.2%) |
| 10 to 14 Minutes | 141 (8.7%) | 98 (6.5%) |
| 15 to 19 Minutes | 241 (14.8%) | 212 (14.1%) |
| 20 to 24 Minutes | 173 (10.6%) | 255 (17.0%) |
| 25 to 29 Minutes | 33 (2.0%) | 32 (2.1%) |
| 30 to 34 Minutes | 221 (13.6%) | 234 (15.6%) |
| 35 to 39 Minutes | 52 (3.2%) | 51 (3.4%) |
| 40 to 44 Minutes | 63 (3.9%) | 69 (4.6%) |
| 45 to 59 Minutes | 309 (19.0%) | 260 (17.3%) |
| 60 to 89 Minutes | 144 (8.9%) | 76 (5.1%) |
| 90 or more Minutes | 157 (9.7%) | 10 (0.7%) |
Time of Departure to Work by Sex in Summers County
The most frequent times of departure to work in Summers County are 6:30 AM to 6:59 AM (278, 17.1%) for males and 6:30 AM to 6:59 AM (334, 22.3%) for females.
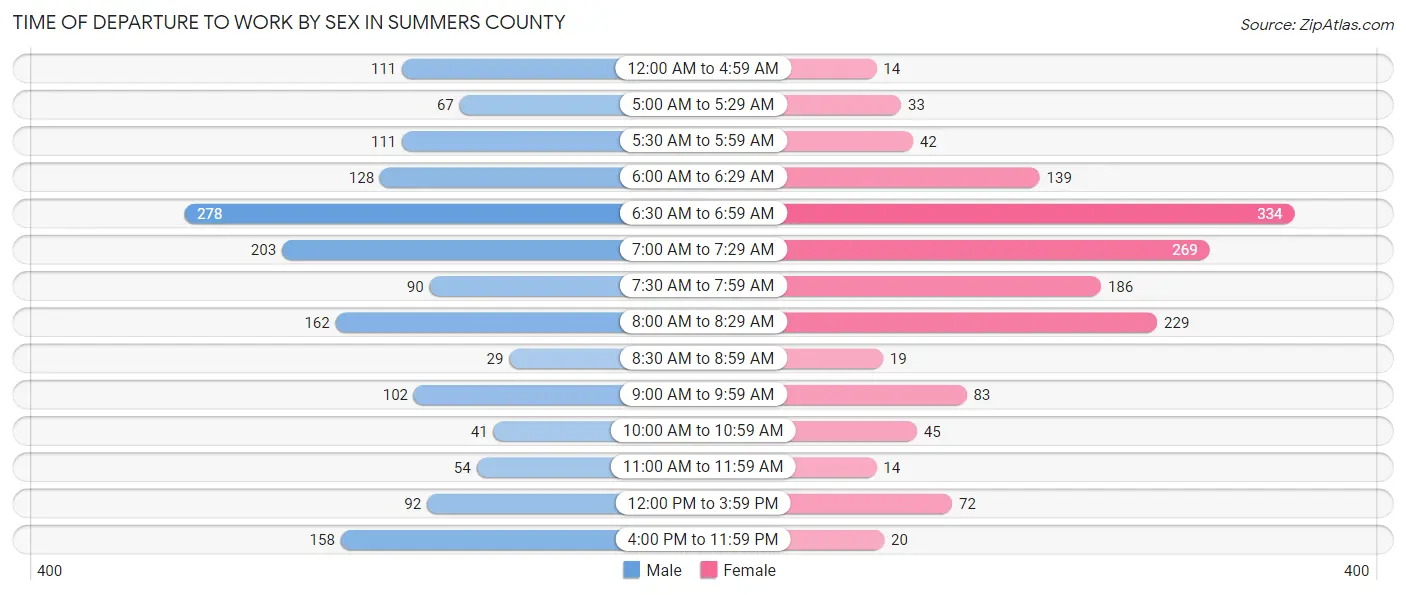
| Time of Departure | Male | Female |
| 12:00 AM to 4:59 AM | 111 (6.8%) | 14 (0.9%) |
| 5:00 AM to 5:29 AM | 67 (4.1%) | 33 (2.2%) |
| 5:30 AM to 5:59 AM | 111 (6.8%) | 42 (2.8%) |
| 6:00 AM to 6:29 AM | 128 (7.9%) | 139 (9.3%) |
| 6:30 AM to 6:59 AM | 278 (17.1%) | 334 (22.3%) |
| 7:00 AM to 7:29 AM | 203 (12.5%) | 269 (17.9%) |
| 7:30 AM to 7:59 AM | 90 (5.5%) | 186 (12.4%) |
| 8:00 AM to 8:29 AM | 162 (10.0%) | 229 (15.3%) |
| 8:30 AM to 8:59 AM | 29 (1.8%) | 19 (1.3%) |
| 9:00 AM to 9:59 AM | 102 (6.3%) | 83 (5.5%) |
| 10:00 AM to 10:59 AM | 41 (2.5%) | 45 (3.0%) |
| 11:00 AM to 11:59 AM | 54 (3.3%) | 14 (0.9%) |
| 12:00 PM to 3:59 PM | 92 (5.7%) | 72 (4.8%) |
| 4:00 PM to 11:59 PM | 158 (9.7%) | 20 (1.3%) |
| Total | 1,626 (100.0%) | 1,499 (100.0%) |
Housing Occupancy in Summers County
Occupancy by Ownership in Summers County
Of the total 4,890 dwellings in Summers County, owner-occupied units account for 3,858 (78.9%), while renter-occupied units make up 1,032 (21.1%).
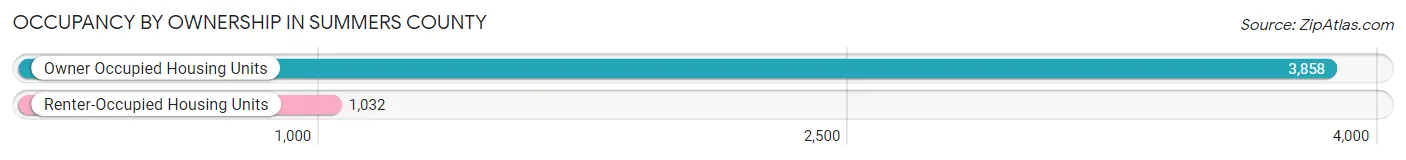
| Occupancy | # Housing Units | % Housing Units |
| Owner Occupied Housing Units | 3,858 | 78.9% |
| Renter-Occupied Housing Units | 1,032 | 21.1% |
| Total Occupied Housing Units | 4,890 | 100.0% |
Occupancy by Household Size in Summers County

| Household Size | # Housing Units | % Housing Units |
| 1-Person Household | 1,844 | 37.7% |
| 2-Person Household | 1,699 | 34.7% |
| 3-Person Household | 636 | 13.0% |
| 4+ Person Household | 711 | 14.5% |
| Total Housing Units | 4,890 | 100.0% |
Occupancy by Ownership by Household Size in Summers County

| Household Size | Owner-occupied | Renter-occupied |
| 1-Person Household | 1,451 (78.7%) | 393 (21.3%) |
| 2-Person Household | 1,342 (79.0%) | 357 (21.0%) |
| 3-Person Household | 505 (79.4%) | 131 (20.6%) |
| 4+ Person Household | 560 (78.8%) | 151 (21.2%) |
| Total Housing Units | 3,858 (78.9%) | 1,032 (21.1%) |
Occupancy by Educational Attainment in Summers County

| Household Size | Owner-occupied | Renter-occupied |
| Less than High School | 437 (60.1%) | 290 (39.9%) |
| High School Diploma | 1,588 (78.6%) | 433 (21.4%) |
| College/Associate Degree | 1,040 (89.4%) | 123 (10.6%) |
| Bachelor's Degree or higher | 793 (81.0%) | 186 (19.0%) |
Occupancy by Age of Householder in Summers County
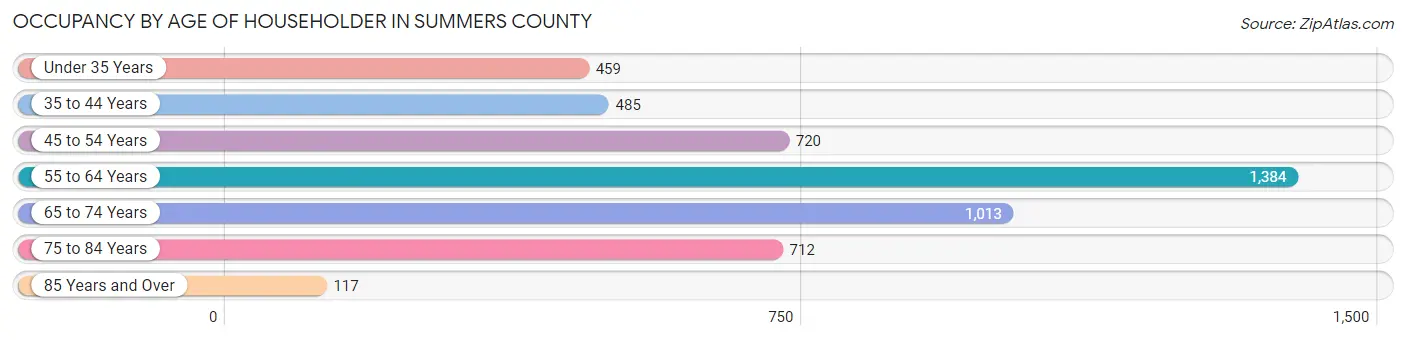
| Age Bracket | # Households | % Households |
| Under 35 Years | 459 | 9.4% |
| 35 to 44 Years | 485 | 9.9% |
| 45 to 54 Years | 720 | 14.7% |
| 55 to 64 Years | 1,384 | 28.3% |
| 65 to 74 Years | 1,013 | 20.7% |
| 75 to 84 Years | 712 | 14.6% |
| 85 Years and Over | 117 | 2.4% |
| Total | 4,890 | 100.0% |
Housing Finances in Summers County
Median Income by Occupancy in Summers County

| Occupancy Type | # Households | Median Income |
| Owner-Occupied | 3,858 (78.9%) | $46,144 |
| Renter-Occupied | 1,032 (21.1%) | $24,236 |
| Average | 4,890 (100.0%) | $42,991 |
Occupancy by Householder Income Bracket in Summers County

| Income Bracket | Owner-occupied | Renter-occupied |
| Less than $5,000 | 37 (1.0%) | 78 (7.6%) |
| $5,000 to $9,999 | 21 (0.5%) | 33 (3.2%) |
| $10,000 to $14,999 | 235 (6.1%) | 194 (18.8%) |
| $15,000 to $19,999 | 131 (3.4%) | 107 (10.4%) |
| $20,000 to $24,999 | 511 (13.3%) | 115 (11.1%) |
| $25,000 to $34,999 | 418 (10.8%) | 76 (7.4%) |
| $35,000 to $49,999 | 673 (17.4%) | 50 (4.8%) |
| $50,000 to $74,999 | 781 (20.2%) | 108 (10.5%) |
| $75,000 to $99,999 | 454 (11.8%) | 38 (3.7%) |
| $100,000 to $149,999 | 400 (10.4%) | 233 (22.6%) |
| $150,000 or more | 197 (5.1%) | 0 (0.0%) |
| Total | 3,858 (100.0%) | 1,032 (100.0%) |
Monthly Housing Cost Tiers in Summers County
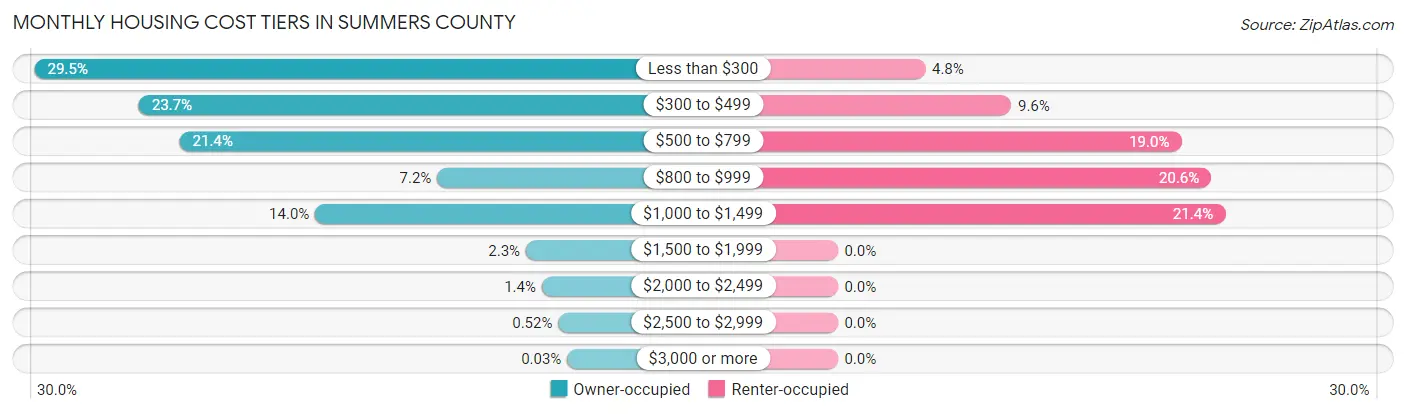
| Monthly Cost | Owner-occupied | Renter-occupied |
| Less than $300 | 1,136 (29.4%) | 50 (4.8%) |
| $300 to $499 | 914 (23.7%) | 99 (9.6%) |
| $500 to $799 | 827 (21.4%) | 196 (19.0%) |
| $800 to $999 | 278 (7.2%) | 213 (20.6%) |
| $1,000 to $1,499 | 538 (14.0%) | 221 (21.4%) |
| $1,500 to $1,999 | 89 (2.3%) | 0 (0.0%) |
| $2,000 to $2,499 | 55 (1.4%) | 0 (0.0%) |
| $2,500 to $2,999 | 20 (0.5%) | 0 (0.0%) |
| $3,000 or more | 1 (0.0%) | 0 (0.0%) |
| Total | 3,858 (100.0%) | 1,032 (100.0%) |
Physical Housing Characteristics in Summers County
Housing Structures in Summers County
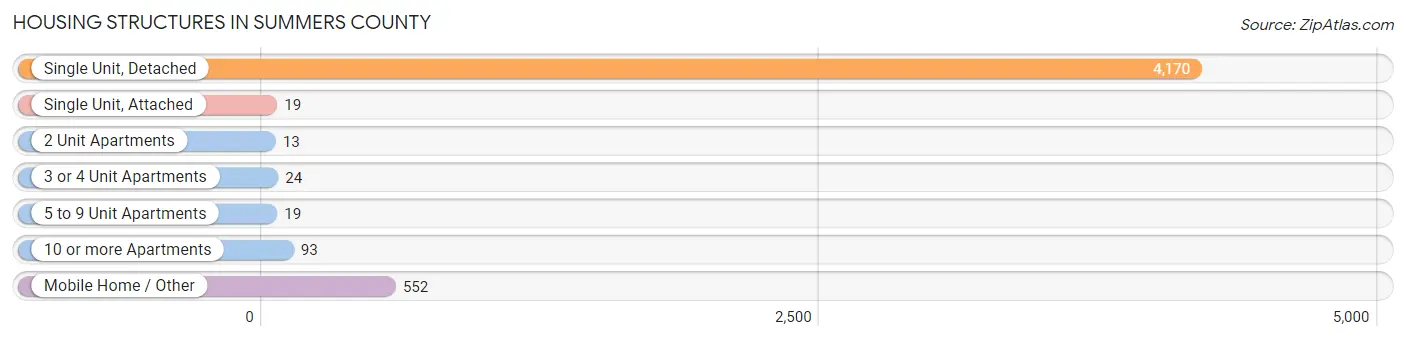
| Structure Type | # Housing Units | % Housing Units |
| Single Unit, Detached | 4,170 | 85.3% |
| Single Unit, Attached | 19 | 0.4% |
| 2 Unit Apartments | 13 | 0.3% |
| 3 or 4 Unit Apartments | 24 | 0.5% |
| 5 to 9 Unit Apartments | 19 | 0.4% |
| 10 or more Apartments | 93 | 1.9% |
| Mobile Home / Other | 552 | 11.3% |
| Total | 4,890 | 100.0% |
Housing Structures by Occupancy in Summers County
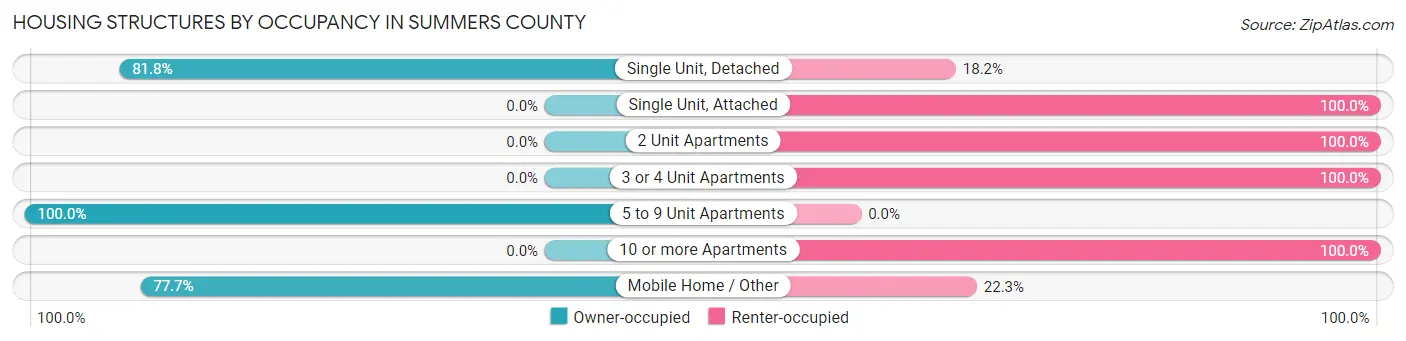
| Structure Type | Owner-occupied | Renter-occupied |
| Single Unit, Detached | 3,410 (81.8%) | 760 (18.2%) |
| Single Unit, Attached | 0 (0.0%) | 19 (100.0%) |
| 2 Unit Apartments | 0 (0.0%) | 13 (100.0%) |
| 3 or 4 Unit Apartments | 0 (0.0%) | 24 (100.0%) |
| 5 to 9 Unit Apartments | 19 (100.0%) | 0 (0.0%) |
| 10 or more Apartments | 0 (0.0%) | 93 (100.0%) |
| Mobile Home / Other | 429 (77.7%) | 123 (22.3%) |
| Total | 3,858 (78.9%) | 1,032 (21.1%) |
Housing Structures by Number of Rooms in Summers County
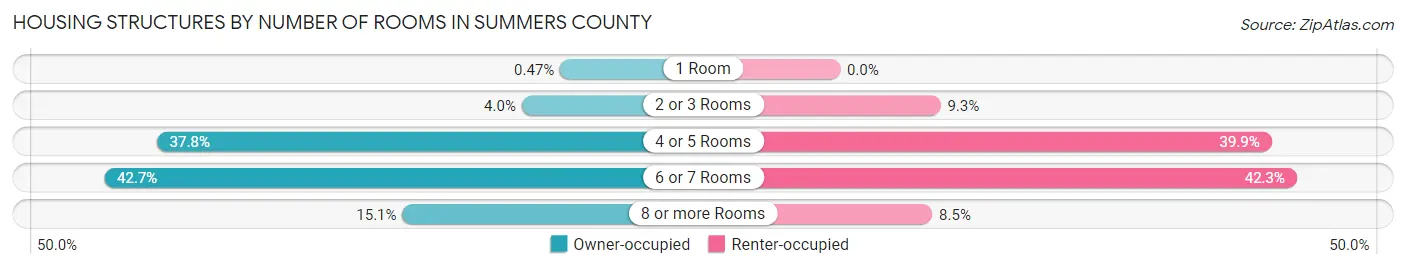
| Number of Rooms | Owner-occupied | Renter-occupied |
| 1 Room | 18 (0.5%) | 0 (0.0%) |
| 2 or 3 Rooms | 155 (4.0%) | 96 (9.3%) |
| 4 or 5 Rooms | 1,458 (37.8%) | 412 (39.9%) |
| 6 or 7 Rooms | 1,646 (42.7%) | 436 (42.2%) |
| 8 or more Rooms | 581 (15.1%) | 88 (8.5%) |
| Total | 3,858 (100.0%) | 1,032 (100.0%) |
Housing Structure by Heating Type in Summers County
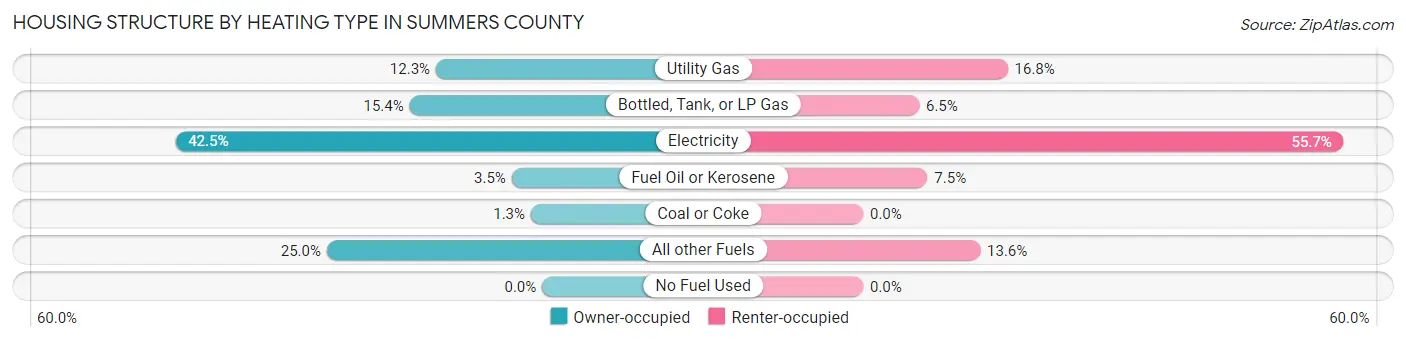
| Heating Type | Owner-occupied | Renter-occupied |
| Utility Gas | 475 (12.3%) | 173 (16.8%) |
| Bottled, Tank, or LP Gas | 593 (15.4%) | 67 (6.5%) |
| Electricity | 1,641 (42.5%) | 575 (55.7%) |
| Fuel Oil or Kerosene | 136 (3.5%) | 77 (7.5%) |
| Coal or Coke | 50 (1.3%) | 0 (0.0%) |
| All other Fuels | 963 (25.0%) | 140 (13.6%) |
| No Fuel Used | 0 (0.0%) | 0 (0.0%) |
| Total | 3,858 (100.0%) | 1,032 (100.0%) |
Household Vehicle Usage in Summers County

| Vehicles per Household | Owner-occupied | Renter-occupied |
| No Vehicle | 220 (5.7%) | 214 (20.7%) |
| 1 Vehicle | 1,263 (32.7%) | 370 (35.8%) |
| 2 Vehicles | 1,621 (42.0%) | 356 (34.5%) |
| 3 or more Vehicles | 754 (19.5%) | 92 (8.9%) |
| Total | 3,858 (100.0%) | 1,032 (100.0%) |
Real Estate & Mortgages in Summers County
Real Estate and Mortgage Overview in Summers County
| Characteristic | Without Mortgage | With Mortgage |
| Housing Units | 2,240 | 1,618 |
| Median Property Value | $123,000 | $124,000 |
| Median Household Income | $36,392 | $125 |
| Monthly Housing Costs | $303 | $1 |
| Real Estate Taxes | $372 | $31 |
Property Value by Mortgage Status in Summers County

| Property Value | Without Mortgage | With Mortgage |
| Less than $50,000 | 466 (20.8%) | 215 (13.3%) |
| $50,000 to $99,999 | 506 (22.6%) | 473 (29.2%) |
| $100,000 to $299,999 | 1,064 (47.5%) | 760 (47.0%) |
| $300,000 to $499,999 | 139 (6.2%) | 133 (8.2%) |
| $500,000 to $749,999 | 65 (2.9%) | 17 (1.1%) |
| $750,000 to $999,999 | 0 (0.0%) | 20 (1.2%) |
| $1,000,000 or more | 0 (0.0%) | 0 (0.0%) |
| Total | 2,240 (100.0%) | 1,618 (100.0%) |
Household Income by Mortgage Status in Summers County
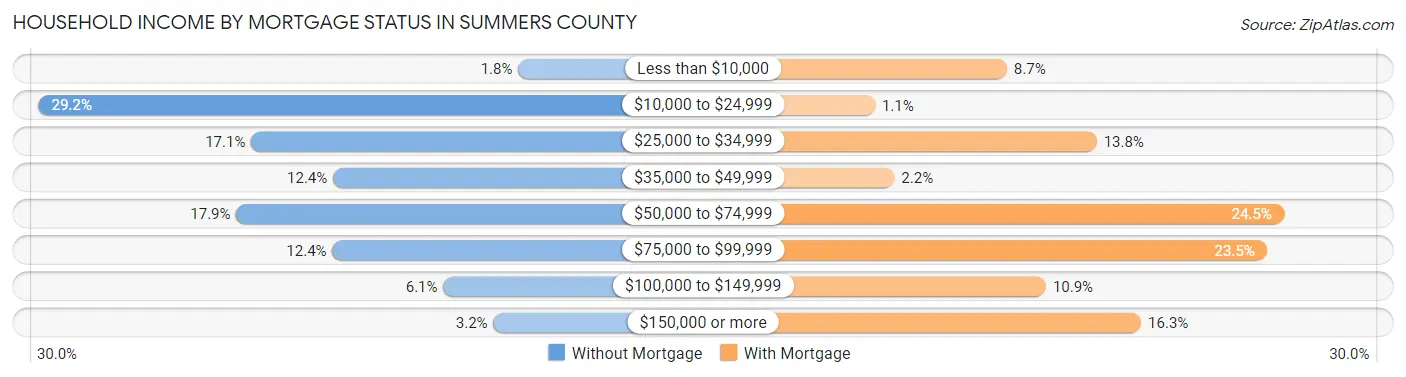
| Household Income | Without Mortgage | With Mortgage |
| Less than $10,000 | 40 (1.8%) | 140 (8.6%) |
| $10,000 to $24,999 | 654 (29.2%) | 18 (1.1%) |
| $25,000 to $34,999 | 382 (17.1%) | 223 (13.8%) |
| $35,000 to $49,999 | 277 (12.4%) | 36 (2.2%) |
| $50,000 to $74,999 | 401 (17.9%) | 396 (24.5%) |
| $75,000 to $99,999 | 278 (12.4%) | 380 (23.5%) |
| $100,000 to $149,999 | 136 (6.1%) | 176 (10.9%) |
| $150,000 or more | 72 (3.2%) | 264 (16.3%) |
| Total | 2,240 (100.0%) | 1,618 (100.0%) |
Property Value to Household Income Ratio in Summers County
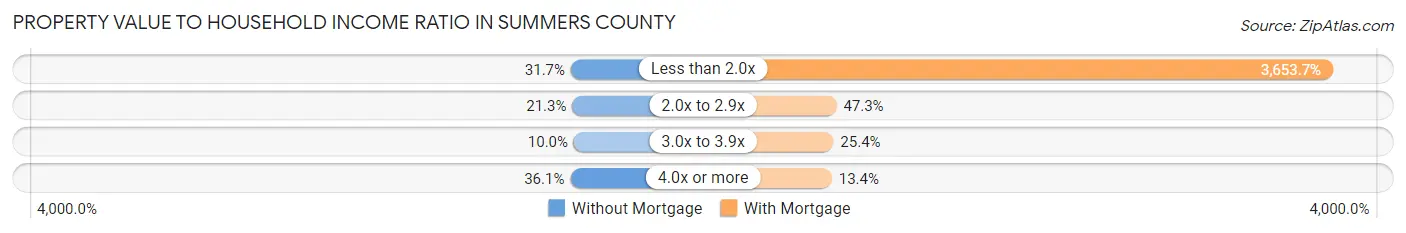
| Value-to-Income Ratio | Without Mortgage | With Mortgage |
| Less than 2.0x | 711 (31.7%) | 59,116 (3,653.6%) |
| 2.0x to 2.9x | 476 (21.2%) | 766 (47.3%) |
| 3.0x to 3.9x | 225 (10.0%) | 411 (25.4%) |
| 4.0x or more | 809 (36.1%) | 217 (13.4%) |
| Total | 2,240 (100.0%) | 1,618 (100.0%) |
Real Estate Taxes by Mortgage Status in Summers County

| Property Taxes | Without Mortgage | With Mortgage |
| Less than $800 | 1,657 (74.0%) | 0 (0.0%) |
| $800 to $1,499 | 360 (16.1%) | 1,257 (77.7%) |
| $800 to $1,499 | 90 (4.0%) | 290 (17.9%) |
| Total | 2,240 (100.0%) | 1,618 (100.0%) |
Health & Disability in Summers County
Health Insurance Coverage by Age in Summers County
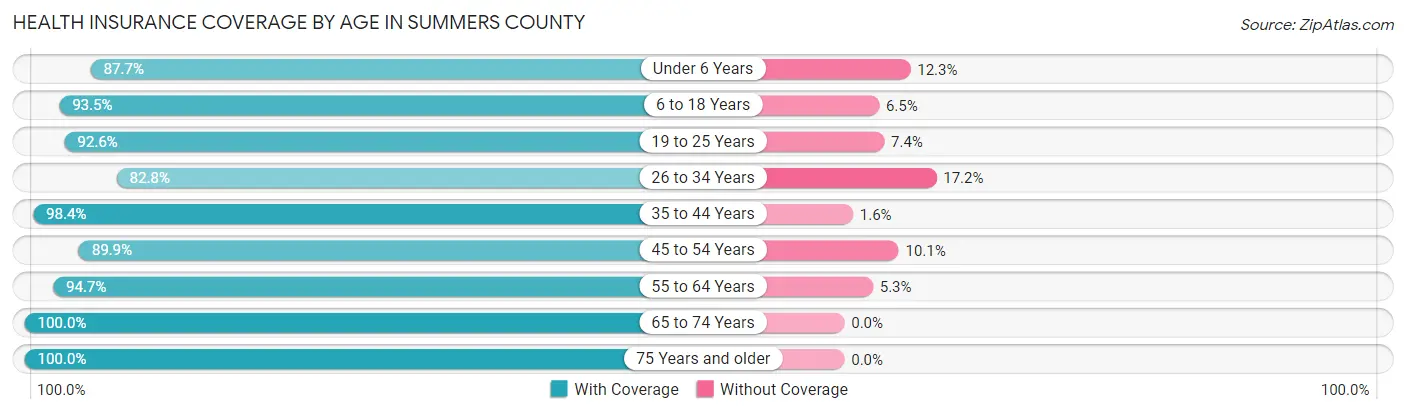
| Age Bracket | With Coverage | Without Coverage |
| Under 6 Years | 485 (87.7%) | 68 (12.3%) |
| 6 to 18 Years | 1,433 (93.5%) | 99 (6.5%) |
| 19 to 25 Years | 498 (92.6%) | 40 (7.4%) |
| 26 to 34 Years | 782 (82.8%) | 162 (17.2%) |
| 35 to 44 Years | 1,229 (98.4%) | 20 (1.6%) |
| 45 to 54 Years | 1,234 (89.9%) | 139 (10.1%) |
| 55 to 64 Years | 1,818 (94.7%) | 102 (5.3%) |
| 65 to 74 Years | 1,816 (100.0%) | 0 (0.0%) |
| 75 Years and older | 1,188 (100.0%) | 0 (0.0%) |
| Total | 10,483 (94.3%) | 630 (5.7%) |
Health Insurance Coverage by Citizenship Status in Summers County
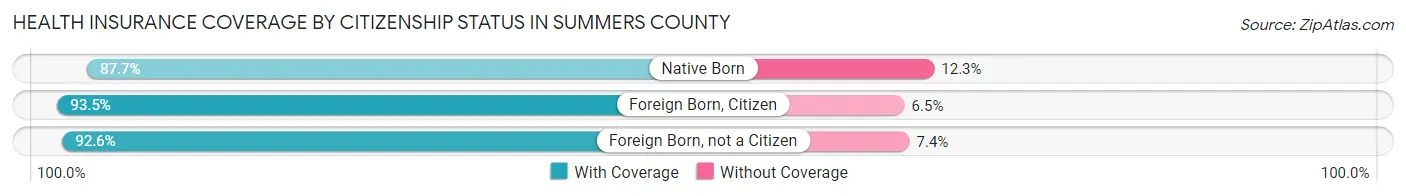
| Citizenship Status | With Coverage | Without Coverage |
| Native Born | 485 (87.7%) | 68 (12.3%) |
| Foreign Born, Citizen | 1,433 (93.5%) | 99 (6.5%) |
| Foreign Born, not a Citizen | 498 (92.6%) | 40 (7.4%) |
Health Insurance Coverage by Household Income in Summers County
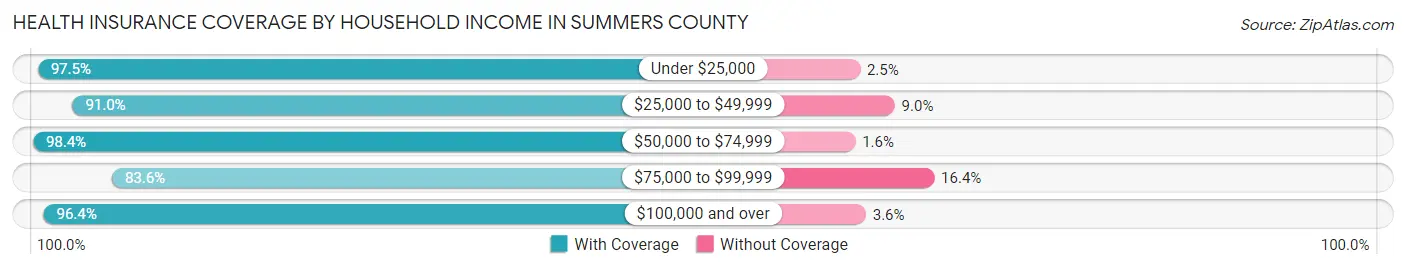
| Household Income | With Coverage | Without Coverage |
| Under $25,000 | 2,338 (97.5%) | 59 (2.5%) |
| $25,000 to $49,999 | 2,223 (91.0%) | 219 (9.0%) |
| $50,000 to $74,999 | 2,198 (98.4%) | 35 (1.6%) |
| $75,000 to $99,999 | 1,124 (83.6%) | 220 (16.4%) |
| $100,000 and over | 2,572 (96.4%) | 95 (3.6%) |
Public vs Private Health Insurance Coverage by Age in Summers County
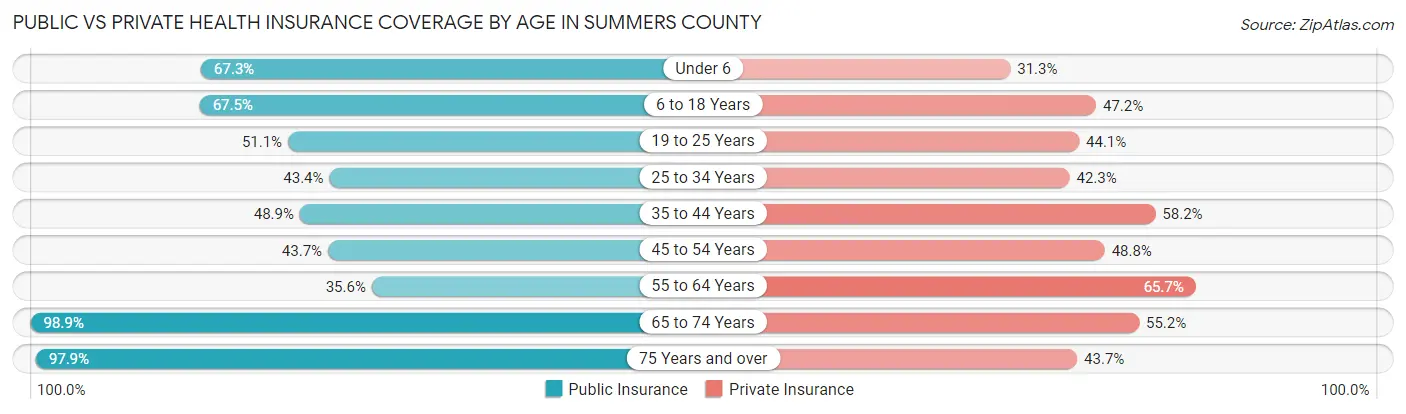
| Age Bracket | Public Insurance | Private Insurance |
| Under 6 | 372 (67.3%) | 173 (31.3%) |
| 6 to 18 Years | 1,034 (67.5%) | 723 (47.2%) |
| 19 to 25 Years | 275 (51.1%) | 237 (44.1%) |
| 25 to 34 Years | 410 (43.4%) | 399 (42.3%) |
| 35 to 44 Years | 611 (48.9%) | 727 (58.2%) |
| 45 to 54 Years | 600 (43.7%) | 670 (48.8%) |
| 55 to 64 Years | 683 (35.6%) | 1,261 (65.7%) |
| 65 to 74 Years | 1,796 (98.9%) | 1,002 (55.2%) |
| 75 Years and over | 1,163 (97.9%) | 519 (43.7%) |
| Total | 6,944 (62.5%) | 5,711 (51.4%) |
Disability Status by Sex by Age in Summers County
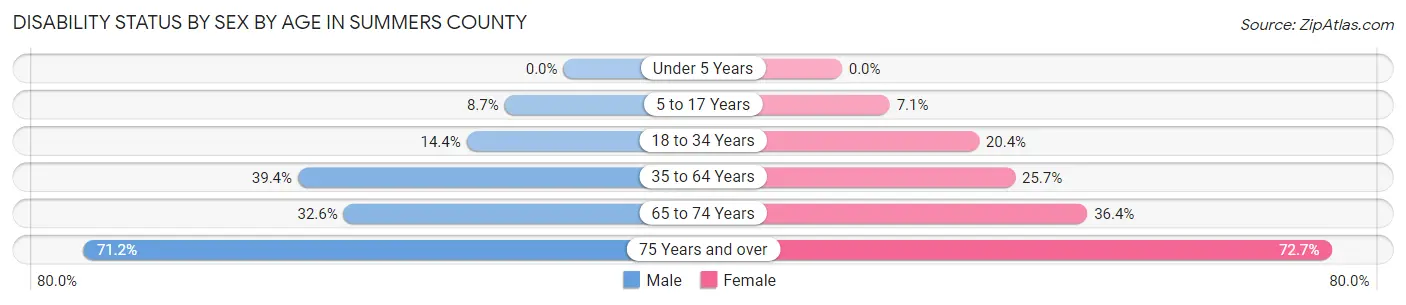
| Age Bracket | Male | Female |
| Under 5 Years | 0 (0.0%) | 0 (0.0%) |
| 5 to 17 Years | 61 (8.7%) | 53 (7.1%) |
| 18 to 34 Years | 118 (14.4%) | 172 (20.4%) |
| 35 to 64 Years | 920 (39.4%) | 568 (25.7%) |
| 65 to 74 Years | 299 (32.6%) | 328 (36.4%) |
| 75 Years and over | 356 (71.2%) | 500 (72.7%) |
Disability Class by Sex by Age in Summers County
Disability Class: Hearing Difficulty
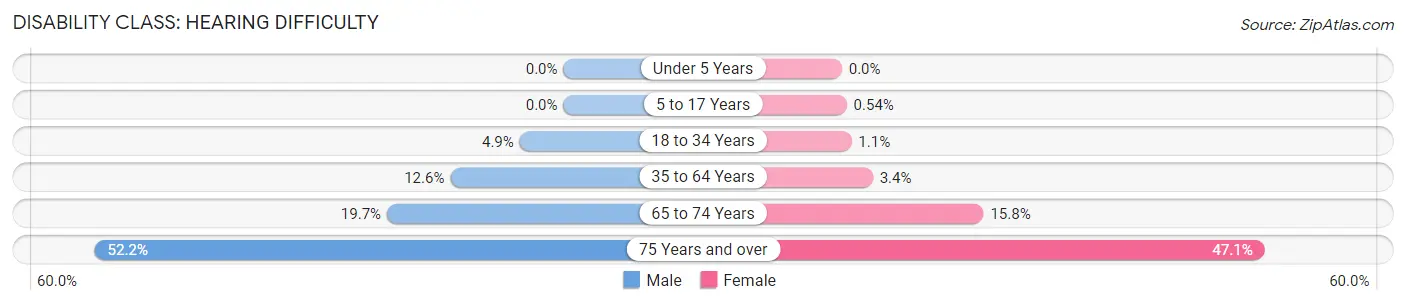
| Age Bracket | Male | Female |
| Under 5 Years | 0 (0.0%) | 0 (0.0%) |
| 5 to 17 Years | 0 (0.0%) | 4 (0.5%) |
| 18 to 34 Years | 40 (4.9%) | 9 (1.1%) |
| 35 to 64 Years | 294 (12.6%) | 76 (3.4%) |
| 65 to 74 Years | 180 (19.7%) | 142 (15.8%) |
| 75 Years and over | 261 (52.2%) | 324 (47.1%) |
Disability Class: Vision Difficulty
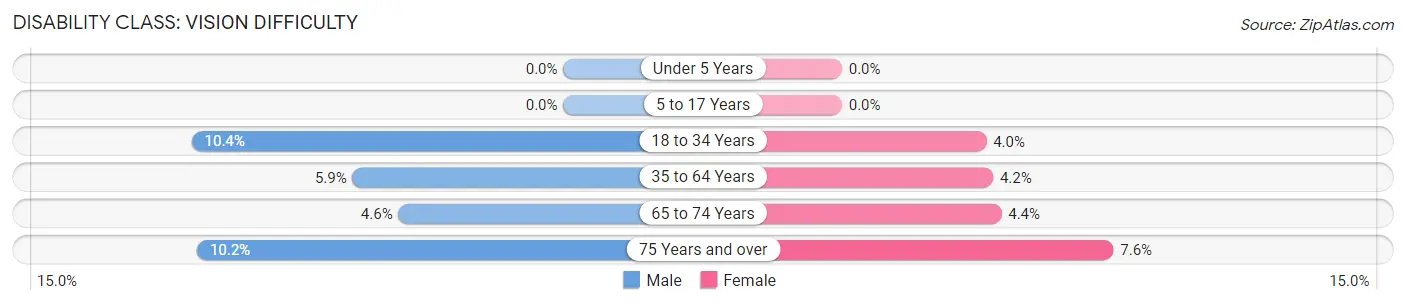
| Age Bracket | Male | Female |
| Under 5 Years | 0 (0.0%) | 0 (0.0%) |
| 5 to 17 Years | 0 (0.0%) | 0 (0.0%) |
| 18 to 34 Years | 85 (10.3%) | 34 (4.0%) |
| 35 to 64 Years | 137 (5.9%) | 93 (4.2%) |
| 65 to 74 Years | 42 (4.6%) | 40 (4.4%) |
| 75 Years and over | 51 (10.2%) | 52 (7.6%) |
Disability Class: Cognitive Difficulty

| Age Bracket | Male | Female |
| 5 to 17 Years | 61 (8.7%) | 34 (4.6%) |
| 18 to 34 Years | 69 (8.4%) | 87 (10.3%) |
| 35 to 64 Years | 348 (14.9%) | 288 (13.0%) |
| 65 to 74 Years | 64 (7.0%) | 153 (17.0%) |
| 75 Years and over | 130 (26.0%) | 49 (7.1%) |
Disability Class: Ambulatory Difficulty
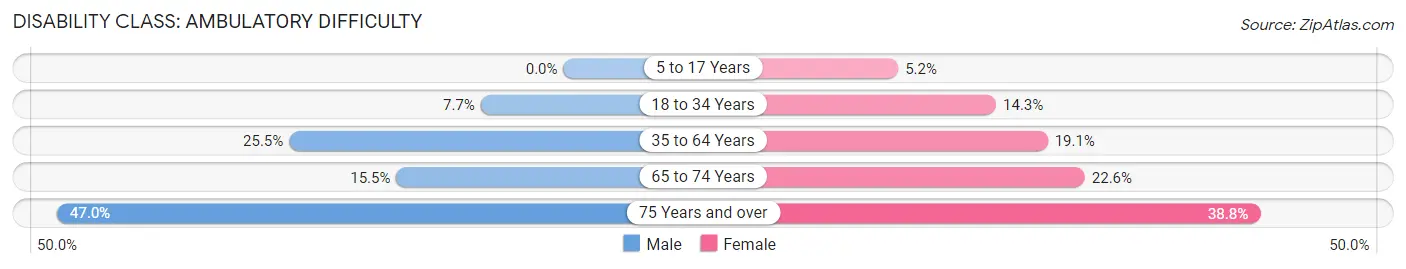
| Age Bracket | Male | Female |
| 5 to 17 Years | 0 (0.0%) | 39 (5.2%) |
| 18 to 34 Years | 63 (7.7%) | 121 (14.3%) |
| 35 to 64 Years | 594 (25.5%) | 422 (19.1%) |
| 65 to 74 Years | 142 (15.5%) | 203 (22.6%) |
| 75 Years and over | 235 (47.0%) | 267 (38.8%) |
Disability Class: Self-Care Difficulty
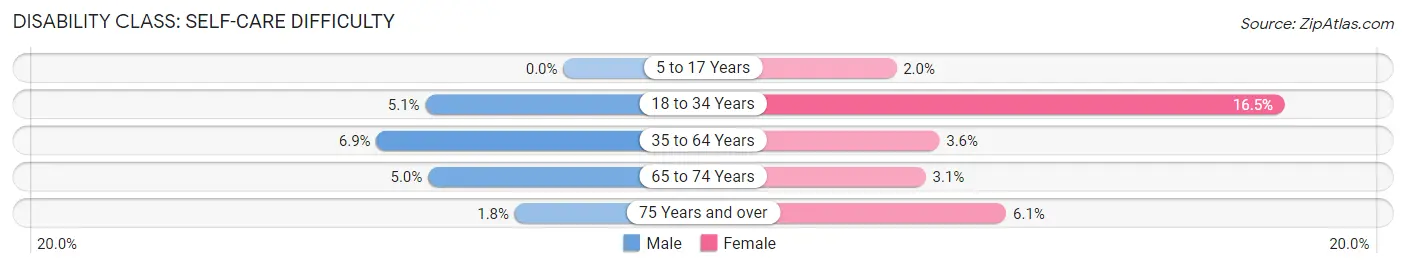
| Age Bracket | Male | Female |
| 5 to 17 Years | 0 (0.0%) | 15 (2.0%) |
| 18 to 34 Years | 42 (5.1%) | 139 (16.5%) |
| 35 to 64 Years | 162 (6.9%) | 80 (3.6%) |
| 65 to 74 Years | 46 (5.0%) | 28 (3.1%) |
| 75 Years and over | 9 (1.8%) | 42 (6.1%) |
Technology Access in Summers County
Computing Device Access in Summers County
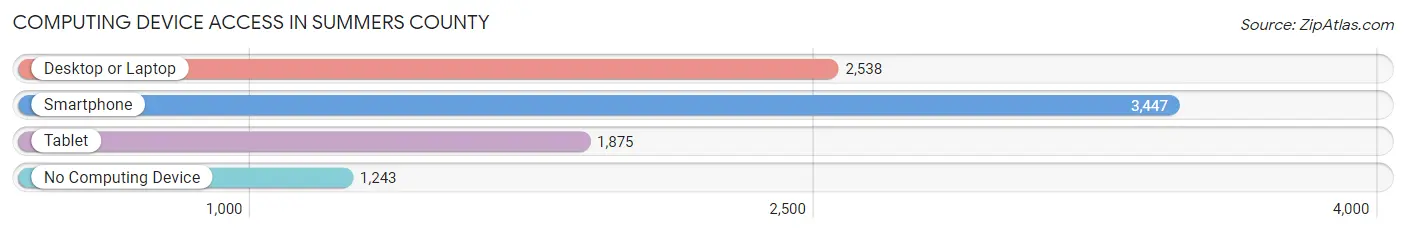
| Device Type | # Households | % Households |
| Desktop or Laptop | 2,538 | 51.9% |
| Smartphone | 3,447 | 70.5% |
| Tablet | 1,875 | 38.3% |
| No Computing Device | 1,243 | 25.4% |
| Total | 4,890 | 100.0% |
Internet Access in Summers County
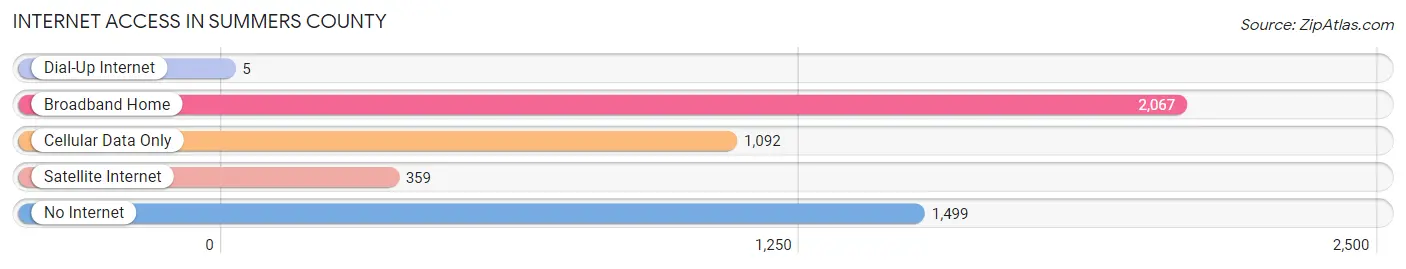
| Internet Type | # Households | % Households |
| Dial-Up Internet | 5 | 0.1% |
| Broadband Home | 2,067 | 42.3% |
| Cellular Data Only | 1,092 | 22.3% |
| Satellite Internet | 359 | 7.3% |
| No Internet | 1,499 | 30.6% |
| Total | 4,890 | 100.0% |
Summers County Summary
Summers County is located in the southeastern part of West Virginia, and is bordered by Mercer, Monroe, Greenbrier, and Fayette counties. The county seat is Hinton, and the county was named for George W. Summers, a prominent politician in the state. As of the 2010 census, the population of Summers County was 13,417.
Geography
Summers County is located in the Appalachian Mountains, and is part of the New River Gorge National River. The county is mostly mountainous, with the highest point being at the summit of Bald Knob, at an elevation of 3,812 feet. The county is drained by the New River, which flows through the county from north to south. The county is also home to several state parks, including Bluestone State Park, Pipestem Resort State Park, and Bluestone Wildlife Management Area.
Economy
The economy of Summers County is largely based on agriculture and tourism. The county is home to several farms, which produce a variety of crops, including corn, soybeans, hay, and tobacco. The county is also home to several tourist attractions, including the Bluestone Dam, the Bluestone National Scenic River, and the New River Gorge National River.
Demographics
As of the 2010 census, the population of Summers County was 13,417. The racial makeup of the county was 95.3% White, 2.3% African American, 0.3% Native American, 0.2% Asian, 0.1% Pacific Islander, 0.4% from other races, and 1.4% from two or more races. Hispanic or Latino of any race were 1.2% of the population.
The median income for a household in the county was $30,945, and the median income for a family was $37,917. The per capita income for the county was $17,845. About 16.2% of families and 20.2% of the population were below the poverty line, including 28.2% of those under age 18 and 13.2% of those age 65 or over.
Education
Summers County is served by the Summers County School District, which operates four elementary schools, one middle school, and one high school. The county is also home to several private schools, including the Summers County Christian Academy and the Summers County Academy of Arts and Sciences.
Conclusion
Summers County is a rural county located in the Appalachian Mountains of West Virginia. The county is home to several farms, tourist attractions, and state parks, and is largely supported by agriculture and tourism. The population of the county is mostly white, with a small percentage of African Americans, Native Americans, and other races. The county is served by the Summers County School District, as well as several private schools.
Common Questions
What is the Total Population of Summers County?
Total Population of Summers County is 11,985.
What is the Total Male Population of Summers County?
Total Male Population of Summers County is 5,650.
What is the Total Female Population of Summers County?
Total Female Population of Summers County is 6,335.
What is the Ratio of Males per 100 Females in Summers County?
There are 89.19 Males per 100 Females in Summers County.
What is the Ratio of Females per 100 Males in Summers County?
There are 112.12 Females per 100 Males in Summers County.
What is the Median Population Age in Summers County?
Median Population Age in Summers County is 49.9 Years.
What is the Average Family Size in Summers County
Average Family Size in Summers County is 3.0 People.
What is the Average Household Size in Summers County
Average Household Size in Summers County is 2.3 People.
What is Per Capita Income in Summers County?
Per Capita income in Summers County is $24,507.
What is the Median Family Income in Summers County?
Median Family Income in Summers County is $61,955.
What is the Median Household income in Summers County?
Median Household Income in Summers County is $42,991.
What is Income or Wage Gap in Summers County?
Income or Wage Gap in Summers County is 25.2%.
Women in Summers County earn 74.8 cents for every dollar earned by a man.
What is Family Income Deficit in Summers County?
Family Income Deficit in Summers County is $10,286.
Families that are below poverty line in Summers County earn $10,286 less on average than the poverty threshold level.
What is Inequality or Gini Index in Summers County?
Inequality or Gini Index in Summers County is 0.42.
How Large is the Labor Force in Summers County?
There are 3,838 People in the Labor Forcein in Summers County.
What is the Percentage of People in the Labor Force in Summers County?
37.3% of People are in the Labor Force in Summers County.
What is the Unemployment Rate in Summers County?
Unemployment Rate in Summers County is 7.6%.