Ritchie County, WV
Ritchie County Map

Ritchie County Overview
8,507
TOTAL POPULATION
4,288
MALE POPULATION
4,219
FEMALE POPULATION
101.64
MALES / 100 FEMALES
98.39
FEMALES / 100 MALES
46.6
MEDIAN AGE
3.0
AVG FAMILY SIZE
2.6
AVG HOUSEHOLD SIZE
$27,997
PER CAPITA INCOME
$59,295
AVG FAMILY INCOME
$48,973
AVG HOUSEHOLD INCOME
33.3%
WAGE / INCOME GAP [ % ]
66.7¢/ $1
WAGE / INCOME GAP [ $ ]
0.48
INEQUALITY / GINI INDEX
2,992
LABOR FORCE [ PEOPLE ]
42.7%
PERCENT IN LABOR FORCE
3.6%
UNEMPLOYMENT RATE
Race in Ritchie County
The most populous races in Ritchie County are White / Caucasian (8,252 | 97.0%), Two or more Races (166 | 1.9%), and Asian (56 | 0.7%).

| Race | # Population | % Population |
| Asian | 56 | 0.7% |
| Black / African American | 32 | 0.4% |
| Hawaiian / Pacific | 0 | 0.0% |
| Hispanic or Latino | 26 | 0.3% |
| Native / Alaskan | 0 | 0.0% |
| White / Caucasian | 8,252 | 97.0% |
| Two or more Races | 166 | 1.9% |
| Some other Race | 1 | 0.0% |
| Total | 8,507 | 100.0% |
Ancestry in Ritchie County
The most populous ancestries reported in Ritchie County are German (1,177 | 13.8%), American (1,085 | 12.8%), Irish (960 | 11.3%), English (810 | 9.5%), and French (166 | 1.9%), together accounting for 49.3% of all Ritchie County residents.

| Ancestry | # Population | % Population |
| Albanian | 11 | 0.1% |
| American | 1,085 | 12.8% |
| Belgian | 3 | 0.0% |
| Blackfeet | 10 | 0.1% |
| British | 38 | 0.4% |
| Canadian | 6 | 0.1% |
| Dutch | 124 | 1.5% |
| English | 810 | 9.5% |
| European | 28 | 0.3% |
| French | 166 | 1.9% |
| French Canadian | 2 | 0.0% |
| German | 1,177 | 13.8% |
| Greek | 2 | 0.0% |
| Hungarian | 7 | 0.1% |
| Indian (Asian) | 50 | 0.6% |
| Iranian | 8 | 0.1% |
| Irish | 960 | 11.3% |
| Italian | 50 | 0.6% |
| Mexican | 9 | 0.1% |
| Native Hawaiian | 11 | 0.1% |
| Norwegian | 16 | 0.2% |
| Polish | 74 | 0.9% |
| Puerto Rican | 17 | 0.2% |
| Scotch-Irish | 114 | 1.3% |
| Scottish | 78 | 0.9% |
| Swedish | 24 | 0.3% |
| Swiss | 14 | 0.2% |
| Thai | 20 | 0.2% |
| Welsh | 49 | 0.6% |
| Yugoslavian | 11 | 0.1% | View All 30 Rows |
Immigrants in Ritchie County
The most numerous immigrant groups reported in Ritchie County came from Asia (65 | 0.8%), China (50 | 0.6%), Eastern Asia (50 | 0.6%), Europe (20 | 0.2%), and South Central Asia (15 | 0.2%), together accounting for 2.4% of all Ritchie County residents.

| Immigration Origin | # Population | % Population |
| Asia | 65 | 0.8% |
| Canada | 6 | 0.1% |
| China | 50 | 0.6% |
| Eastern Asia | 50 | 0.6% |
| Eastern Europe | 11 | 0.1% |
| Europe | 20 | 0.2% |
| India | 7 | 0.1% |
| Iran | 8 | 0.1% |
| Northern Europe | 9 | 0.1% |
| South Central Asia | 15 | 0.2% | View All 10 Rows |
Sex and Age in Ritchie County
Sex and Age in Ritchie County
The most populous age groups in Ritchie County are 60 to 64 Years (432 | 10.1%) for men and 60 to 64 Years (327 | 7.7%) for women.

| Age Bracket | Male | Female |
| Under 5 Years | 197 (4.6%) | 203 (4.8%) |
| 5 to 9 Years | 98 (2.3%) | 246 (5.8%) |
| 10 to 14 Years | 404 (9.4%) | 253 (6.0%) |
| 15 to 19 Years | 255 (5.9%) | 242 (5.7%) |
| 20 to 24 Years | 197 (4.6%) | 178 (4.2%) |
| 25 to 29 Years | 243 (5.7%) | 208 (4.9%) |
| 30 to 34 Years | 203 (4.7%) | 191 (4.5%) |
| 35 to 39 Years | 288 (6.7%) | 250 (5.9%) |
| 40 to 44 Years | 181 (4.2%) | 218 (5.2%) |
| 45 to 49 Years | 258 (6.0%) | 275 (6.5%) |
| 50 to 54 Years | 309 (7.2%) | 298 (7.1%) |
| 55 to 59 Years | 303 (7.1%) | 320 (7.6%) |
| 60 to 64 Years | 432 (10.1%) | 327 (7.7%) |
| 65 to 69 Years | 300 (7.0%) | 284 (6.7%) |
| 70 to 74 Years | 286 (6.7%) | 312 (7.4%) |
| 75 to 79 Years | 168 (3.9%) | 160 (3.8%) |
| 80 to 84 Years | 103 (2.4%) | 128 (3.0%) |
| 85 Years and over | 63 (1.5%) | 126 (3.0%) |
| Total | 4,288 (100.0%) | 4,219 (100.0%) |
Families and Households in Ritchie County
Median Family Size in Ritchie County
The median family size in Ritchie County is 3.01 persons per family, with single female/mother families (284 | 12.3%) accounting for the largest median family size of 3.47 persons per family. On the other hand, married-couple families (1,914 | 82.7%) represent the smallest median family size with 2.93 persons per family.

| Family Type | # Families | Family Size |
| Married-Couple | 1,914 (82.7%) | 2.93 |
| Single Male/Father | 117 (5.1%) | 3.07 |
| Single Female/Mother | 284 (12.3%) | 3.47 |
| Total Families | 2,315 (100.0%) | 3.01 |
Median Household Size in Ritchie County
The median household size in Ritchie County is 2.60 persons per household, with single female/mother households (284 | 8.7%) accounting for the largest median household size of 4.01 persons per household. non-family households (942 | 28.9%) represent the smallest median household size with 1.21 persons per household.

| Household Type | # Households | Household Size |
| Married-Couple | 1,914 (58.8%) | 3.03 |
| Single Male/Father | 117 (3.6%) | 3.31 |
| Single Female/Mother | 284 (8.7%) | 4.01 |
| Non-family | 942 (28.9%) | 1.21 |
| Total Households | 3,257 (100.0%) | 2.60 |
Household Size by Marriage Status in Ritchie County
Out of a total of 3,257 households in Ritchie County, 2,315 (71.1%) are family households, while 942 (28.9%) are nonfamily households. The most numerous type of family households are 2-person households, comprising 1,158, and the most common type of nonfamily households are 1-person households, comprising 804.

| Household Size | Family Households | Nonfamily Households |
| 1-Person Households | - | 804 (24.7%) |
| 2-Person Households | 1,158 (35.5%) | 122 (3.7%) |
| 3-Person Households | 568 (17.4%) | 14 (0.4%) |
| 4-Person Households | 407 (12.5%) | 0 (0.0%) |
| 5-Person Households | 166 (5.1%) | 0 (0.0%) |
| 6-Person Households | 4 (0.1%) | 2 (0.1%) |
| 7+ Person Households | 12 (0.4%) | 0 (0.0%) |
| Total | 2,315 (71.1%) | 942 (28.9%) |
Female Fertility in Ritchie County
Fertility by Age in Ritchie County
Average fertility rate in Ritchie County is 42.0 births per 1,000 women. Women in the age bracket of 20 to 34 years have the highest fertility rate with 101.0 births per 1,000 women. Women in the age bracket of 20 to 34 years acount for 87.9% of all women with births.

| Age Bracket | Women with Births | Births / 1,000 Women |
| 15 to 19 years | 0 (0.0%) | 0.0 |
| 20 to 34 years | 58 (87.9%) | 101.0 |
| 35 to 50 years | 8 (12.1%) | 10.0 |
| Total | 66 (100.0%) | 42.0 |
Fertility by Age by Marriage Status in Ritchie County
71.2% of women with births (66) in Ritchie County are married. The highest percentage of unmarried women with births falls into 20 to 34 years age bracket with 32.8% of them unmarried at the time of birth, while the lowest percentage of unmarried women with births belong to 35 to 50 years age bracket with 0.0% of them unmarried.

| Age Bracket | Married | Unmarried |
| 15 to 19 years | 0 (0.0%) | 0 (0.0%) |
| 20 to 34 years | 39 (67.2%) | 19 (32.8%) |
| 35 to 50 years | 8 (100.0%) | 0 (0.0%) |
| Total | 47 (71.2%) | 19 (28.8%) |
Fertility by Education in Ritchie County

| Educational Attainment | Women with Births | Births / 1,000 Women |
| Less than High School | 1 (1.5%) | 3.0 |
| High School Diploma | 5 (7.6%) | 12.0 |
| College or Associate's Degree | 50 (75.8%) | 88.0 |
| Bachelor's Degree | 10 (15.1%) | 53.0 |
| Graduate Degree | 0 (0.0%) | 0.0 |
| Total | 66 (100.0%) | 42.0 |
Fertility by Education by Marriage Status in Ritchie County
28.8% of women with births in Ritchie County are unmarried. Women with the educational attainment of high school diploma are most likely to be married with 100.0% of them married at childbirth, while women with the educational attainment of less than high school are least likely to be married with 100.0% of them unmarried at childbirth.

| Educational Attainment | Married | Unmarried |
| Less than High School | 0 (0.0%) | 1 (100.0%) |
| High School Diploma | 5 (100.0%) | 0 (0.0%) |
| College or Associate's Degree | 32 (64.0%) | 18 (36.0%) |
| Bachelor's Degree | 10 (100.0%) | 0 (0.0%) |
| Graduate Degree | 0 (0.0%) | 0 (0.0%) |
| Total | 47 (71.2%) | 19 (28.8%) |
Income in Ritchie County
Income Overview in Ritchie County
Per Capita Income in Ritchie County is $27,997, while median incomes of families and households are $59,295 and $48,973 respectively.
| Characteristic | Number | Measure |
| Per Capita Income | 8,507 | $27,997 |
| Median Family Income | 2,315 | $59,295 |
| Mean Family Income | 2,315 | $80,010 |
| Median Household Income | 3,257 | $48,973 |
| Mean Household Income | 3,257 | $69,916 |
| Income Deficit | 2,315 | $0 |
| Wage / Income Gap (%) | 8,507 | 33.31% |
| Wage / Income Gap ($) | 8,507 | 66.69¢ per $1 |
| Gini / Inequality Index | 8,507 | 0.48 |
Earnings by Sex in Ritchie County
Average Earnings in Ritchie County are $32,350, $37,794 for men and $25,206 for women, a difference of 33.3%.

| Sex | Number | Average Earnings |
| Male | 1,766 (54.9%) | $37,794 |
| Female | 1,448 (45.1%) | $25,206 |
| Total | 3,214 (100.0%) | $32,350 |
Earnings by Sex by Income Bracket in Ritchie County
The most common earnings brackets in Ritchie County are $75,000 to $99,999 for men (254 | 14.4%) and $25,000 to $29,999 for women (144 | 9.9%).

| Income | Male | Female |
| $2,499 or less | 59 (3.3%) | 97 (6.7%) |
| $2,500 to $4,999 | 36 (2.0%) | 60 (4.1%) |
| $5,000 to $7,499 | 79 (4.5%) | 122 (8.4%) |
| $7,500 to $9,999 | 28 (1.6%) | 25 (1.7%) |
| $10,000 to $12,499 | 57 (3.2%) | 47 (3.3%) |
| $12,500 to $14,999 | 51 (2.9%) | 134 (9.2%) |
| $15,000 to $17,499 | 52 (2.9%) | 33 (2.3%) |
| $17,500 to $19,999 | 27 (1.5%) | 79 (5.5%) |
| $20,000 to $22,499 | 74 (4.2%) | 41 (2.8%) |
| $22,500 to $24,999 | 90 (5.1%) | 78 (5.4%) |
| $25,000 to $29,999 | 147 (8.3%) | 144 (9.9%) |
| $30,000 to $34,999 | 141 (8.0%) | 58 (4.0%) |
| $35,000 to $39,999 | 57 (3.2%) | 50 (3.5%) |
| $40,000 to $44,999 | 54 (3.1%) | 92 (6.4%) |
| $45,000 to $49,999 | 62 (3.5%) | 121 (8.4%) |
| $50,000 to $54,999 | 85 (4.8%) | 112 (7.7%) |
| $55,000 to $64,999 | 149 (8.4%) | 26 (1.8%) |
| $65,000 to $74,999 | 90 (5.1%) | 38 (2.6%) |
| $75,000 to $99,999 | 254 (14.4%) | 20 (1.4%) |
| $100,000+ | 174 (9.9%) | 71 (4.9%) |
| Total | 1,766 (100.0%) | 1,448 (100.0%) |
Earnings by Sex by Educational Attainment in Ritchie County
Average earnings in Ritchie County are $45,703 for men and $26,583 for women, a difference of 41.8%. Men with an educational attainment of college or associate's degree enjoy the highest average annual earnings of $68,295, while those with less than high school education earn the least with $23,208. Women with an educational attainment of bachelor's degree earn the most with the average annual earnings of $46,739, while those with less than high school education have the smallest earnings of $18,588.

| Educational Attainment | Male Income | Female Income |
| Less than High School | $23,208 | $18,588 |
| High School Diploma | $44,815 | $25,346 |
| College or Associate's Degree | $68,295 | $29,342 |
| Bachelor's Degree | $55,000 | $46,739 |
| Graduate Degree | - | - |
| Total | $45,703 | $26,583 |
Family Income in Ritchie County
Family Income Brackets in Ritchie County
According to the Ritchie County family income data, there are 433 families falling into the $50,000 to $74,999 income range, which is the most common income bracket and makes up 18.7% of all families. Conversely, the less than $10,000 income bracket is the least frequent group with only 79 families (3.4%) belonging to this category.

| Income Bracket | # Families | % Families |
| Less than $10,000 | 79 | 3.4% |
| $10,000 to $14,999 | 218 | 9.4% |
| $15,000 to $24,999 | 141 | 6.1% |
| $25,000 to $34,999 | 153 | 6.6% |
| $35,000 to $49,999 | 419 | 18.1% |
| $50,000 to $74,999 | 433 | 18.7% |
| $75,000 to $99,999 | 357 | 15.4% |
| $100,000 to $149,999 | 238 | 10.3% |
| $150,000 to $199,999 | 169 | 7.3% |
| $200,000+ | 109 | 4.7% |
Family Income by Famaliy Size in Ritchie County
3-person families (480 | 20.7%) account for the highest median family income in Ritchie County with $85,000 per family, while 3-person families (480 | 20.7%) have the highest median income of $28,333 per family member.

| Income Bracket | # Families | Median Income |
| 2-Person Families | 1,300 (56.2%) | $53,534 |
| 3-Person Families | 480 (20.7%) | $85,000 |
| 4-Person Families | 444 (19.2%) | $49,155 |
| 5-Person Families | 75 (3.2%) | $0 |
| 6-Person Families | 8 (0.4%) | $0 |
| 7+ Person Families | 8 (0.4%) | $0 |
| Total | 2,315 (100.0%) | $59,295 |
Family Income by Number of Earners in Ritchie County
The median family income in Ritchie County is $59,295, with families comprising 3+ earners (128) having the highest median family income of $138,500, while families with no earners (686) have the lowest median family income of $34,310, accounting for 5.5% and 29.6% of families, respectively.

| Number of Earners | # Families | Median Income |
| No Earners | 686 (29.6%) | $34,310 |
| 1 Earner | 828 (35.8%) | $60,139 |
| 2 Earners | 673 (29.1%) | $85,469 |
| 3+ Earners | 128 (5.5%) | $138,500 |
| Total | 2,315 (100.0%) | $59,295 |
Household Income in Ritchie County
Household Income Brackets in Ritchie County
With 629 households falling in the category, the $50,000 to $74,999 income range is the most frequent in Ritchie County, accounting for 19.3% of all households. In contrast, only 114 households (3.5%) fall into the $200,000+ income bracket, making it the least populous group.

| Income Bracket | # Households | % Households |
| Less than $10,000 | 173 | 5.3% |
| $10,000 to $14,999 | 313 | 9.6% |
| $15,000 to $24,999 | 270 | 8.3% |
| $25,000 to $34,999 | 319 | 9.8% |
| $35,000 to $49,999 | 593 | 18.2% |
| $50,000 to $74,999 | 629 | 19.3% |
| $75,000 to $99,999 | 404 | 12.4% |
| $100,000 to $149,999 | 251 | 7.7% |
| $150,000 to $199,999 | 189 | 5.8% |
| $200,000+ | 114 | 3.5% |
Household Income by Householder Age in Ritchie County
The median household income in Ritchie County is $48,973, with the highest median household income of $59,295 found in the 45 to 64 years age bracket for the primary householder. A total of 1,288 households (39.6%) fall into this category. Meanwhile, the 15 to 24 years age bracket for the primary householder has the lowest median household income of $20,750, with 39 households (1.2%) in this group.

| Income Bracket | # Households | Median Income |
| 15 to 24 Years | 39 (1.2%) | $20,750 |
| 25 to 44 Years | 796 (24.4%) | $48,882 |
| 45 to 64 Years | 1,288 (39.6%) | $59,295 |
| 65+ Years | 1,134 (34.8%) | $42,656 |
| Total | 3,257 (100.0%) | $48,973 |
Poverty in Ritchie County
Income Below Poverty by Sex and Age in Ritchie County
With 20.0% poverty level for males and 20.6% for females among the residents of Ritchie County, 12 to 14 year old males and 16 and 17 year old females are the most vulnerable to poverty, with 90 males (47.9%) and 47 females (39.2%) in their respective age groups living below the poverty level.

| Age Bracket | Male | Female |
| Under 5 Years | 32 (23.7%) | 48 (26.1%) |
| 5 Years | 0 (0.0%) | 27 (36.5%) |
| 6 to 11 Years | 128 (45.1%) | 85 (36.6%) |
| 12 to 14 Years | 90 (47.9%) | 10 (7.1%) |
| 15 Years | 3 (4.6%) | 12 (36.4%) |
| 16 and 17 Years | 25 (23.4%) | 47 (39.2%) |
| 18 to 24 Years | 59 (21.1%) | 39 (14.6%) |
| 25 to 34 Years | 111 (24.9%) | 79 (19.8%) |
| 35 to 44 Years | 45 (9.6%) | 118 (25.2%) |
| 45 to 54 Years | 34 (6.0%) | 34 (5.9%) |
| 55 to 64 Years | 250 (34.3%) | 164 (25.4%) |
| 65 to 74 Years | 43 (7.3%) | 115 (19.6%) |
| 75 Years and over | 19 (5.7%) | 69 (17.8%) |
| Total | 839 (20.0%) | 847 (20.6%) |
Income Above Poverty by Sex and Age in Ritchie County
According to the poverty statistics in Ritchie County, males aged 15 years and females aged 45 to 54 years are the age groups that are most secure financially, with 95.4% of males and 94.1% of females in these age groups living above the poverty line.

| Age Bracket | Male | Female |
| Under 5 Years | 103 (76.3%) | 136 (73.9%) |
| 5 Years | 0 (0.0%) | 47 (63.5%) |
| 6 to 11 Years | 156 (54.9%) | 147 (63.4%) |
| 12 to 14 Years | 98 (52.1%) | 131 (92.9%) |
| 15 Years | 62 (95.4%) | 21 (63.6%) |
| 16 and 17 Years | 82 (76.6%) | 73 (60.8%) |
| 18 to 24 Years | 221 (78.9%) | 228 (85.4%) |
| 25 to 34 Years | 335 (75.1%) | 320 (80.2%) |
| 35 to 44 Years | 424 (90.4%) | 350 (74.8%) |
| 45 to 54 Years | 533 (94.0%) | 539 (94.1%) |
| 55 to 64 Years | 480 (65.7%) | 483 (74.7%) |
| 65 to 74 Years | 543 (92.7%) | 471 (80.4%) |
| 75 Years and over | 312 (94.3%) | 318 (82.2%) |
| Total | 3,349 (80.0%) | 3,264 (79.4%) |
Income Below Poverty Among Married-Couple Families in Ritchie County
The poverty statistics for married-couple families in Ritchie County show that 12.2% or 234 of the total 1,914 families live below the poverty line. Families with 3 or 4 children have the highest poverty rate of 51.4%, comprising of 37 families. On the other hand, families with 5 or more children have the lowest poverty rate of 0.0%, which includes 0 families.

| Children | Above Poverty | Below Poverty |
| No Children | 1,182 (89.4%) | 140 (10.6%) |
| 1 or 2 Children | 455 (88.9%) | 57 (11.1%) |
| 3 or 4 Children | 35 (48.6%) | 37 (51.4%) |
| 5 or more Children | 8 (100.0%) | 0 (0.0%) |
| Total | 1,680 (87.8%) | 234 (12.2%) |
Income Below Poverty Among Single-Parent Households in Ritchie County
According to the poverty data in Ritchie County, 7.7% or 9 single-father households and 41.2% or 117 single-mother households are living below the poverty line. Among single-father households, those with no children have the highest poverty rate, with 7 households (10.0%) experiencing poverty. Likewise, among single-mother households, those with 3 or 4 children have the highest poverty rate, with 17 households (100.0%) falling below the poverty line.

| Children | Single Father | Single Mother |
| No Children | 7 (10.0%) | 9 (8.7%) |
| 1 or 2 Children | 2 (4.3%) | 91 (55.5%) |
| 3 or 4 Children | 0 (0.0%) | 17 (100.0%) |
| 5 or more Children | 0 (0.0%) | 0 (0.0%) |
| Total | 9 (7.7%) | 117 (41.2%) |
Income Below Poverty Among Married-Couple vs Single-Parent Households in Ritchie County
The poverty data for Ritchie County shows that 234 of the married-couple family households (12.2%) and 126 of the single-parent households (31.4%) are living below the poverty level. Within the married-couple family households, those with 3 or 4 children have the highest poverty rate, with 37 households (51.4%) falling below the poverty line. Among the single-parent households, those with 3 or 4 children have the highest poverty rate, with 17 household (100.0%) living below poverty.

| Children | Married-Couple Families | Single-Parent Households |
| No Children | 140 (10.6%) | 16 (9.2%) |
| 1 or 2 Children | 57 (11.1%) | 93 (44.1%) |
| 3 or 4 Children | 37 (51.4%) | 17 (100.0%) |
| 5 or more Children | 0 (0.0%) | 0 (0.0%) |
| Total | 234 (12.2%) | 126 (31.4%) |
Employment Characteristics in Ritchie County
Employment by Class of Employer in Ritchie County
Among the 2,859 employed individuals in Ritchie County, private company employees (1,659 | 58.0%), state government employees (428 | 15.0%), and self-employed (not incorporated) (226 | 7.9%) make up the most common classes of employment.

| Employer Class | # Employees | % Employees |
| Private Company Employees | 1,659 | 58.0% |
| Self-Employed (Incorporated) | 58 | 2.0% |
| Self-Employed (Not Incorporated) | 226 | 7.9% |
| Not-for-profit Organizations | 81 | 2.8% |
| Local Government Employees | 204 | 7.1% |
| State Government Employees | 428 | 15.0% |
| Federal Government Employees | 203 | 7.1% |
| Unpaid Family Workers | 0 | 0.0% |
| Total | 2,859 | 100.0% |
Employment Status by Age in Ritchie County
According to the labor force statistics for Ritchie County, out of the total population over 16 years of age (7,008), 42.7% or 2,992 individuals are in the labor force, with 3.6% or 108 of them unemployed. The age group with the highest labor force participation rate is 25 to 29 years, with 75.8% or 342 individuals in the labor force. Within the labor force, the 45 to 54 years age range has the highest percentage of unemployed individuals, with 8.0% or 56 of them being unemployed.

| Age Bracket | In Labor Force | Unemployed |
| 16 to 19 Years | 92 (23.1%) | 3 (3.3%) |
| 20 to 24 Years | 212 (56.5%) | 5 (2.4%) |
| 25 to 29 Years | 342 (75.8%) | 0 (0.0%) |
| 30 to 34 Years | 215 (54.6%) | 0 (0.0%) |
| 35 to 44 Years | 636 (67.9%) | 11 (1.7%) |
| 45 to 54 Years | 699 (61.3%) | 56 (8.0%) |
| 55 to 59 Years | 352 (56.5%) | 9 (2.6%) |
| 60 to 64 Years | 224 (29.5%) | 11 (4.9%) |
| 65 to 74 Years | 162 (13.7%) | 12 (7.4%) |
| 75 Years and over | 59 (7.9%) | 0 (0.0%) |
| Total | 2,992 (42.7%) | 108 (3.6%) |
Employment Status by Educational Attainment in Ritchie County
According to labor force statistics for Ritchie County, 57.3% of individuals (2,466) out of the total population between 25 and 64 years of age (4,304) are in the labor force, with 3.5% or 86 of them being unemployed. The group with the highest labor force participation rate are those with the educational attainment of college / associate degree, with 69.5% or 691 individuals in the labor force. Within the labor force, individuals with high school diploma education have the highest percentage of unemployment, with 5.2% or 61 of them being unemployed.

| Educational Attainment | In Labor Force | Unemployed |
| Less than High School | 260 (35.7%) | 31 (4.2%) |
| High School Diploma | 1,178 (57.5%) | 107 (5.2%) |
| College / Associate Degree | 691 (69.5%) | 22 (2.2%) |
| Bachelor's Degree or higher | 339 (63.6%) | 0 (0.0%) |
| Total | 2,466 (57.3%) | 151 (3.5%) |
Employment Occupations by Sex in Ritchie County
Management, Business, Science and Arts Occupations
The most common Management, Business, Science and Arts occupations in Ritchie County are Community & Social Service (206 | 7.1%), Management (188 | 6.5%), Education Instruction & Library (124 | 4.3%), Business & Financial (123 | 4.3%), and Health Diagnosing & Treating (96 | 3.3%).

Management, Business, Science and Arts Occupations by Sex
Within the Management, Business, Science and Arts occupations in Ritchie County, the most male-oriented occupations are Architecture & Engineering (100.0%), Life, Physical & Social Science (100.0%), and Arts, Media & Entertainment (68.8%), while the most female-oriented occupations are Legal Services & Support (100.0%), Education Instruction & Library (95.2%), and Health Technologists (90.4%).

| Occupation | Male | Female |
| Management | 97 (51.6%) | 91 (48.4%) |
| Business & Financial | 38 (30.9%) | 85 (69.1%) |
| Computers, Engineering & Science | 24 (53.3%) | 21 (46.7%) |
| Computers & Mathematics | 4 (16.0%) | 21 (84.0%) |
| Architecture & Engineering | 16 (100.0%) | 0 (0.0%) |
| Life, Physical & Social Science | 4 (100.0%) | 0 (0.0%) |
| Community & Social Service | 29 (14.1%) | 177 (85.9%) |
| Education, Arts & Media | 12 (28.6%) | 30 (71.4%) |
| Legal Services & Support | 0 (0.0%) | 24 (100.0%) |
| Education Instruction & Library | 6 (4.8%) | 118 (95.2%) |
| Arts, Media & Entertainment | 11 (68.8%) | 5 (31.2%) |
| Health Diagnosing & Treating | 30 (31.2%) | 66 (68.8%) |
| Health Technologists | 5 (9.6%) | 47 (90.4%) |
| Total (Category) | 218 (33.1%) | 440 (66.9%) |
| Total (Overall) | 1,535 (53.2%) | 1,351 (46.8%) |
Services Occupations
The most common Services occupations in Ritchie County are Cleaning & Maintenance (219 | 7.6%), Food Preparation & Serving (114 | 4.0%), Healthcare Support (74 | 2.6%), Security & Protection (51 | 1.8%), and Personal Care & Service (48 | 1.7%).

Services Occupations by Sex
Within the Services occupations in Ritchie County, the most male-oriented occupations are Law Enforcement (100.0%), Security & Protection (62.7%), and Cleaning & Maintenance (54.3%), while the most female-oriented occupations are Personal Care & Service (100.0%), Healthcare Support (91.9%), and Food Preparation & Serving (77.2%).

| Occupation | Male | Female |
| Healthcare Support | 6 (8.1%) | 68 (91.9%) |
| Security & Protection | 32 (62.7%) | 19 (37.2%) |
| Firefighting & Prevention | 20 (51.3%) | 19 (48.7%) |
| Law Enforcement | 12 (100.0%) | 0 (0.0%) |
| Food Preparation & Serving | 26 (22.8%) | 88 (77.2%) |
| Cleaning & Maintenance | 119 (54.3%) | 100 (45.7%) |
| Personal Care & Service | 0 (0.0%) | 48 (100.0%) |
| Total (Category) | 183 (36.2%) | 323 (63.8%) |
| Total (Overall) | 1,535 (53.2%) | 1,351 (46.8%) |
Sales and Office Occupations
The most common Sales and Office occupations in Ritchie County are Sales & Related (330 | 11.4%), and Office & Administration (262 | 9.1%).

Sales and Office Occupations by Sex

| Occupation | Male | Female |
| Sales & Related | 101 (30.6%) | 229 (69.4%) |
| Office & Administration | 33 (12.6%) | 229 (87.4%) |
| Total (Category) | 134 (22.6%) | 458 (77.4%) |
| Total (Overall) | 1,535 (53.2%) | 1,351 (46.8%) |
Natural Resources, Construction and Maintenance Occupations
The most common Natural Resources, Construction and Maintenance occupations in Ritchie County are Construction & Extraction (334 | 11.6%), Installation, Maintenance & Repair (86 | 3.0%), and Farming, Fishing & Forestry (26 | 0.9%).

Natural Resources, Construction and Maintenance Occupations by Sex

| Occupation | Male | Female |
| Farming, Fishing & Forestry | 0 (0.0%) | 26 (100.0%) |
| Construction & Extraction | 332 (99.4%) | 2 (0.6%) |
| Installation, Maintenance & Repair | 86 (100.0%) | 0 (0.0%) |
| Total (Category) | 418 (93.7%) | 28 (6.3%) |
| Total (Overall) | 1,535 (53.2%) | 1,351 (46.8%) |
Production, Transportation and Moving Occupations
The most common Production, Transportation and Moving occupations in Ritchie County are Production (417 | 14.4%), Transportation (158 | 5.5%), and Material Moving (109 | 3.8%).

Production, Transportation and Moving Occupations by Sex

| Occupation | Male | Female |
| Production | 326 (78.2%) | 91 (21.8%) |
| Transportation | 151 (95.6%) | 7 (4.4%) |
| Material Moving | 105 (96.3%) | 4 (3.7%) |
| Total (Category) | 582 (85.1%) | 102 (14.9%) |
| Total (Overall) | 1,535 (53.2%) | 1,351 (46.8%) |
Employment Industries by Sex in Ritchie County
Employment Industries in Ritchie County
The major employment industries in Ritchie County include Public Administration (382 | 13.2%), Manufacturing (340 | 11.8%), Retail Trade (338 | 11.7%), Construction (300 | 10.4%), and Mining, Quarrying, & Extraction (228 | 7.9%).

Employment Industries by Sex in Ritchie County
The Ritchie County industries that see more men than women are Utilities (100.0%), Mining, Quarrying, & Extraction (98.7%), and Construction (95.0%), whereas the industries that tend to have a higher number of women are Real Estate, Rental & Leasing (100.0%), Educational Services (86.9%), and Accommodation & Food Services (80.0%).

| Industry | Male | Female |
| Agriculture, Fishing & Hunting | 42 (60.0%) | 28 (40.0%) |
| Mining, Quarrying, & Extraction | 225 (98.7%) | 3 (1.3%) |
| Construction | 285 (95.0%) | 15 (5.0%) |
| Manufacturing | 281 (82.7%) | 59 (17.3%) |
| Wholesale Trade | 59 (52.7%) | 53 (47.3%) |
| Retail Trade | 150 (44.4%) | 188 (55.6%) |
| Transportation & Warehousing | 75 (94.9%) | 4 (5.1%) |
| Utilities | 41 (100.0%) | 0 (0.0%) |
| Information | 14 (48.3%) | 15 (51.7%) |
| Finance & Insurance | 12 (21.4%) | 44 (78.6%) |
| Real Estate, Rental & Leasing | 0 (0.0%) | 17 (100.0%) |
| Professional & Scientific | 15 (31.9%) | 32 (68.1%) |
| Enterprise Management | 0 (0.0%) | 0 (0.0%) |
| Administrative & Support | 42 (48.8%) | 44 (51.2%) |
| Educational Services | 24 (13.1%) | 159 (86.9%) |
| Health Care & Social Assistance | 64 (30.5%) | 146 (69.5%) |
| Arts, Entertainment & Recreation | 60 (35.9%) | 107 (64.1%) |
| Accommodation & Food Services | 19 (20.0%) | 76 (80.0%) |
| Public Administration | 88 (23.0%) | 294 (77.0%) |
| Total | 1,535 (53.2%) | 1,351 (46.8%) |
Education in Ritchie County
School Enrollment in Ritchie County
The most common levels of schooling among the 1,516 students in Ritchie County are middle school (529 | 34.9%), high school (423 | 27.9%), and elementary school (244 | 16.1%).

| School Level | # Students | % Students |
| Nursery / Preschool | 105 | 6.9% |
| Kindergarten | 67 | 4.4% |
| Elementary School | 244 | 16.1% |
| Middle School | 529 | 34.9% |
| High School | 423 | 27.9% |
| College / Undergraduate | 105 | 6.9% |
| Graduate / Professional | 43 | 2.8% |
| Total | 1,516 | 100.0% |
School Enrollment by Age by Funding Source in Ritchie County
Out of a total of 1,516 students who are enrolled in schools in Ritchie County, 265 (17.5%) attend a private institution, while the remaining 1,251 (82.5%) are enrolled in public schools. The age group of 3 to 4 year olds has the highest likelihood of being enrolled in private schools, with 35 (76.1% in the age bracket) enrolled. Conversely, the age group of 25 to 34 year olds has the lowest likelihood of being enrolled in a private school, with 13 (100.0% in the age bracket) attending a public institution.

| Age Bracket | Public School | Private School |
| 3 to 4 Year Olds | 11 (23.9%) | 35 (76.1%) |
| 5 to 9 Year Old | 280 (83.8%) | 54 (16.2%) |
| 10 to 14 Year Olds | 583 (92.7%) | 46 (7.3%) |
| 15 to 17 Year Olds | 277 (85.2%) | 48 (14.8%) |
| 18 to 19 Year Olds | 40 (70.2%) | 17 (29.8%) |
| 20 to 24 Year Olds | 30 (40.0%) | 45 (60.0%) |
| 25 to 34 Year Olds | 13 (100.0%) | 0 (0.0%) |
| 35 Years and over | 16 (43.2%) | 21 (56.8%) |
| Total | 1,251 (82.5%) | 265 (17.5%) |
Educational Attainment by Field of Study in Ritchie County
Education (290 | 36.3%), business (236 | 29.5%), arts & humanities (98 | 12.3%), science & technology (48 | 6.0%), and social sciences (32 | 4.0%) are the most common fields of study among 799 individuals in Ritchie County who have obtained a bachelor's degree or higher.

| Field of Study | # Graduates | % Graduates |
| Computers & Mathematics | 4 | 0.5% |
| Bio, Nature & Agricultural | 7 | 0.9% |
| Physical & Health Sciences | 16 | 2.0% |
| Psychology | 29 | 3.6% |
| Social Sciences | 32 | 4.0% |
| Engineering | 27 | 3.4% |
| Multidisciplinary Studies | 0 | 0.0% |
| Science & Technology | 48 | 6.0% |
| Business | 236 | 29.5% |
| Education | 290 | 36.3% |
| Literature & Languages | 0 | 0.0% |
| Liberal Arts & History | 0 | 0.0% |
| Visual & Performing Arts | 12 | 1.5% |
| Communications | 0 | 0.0% |
| Arts & Humanities | 98 | 12.3% |
| Total | 799 | 100.0% |
Transportation & Commute in Ritchie County
Vehicle Availability by Sex in Ritchie County
The most prevalent vehicle ownership categories in Ritchie County are males with 2 vehicles (628, accounting for 41.6%) and females with 2 vehicles (544, making up 46.5%).

| Vehicles Available | Male | Female |
| No Vehicle | 37 (2.5%) | 40 (3.0%) |
| 1 Vehicle | 302 (20.0%) | 251 (18.6%) |
| 2 Vehicles | 628 (41.6%) | 544 (40.3%) |
| 3 Vehicles | 331 (21.9%) | 322 (23.8%) |
| 4 Vehicles | 141 (9.3%) | 151 (11.2%) |
| 5 or more Vehicles | 70 (4.6%) | 42 (3.1%) |
| Total | 1,509 (100.0%) | 1,350 (100.0%) |
Commute Time in Ritchie County
The most frequently occuring commute durations in Ritchie County are 15 to 19 minutes (419 commuters, 15.8%), 10 to 14 minutes (379 commuters, 14.3%), and 45 to 59 minutes (307 commuters, 11.6%).

| Commute Time | # Commuters | % Commuters |
| Less than 5 Minutes | 92 | 3.5% |
| 5 to 9 Minutes | 192 | 7.3% |
| 10 to 14 Minutes | 379 | 14.3% |
| 15 to 19 Minutes | 419 | 15.8% |
| 20 to 24 Minutes | 252 | 9.5% |
| 25 to 29 Minutes | 154 | 5.8% |
| 30 to 34 Minutes | 270 | 10.2% |
| 35 to 39 Minutes | 94 | 3.5% |
| 40 to 44 Minutes | 128 | 4.8% |
| 45 to 59 Minutes | 307 | 11.6% |
| 60 to 89 Minutes | 305 | 11.5% |
| 90 or more Minutes | 53 | 2.0% |
Commute Time by Sex in Ritchie County
The most common commute times in Ritchie County are 15 to 19 minutes (245 commuters, 17.1%) for males and 10 to 14 minutes (193 commuters, 16.0%) for females.

| Commute Time | Male | Female |
| Less than 5 Minutes | 33 (2.3%) | 59 (4.9%) |
| 5 to 9 Minutes | 80 (5.6%) | 112 (9.3%) |
| 10 to 14 Minutes | 186 (12.9%) | 193 (16.0%) |
| 15 to 19 Minutes | 245 (17.1%) | 174 (14.4%) |
| 20 to 24 Minutes | 137 (9.5%) | 115 (9.5%) |
| 25 to 29 Minutes | 51 (3.5%) | 103 (8.5%) |
| 30 to 34 Minutes | 161 (11.2%) | 109 (9.0%) |
| 35 to 39 Minutes | 38 (2.6%) | 56 (4.6%) |
| 40 to 44 Minutes | 115 (8.0%) | 13 (1.1%) |
| 45 to 59 Minutes | 187 (13.0%) | 120 (9.9%) |
| 60 to 89 Minutes | 153 (10.6%) | 152 (12.6%) |
| 90 or more Minutes | 51 (3.5%) | 2 (0.2%) |
Time of Departure to Work by Sex in Ritchie County
The most frequent times of departure to work in Ritchie County are 6:30 AM to 6:59 AM (349, 24.3%) for males and 7:00 AM to 7:29 AM (191, 15.8%) for females.

| Time of Departure | Male | Female |
| 12:00 AM to 4:59 AM | 189 (13.2%) | 66 (5.5%) |
| 5:00 AM to 5:29 AM | 81 (5.6%) | 66 (5.5%) |
| 5:30 AM to 5:59 AM | 77 (5.4%) | 45 (3.7%) |
| 6:00 AM to 6:29 AM | 239 (16.6%) | 105 (8.7%) |
| 6:30 AM to 6:59 AM | 349 (24.3%) | 169 (14.0%) |
| 7:00 AM to 7:29 AM | 120 (8.4%) | 191 (15.8%) |
| 7:30 AM to 7:59 AM | 100 (7.0%) | 173 (14.3%) |
| 8:00 AM to 8:29 AM | 46 (3.2%) | 142 (11.7%) |
| 8:30 AM to 8:59 AM | 11 (0.8%) | 8 (0.7%) |
| 9:00 AM to 9:59 AM | 47 (3.3%) | 34 (2.8%) |
| 10:00 AM to 10:59 AM | 12 (0.8%) | 89 (7.4%) |
| 11:00 AM to 11:59 AM | 13 (0.9%) | 4 (0.3%) |
| 12:00 PM to 3:59 PM | 56 (3.9%) | 34 (2.8%) |
| 4:00 PM to 11:59 PM | 97 (6.8%) | 82 (6.8%) |
| Total | 1,437 (100.0%) | 1,208 (100.0%) |
Housing Occupancy in Ritchie County
Occupancy by Ownership in Ritchie County
Of the total 3,257 dwellings in Ritchie County, owner-occupied units account for 2,733 (83.9%), while renter-occupied units make up 524 (16.1%).

| Occupancy | # Housing Units | % Housing Units |
| Owner Occupied Housing Units | 2,733 | 83.9% |
| Renter-Occupied Housing Units | 524 | 16.1% |
| Total Occupied Housing Units | 3,257 | 100.0% |
Occupancy by Household Size in Ritchie County

| Household Size | # Housing Units | % Housing Units |
| 1-Person Household | 804 | 24.7% |
| 2-Person Household | 1,280 | 39.3% |
| 3-Person Household | 582 | 17.9% |
| 4+ Person Household | 591 | 18.1% |
| Total Housing Units | 3,257 | 100.0% |
Occupancy by Ownership by Household Size in Ritchie County

| Household Size | Owner-occupied | Renter-occupied |
| 1-Person Household | 611 (76.0%) | 193 (24.0%) |
| 2-Person Household | 1,201 (93.8%) | 79 (6.2%) |
| 3-Person Household | 490 (84.2%) | 92 (15.8%) |
| 4+ Person Household | 431 (72.9%) | 160 (27.1%) |
| Total Housing Units | 2,733 (83.9%) | 524 (16.1%) |
Occupancy by Educational Attainment in Ritchie County

| Household Size | Owner-occupied | Renter-occupied |
| Less than High School | 358 (73.7%) | 128 (26.3%) |
| High School Diploma | 1,388 (86.3%) | 221 (13.7%) |
| College/Associate Degree | 632 (84.0%) | 120 (16.0%) |
| Bachelor's Degree or higher | 355 (86.6%) | 55 (13.4%) |
Occupancy by Age of Householder in Ritchie County

| Age Bracket | # Households | % Households |
| Under 35 Years | 339 | 10.4% |
| 35 to 44 Years | 496 | 15.2% |
| 45 to 54 Years | 524 | 16.1% |
| 55 to 64 Years | 764 | 23.5% |
| 65 to 74 Years | 634 | 19.5% |
| 75 to 84 Years | 393 | 12.1% |
| 85 Years and Over | 107 | 3.3% |
| Total | 3,257 | 100.0% |
Housing Finances in Ritchie County
Median Income by Occupancy in Ritchie County

| Occupancy Type | # Households | Median Income |
| Owner-Occupied | 2,733 (83.9%) | $53,675 |
| Renter-Occupied | 524 (16.1%) | $29,375 |
| Average | 3,257 (100.0%) | $48,973 |
Occupancy by Householder Income Bracket in Ritchie County
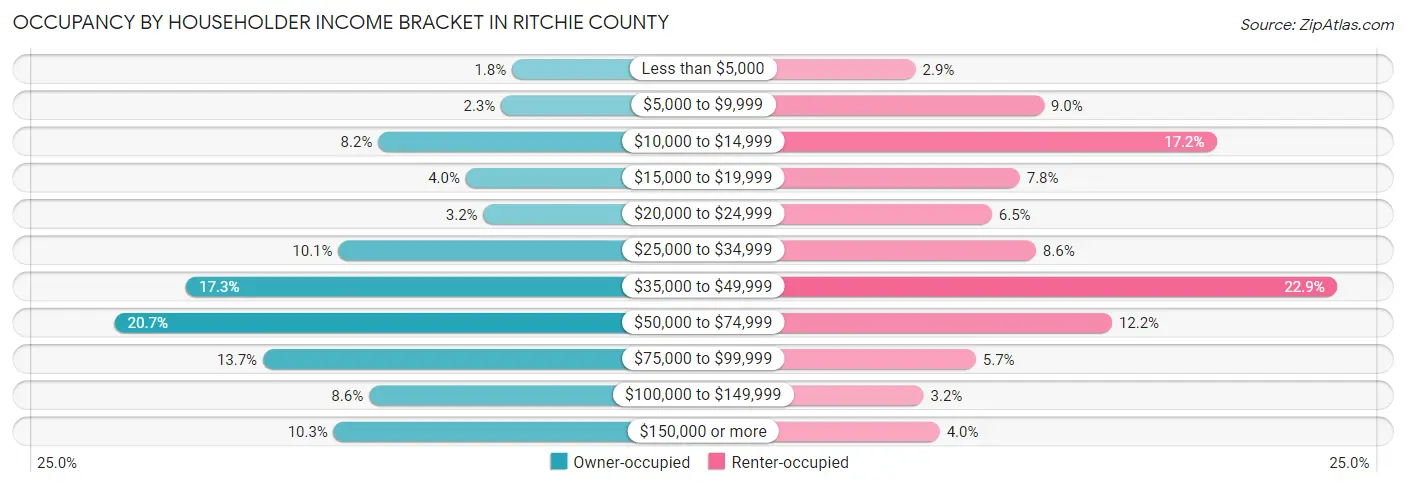
| Income Bracket | Owner-occupied | Renter-occupied |
| Less than $5,000 | 49 (1.8%) | 15 (2.9%) |
| $5,000 to $9,999 | 63 (2.3%) | 47 (9.0%) |
| $10,000 to $14,999 | 223 (8.2%) | 90 (17.2%) |
| $15,000 to $19,999 | 109 (4.0%) | 41 (7.8%) |
| $20,000 to $24,999 | 86 (3.2%) | 34 (6.5%) |
| $25,000 to $34,999 | 275 (10.1%) | 45 (8.6%) |
| $35,000 to $49,999 | 473 (17.3%) | 120 (22.9%) |
| $50,000 to $74,999 | 566 (20.7%) | 64 (12.2%) |
| $75,000 to $99,999 | 373 (13.7%) | 30 (5.7%) |
| $100,000 to $149,999 | 235 (8.6%) | 17 (3.2%) |
| $150,000 or more | 281 (10.3%) | 21 (4.0%) |
| Total | 2,733 (100.0%) | 524 (100.0%) |
Monthly Housing Cost Tiers in Ritchie County

| Monthly Cost | Owner-occupied | Renter-occupied |
| Less than $300 | 1,194 (43.7%) | 38 (7.2%) |
| $300 to $499 | 595 (21.8%) | 86 (16.4%) |
| $500 to $799 | 375 (13.7%) | 141 (26.9%) |
| $800 to $999 | 165 (6.0%) | 66 (12.6%) |
| $1,000 to $1,499 | 180 (6.6%) | 15 (2.9%) |
| $1,500 to $1,999 | 171 (6.3%) | 0 (0.0%) |
| $2,000 to $2,499 | 25 (0.9%) | 0 (0.0%) |
| $2,500 to $2,999 | 11 (0.4%) | 0 (0.0%) |
| $3,000 or more | 17 (0.6%) | 0 (0.0%) |
| Total | 2,733 (100.0%) | 524 (100.0%) |
Physical Housing Characteristics in Ritchie County
Housing Structures in Ritchie County
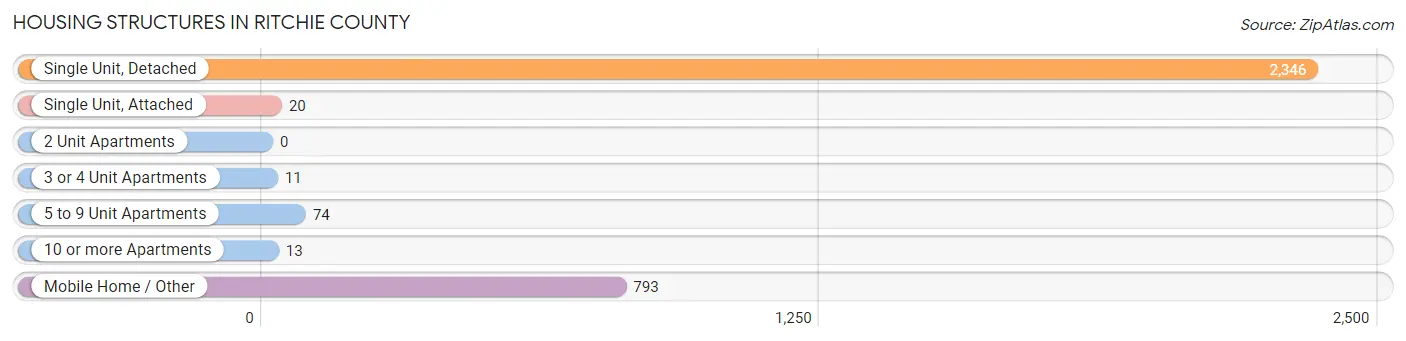
| Structure Type | # Housing Units | % Housing Units |
| Single Unit, Detached | 2,346 | 72.0% |
| Single Unit, Attached | 20 | 0.6% |
| 2 Unit Apartments | 0 | 0.0% |
| 3 or 4 Unit Apartments | 11 | 0.3% |
| 5 to 9 Unit Apartments | 74 | 2.3% |
| 10 or more Apartments | 13 | 0.4% |
| Mobile Home / Other | 793 | 24.3% |
| Total | 3,257 | 100.0% |
Housing Structures by Occupancy in Ritchie County

| Structure Type | Owner-occupied | Renter-occupied |
| Single Unit, Detached | 2,017 (86.0%) | 329 (14.0%) |
| Single Unit, Attached | 6 (30.0%) | 14 (70.0%) |
| 2 Unit Apartments | 0 (0.0%) | 0 (0.0%) |
| 3 or 4 Unit Apartments | 4 (36.4%) | 7 (63.6%) |
| 5 to 9 Unit Apartments | 0 (0.0%) | 74 (100.0%) |
| 10 or more Apartments | 0 (0.0%) | 13 (100.0%) |
| Mobile Home / Other | 706 (89.0%) | 87 (11.0%) |
| Total | 2,733 (83.9%) | 524 (16.1%) |
Housing Structures by Number of Rooms in Ritchie County

| Number of Rooms | Owner-occupied | Renter-occupied |
| 1 Room | 6 (0.2%) | 9 (1.7%) |
| 2 or 3 Rooms | 39 (1.4%) | 56 (10.7%) |
| 4 or 5 Rooms | 973 (35.6%) | 204 (38.9%) |
| 6 or 7 Rooms | 1,021 (37.4%) | 187 (35.7%) |
| 8 or more Rooms | 694 (25.4%) | 68 (13.0%) |
| Total | 2,733 (100.0%) | 524 (100.0%) |
Housing Structure by Heating Type in Ritchie County

| Heating Type | Owner-occupied | Renter-occupied |
| Utility Gas | 2,178 (79.7%) | 392 (74.8%) |
| Bottled, Tank, or LP Gas | 114 (4.2%) | 18 (3.4%) |
| Electricity | 277 (10.1%) | 112 (21.4%) |
| Fuel Oil or Kerosene | 0 (0.0%) | 0 (0.0%) |
| Coal or Coke | 0 (0.0%) | 0 (0.0%) |
| All other Fuels | 146 (5.3%) | 2 (0.4%) |
| No Fuel Used | 18 (0.7%) | 0 (0.0%) |
| Total | 2,733 (100.0%) | 524 (100.0%) |
Household Vehicle Usage in Ritchie County

| Vehicles per Household | Owner-occupied | Renter-occupied |
| No Vehicle | 96 (3.5%) | 53 (10.1%) |
| 1 Vehicle | 712 (26.1%) | 328 (62.6%) |
| 2 Vehicles | 1,245 (45.6%) | 130 (24.8%) |
| 3 or more Vehicles | 680 (24.9%) | 13 (2.5%) |
| Total | 2,733 (100.0%) | 524 (100.0%) |
Real Estate & Mortgages in Ritchie County
Real Estate and Mortgage Overview in Ritchie County
| Characteristic | Without Mortgage | With Mortgage |
| Housing Units | 1,853 | 880 |
| Median Property Value | $98,900 | $133,800 |
| Median Household Income | $46,420 | $168 |
| Monthly Housing Costs | $262 | $8 |
| Real Estate Taxes | $574 | $28 |
Property Value by Mortgage Status in Ritchie County

| Property Value | Without Mortgage | With Mortgage |
| Less than $50,000 | 549 (29.6%) | 56 (6.4%) |
| $50,000 to $99,999 | 388 (20.9%) | 275 (31.2%) |
| $100,000 to $299,999 | 823 (44.4%) | 414 (47.0%) |
| $300,000 to $499,999 | 56 (3.0%) | 73 (8.3%) |
| $500,000 to $749,999 | 37 (2.0%) | 17 (1.9%) |
| $750,000 to $999,999 | 0 (0.0%) | 8 (0.9%) |
| $1,000,000 or more | 0 (0.0%) | 37 (4.2%) |
| Total | 1,853 (100.0%) | 880 (100.0%) |
Household Income by Mortgage Status in Ritchie County

| Household Income | Without Mortgage | With Mortgage |
| Less than $10,000 | 107 (5.8%) | 38 (4.3%) |
| $10,000 to $24,999 | 342 (18.5%) | 5 (0.6%) |
| $25,000 to $34,999 | 200 (10.8%) | 76 (8.6%) |
| $35,000 to $49,999 | 392 (21.1%) | 75 (8.5%) |
| $50,000 to $74,999 | 387 (20.9%) | 81 (9.2%) |
| $75,000 to $99,999 | 196 (10.6%) | 179 (20.3%) |
| $100,000 to $149,999 | 116 (6.3%) | 177 (20.1%) |
| $150,000 or more | 113 (6.1%) | 119 (13.5%) |
| Total | 1,853 (100.0%) | 880 (100.0%) |
Property Value to Household Income Ratio in Ritchie County

| Value-to-Income Ratio | Without Mortgage | With Mortgage |
| Less than 2.0x | 1,015 (54.8%) | 76,111 (8,649.0%) |
| 2.0x to 2.9x | 253 (13.7%) | 407 (46.3%) |
| 3.0x to 3.9x | 138 (7.4%) | 283 (32.2%) |
| 4.0x or more | 414 (22.3%) | 69 (7.8%) |
| Total | 1,853 (100.0%) | 880 (100.0%) |
Real Estate Taxes by Mortgage Status in Ritchie County

| Property Taxes | Without Mortgage | With Mortgage |
| Less than $800 | 1,054 (56.9%) | 2 (0.2%) |
| $800 to $1,499 | 473 (25.5%) | 442 (50.2%) |
| $800 to $1,499 | 92 (5.0%) | 262 (29.8%) |
| Total | 1,853 (100.0%) | 880 (100.0%) |
Health & Disability in Ritchie County
Health Insurance Coverage by Age in Ritchie County

| Age Bracket | With Coverage | Without Coverage |
| Under 6 Years | 474 (100.0%) | 0 (0.0%) |
| 6 to 18 Years | 1,283 (97.0%) | 40 (3.0%) |
| 19 to 25 Years | 466 (79.9%) | 117 (20.1%) |
| 26 to 34 Years | 660 (89.4%) | 78 (10.6%) |
| 35 to 44 Years | 832 (88.8%) | 105 (11.2%) |
| 45 to 54 Years | 1,082 (94.9%) | 58 (5.1%) |
| 55 to 64 Years | 1,178 (85.6%) | 199 (14.4%) |
| 65 to 74 Years | 1,169 (99.7%) | 3 (0.3%) |
| 75 Years and older | 718 (100.0%) | 0 (0.0%) |
| Total | 7,862 (92.9%) | 600 (7.1%) |
Health Insurance Coverage by Citizenship Status in Ritchie County

| Citizenship Status | With Coverage | Without Coverage |
| Native Born | 474 (100.0%) | 0 (0.0%) |
| Foreign Born, Citizen | 1,283 (97.0%) | 40 (3.0%) |
| Foreign Born, not a Citizen | 466 (79.9%) | 117 (20.1%) |
Health Insurance Coverage by Household Income in Ritchie County

| Household Income | With Coverage | Without Coverage |
| Under $25,000 | 1,540 (91.0%) | 153 (9.0%) |
| $25,000 to $49,999 | 1,959 (91.7%) | 177 (8.3%) |
| $50,000 to $74,999 | 1,489 (90.3%) | 160 (9.7%) |
| $75,000 to $99,999 | 1,123 (92.7%) | 89 (7.3%) |
| $100,000 and over | 1,751 (98.8%) | 21 (1.2%) |
Public vs Private Health Insurance Coverage by Age in Ritchie County

| Age Bracket | Public Insurance | Private Insurance |
| Under 6 | 311 (65.6%) | 174 (36.7%) |
| 6 to 18 Years | 837 (63.3%) | 621 (46.9%) |
| 19 to 25 Years | 202 (34.6%) | 275 (47.2%) |
| 25 to 34 Years | 322 (43.6%) | 362 (49.0%) |
| 35 to 44 Years | 401 (42.8%) | 541 (57.7%) |
| 45 to 54 Years | 297 (26.1%) | 823 (72.2%) |
| 55 to 64 Years | 506 (36.7%) | 807 (58.6%) |
| 65 to 74 Years | 1,162 (99.2%) | 621 (53.0%) |
| 75 Years and over | 718 (100.0%) | 499 (69.5%) |
| Total | 4,756 (56.2%) | 4,723 (55.8%) |
Disability Status by Sex by Age in Ritchie County

| Age Bracket | Male | Female |
| Under 5 Years | 0 (0.0%) | 0 (0.0%) |
| 5 to 17 Years | 156 (23.2%) | 32 (4.9%) |
| 18 to 34 Years | 143 (19.7%) | 126 (18.9%) |
| 35 to 64 Years | 584 (33.1%) | 475 (28.1%) |
| 65 to 74 Years | 271 (46.3%) | 210 (35.8%) |
| 75 Years and over | 197 (59.5%) | 226 (58.4%) |
Disability Class by Sex by Age in Ritchie County
Disability Class: Hearing Difficulty

| Age Bracket | Male | Female |
| Under 5 Years | 0 (0.0%) | 0 (0.0%) |
| 5 to 17 Years | 21 (3.1%) | 3 (0.5%) |
| 18 to 34 Years | 0 (0.0%) | 24 (3.6%) |
| 35 to 64 Years | 138 (7.8%) | 131 (7.8%) |
| 65 to 74 Years | 142 (24.2%) | 55 (9.4%) |
| 75 Years and over | 140 (42.3%) | 67 (17.3%) |
Disability Class: Vision Difficulty

| Age Bracket | Male | Female |
| Under 5 Years | 0 (0.0%) | 0 (0.0%) |
| 5 to 17 Years | 21 (3.1%) | 9 (1.4%) |
| 18 to 34 Years | 41 (5.7%) | 14 (2.1%) |
| 35 to 64 Years | 196 (11.1%) | 85 (5.0%) |
| 65 to 74 Years | 83 (14.2%) | 67 (11.4%) |
| 75 Years and over | 37 (11.2%) | 12 (3.1%) |
Disability Class: Cognitive Difficulty

| Age Bracket | Male | Female |
| 5 to 17 Years | 156 (23.2%) | 20 (3.1%) |
| 18 to 34 Years | 57 (7.9%) | 70 (10.5%) |
| 35 to 64 Years | 222 (12.6%) | 52 (3.1%) |
| 65 to 74 Years | 41 (7.0%) | 15 (2.6%) |
| 75 Years and over | 62 (18.7%) | 48 (12.4%) |
Disability Class: Ambulatory Difficulty

| Age Bracket | Male | Female |
| 5 to 17 Years | 21 (3.1%) | 9 (1.4%) |
| 18 to 34 Years | 58 (8.0%) | 55 (8.3%) |
| 35 to 64 Years | 335 (19.0%) | 313 (18.5%) |
| 65 to 74 Years | 113 (19.3%) | 100 (17.1%) |
| 75 Years and over | 54 (16.3%) | 141 (36.4%) |
Disability Class: Self-Care Difficulty

| Age Bracket | Male | Female |
| 5 to 17 Years | 49 (7.3%) | 17 (2.6%) |
| 18 to 34 Years | 12 (1.7%) | 5 (0.7%) |
| 35 to 64 Years | 166 (9.4%) | 27 (1.6%) |
| 65 to 74 Years | 19 (3.2%) | 76 (13.0%) |
| 75 Years and over | 5 (1.5%) | 48 (12.4%) |
Technology Access in Ritchie County
Computing Device Access in Ritchie County

| Device Type | # Households | % Households |
| Desktop or Laptop | 2,224 | 68.3% |
| Smartphone | 2,266 | 69.6% |
| Tablet | 1,522 | 46.7% |
| No Computing Device | 461 | 14.1% |
| Total | 3,257 | 100.0% |
Internet Access in Ritchie County

| Internet Type | # Households | % Households |
| Dial-Up Internet | 52 | 1.6% |
| Broadband Home | 1,878 | 57.7% |
| Cellular Data Only | 342 | 10.5% |
| Satellite Internet | 341 | 10.5% |
| No Internet | 685 | 21.0% |
| Total | 3,257 | 100.0% |
Ritchie County Summary
Ritchie County is located in the north-central region of West Virginia, and is part of the Mid-Ohio Valley region. It is bordered by Wood County to the north, Wirt County to the east, Calhoun County to the south, and Pleasants County to the west. The county seat is Harrisville, and the county has a total area of 441 square miles.
History
Ritchie County was formed in 1843 from parts of Wood, Harrison, and Lewis counties. It was named after Thomas Ritchie, Jr., a prominent Virginia newspaper editor and politician. The county was originally part of the Northwest Territory, and was part of the state of Virginia until 1863, when it became part of West Virginia.
The county was home to several Native American tribes, including the Shawnee, Delaware, and Mingo. The first European settlers arrived in the area in the late 1700s, and the county was officially established in 1843.
During the Civil War, Ritchie County was a major center of Union activity. The county was home to several Union camps, and the Battle of Ritchie County was fought in the area in 1863.
Geography
Ritchie County is located in the north-central region of West Virginia, and is part of the Mid-Ohio Valley region. It is bordered by Wood County to the north, Wirt County to the east, Calhoun County to the south, and Pleasants County to the west. The county seat is Harrisville, and the county has a total area of 441 square miles.
The terrain of Ritchie County is mostly hilly, with some flat areas in the valleys. The highest point in the county is located at the summit of Big Mountain, which has an elevation of 2,845 feet. The county is drained by the Little Kanawha River and its tributaries.
Economy
The economy of Ritchie County is largely based on agriculture and natural resources. The county is home to several large farms, and the main crops grown in the area are corn, soybeans, hay, and wheat. The county is also home to several coal mines, and timber is harvested from the county’s forests.
The county is home to several small businesses, including restaurants, retail stores, and service providers. The county is also home to several manufacturing companies, including a furniture factory and a plastics plant.
Demographics
As of the 2010 census, the population of Ritchie County was 10,449. The population is mostly white (96.2%), with small percentages of African Americans (1.7%), Native Americans (0.3%), Asians (0.2%), and other races (1.6%). The median household income in the county is $37,945, and the median age is 43.7 years.
Ritchie County is home to several small towns, including Harrisville, Pennsboro, Ellenboro, and Cairo. The county is served by several school districts, including Ritchie County Schools, Calhoun County Schools, and Wirt County Schools. The county is also home to several churches, including the United Methodist Church, the Church of the Nazarene, and the Church of God.
Common Questions
What is the Total Population of Ritchie County?
Total Population of Ritchie County is 8,507.
What is the Total Male Population of Ritchie County?
Total Male Population of Ritchie County is 4,288.
What is the Total Female Population of Ritchie County?
Total Female Population of Ritchie County is 4,219.
What is the Ratio of Males per 100 Females in Ritchie County?
There are 101.64 Males per 100 Females in Ritchie County.
What is the Ratio of Females per 100 Males in Ritchie County?
There are 98.39 Females per 100 Males in Ritchie County.
What is the Median Population Age in Ritchie County?
Median Population Age in Ritchie County is 46.6 Years.
What is the Average Family Size in Ritchie County
Average Family Size in Ritchie County is 3.0 People.
What is the Average Household Size in Ritchie County
Average Household Size in Ritchie County is 2.6 People.
What is Per Capita Income in Ritchie County?
Per Capita income in Ritchie County is $27,997.
What is the Median Family Income in Ritchie County?
Median Family Income in Ritchie County is $59,295.
What is the Median Household income in Ritchie County?
Median Household Income in Ritchie County is $48,973.
What is Income or Wage Gap in Ritchie County?
Income or Wage Gap in Ritchie County is 33.3%.
Women in Ritchie County earn 66.7 cents for every dollar earned by a man.
What is Inequality or Gini Index in Ritchie County?
Inequality or Gini Index in Ritchie County is 0.48.
How Large is the Labor Force in Ritchie County?
There are 2,992 People in the Labor Forcein in Ritchie County.
What is the Percentage of People in the Labor Force in Ritchie County?
42.7% of People are in the Labor Force in Ritchie County.
What is the Unemployment Rate in Ritchie County?
Unemployment Rate in Ritchie County is 3.6%.