Randolph County, WV
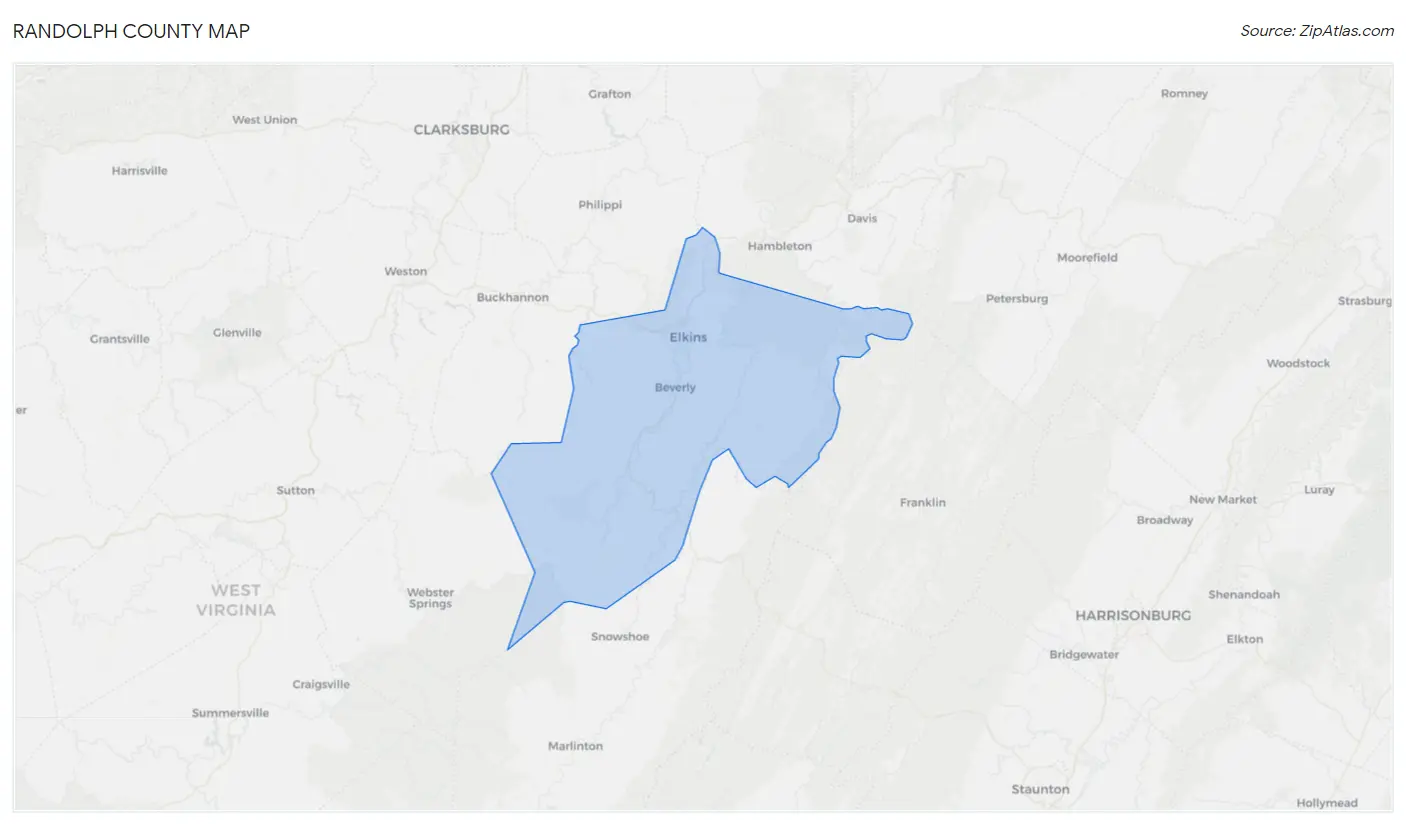
Randolph County Map
Randolph County Overview
28,005
TOTAL POPULATION
14,750
MALE POPULATION
13,255
FEMALE POPULATION
111.28
MALES / 100 FEMALES
89.86
FEMALES / 100 MALES
44.6
MEDIAN AGE
3.2
AVG FAMILY SIZE
2.5
AVG HOUSEHOLD SIZE
$26,289
PER CAPITA INCOME
$64,084
AVG FAMILY INCOME
$51,186
AVG HOUSEHOLD INCOME
26.0%
WAGE / INCOME GAP [ % ]
74.0¢/ $1
WAGE / INCOME GAP [ $ ]
$8,680
FAMILY INCOME DEFICIT
0.44
INEQUALITY / GINI INDEX
11,495
LABOR FORCE [ PEOPLE ]
49.0%
PERCENT IN LABOR FORCE
7.3%
UNEMPLOYMENT RATE
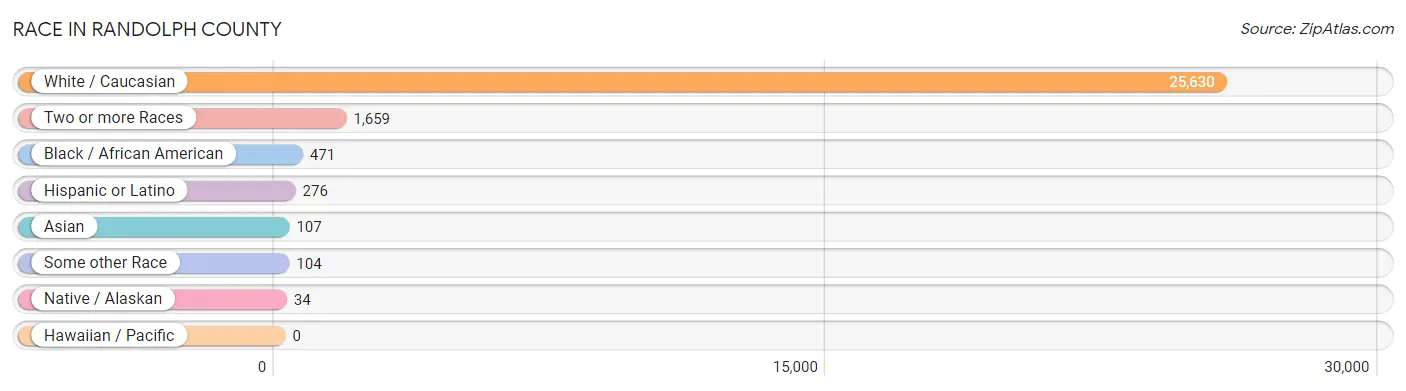
Race in Randolph County
The most populous races in Randolph County are White / Caucasian (25,630 | 91.5%), Two or more Races (1,659 | 5.9%), and Black / African American (471 | 1.7%).
| Race | # Population | % Population |
| Asian | 107 | 0.4% |
| Black / African American | 471 | 1.7% |
| Hawaiian / Pacific | 0 | 0.0% |
| Hispanic or Latino | 276 | 1.0% |
| Native / Alaskan | 34 | 0.1% |
| White / Caucasian | 25,630 | 91.5% |
| Two or more Races | 1,659 | 5.9% |
| Some other Race | 104 | 0.4% |
| Total | 28,005 | 100.0% |
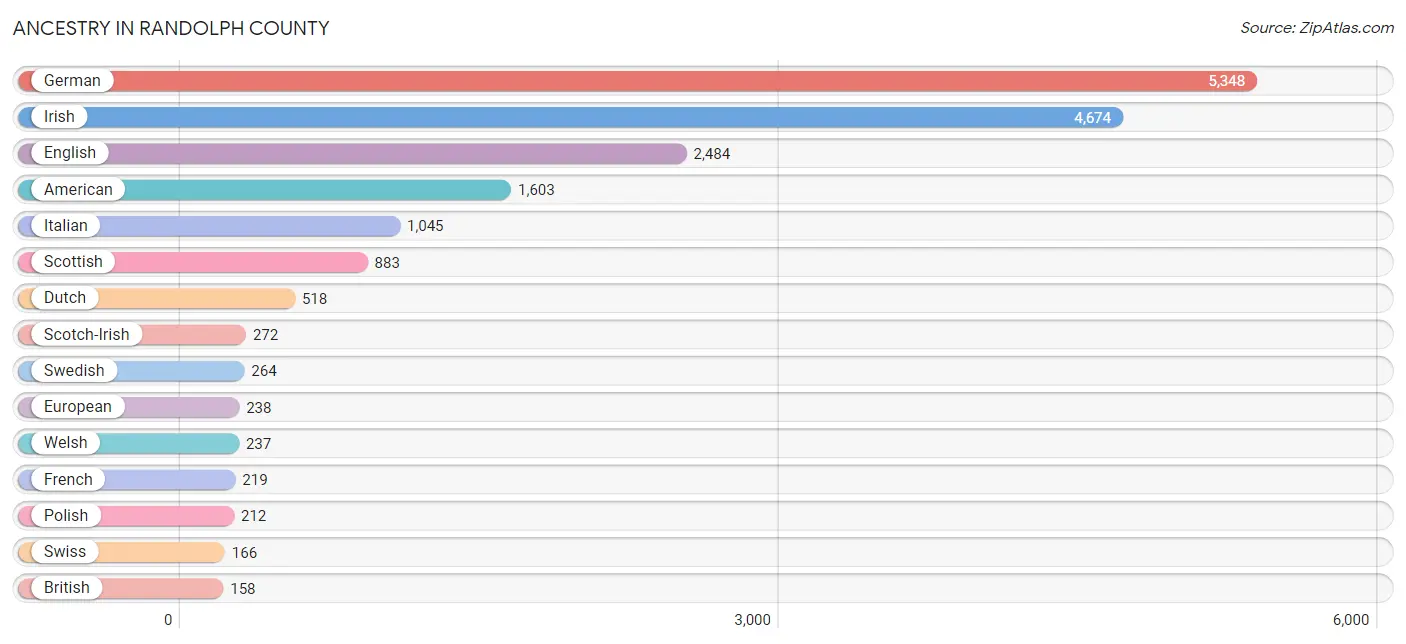
Ancestry in Randolph County
The most populous ancestries reported in Randolph County are German (5,348 | 19.1%), Irish (4,674 | 16.7%), English (2,484 | 8.9%), American (1,603 | 5.7%), and Italian (1,045 | 3.7%), together accounting for 54.1% of all Randolph County residents.
| Ancestry | # Population | % Population |
| African | 18 | 0.1% |
| Alsatian | 3 | 0.0% |
| American | 1,603 | 5.7% |
| Arab | 19 | 0.1% |
| Austrian | 6 | 0.0% |
| Bhutanese | 6 | 0.0% |
| British | 158 | 0.6% |
| Burmese | 29 | 0.1% |
| Central American | 14 | 0.1% |
| Central American Indian | 8 | 0.0% |
| Cherokee | 40 | 0.1% |
| Cree | 2 | 0.0% |
| Czech | 32 | 0.1% |
| Danish | 20 | 0.1% |
| Dutch | 518 | 1.8% |
| Eastern European | 14 | 0.1% |
| Egyptian | 8 | 0.0% |
| English | 2,484 | 8.9% |
| European | 238 | 0.9% |
| French | 219 | 0.8% |
| French Canadian | 18 | 0.1% |
| German | 5,348 | 19.1% |
| German Russian | 3 | 0.0% |
| Guatemalan | 8 | 0.0% |
| Hungarian | 17 | 0.1% |
| Indian (Asian) | 78 | 0.3% |
| Irish | 4,674 | 16.7% |
| Italian | 1,045 | 3.7% |
| Korean | 37 | 0.1% |
| Laotian | 1 | 0.0% |
| Lebanese | 11 | 0.0% |
| Mexican | 86 | 0.3% |
| Northern European | 59 | 0.2% |
| Norwegian | 73 | 0.3% |
| Panamanian | 6 | 0.0% |
| Peruvian | 61 | 0.2% |
| Polish | 212 | 0.8% |
| Portuguese | 2 | 0.0% |
| Puerto Rican | 32 | 0.1% |
| Romanian | 8 | 0.0% |
| Russian | 67 | 0.2% |
| Scandinavian | 72 | 0.3% |
| Scotch-Irish | 272 | 1.0% |
| Scottish | 883 | 3.2% |
| Slovak | 12 | 0.0% |
| Slovene | 17 | 0.1% |
| South American | 61 | 0.2% |
| Spaniard | 7 | 0.0% |
| Spanish | 12 | 0.0% |
| Subsaharan African | 18 | 0.1% |
| Swedish | 264 | 0.9% |
| Swiss | 166 | 0.6% |
| Thai | 43 | 0.2% |
| Ukrainian | 21 | 0.1% |
| Welsh | 237 | 0.9% |
| Yugoslavian | 22 | 0.1% | View All 56 Rows |
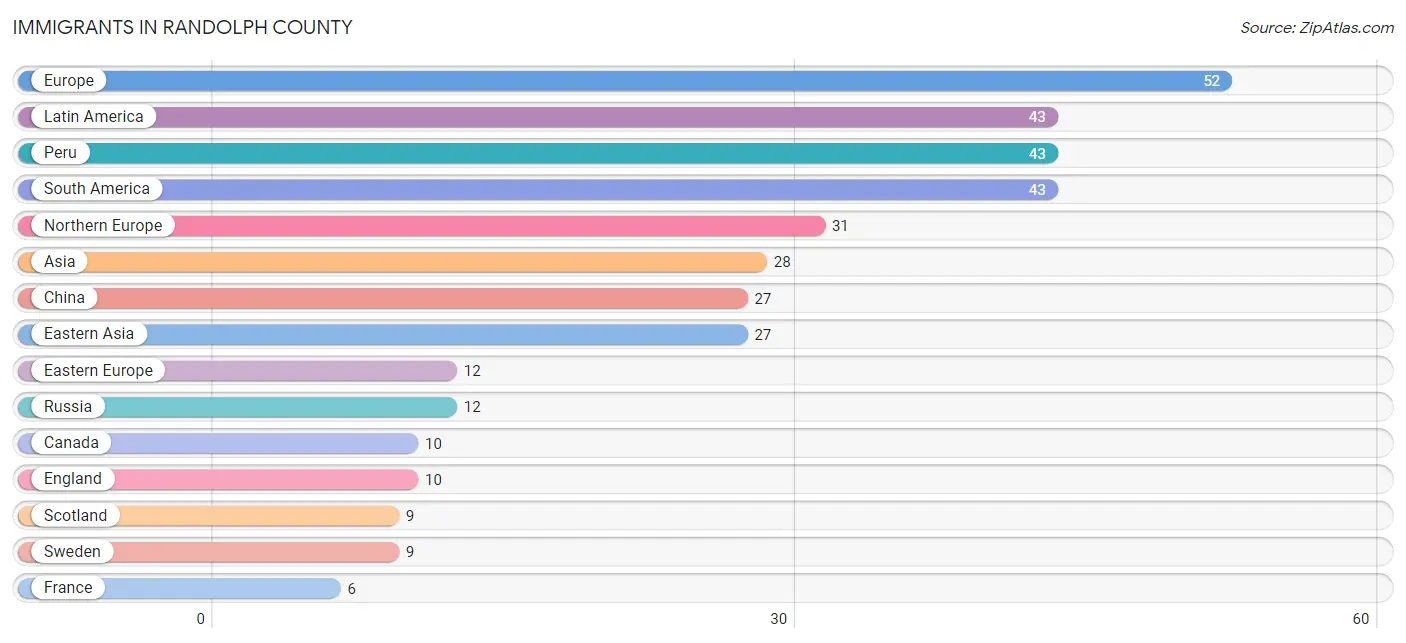
Immigrants in Randolph County
The most numerous immigrant groups reported in Randolph County came from Europe (52 | 0.2%), Latin America (43 | 0.2%), Peru (43 | 0.2%), South America (43 | 0.2%), and Northern Europe (31 | 0.1%), together accounting for 0.7% of all Randolph County residents.
| Immigration Origin | # Population | % Population |
| Asia | 28 | 0.1% |
| Canada | 10 | 0.0% |
| China | 27 | 0.1% |
| Eastern Asia | 27 | 0.1% |
| Eastern Europe | 12 | 0.0% |
| England | 10 | 0.0% |
| Europe | 52 | 0.2% |
| France | 6 | 0.0% |
| Indonesia | 1 | 0.0% |
| Ireland | 3 | 0.0% |
| Latin America | 43 | 0.2% |
| Northern Europe | 31 | 0.1% |
| Peru | 43 | 0.2% |
| Russia | 12 | 0.0% |
| Scotland | 9 | 0.0% |
| South America | 43 | 0.2% |
| South Eastern Asia | 1 | 0.0% |
| Southern Europe | 3 | 0.0% |
| Spain | 3 | 0.0% |
| Sweden | 9 | 0.0% |
| Western Europe | 6 | 0.0% | View All 21 Rows |
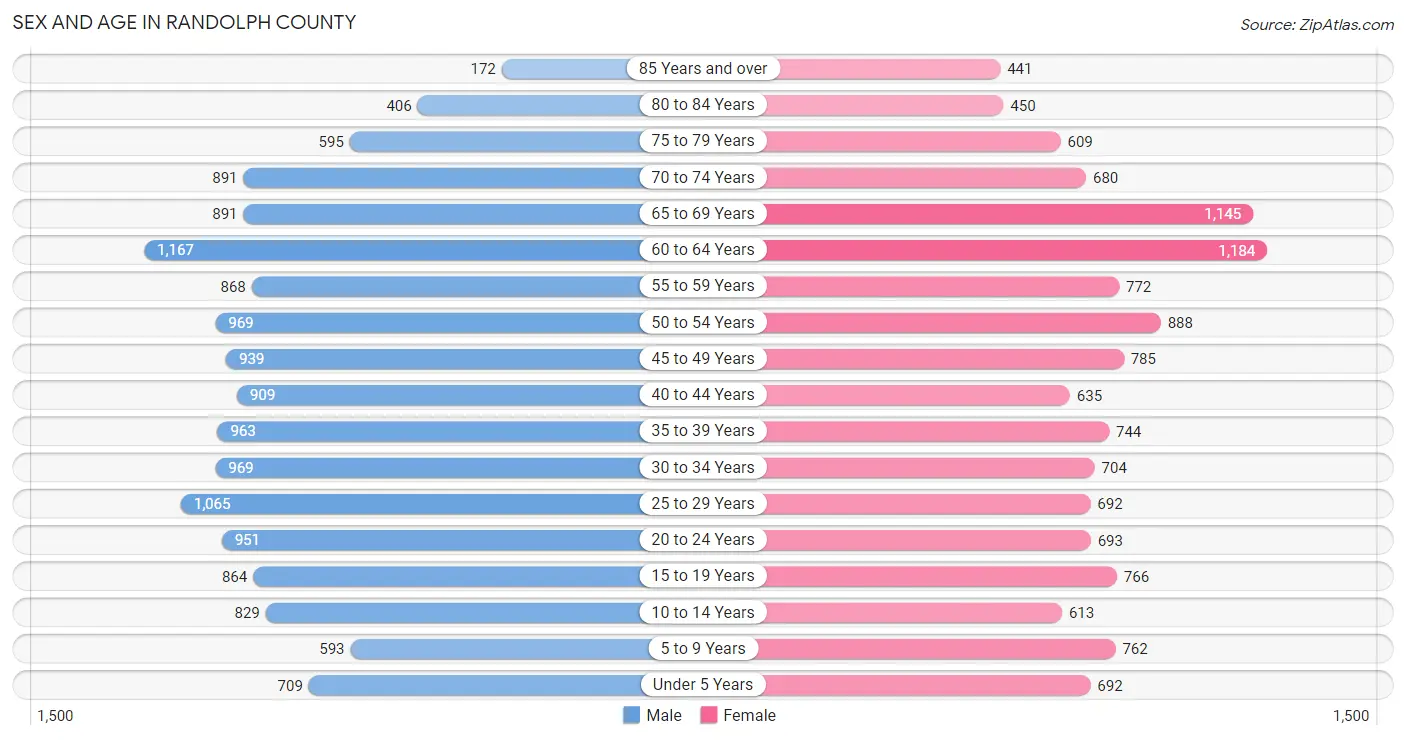
Sex and Age in Randolph County
Sex and Age in Randolph County
The most populous age groups in Randolph County are 60 to 64 Years (1,167 | 7.9%) for men and 60 to 64 Years (1,184 | 8.9%) for women.
| Age Bracket | Male | Female |
| Under 5 Years | 709 (4.8%) | 692 (5.2%) |
| 5 to 9 Years | 593 (4.0%) | 762 (5.8%) |
| 10 to 14 Years | 829 (5.6%) | 613 (4.6%) |
| 15 to 19 Years | 864 (5.9%) | 766 (5.8%) |
| 20 to 24 Years | 951 (6.5%) | 693 (5.2%) |
| 25 to 29 Years | 1,065 (7.2%) | 692 (5.2%) |
| 30 to 34 Years | 969 (6.6%) | 704 (5.3%) |
| 35 to 39 Years | 963 (6.5%) | 744 (5.6%) |
| 40 to 44 Years | 909 (6.2%) | 635 (4.8%) |
| 45 to 49 Years | 939 (6.4%) | 785 (5.9%) |
| 50 to 54 Years | 969 (6.6%) | 888 (6.7%) |
| 55 to 59 Years | 868 (5.9%) | 772 (5.8%) |
| 60 to 64 Years | 1,167 (7.9%) | 1,184 (8.9%) |
| 65 to 69 Years | 891 (6.0%) | 1,145 (8.6%) |
| 70 to 74 Years | 891 (6.0%) | 680 (5.1%) |
| 75 to 79 Years | 595 (4.0%) | 609 (4.6%) |
| 80 to 84 Years | 406 (2.8%) | 450 (3.4%) |
| 85 Years and over | 172 (1.2%) | 441 (3.3%) |
| Total | 14,750 (100.0%) | 13,255 (100.0%) |
Families and Households in Randolph County
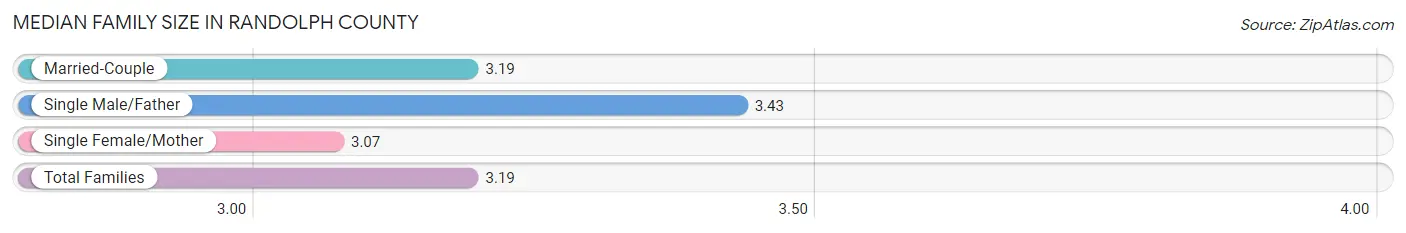
Median Family Size in Randolph County
The median family size in Randolph County is 3.19 persons per family, with single male/father families (558 | 8.8%) accounting for the largest median family size of 3.43 persons per family. On the other hand, single female/mother families (1,080 | 17.1%) represent the smallest median family size with 3.07 persons per family.
| Family Type | # Families | Family Size |
| Married-Couple | 4,690 (74.1%) | 3.19 |
| Single Male/Father | 558 (8.8%) | 3.43 |
| Single Female/Mother | 1,080 (17.1%) | 3.07 |
| Total Families | 6,328 (100.0%) | 3.19 |
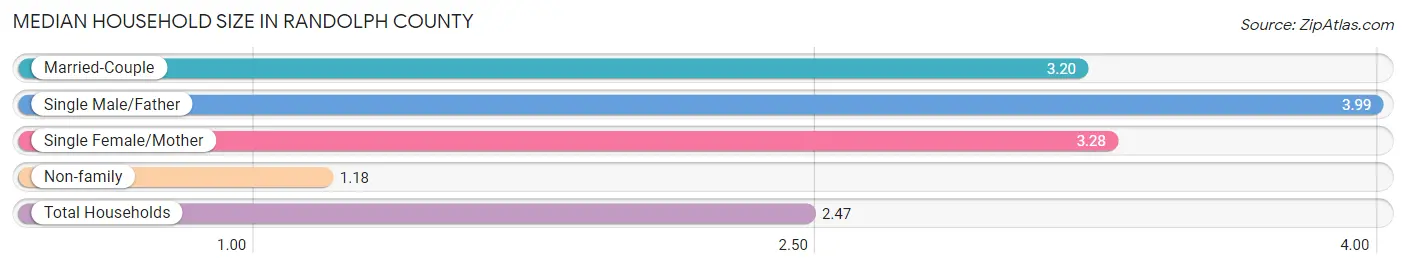
Median Household Size in Randolph County
The median household size in Randolph County is 2.47 persons per household, with single male/father households (558 | 5.4%) accounting for the largest median household size of 3.99 persons per household. non-family households (4,034 | 38.9%) represent the smallest median household size with 1.18 persons per household.
| Household Type | # Households | Household Size |
| Married-Couple | 4,690 (45.3%) | 3.20 |
| Single Male/Father | 558 (5.4%) | 3.99 |
| Single Female/Mother | 1,080 (10.4%) | 3.28 |
| Non-family | 4,034 (38.9%) | 1.18 |
| Total Households | 10,362 (100.0%) | 2.47 |
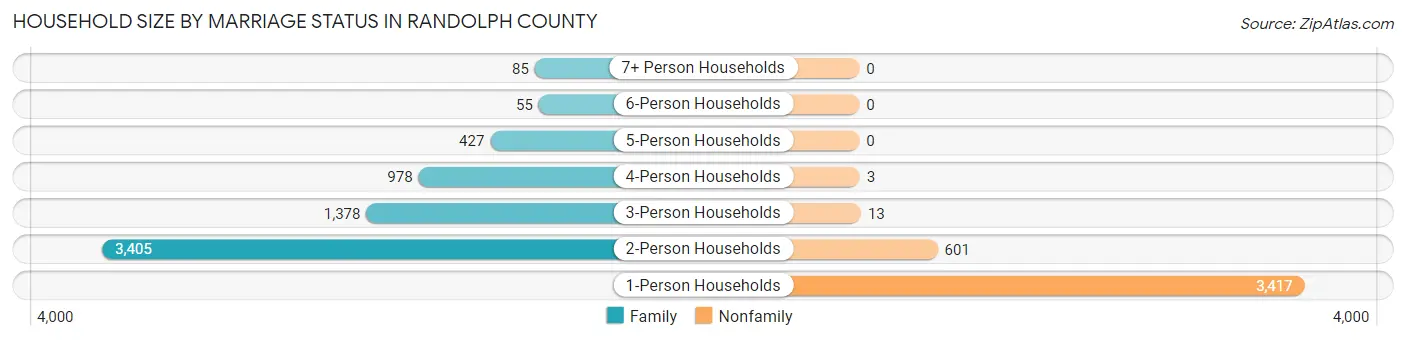
Household Size by Marriage Status in Randolph County
Out of a total of 10,362 households in Randolph County, 6,328 (61.1%) are family households, while 4,034 (38.9%) are nonfamily households. The most numerous type of family households are 2-person households, comprising 3,405, and the most common type of nonfamily households are 1-person households, comprising 3,417.
| Household Size | Family Households | Nonfamily Households |
| 1-Person Households | - | 3,417 (33.0%) |
| 2-Person Households | 3,405 (32.9%) | 601 (5.8%) |
| 3-Person Households | 1,378 (13.3%) | 13 (0.1%) |
| 4-Person Households | 978 (9.4%) | 3 (0.0%) |
| 5-Person Households | 427 (4.1%) | 0 (0.0%) |
| 6-Person Households | 55 (0.5%) | 0 (0.0%) |
| 7+ Person Households | 85 (0.8%) | 0 (0.0%) |
| Total | 6,328 (61.1%) | 4,034 (38.9%) |
Female Fertility in Randolph County
Fertility by Age in Randolph County
Average fertility rate in Randolph County is 39.0 births per 1,000 women. Women in the age bracket of 20 to 34 years have the highest fertility rate with 70.0 births per 1,000 women. Women in the age bracket of 20 to 34 years acount for 71.9% of all women with births.
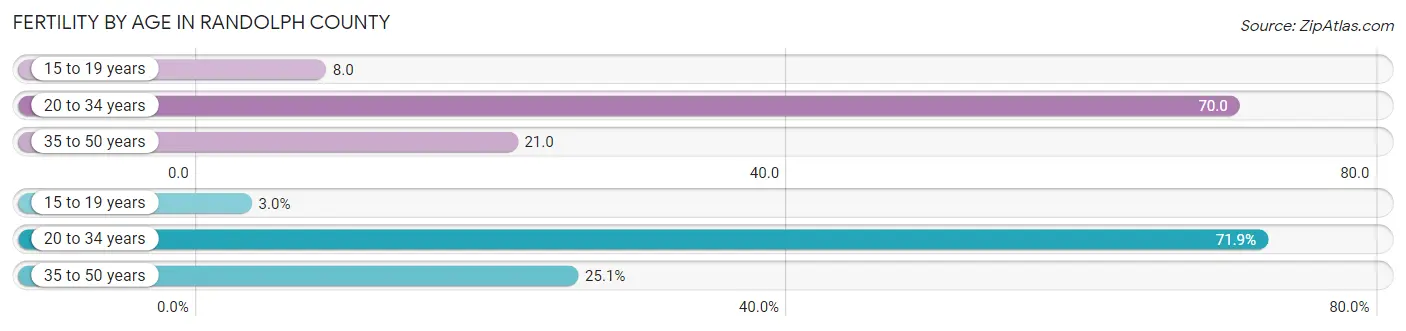
| Age Bracket | Women with Births | Births / 1,000 Women |
| 15 to 19 years | 6 (3.0%) | 8.0 |
| 20 to 34 years | 146 (71.9%) | 70.0 |
| 35 to 50 years | 51 (25.1%) | 21.0 |
| Total | 203 (100.0%) | 39.0 |
Fertility by Age by Marriage Status in Randolph County
64.0% of women with births (203) in Randolph County are married. The highest percentage of unmarried women with births falls into 15 to 19 years age bracket with 100.0% of them unmarried at the time of birth, while the lowest percentage of unmarried women with births belong to 35 to 50 years age bracket with 0.0% of them unmarried.
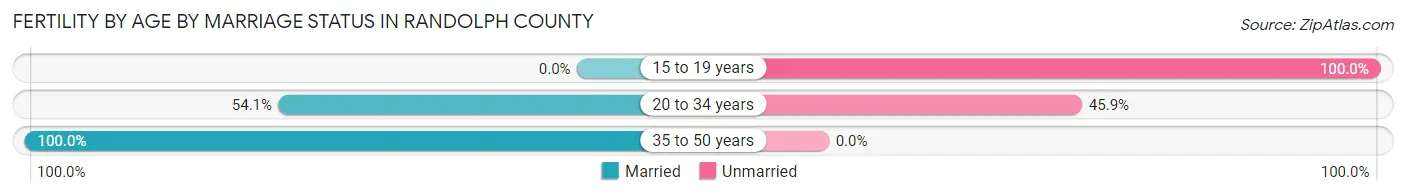
| Age Bracket | Married | Unmarried |
| 15 to 19 years | 0 (0.0%) | 6 (100.0%) |
| 20 to 34 years | 79 (54.1%) | 67 (45.9%) |
| 35 to 50 years | 51 (100.0%) | 0 (0.0%) |
| Total | 130 (64.0%) | 73 (36.0%) |
Fertility by Education in Randolph County
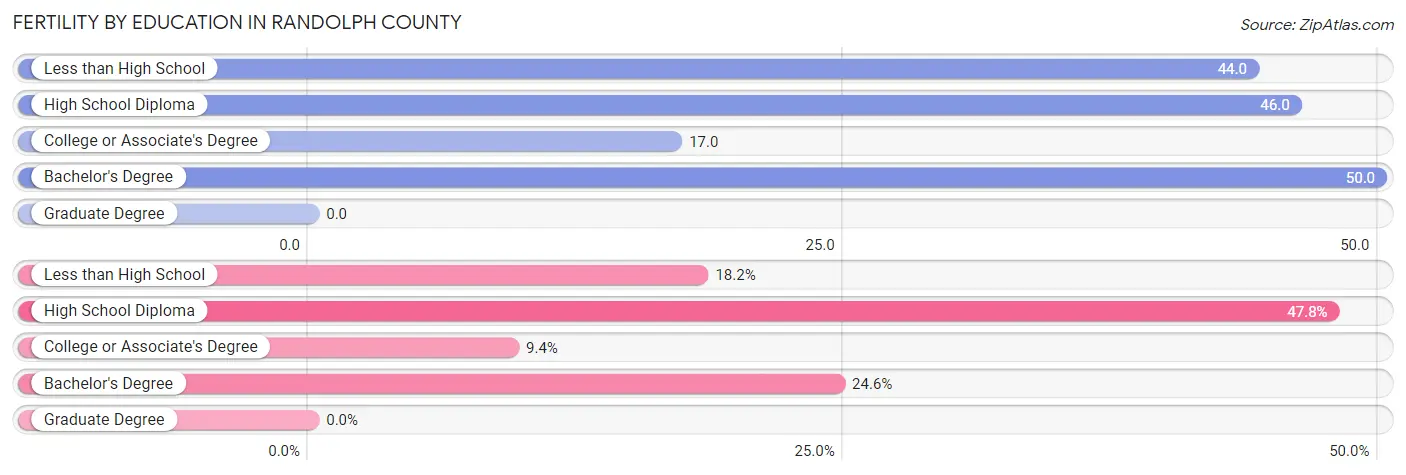
| Educational Attainment | Women with Births | Births / 1,000 Women |
| Less than High School | 37 (18.2%) | 44.0 |
| High School Diploma | 97 (47.8%) | 46.0 |
| College or Associate's Degree | 19 (9.4%) | 17.0 |
| Bachelor's Degree | 50 (24.6%) | 50.0 |
| Graduate Degree | 0 (0.0%) | 0.0 |
| Total | 203 (100.0%) | 39.0 |
Fertility by Education by Marriage Status in Randolph County
36.0% of women with births in Randolph County are unmarried. Women with the educational attainment of college or associate's degree are most likely to be married with 100.0% of them married at childbirth, while women with the educational attainment of less than high school are least likely to be married with 100.0% of them unmarried at childbirth.
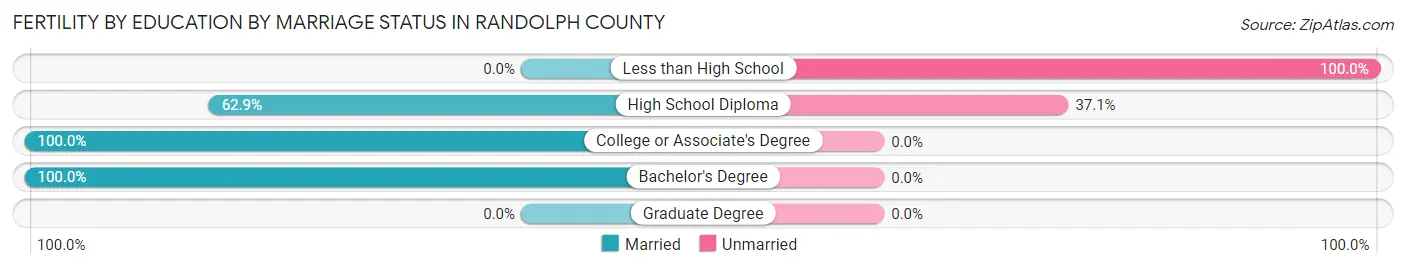
| Educational Attainment | Married | Unmarried |
| Less than High School | 0 (0.0%) | 37 (100.0%) |
| High School Diploma | 61 (62.9%) | 36 (37.1%) |
| College or Associate's Degree | 19 (100.0%) | 0 (0.0%) |
| Bachelor's Degree | 50 (100.0%) | 0 (0.0%) |
| Graduate Degree | 0 (0.0%) | 0 (0.0%) |
| Total | 130 (64.0%) | 73 (36.0%) |
Income in Randolph County
Income Overview in Randolph County
Per Capita Income in Randolph County is $26,289, while median incomes of families and households are $64,084 and $51,186 respectively.
| Characteristic | Number | Measure |
| Per Capita Income | 28,005 | $26,289 |
| Median Family Income | 6,328 | $64,084 |
| Mean Family Income | 6,328 | $77,709 |
| Median Household Income | 10,362 | $51,186 |
| Mean Household Income | 10,362 | $64,793 |
| Income Deficit | 6,328 | $8,680 |
| Wage / Income Gap (%) | 28,005 | 26.01% |
| Wage / Income Gap ($) | 28,005 | 73.99¢ per $1 |
| Gini / Inequality Index | 28,005 | 0.44 |
Earnings by Sex in Randolph County
Average Earnings in Randolph County are $30,605, $36,151 for men and $26,749 for women, a difference of 26.0%.
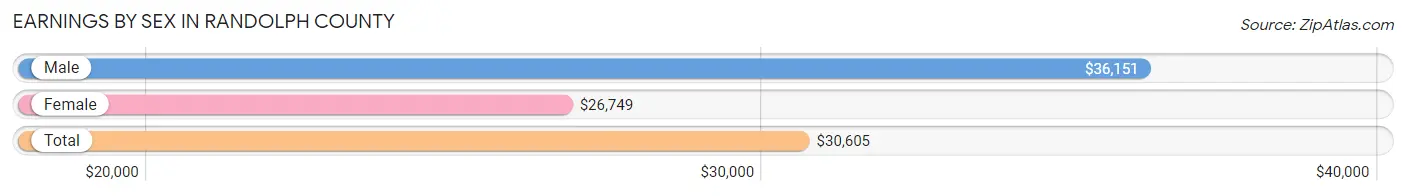
| Sex | Number | Average Earnings |
| Male | 6,545 (54.0%) | $36,151 |
| Female | 5,580 (46.0%) | $26,749 |
| Total | 12,125 (100.0%) | $30,605 |
Earnings by Sex by Income Bracket in Randolph County
The most common earnings brackets in Randolph County are $25,000 to $29,999 for men (739 | 11.3%) and $25,000 to $29,999 for women (721 | 12.9%).
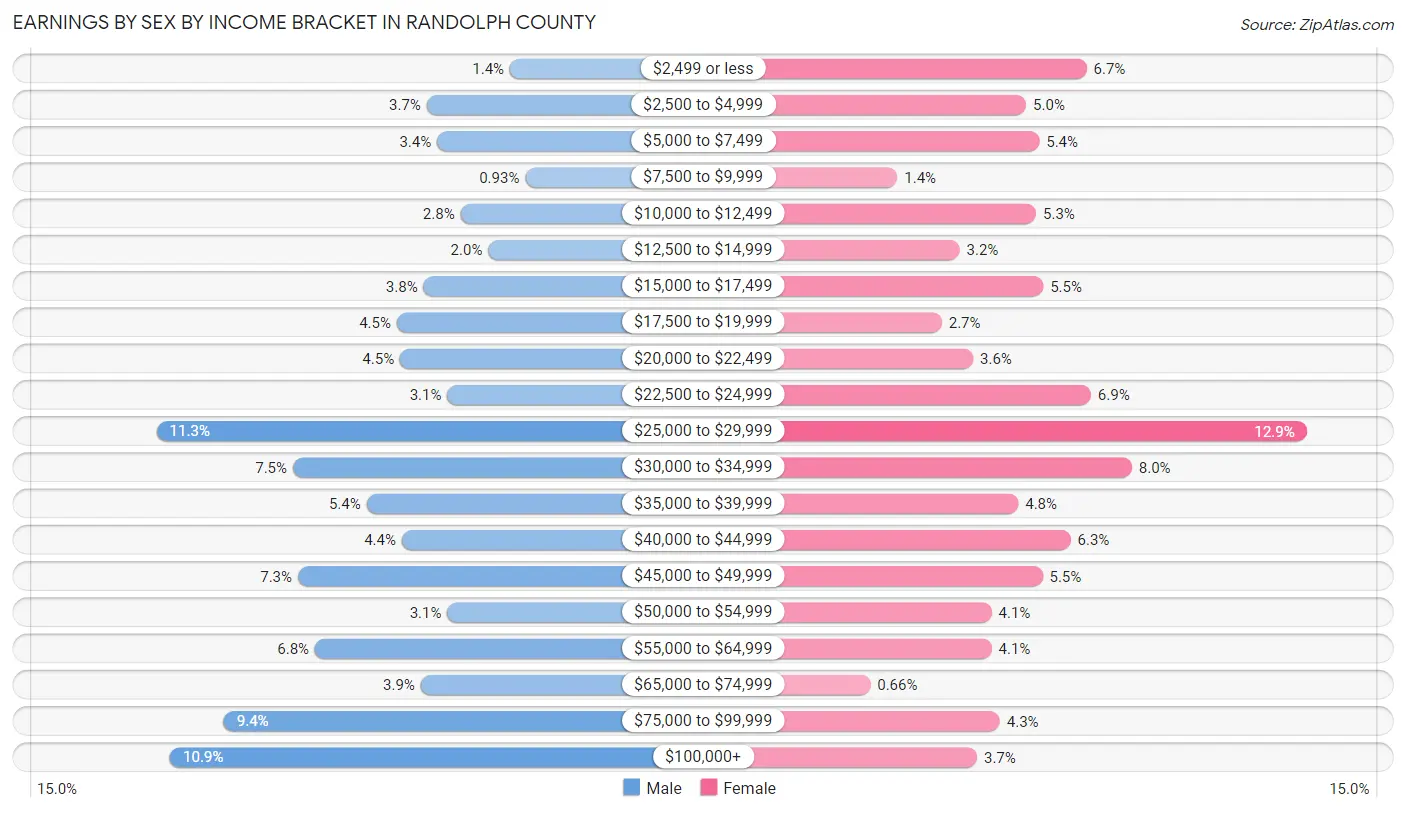
| Income | Male | Female |
| $2,499 or less | 89 (1.4%) | 376 (6.7%) |
| $2,500 to $4,999 | 242 (3.7%) | 281 (5.0%) |
| $5,000 to $7,499 | 223 (3.4%) | 302 (5.4%) |
| $7,500 to $9,999 | 61 (0.9%) | 79 (1.4%) |
| $10,000 to $12,499 | 180 (2.8%) | 297 (5.3%) |
| $12,500 to $14,999 | 129 (2.0%) | 177 (3.2%) |
| $15,000 to $17,499 | 248 (3.8%) | 308 (5.5%) |
| $17,500 to $19,999 | 297 (4.5%) | 149 (2.7%) |
| $20,000 to $22,499 | 291 (4.4%) | 198 (3.5%) |
| $22,500 to $24,999 | 204 (3.1%) | 383 (6.9%) |
| $25,000 to $29,999 | 739 (11.3%) | 721 (12.9%) |
| $30,000 to $34,999 | 488 (7.5%) | 447 (8.0%) |
| $35,000 to $39,999 | 353 (5.4%) | 269 (4.8%) |
| $40,000 to $44,999 | 288 (4.4%) | 351 (6.3%) |
| $45,000 to $49,999 | 479 (7.3%) | 307 (5.5%) |
| $50,000 to $54,999 | 204 (3.1%) | 227 (4.1%) |
| $55,000 to $64,999 | 448 (6.8%) | 227 (4.1%) |
| $65,000 to $74,999 | 253 (3.9%) | 37 (0.7%) |
| $75,000 to $99,999 | 615 (9.4%) | 240 (4.3%) |
| $100,000+ | 714 (10.9%) | 204 (3.7%) |
| Total | 6,545 (100.0%) | 5,580 (100.0%) |
Earnings by Sex by Educational Attainment in Randolph County
Average earnings in Randolph County are $41,971 for men and $28,953 for women, a difference of 31.0%. Men with an educational attainment of graduate degree enjoy the highest average annual earnings of $75,957, while those with college or associate's degree education earn the least with $29,935. Women with an educational attainment of bachelor's degree earn the most with the average annual earnings of $45,259, while those with less than high school education have the smallest earnings of $16,349.
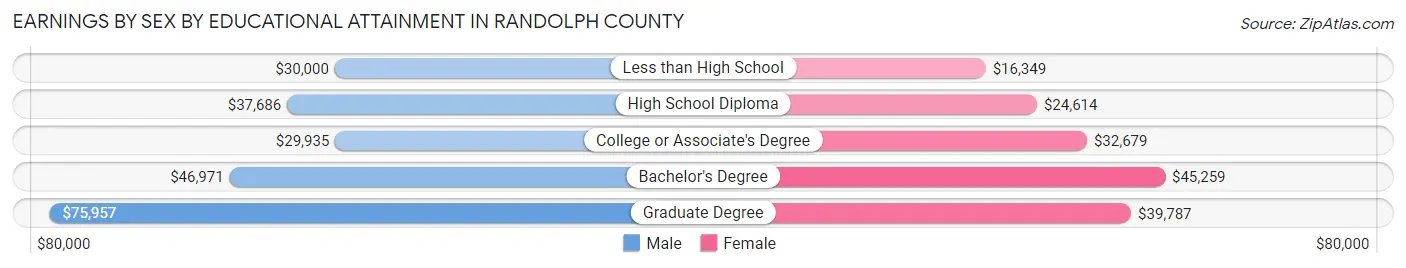
| Educational Attainment | Male Income | Female Income |
| Less than High School | $30,000 | $16,349 |
| High School Diploma | $37,686 | $24,614 |
| College or Associate's Degree | $29,935 | $32,679 |
| Bachelor's Degree | $46,971 | $45,259 |
| Graduate Degree | $75,957 | $39,787 |
| Total | $41,971 | $28,953 |
Family Income in Randolph County
Family Income Brackets in Randolph County
According to the Randolph County family income data, there are 1,221 families falling into the $50,000 to $74,999 income range, which is the most common income bracket and makes up 19.3% of all families. Conversely, the $10,000 to $14,999 income bracket is the least frequent group with only 184 families (2.9%) belonging to this category.
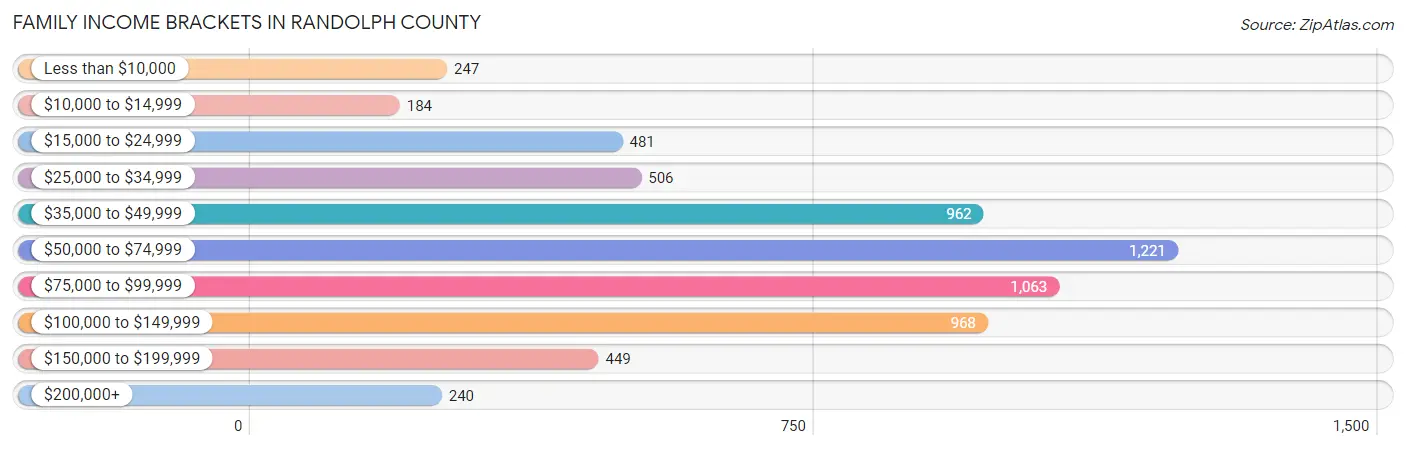
| Income Bracket | # Families | % Families |
| Less than $10,000 | 247 | 3.9% |
| $10,000 to $14,999 | 184 | 2.9% |
| $15,000 to $24,999 | 481 | 7.6% |
| $25,000 to $34,999 | 506 | 8.0% |
| $35,000 to $49,999 | 962 | 15.2% |
| $50,000 to $74,999 | 1,221 | 19.3% |
| $75,000 to $99,999 | 1,063 | 16.8% |
| $100,000 to $149,999 | 968 | 15.3% |
| $150,000 to $199,999 | 449 | 7.1% |
| $200,000+ | 240 | 3.8% |
Family Income by Famaliy Size in Randolph County
5-person families (377 | 6.0%) account for the highest median family income in Randolph County with $103,021 per family, while 2-person families (3,686 | 58.3%) have the highest median income of $27,792 per family member.
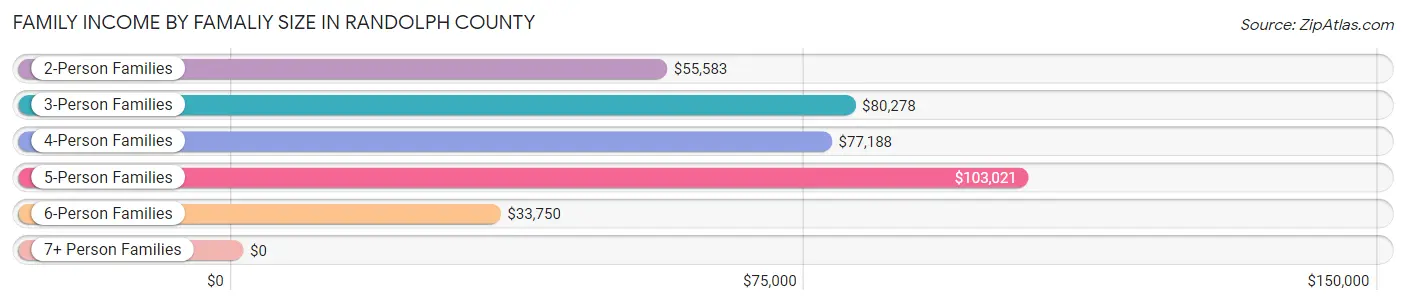
| Income Bracket | # Families | Median Income |
| 2-Person Families | 3,686 (58.3%) | $55,583 |
| 3-Person Families | 1,242 (19.6%) | $80,278 |
| 4-Person Families | 914 (14.4%) | $77,188 |
| 5-Person Families | 377 (6.0%) | $103,021 |
| 6-Person Families | 28 (0.4%) | $33,750 |
| 7+ Person Families | 81 (1.3%) | $0 |
| Total | 6,328 (100.0%) | $64,084 |
Family Income by Number of Earners in Randolph County
The median family income in Randolph County is $64,084, with families comprising 3+ earners (594) having the highest median family income of $109,706, while families with no earners (1,657) have the lowest median family income of $36,426, accounting for 9.4% and 26.2% of families, respectively.
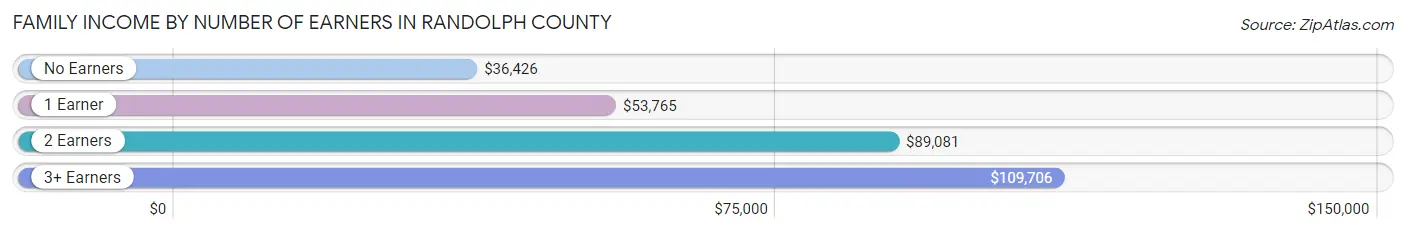
| Number of Earners | # Families | Median Income |
| No Earners | 1,657 (26.2%) | $36,426 |
| 1 Earner | 1,986 (31.4%) | $53,765 |
| 2 Earners | 2,091 (33.0%) | $89,081 |
| 3+ Earners | 594 (9.4%) | $109,706 |
| Total | 6,328 (100.0%) | $64,084 |
Household Income in Randolph County
Household Income Brackets in Randolph County
With 1,772 households falling in the category, the $50,000 to $74,999 income range is the most frequent in Randolph County, accounting for 17.1% of all households. In contrast, only 280 households (2.7%) fall into the $200,000+ income bracket, making it the least populous group.
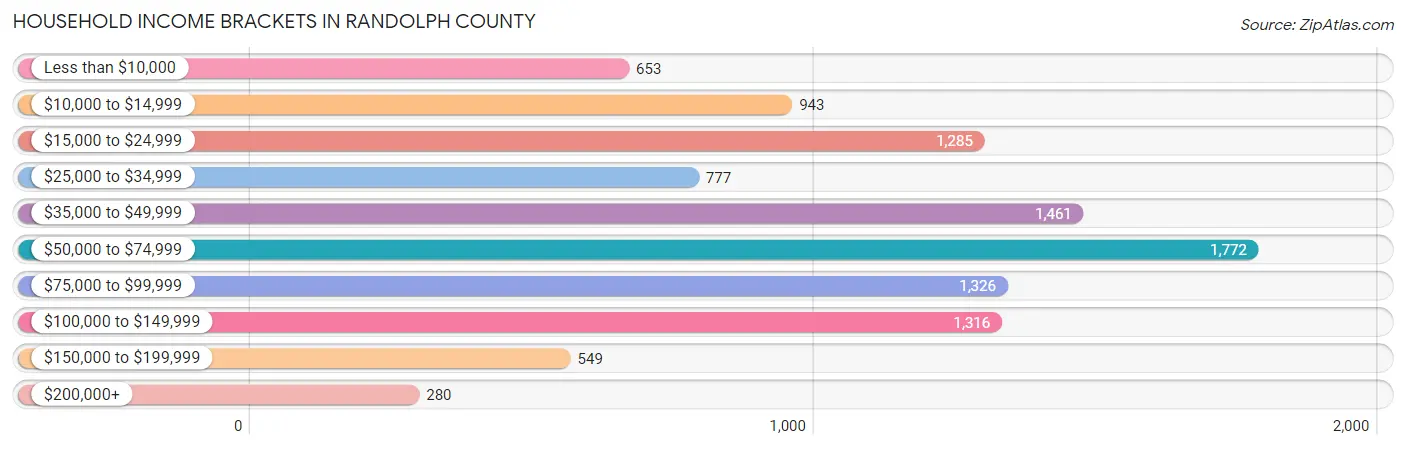
| Income Bracket | # Households | % Households |
| Less than $10,000 | 653 | 6.3% |
| $10,000 to $14,999 | 943 | 9.1% |
| $15,000 to $24,999 | 1,285 | 12.4% |
| $25,000 to $34,999 | 777 | 7.5% |
| $35,000 to $49,999 | 1,461 | 14.1% |
| $50,000 to $74,999 | 1,772 | 17.1% |
| $75,000 to $99,999 | 1,326 | 12.8% |
| $100,000 to $149,999 | 1,316 | 12.7% |
| $150,000 to $199,999 | 549 | 5.3% |
| $200,000+ | 280 | 2.7% |
Household Income by Householder Age in Randolph County
The median household income in Randolph County is $51,186, with the highest median household income of $64,360 found in the 45 to 64 years age bracket for the primary householder. A total of 3,725 households (35.9%) fall into this category. Meanwhile, the 65+ years age bracket for the primary householder has the lowest median household income of $38,228, with 3,938 households (38.0%) in this group.
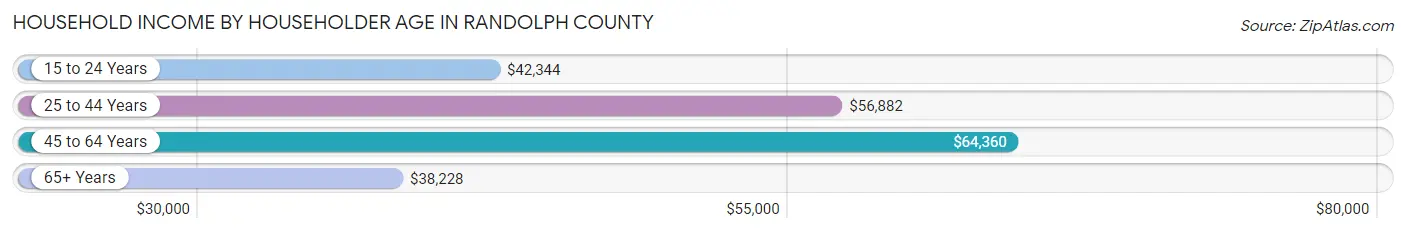
| Income Bracket | # Households | Median Income |
| 15 to 24 Years | 256 (2.5%) | $42,344 |
| 25 to 44 Years | 2,443 (23.6%) | $56,882 |
| 45 to 64 Years | 3,725 (35.9%) | $64,360 |
| 65+ Years | 3,938 (38.0%) | $38,228 |
| Total | 10,362 (100.0%) | $51,186 |
Poverty in Randolph County
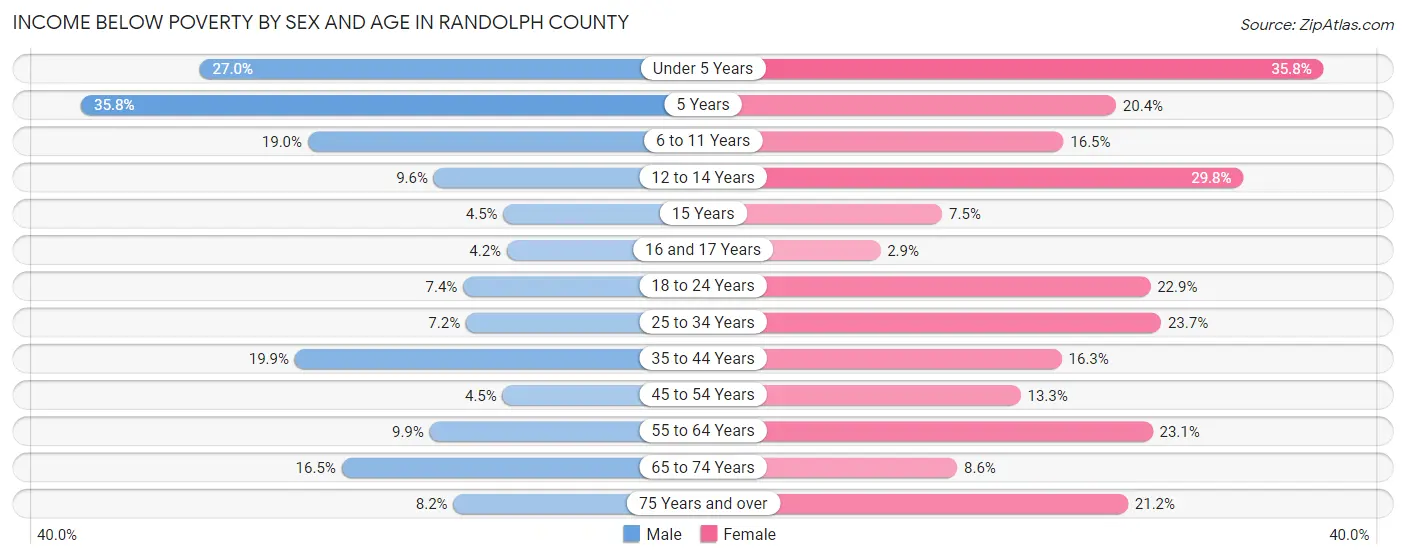
Income Below Poverty by Sex and Age in Randolph County
With 12.2% poverty level for males and 18.8% for females among the residents of Randolph County, 5 year old males and under 5 year old females are the most vulnerable to poverty, with 29 males (35.8%) and 241 females (35.8%) in their respective age groups living below the poverty level.
| Age Bracket | Male | Female |
| Under 5 Years | 189 (27.0%) | 241 (35.8%) |
| 5 Years | 29 (35.8%) | 23 (20.3%) |
| 6 to 11 Years | 169 (19.0%) | 124 (16.5%) |
| 12 to 14 Years | 38 (9.6%) | 141 (29.8%) |
| 15 Years | 11 (4.4%) | 7 (7.4%) |
| 16 and 17 Years | 9 (4.2%) | 10 (2.9%) |
| 18 to 24 Years | 76 (7.4%) | 194 (22.9%) |
| 25 to 34 Years | 99 (7.2%) | 319 (23.7%) |
| 35 to 44 Years | 314 (19.9%) | 220 (16.3%) |
| 45 to 54 Years | 72 (4.5%) | 212 (13.3%) |
| 55 to 64 Years | 189 (9.9%) | 443 (23.1%) |
| 65 to 74 Years | 276 (16.5%) | 155 (8.6%) |
| 75 Years and over | 89 (8.2%) | 294 (21.2%) |
| Total | 1,560 (12.2%) | 2,383 (18.8%) |
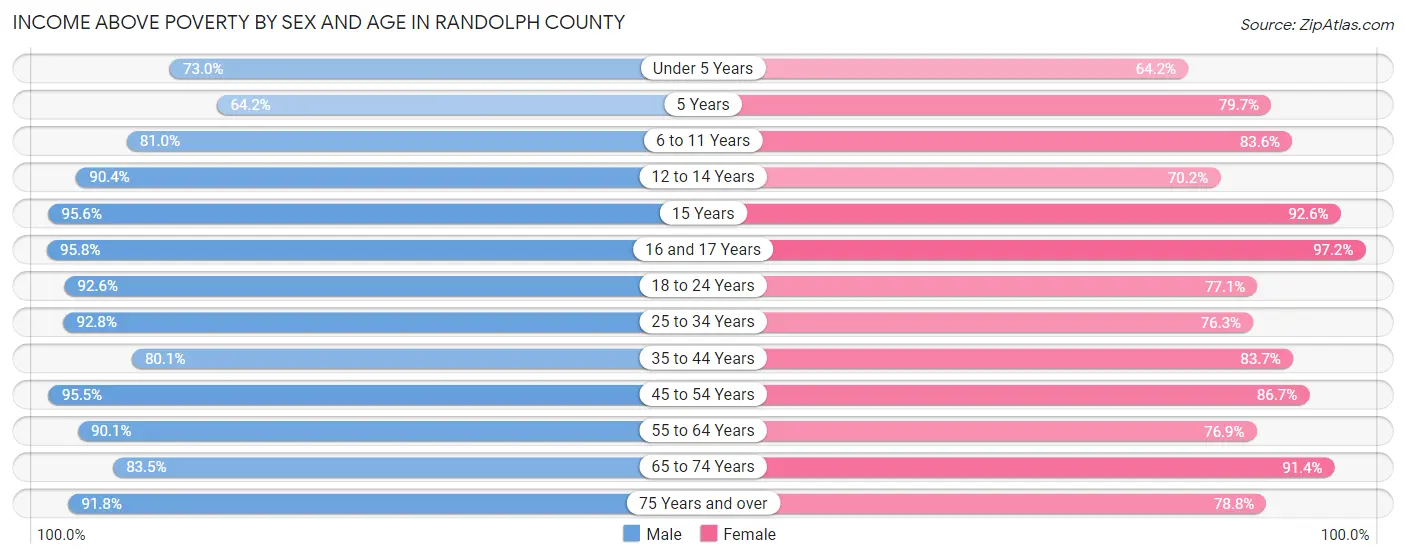
Income Above Poverty by Sex and Age in Randolph County
According to the poverty statistics in Randolph County, males aged 16 and 17 years and females aged 16 and 17 years are the age groups that are most secure financially, with 95.8% of males and 97.2% of females in these age groups living above the poverty line.
| Age Bracket | Male | Female |
| Under 5 Years | 511 (73.0%) | 433 (64.2%) |
| 5 Years | 52 (64.2%) | 90 (79.6%) |
| 6 to 11 Years | 722 (81.0%) | 630 (83.6%) |
| 12 to 14 Years | 357 (90.4%) | 332 (70.2%) |
| 15 Years | 236 (95.6%) | 87 (92.5%) |
| 16 and 17 Years | 206 (95.8%) | 341 (97.2%) |
| 18 to 24 Years | 945 (92.6%) | 653 (77.1%) |
| 25 to 34 Years | 1,271 (92.8%) | 1,027 (76.3%) |
| 35 to 44 Years | 1,261 (80.1%) | 1,128 (83.7%) |
| 45 to 54 Years | 1,524 (95.5%) | 1,386 (86.7%) |
| 55 to 64 Years | 1,715 (90.1%) | 1,477 (76.9%) |
| 65 to 74 Years | 1,401 (83.5%) | 1,655 (91.4%) |
| 75 Years and over | 1,002 (91.8%) | 1,090 (78.8%) |
| Total | 11,203 (87.8%) | 10,329 (81.2%) |
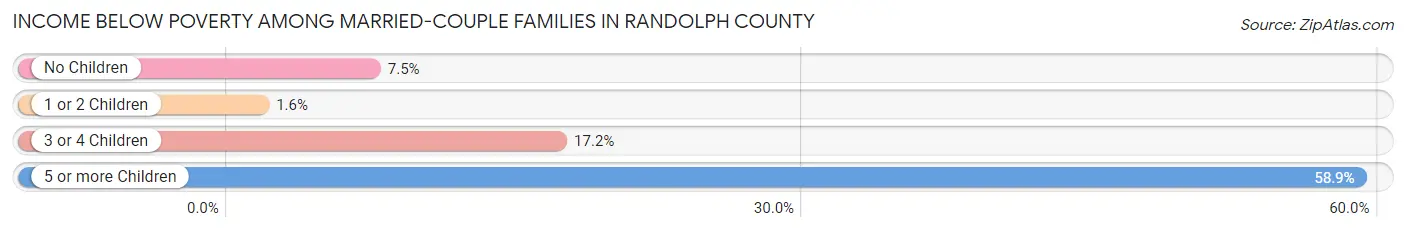
Income Below Poverty Among Married-Couple Families in Randolph County
The poverty statistics for married-couple families in Randolph County show that 6.9% or 322 of the total 4,690 families live below the poverty line. Families with 5 or more children have the highest poverty rate of 58.9%, comprising of 33 families. On the other hand, families with 1 or 2 children have the lowest poverty rate of 1.6%, which includes 21 families.
| Children | Above Poverty | Below Poverty |
| No Children | 2,917 (92.5%) | 235 (7.5%) |
| 1 or 2 Children | 1,269 (98.4%) | 21 (1.6%) |
| 3 or 4 Children | 159 (82.8%) | 33 (17.2%) |
| 5 or more Children | 23 (41.1%) | 33 (58.9%) |
| Total | 4,368 (93.1%) | 322 (6.9%) |
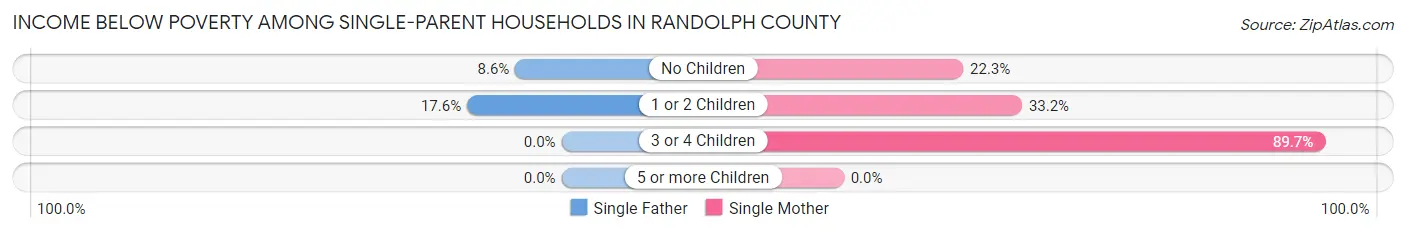
Income Below Poverty Among Single-Parent Households in Randolph County
According to the poverty data in Randolph County, 12.4% or 69 single-father households and 33.0% or 356 single-mother households are living below the poverty line. Among single-father households, those with 1 or 2 children have the highest poverty rate, with 41 households (17.6%) experiencing poverty. Likewise, among single-mother households, those with 3 or 4 children have the highest poverty rate, with 78 households (89.7%) falling below the poverty line.
| Children | Single Father | Single Mother |
| No Children | 28 (8.6%) | 105 (22.3%) |
| 1 or 2 Children | 41 (17.6%) | 173 (33.2%) |
| 3 or 4 Children | 0 (0.0%) | 78 (89.7%) |
| 5 or more Children | 0 (0.0%) | 0 (0.0%) |
| Total | 69 (12.4%) | 356 (33.0%) |
Income Below Poverty Among Married-Couple vs Single-Parent Households in Randolph County
The poverty data for Randolph County shows that 322 of the married-couple family households (6.9%) and 425 of the single-parent households (26.0%) are living below the poverty level. Within the married-couple family households, those with 5 or more children have the highest poverty rate, with 33 households (58.9%) falling below the poverty line. Among the single-parent households, those with 3 or 4 children have the highest poverty rate, with 78 household (89.7%) living below poverty.
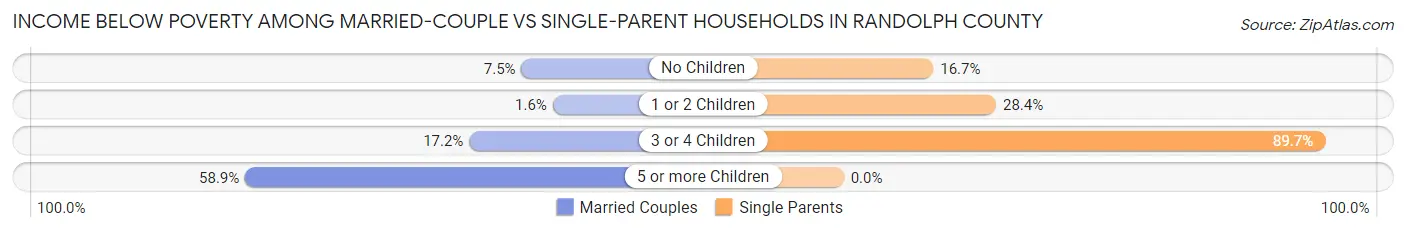
| Children | Married-Couple Families | Single-Parent Households |
| No Children | 235 (7.5%) | 133 (16.7%) |
| 1 or 2 Children | 21 (1.6%) | 214 (28.4%) |
| 3 or 4 Children | 33 (17.2%) | 78 (89.7%) |
| 5 or more Children | 33 (58.9%) | 0 (0.0%) |
| Total | 322 (6.9%) | 425 (26.0%) |
Employment Characteristics in Randolph County
Employment by Class of Employer in Randolph County
Among the 10,436 employed individuals in Randolph County, private company employees (6,879 | 65.9%), not-for-profit organizations (1,034 | 9.9%), and state government employees (835 | 8.0%) make up the most common classes of employment.
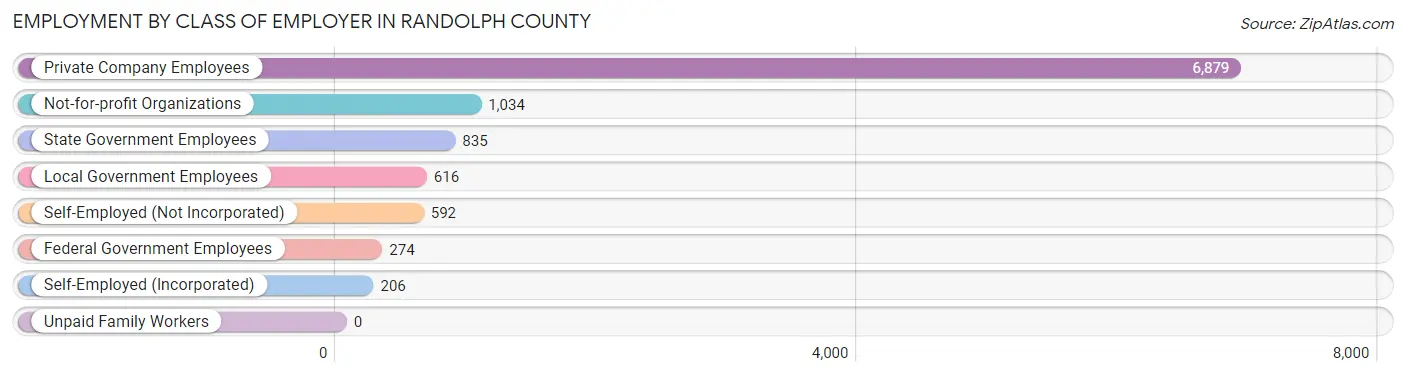
| Employer Class | # Employees | % Employees |
| Private Company Employees | 6,879 | 65.9% |
| Self-Employed (Incorporated) | 206 | 2.0% |
| Self-Employed (Not Incorporated) | 592 | 5.7% |
| Not-for-profit Organizations | 1,034 | 9.9% |
| Local Government Employees | 616 | 5.9% |
| State Government Employees | 835 | 8.0% |
| Federal Government Employees | 274 | 2.6% |
| Unpaid Family Workers | 0 | 0.0% |
| Total | 10,436 | 100.0% |
Employment Status by Age in Randolph County
According to the labor force statistics for Randolph County, out of the total population over 16 years of age (23,459), 49.0% or 11,495 individuals are in the labor force, with 7.3% or 839 of them unemployed. The age group with the highest labor force participation rate is 20 to 24 years, with 73.3% or 1,205 individuals in the labor force. Within the labor force, the 20 to 24 years age range has the highest percentage of unemployed individuals, with 15.3% or 184 of them being unemployed.
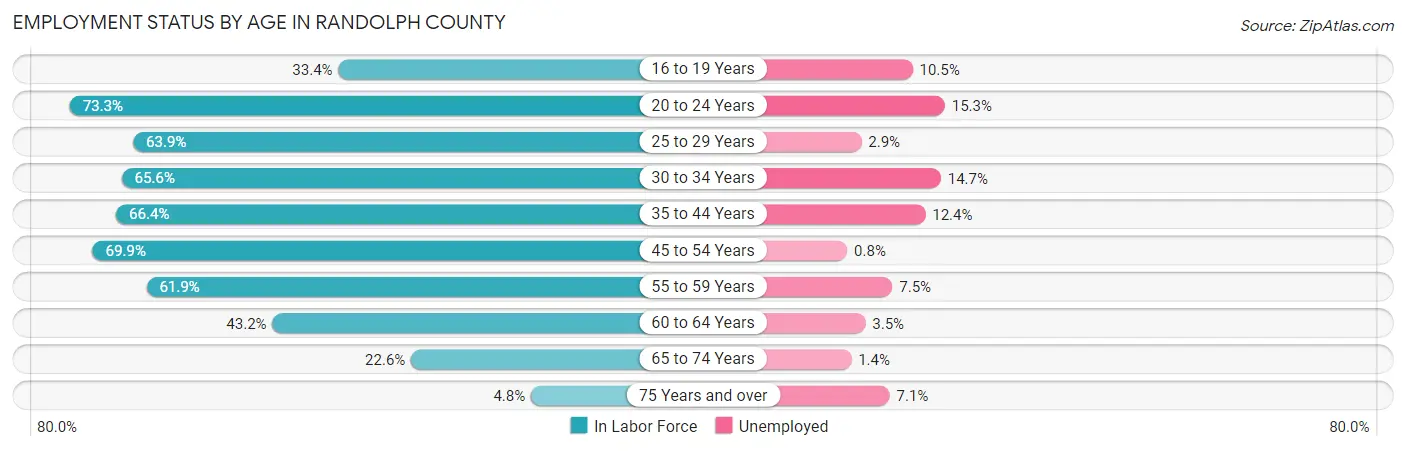
| Age Bracket | In Labor Force | Unemployed |
| 16 to 19 Years | 428 (33.4%) | 45 (10.5%) |
| 20 to 24 Years | 1,205 (73.3%) | 184 (15.3%) |
| 25 to 29 Years | 1,123 (63.9%) | 33 (2.9%) |
| 30 to 34 Years | 1,097 (65.6%) | 161 (14.7%) |
| 35 to 44 Years | 2,159 (66.4%) | 268 (12.4%) |
| 45 to 54 Years | 2,503 (69.9%) | 20 (0.8%) |
| 55 to 59 Years | 1,015 (61.9%) | 76 (7.5%) |
| 60 to 64 Years | 1,016 (43.2%) | 36 (3.5%) |
| 65 to 74 Years | 815 (22.6%) | 11 (1.4%) |
| 75 Years and over | 128 (4.8%) | 9 (7.1%) |
| Total | 11,495 (49.0%) | 839 (7.3%) |
Employment Status by Educational Attainment in Randolph County
According to labor force statistics for Randolph County, 62.5% of individuals (8,908) out of the total population between 25 and 64 years of age (14,253) are in the labor force, with 6.6% or 588 of them being unemployed. The group with the highest labor force participation rate are those with the educational attainment of bachelor's degree or higher, with 89.0% or 2,427 individuals in the labor force. Within the labor force, individuals with less than high school education have the highest percentage of unemployment, with 25.5% or 126 of them being unemployed.
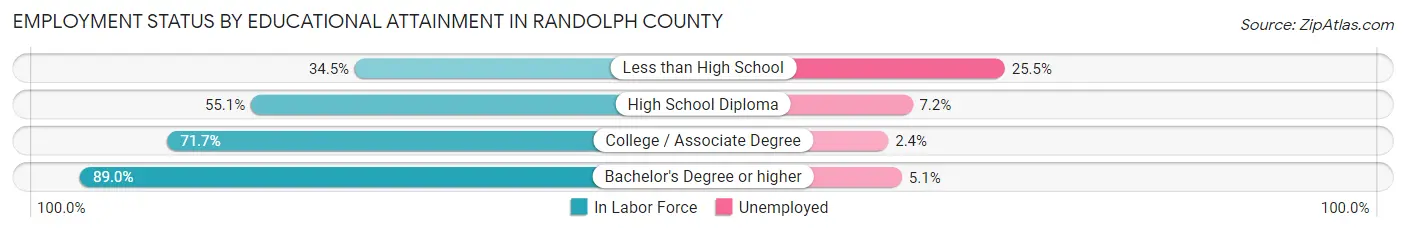
| Educational Attainment | In Labor Force | Unemployed |
| Less than High School | 494 (34.5%) | 365 (25.5%) |
| High School Diploma | 4,134 (55.1%) | 540 (7.2%) |
| College / Associate Degree | 1,858 (71.7%) | 62 (2.4%) |
| Bachelor's Degree or higher | 2,427 (89.0%) | 139 (5.1%) |
| Total | 8,908 (62.5%) | 941 (6.6%) |
Employment Occupations by Sex in Randolph County
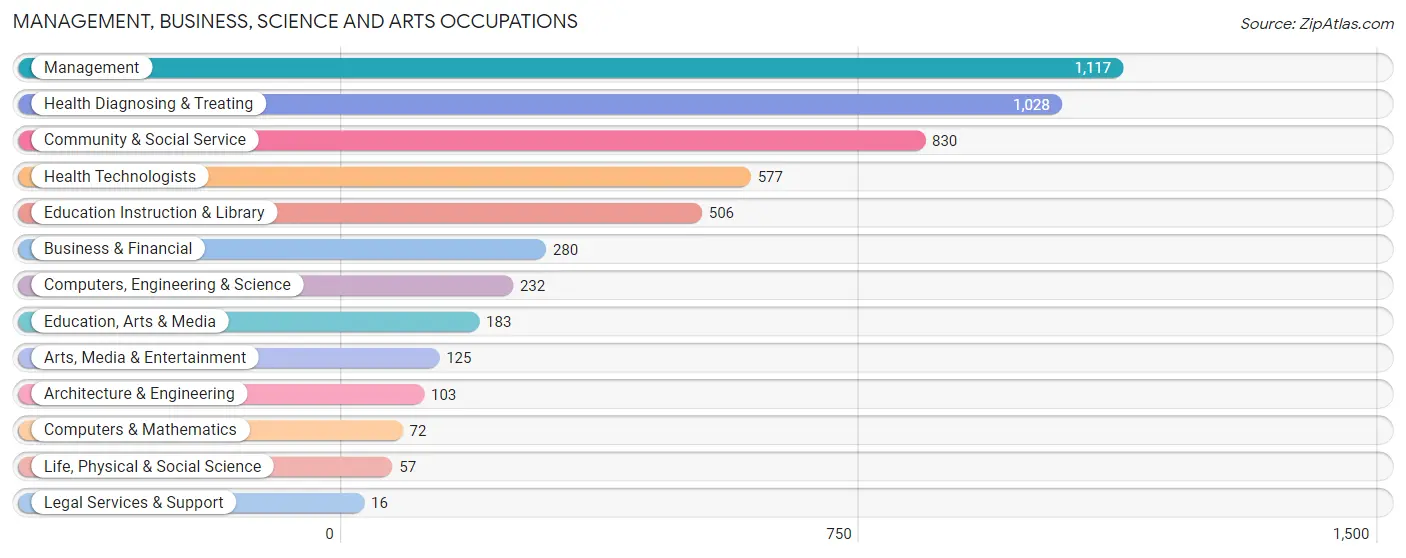
Management, Business, Science and Arts Occupations
The most common Management, Business, Science and Arts occupations in Randolph County are Management (1,117 | 10.5%), Health Diagnosing & Treating (1,028 | 9.7%), Community & Social Service (830 | 7.8%), Health Technologists (577 | 5.4%), and Education Instruction & Library (506 | 4.8%).
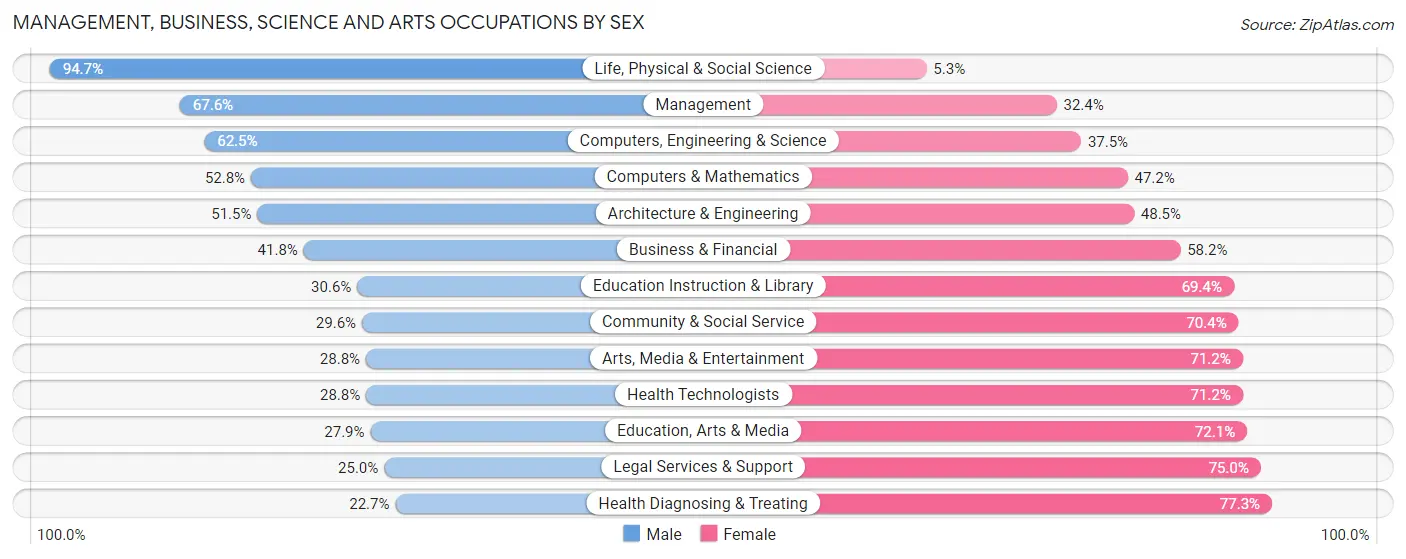
Management, Business, Science and Arts Occupations by Sex
Within the Management, Business, Science and Arts occupations in Randolph County, the most male-oriented occupations are Life, Physical & Social Science (94.7%), Management (67.6%), and Computers, Engineering & Science (62.5%), while the most female-oriented occupations are Health Diagnosing & Treating (77.3%), Legal Services & Support (75.0%), and Education, Arts & Media (72.1%).
| Occupation | Male | Female |
| Management | 755 (67.6%) | 362 (32.4%) |
| Business & Financial | 117 (41.8%) | 163 (58.2%) |
| Computers, Engineering & Science | 145 (62.5%) | 87 (37.5%) |
| Computers & Mathematics | 38 (52.8%) | 34 (47.2%) |
| Architecture & Engineering | 53 (51.5%) | 50 (48.5%) |
| Life, Physical & Social Science | 54 (94.7%) | 3 (5.3%) |
| Community & Social Service | 246 (29.6%) | 584 (70.4%) |
| Education, Arts & Media | 51 (27.9%) | 132 (72.1%) |
| Legal Services & Support | 4 (25.0%) | 12 (75.0%) |
| Education Instruction & Library | 155 (30.6%) | 351 (69.4%) |
| Arts, Media & Entertainment | 36 (28.8%) | 89 (71.2%) |
| Health Diagnosing & Treating | 233 (22.7%) | 795 (77.3%) |
| Health Technologists | 166 (28.8%) | 411 (71.2%) |
| Total (Category) | 1,496 (42.9%) | 1,991 (57.1%) |
| Total (Overall) | 5,729 (53.9%) | 4,892 (46.1%) |
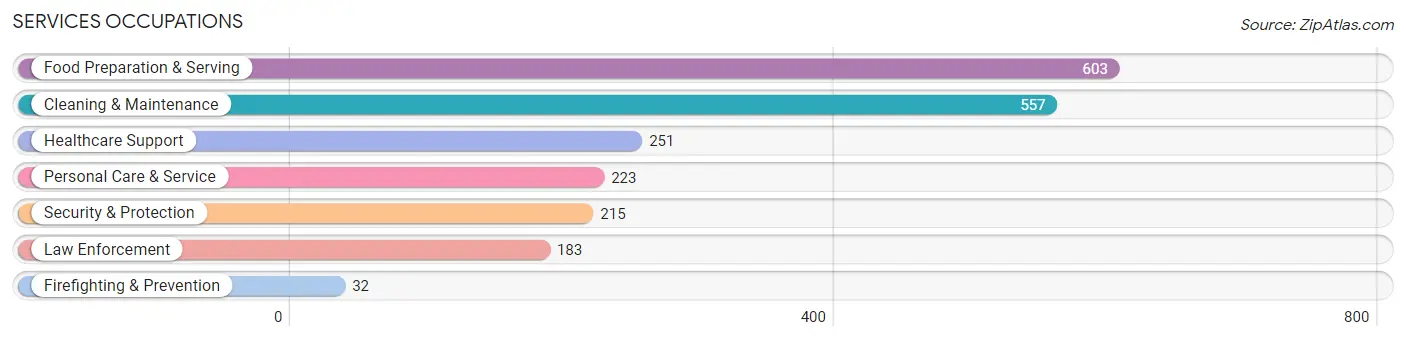
Services Occupations
The most common Services occupations in Randolph County are Food Preparation & Serving (603 | 5.7%), Cleaning & Maintenance (557 | 5.2%), Healthcare Support (251 | 2.4%), Personal Care & Service (223 | 2.1%), and Security & Protection (215 | 2.0%).
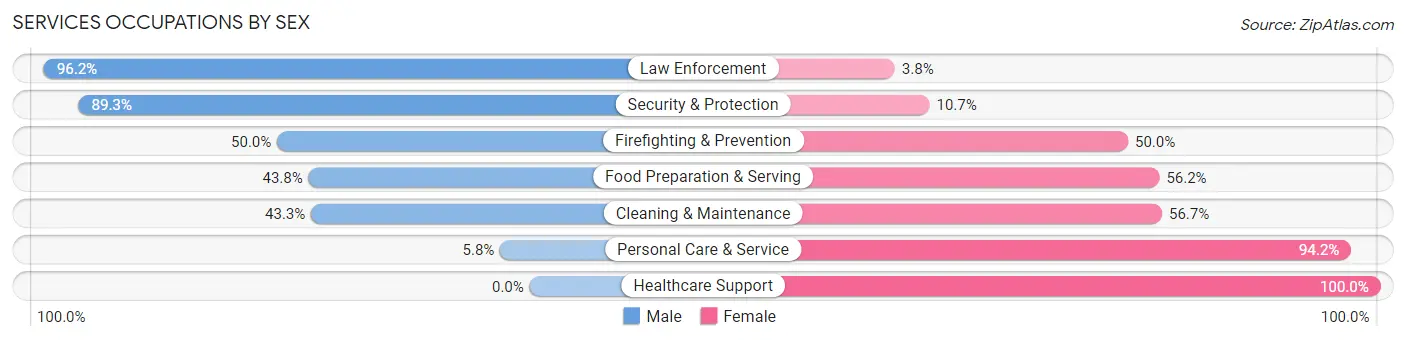
Services Occupations by Sex
Within the Services occupations in Randolph County, the most male-oriented occupations are Law Enforcement (96.2%), Security & Protection (89.3%), and Firefighting & Prevention (50.0%), while the most female-oriented occupations are Healthcare Support (100.0%), Personal Care & Service (94.2%), and Cleaning & Maintenance (56.7%).
| Occupation | Male | Female |
| Healthcare Support | 0 (0.0%) | 251 (100.0%) |
| Security & Protection | 192 (89.3%) | 23 (10.7%) |
| Firefighting & Prevention | 16 (50.0%) | 16 (50.0%) |
| Law Enforcement | 176 (96.2%) | 7 (3.8%) |
| Food Preparation & Serving | 264 (43.8%) | 339 (56.2%) |
| Cleaning & Maintenance | 241 (43.3%) | 316 (56.7%) |
| Personal Care & Service | 13 (5.8%) | 210 (94.2%) |
| Total (Category) | 710 (38.4%) | 1,139 (61.6%) |
| Total (Overall) | 5,729 (53.9%) | 4,892 (46.1%) |
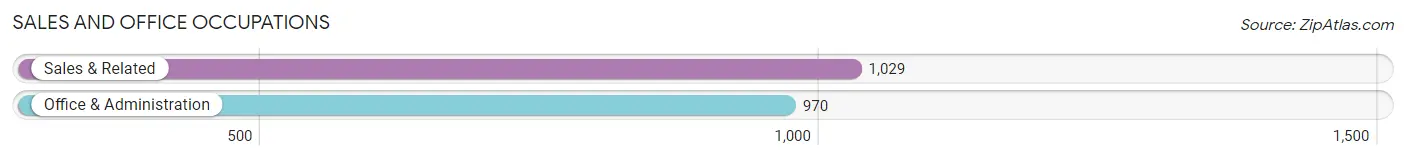
Sales and Office Occupations
The most common Sales and Office occupations in Randolph County are Sales & Related (1,029 | 9.7%), and Office & Administration (970 | 9.1%).
Sales and Office Occupations by Sex
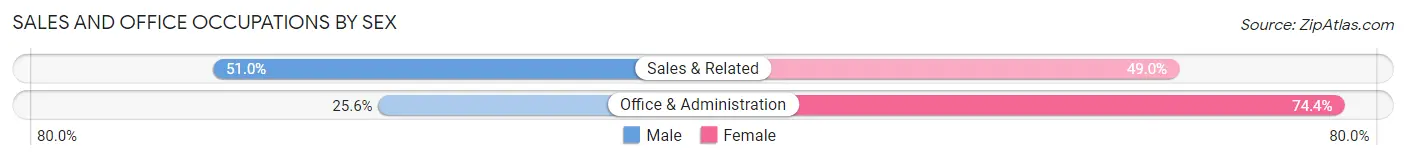
| Occupation | Male | Female |
| Sales & Related | 525 (51.0%) | 504 (49.0%) |
| Office & Administration | 248 (25.6%) | 722 (74.4%) |
| Total (Category) | 773 (38.7%) | 1,226 (61.3%) |
| Total (Overall) | 5,729 (53.9%) | 4,892 (46.1%) |
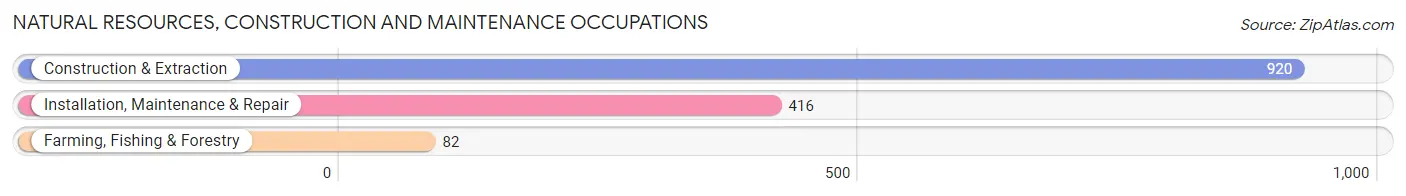
Natural Resources, Construction and Maintenance Occupations
The most common Natural Resources, Construction and Maintenance occupations in Randolph County are Construction & Extraction (920 | 8.7%), Installation, Maintenance & Repair (416 | 3.9%), and Farming, Fishing & Forestry (82 | 0.8%).
Natural Resources, Construction and Maintenance Occupations by Sex
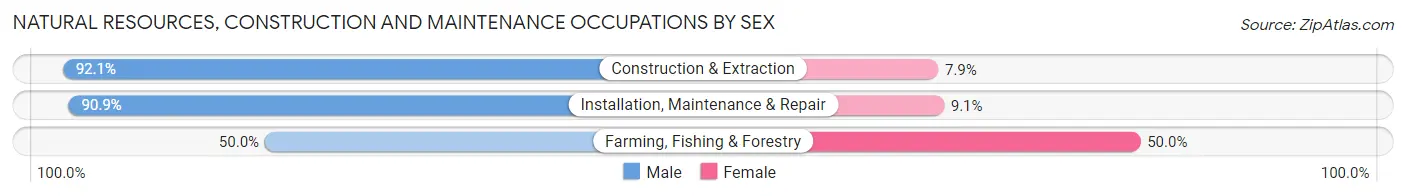
| Occupation | Male | Female |
| Farming, Fishing & Forestry | 41 (50.0%) | 41 (50.0%) |
| Construction & Extraction | 847 (92.1%) | 73 (7.9%) |
| Installation, Maintenance & Repair | 378 (90.9%) | 38 (9.1%) |
| Total (Category) | 1,266 (89.3%) | 152 (10.7%) |
| Total (Overall) | 5,729 (53.9%) | 4,892 (46.1%) |
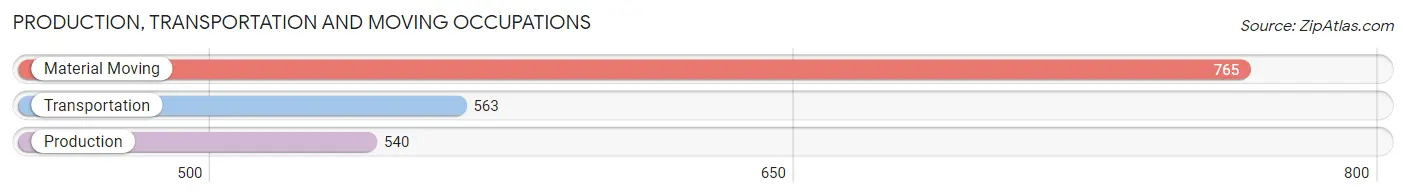
Production, Transportation and Moving Occupations
The most common Production, Transportation and Moving occupations in Randolph County are Material Moving (765 | 7.2%), Transportation (563 | 5.3%), and Production (540 | 5.1%).
Production, Transportation and Moving Occupations by Sex
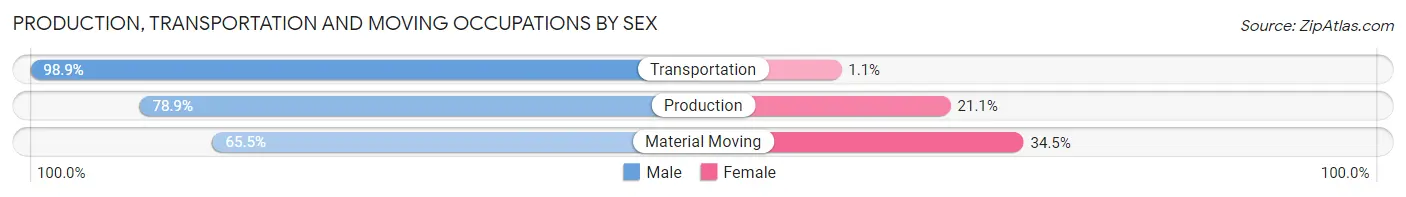
| Occupation | Male | Female |
| Production | 426 (78.9%) | 114 (21.1%) |
| Transportation | 557 (98.9%) | 6 (1.1%) |
| Material Moving | 501 (65.5%) | 264 (34.5%) |
| Total (Category) | 1,484 (79.4%) | 384 (20.6%) |
| Total (Overall) | 5,729 (53.9%) | 4,892 (46.1%) |
Employment Industries by Sex in Randolph County
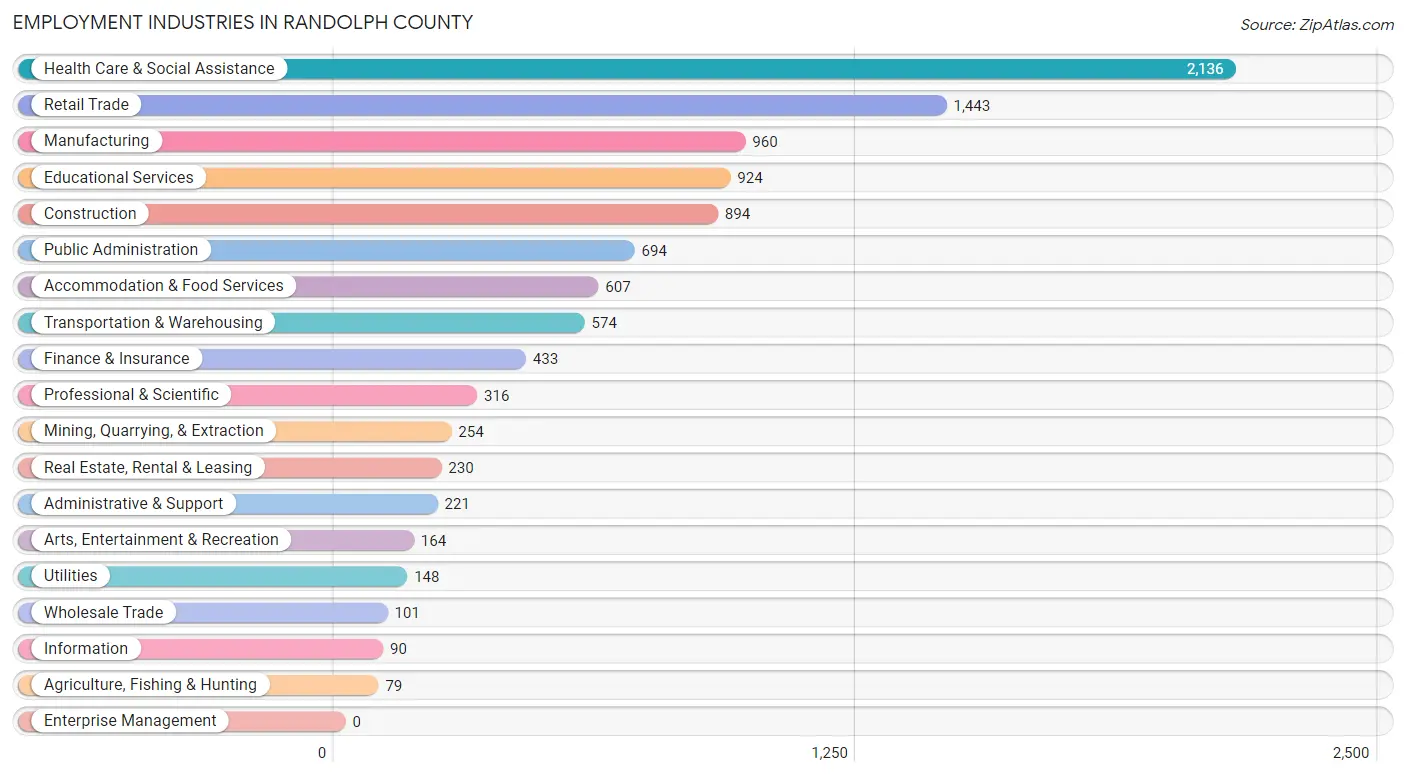
Employment Industries in Randolph County
The major employment industries in Randolph County include Health Care & Social Assistance (2,136 | 20.1%), Retail Trade (1,443 | 13.6%), Manufacturing (960 | 9.0%), Educational Services (924 | 8.7%), and Construction (894 | 8.4%).
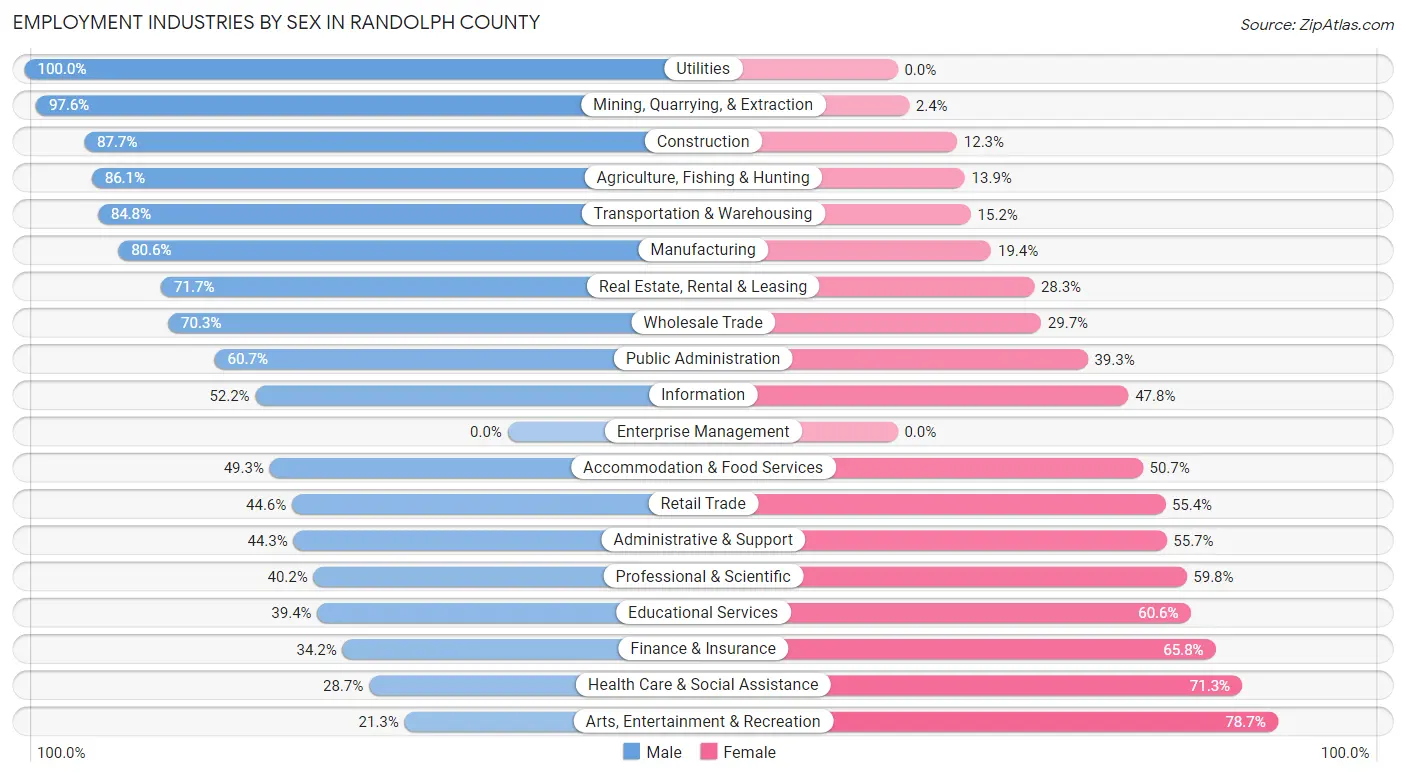
Employment Industries by Sex in Randolph County
The Randolph County industries that see more men than women are Utilities (100.0%), Mining, Quarrying, & Extraction (97.6%), and Construction (87.7%), whereas the industries that tend to have a higher number of women are Arts, Entertainment & Recreation (78.7%), Health Care & Social Assistance (71.3%), and Finance & Insurance (65.8%).
| Industry | Male | Female |
| Agriculture, Fishing & Hunting | 68 (86.1%) | 11 (13.9%) |
| Mining, Quarrying, & Extraction | 248 (97.6%) | 6 (2.4%) |
| Construction | 784 (87.7%) | 110 (12.3%) |
| Manufacturing | 774 (80.6%) | 186 (19.4%) |
| Wholesale Trade | 71 (70.3%) | 30 (29.7%) |
| Retail Trade | 644 (44.6%) | 799 (55.4%) |
| Transportation & Warehousing | 487 (84.8%) | 87 (15.2%) |
| Utilities | 148 (100.0%) | 0 (0.0%) |
| Information | 47 (52.2%) | 43 (47.8%) |
| Finance & Insurance | 148 (34.2%) | 285 (65.8%) |
| Real Estate, Rental & Leasing | 165 (71.7%) | 65 (28.3%) |
| Professional & Scientific | 127 (40.2%) | 189 (59.8%) |
| Enterprise Management | 0 (0.0%) | 0 (0.0%) |
| Administrative & Support | 98 (44.3%) | 123 (55.7%) |
| Educational Services | 364 (39.4%) | 560 (60.6%) |
| Health Care & Social Assistance | 613 (28.7%) | 1,523 (71.3%) |
| Arts, Entertainment & Recreation | 35 (21.3%) | 129 (78.7%) |
| Accommodation & Food Services | 299 (49.3%) | 308 (50.7%) |
| Public Administration | 421 (60.7%) | 273 (39.3%) |
| Total | 5,729 (53.9%) | 4,892 (46.1%) |
Education in Randolph County
School Enrollment in Randolph County
The most common levels of schooling among the 4,860 students in Randolph County are high school (1,189 | 24.5%), middle school (1,180 | 24.3%), and elementary school (1,103 | 22.7%).
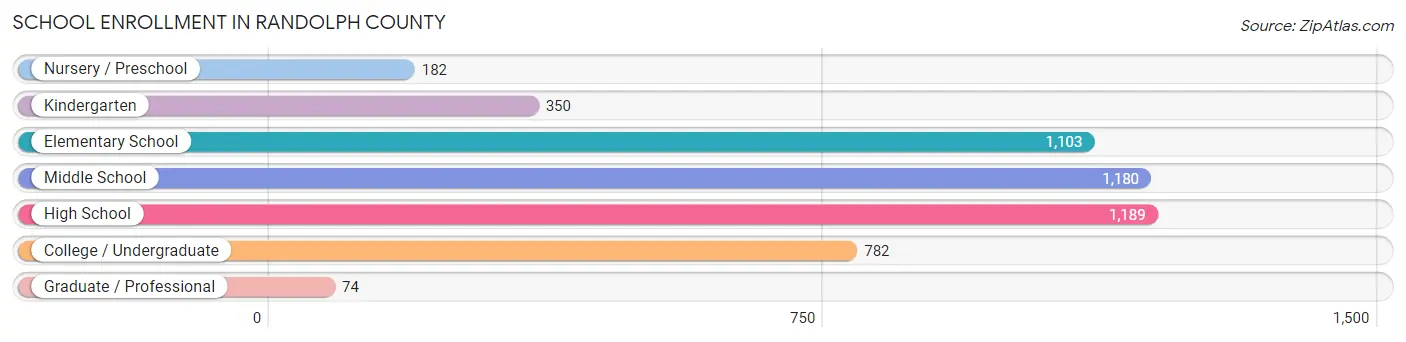
| School Level | # Students | % Students |
| Nursery / Preschool | 182 | 3.7% |
| Kindergarten | 350 | 7.2% |
| Elementary School | 1,103 | 22.7% |
| Middle School | 1,180 | 24.3% |
| High School | 1,189 | 24.5% |
| College / Undergraduate | 782 | 16.1% |
| Graduate / Professional | 74 | 1.5% |
| Total | 4,860 | 100.0% |
School Enrollment by Age by Funding Source in Randolph County
Out of a total of 4,860 students who are enrolled in schools in Randolph County, 724 (14.9%) attend a private institution, while the remaining 4,136 (85.1%) are enrolled in public schools. The age group of 25 to 34 year olds has the highest likelihood of being enrolled in private schools, with 63 (57.8% in the age bracket) enrolled. Conversely, the age group of 15 to 17 year olds has the lowest likelihood of being enrolled in a private school, with 808 (93.0% in the age bracket) attending a public institution.
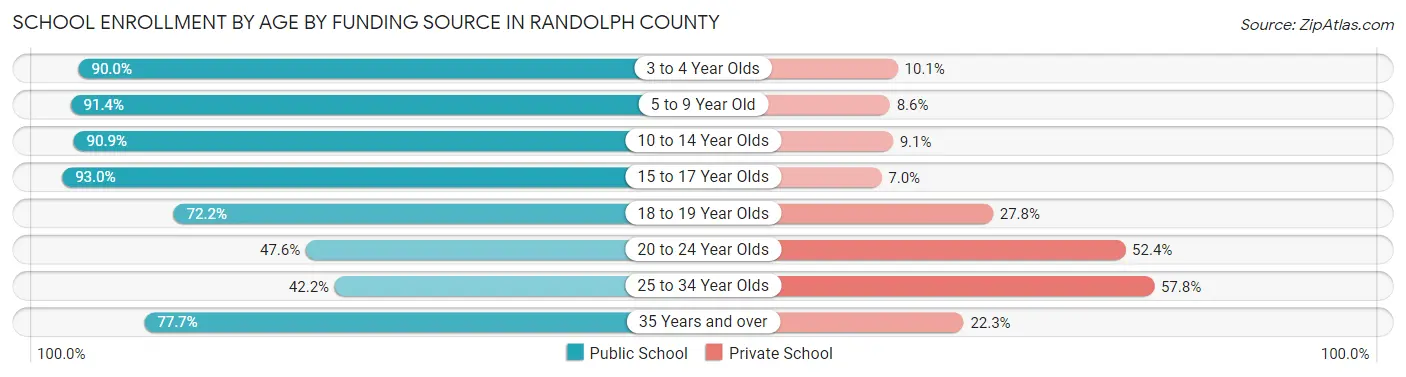
| Age Bracket | Public School | Private School |
| 3 to 4 Year Olds | 170 (89.9%) | 19 (10.1%) |
| 5 to 9 Year Old | 1,215 (91.4%) | 114 (8.6%) |
| 10 to 14 Year Olds | 1,273 (90.9%) | 128 (9.1%) |
| 15 to 17 Year Olds | 808 (93.0%) | 61 (7.0%) |
| 18 to 19 Year Olds | 385 (72.2%) | 148 (27.8%) |
| 20 to 24 Year Olds | 147 (47.6%) | 162 (52.4%) |
| 25 to 34 Year Olds | 46 (42.2%) | 63 (57.8%) |
| 35 Years and over | 94 (77.7%) | 27 (22.3%) |
| Total | 4,136 (85.1%) | 724 (14.9%) |
Educational Attainment by Field of Study in Randolph County
Business (862 | 22.4%), science & technology (587 | 15.2%), education (520 | 13.5%), psychology (288 | 7.5%), and arts & humanities (265 | 6.9%) are the most common fields of study among 3,857 individuals in Randolph County who have obtained a bachelor's degree or higher.
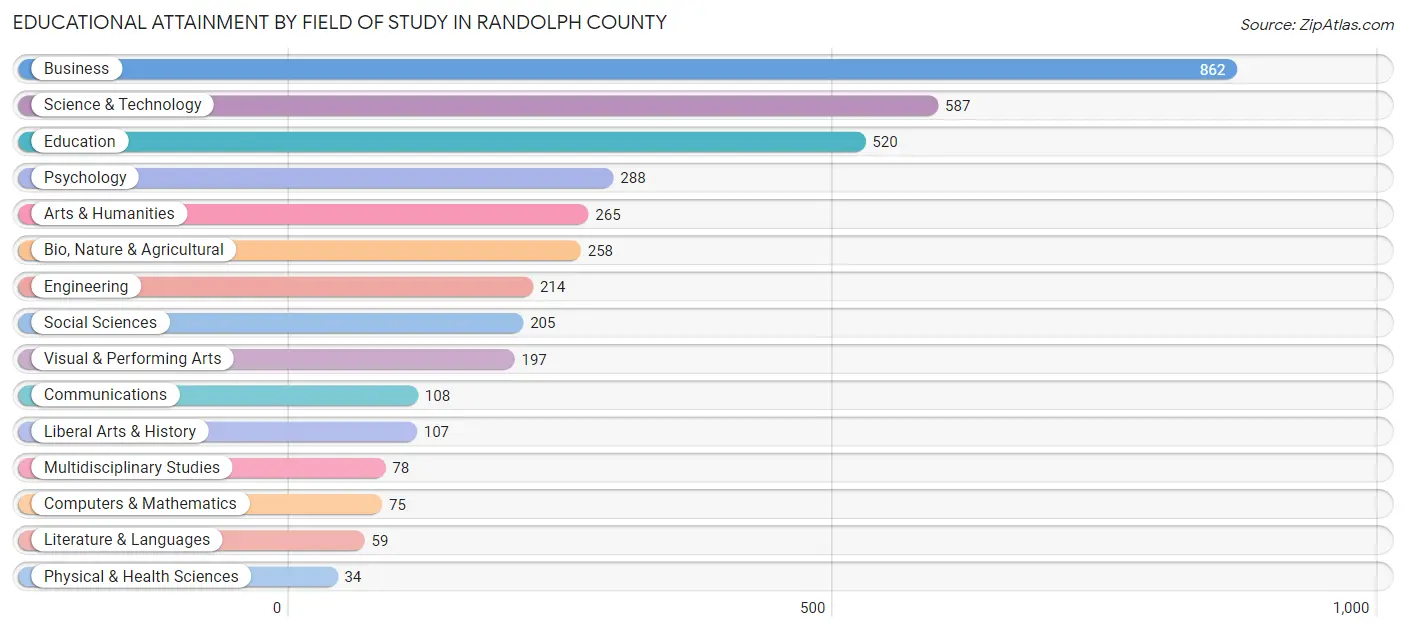
| Field of Study | # Graduates | % Graduates |
| Computers & Mathematics | 75 | 1.9% |
| Bio, Nature & Agricultural | 258 | 6.7% |
| Physical & Health Sciences | 34 | 0.9% |
| Psychology | 288 | 7.5% |
| Social Sciences | 205 | 5.3% |
| Engineering | 214 | 5.6% |
| Multidisciplinary Studies | 78 | 2.0% |
| Science & Technology | 587 | 15.2% |
| Business | 862 | 22.4% |
| Education | 520 | 13.5% |
| Literature & Languages | 59 | 1.5% |
| Liberal Arts & History | 107 | 2.8% |
| Visual & Performing Arts | 197 | 5.1% |
| Communications | 108 | 2.8% |
| Arts & Humanities | 265 | 6.9% |
| Total | 3,857 | 100.0% |
Transportation & Commute in Randolph County
Vehicle Availability by Sex in Randolph County
The most prevalent vehicle ownership categories in Randolph County are males with 2 vehicles (2,695, accounting for 47.7%) and females with 2 vehicles (2,478, making up 57.2%).
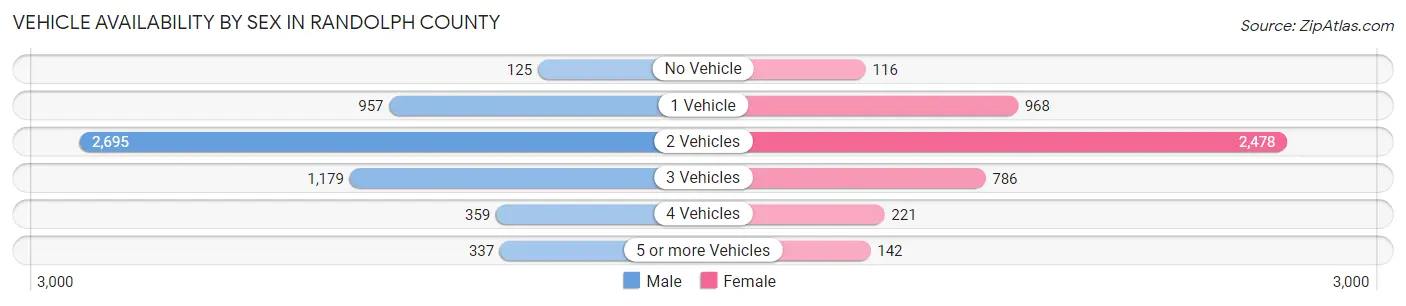
| Vehicles Available | Male | Female |
| No Vehicle | 125 (2.2%) | 116 (2.5%) |
| 1 Vehicle | 957 (16.9%) | 968 (20.5%) |
| 2 Vehicles | 2,695 (47.7%) | 2,478 (52.6%) |
| 3 Vehicles | 1,179 (20.9%) | 786 (16.7%) |
| 4 Vehicles | 359 (6.4%) | 221 (4.7%) |
| 5 or more Vehicles | 337 (6.0%) | 142 (3.0%) |
| Total | 5,652 (100.0%) | 4,711 (100.0%) |
Commute Time in Randolph County
The most frequently occuring commute durations in Randolph County are 5 to 9 minutes (2,373 commuters, 23.8%), 15 to 19 minutes (1,690 commuters, 17.0%), and 10 to 14 minutes (1,464 commuters, 14.7%).

| Commute Time | # Commuters | % Commuters |
| Less than 5 Minutes | 583 | 5.9% |
| 5 to 9 Minutes | 2,373 | 23.8% |
| 10 to 14 Minutes | 1,464 | 14.7% |
| 15 to 19 Minutes | 1,690 | 17.0% |
| 20 to 24 Minutes | 1,144 | 11.5% |
| 25 to 29 Minutes | 442 | 4.4% |
| 30 to 34 Minutes | 649 | 6.5% |
| 35 to 39 Minutes | 231 | 2.3% |
| 40 to 44 Minutes | 123 | 1.2% |
| 45 to 59 Minutes | 438 | 4.4% |
| 60 to 89 Minutes | 463 | 4.6% |
| 90 or more Minutes | 349 | 3.5% |
Commute Time by Sex in Randolph County
The most common commute times in Randolph County are 5 to 9 minutes (1,175 commuters, 21.7%) for males and 5 to 9 minutes (1,198 commuters, 26.5%) for females.
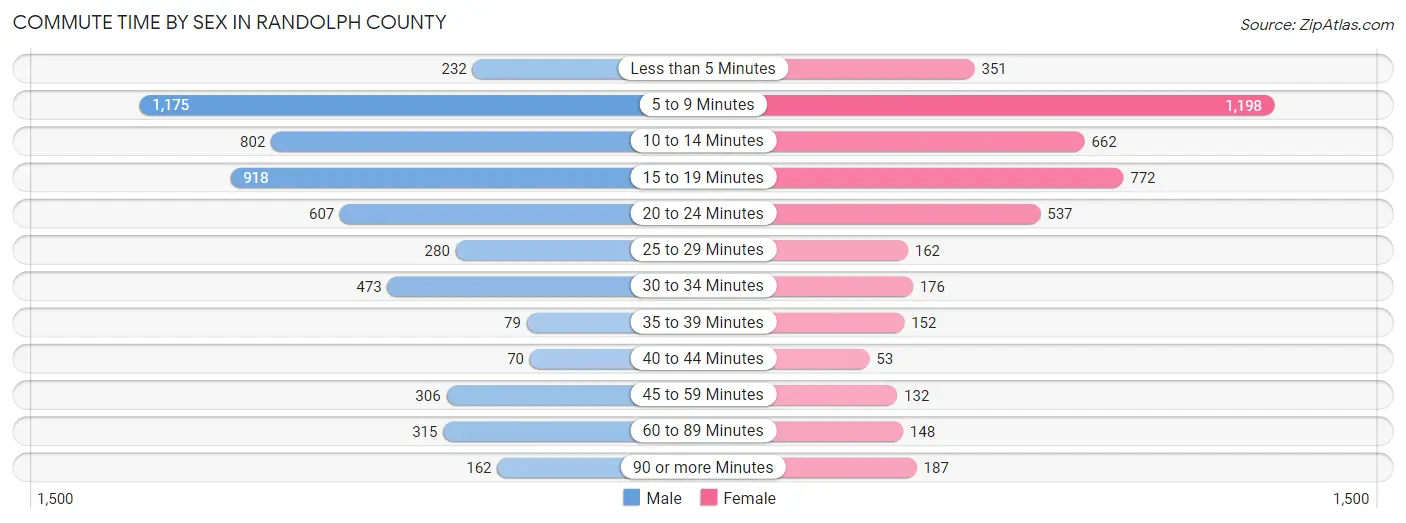
| Commute Time | Male | Female |
| Less than 5 Minutes | 232 (4.3%) | 351 (7.7%) |
| 5 to 9 Minutes | 1,175 (21.7%) | 1,198 (26.5%) |
| 10 to 14 Minutes | 802 (14.8%) | 662 (14.6%) |
| 15 to 19 Minutes | 918 (16.9%) | 772 (17.0%) |
| 20 to 24 Minutes | 607 (11.2%) | 537 (11.8%) |
| 25 to 29 Minutes | 280 (5.2%) | 162 (3.6%) |
| 30 to 34 Minutes | 473 (8.7%) | 176 (3.9%) |
| 35 to 39 Minutes | 79 (1.5%) | 152 (3.4%) |
| 40 to 44 Minutes | 70 (1.3%) | 53 (1.2%) |
| 45 to 59 Minutes | 306 (5.7%) | 132 (2.9%) |
| 60 to 89 Minutes | 315 (5.8%) | 148 (3.3%) |
| 90 or more Minutes | 162 (3.0%) | 187 (4.1%) |
Time of Departure to Work by Sex in Randolph County
The most frequent times of departure to work in Randolph County are 7:30 AM to 7:59 AM (697, 12.9%) for males and 7:30 AM to 7:59 AM (839, 18.5%) for females.
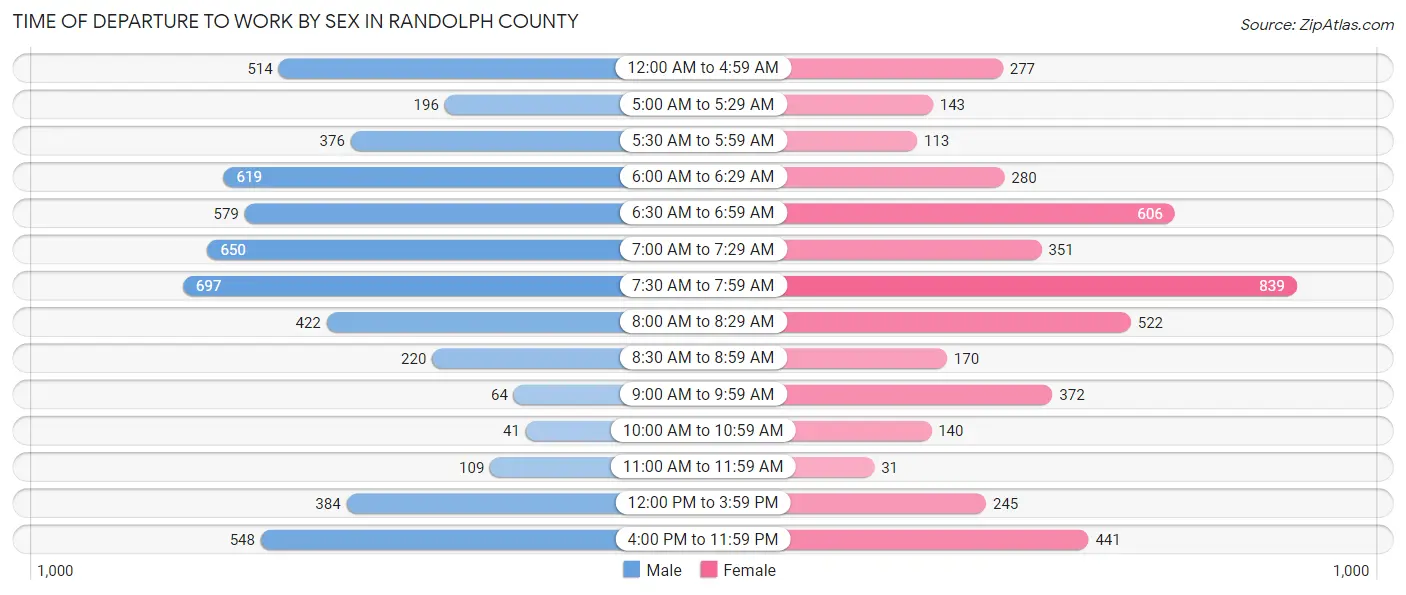
| Time of Departure | Male | Female |
| 12:00 AM to 4:59 AM | 514 (9.5%) | 277 (6.1%) |
| 5:00 AM to 5:29 AM | 196 (3.6%) | 143 (3.2%) |
| 5:30 AM to 5:59 AM | 376 (6.9%) | 113 (2.5%) |
| 6:00 AM to 6:29 AM | 619 (11.4%) | 280 (6.2%) |
| 6:30 AM to 6:59 AM | 579 (10.7%) | 606 (13.4%) |
| 7:00 AM to 7:29 AM | 650 (12.0%) | 351 (7.7%) |
| 7:30 AM to 7:59 AM | 697 (12.9%) | 839 (18.5%) |
| 8:00 AM to 8:29 AM | 422 (7.8%) | 522 (11.5%) |
| 8:30 AM to 8:59 AM | 220 (4.1%) | 170 (3.7%) |
| 9:00 AM to 9:59 AM | 64 (1.2%) | 372 (8.2%) |
| 10:00 AM to 10:59 AM | 41 (0.8%) | 140 (3.1%) |
| 11:00 AM to 11:59 AM | 109 (2.0%) | 31 (0.7%) |
| 12:00 PM to 3:59 PM | 384 (7.1%) | 245 (5.4%) |
| 4:00 PM to 11:59 PM | 548 (10.1%) | 441 (9.7%) |
| Total | 5,419 (100.0%) | 4,530 (100.0%) |
Housing Occupancy in Randolph County
Occupancy by Ownership in Randolph County
Of the total 10,362 dwellings in Randolph County, owner-occupied units account for 7,711 (74.4%), while renter-occupied units make up 2,651 (25.6%).
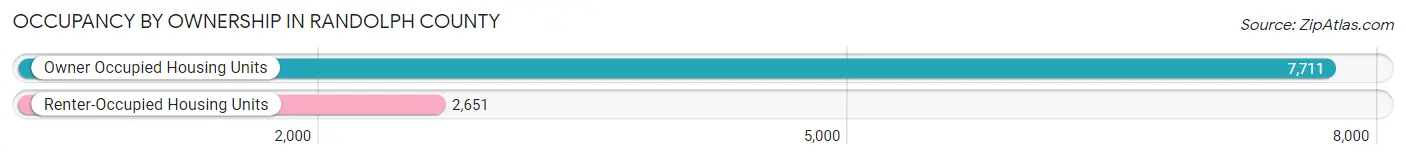
| Occupancy | # Housing Units | % Housing Units |
| Owner Occupied Housing Units | 7,711 | 74.4% |
| Renter-Occupied Housing Units | 2,651 | 25.6% |
| Total Occupied Housing Units | 10,362 | 100.0% |
Occupancy by Household Size in Randolph County
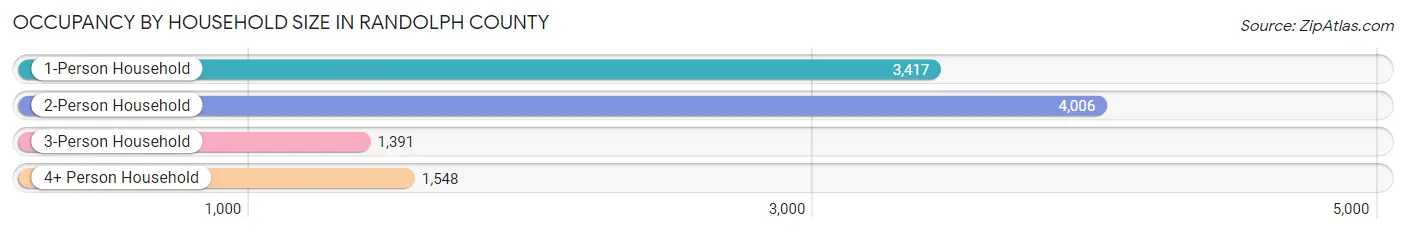
| Household Size | # Housing Units | % Housing Units |
| 1-Person Household | 3,417 | 33.0% |
| 2-Person Household | 4,006 | 38.7% |
| 3-Person Household | 1,391 | 13.4% |
| 4+ Person Household | 1,548 | 14.9% |
| Total Housing Units | 10,362 | 100.0% |
Occupancy by Ownership by Household Size in Randolph County
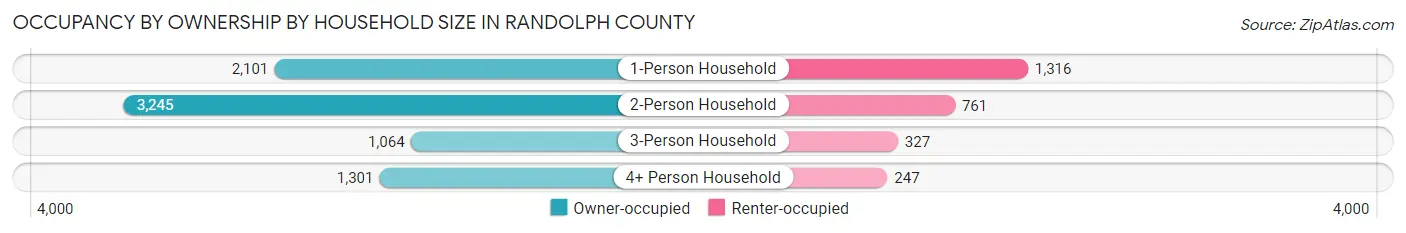
| Household Size | Owner-occupied | Renter-occupied |
| 1-Person Household | 2,101 (61.5%) | 1,316 (38.5%) |
| 2-Person Household | 3,245 (81.0%) | 761 (19.0%) |
| 3-Person Household | 1,064 (76.5%) | 327 (23.5%) |
| 4+ Person Household | 1,301 (84.0%) | 247 (16.0%) |
| Total Housing Units | 7,711 (74.4%) | 2,651 (25.6%) |
Occupancy by Educational Attainment in Randolph County
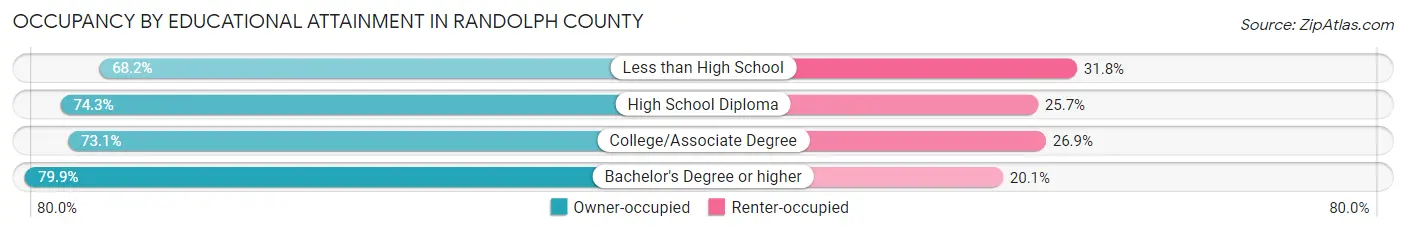
| Household Size | Owner-occupied | Renter-occupied |
| Less than High School | 839 (68.2%) | 392 (31.8%) |
| High School Diploma | 3,641 (74.3%) | 1,257 (25.7%) |
| College/Associate Degree | 1,624 (73.1%) | 598 (26.9%) |
| Bachelor's Degree or higher | 1,607 (79.9%) | 404 (20.1%) |
Occupancy by Age of Householder in Randolph County
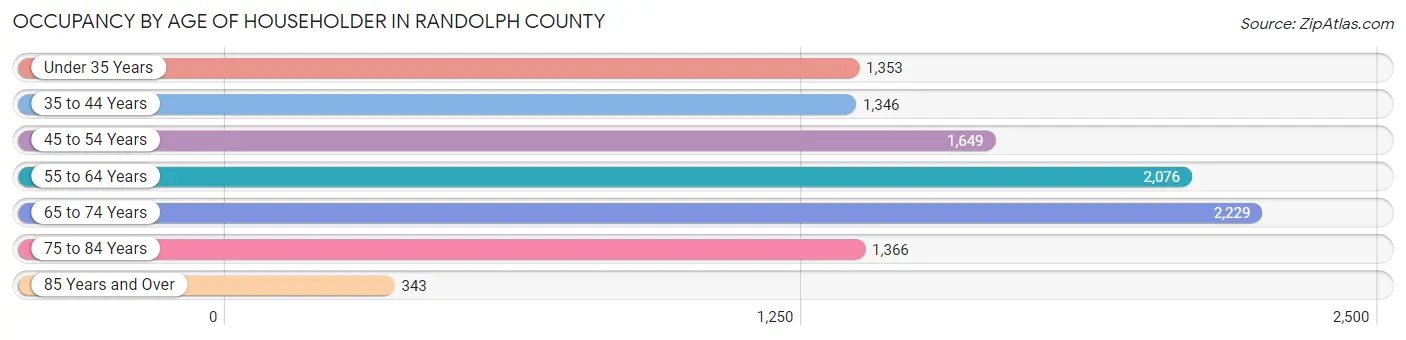
| Age Bracket | # Households | % Households |
| Under 35 Years | 1,353 | 13.1% |
| 35 to 44 Years | 1,346 | 13.0% |
| 45 to 54 Years | 1,649 | 15.9% |
| 55 to 64 Years | 2,076 | 20.0% |
| 65 to 74 Years | 2,229 | 21.5% |
| 75 to 84 Years | 1,366 | 13.2% |
| 85 Years and Over | 343 | 3.3% |
| Total | 10,362 | 100.0% |
Housing Finances in Randolph County
Median Income by Occupancy in Randolph County
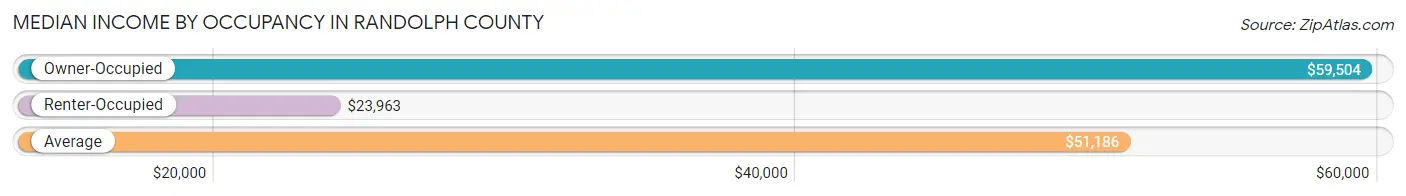
| Occupancy Type | # Households | Median Income |
| Owner-Occupied | 7,711 (74.4%) | $59,504 |
| Renter-Occupied | 2,651 (25.6%) | $23,963 |
| Average | 10,362 (100.0%) | $51,186 |
Occupancy by Householder Income Bracket in Randolph County
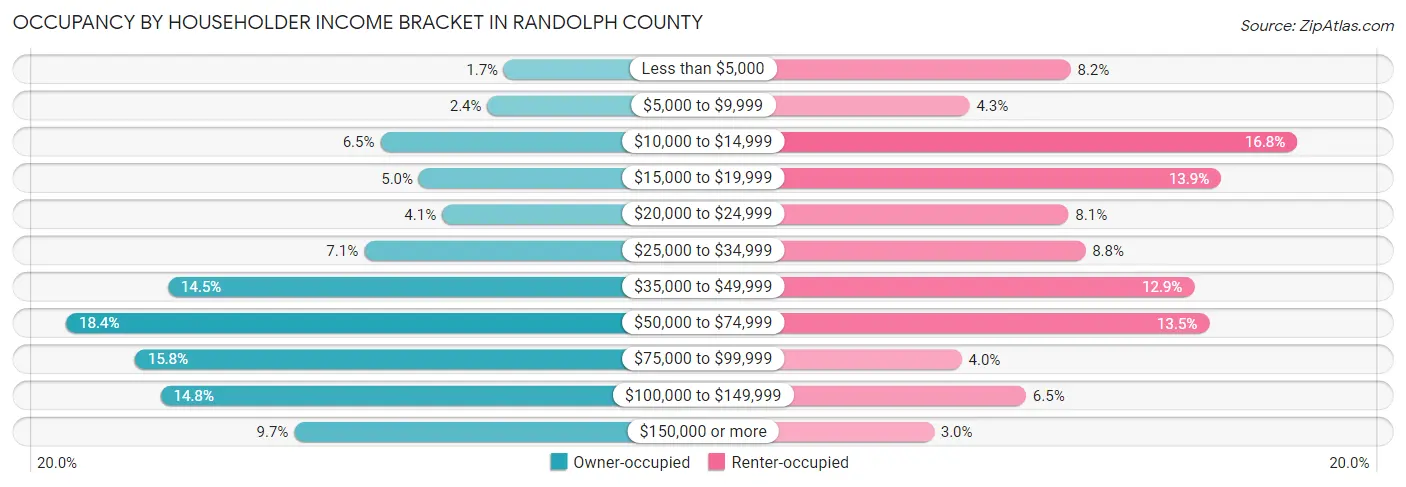
| Income Bracket | Owner-occupied | Renter-occupied |
| Less than $5,000 | 134 (1.7%) | 217 (8.2%) |
| $5,000 to $9,999 | 183 (2.4%) | 115 (4.3%) |
| $10,000 to $14,999 | 497 (6.5%) | 446 (16.8%) |
| $15,000 to $19,999 | 384 (5.0%) | 369 (13.9%) |
| $20,000 to $24,999 | 316 (4.1%) | 215 (8.1%) |
| $25,000 to $34,999 | 545 (7.1%) | 232 (8.7%) |
| $35,000 to $49,999 | 1,121 (14.5%) | 342 (12.9%) |
| $50,000 to $74,999 | 1,420 (18.4%) | 357 (13.5%) |
| $75,000 to $99,999 | 1,218 (15.8%) | 107 (4.0%) |
| $100,000 to $149,999 | 1,143 (14.8%) | 172 (6.5%) |
| $150,000 or more | 750 (9.7%) | 79 (3.0%) |
| Total | 7,711 (100.0%) | 2,651 (100.0%) |
Monthly Housing Cost Tiers in Randolph County
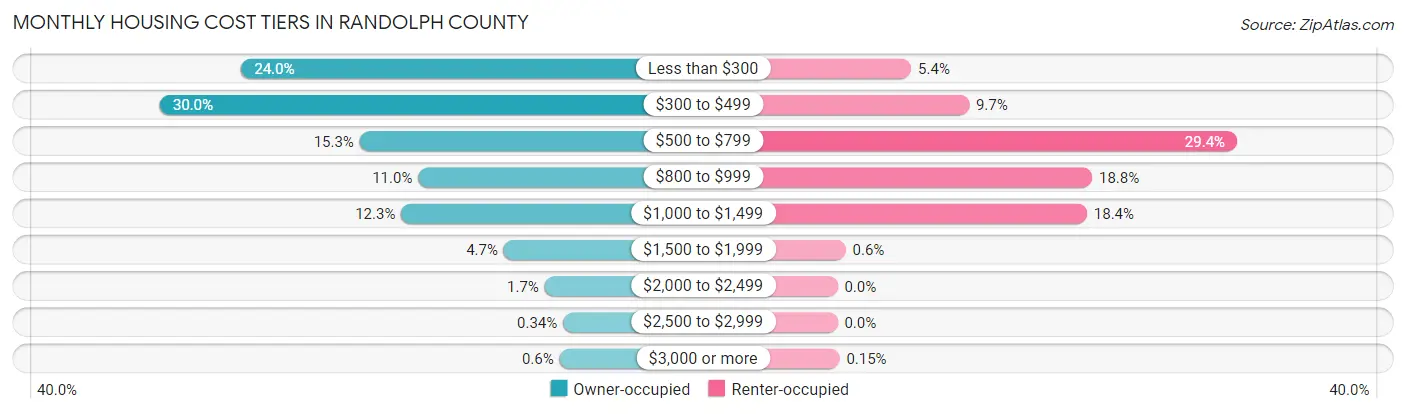
| Monthly Cost | Owner-occupied | Renter-occupied |
| Less than $300 | 1,854 (24.0%) | 144 (5.4%) |
| $300 to $499 | 2,316 (30.0%) | 257 (9.7%) |
| $500 to $799 | 1,181 (15.3%) | 780 (29.4%) |
| $800 to $999 | 849 (11.0%) | 497 (18.8%) |
| $1,000 to $1,499 | 945 (12.3%) | 487 (18.4%) |
| $1,500 to $1,999 | 363 (4.7%) | 16 (0.6%) |
| $2,000 to $2,499 | 131 (1.7%) | 0 (0.0%) |
| $2,500 to $2,999 | 26 (0.3%) | 0 (0.0%) |
| $3,000 or more | 46 (0.6%) | 4 (0.2%) |
| Total | 7,711 (100.0%) | 2,651 (100.0%) |
Physical Housing Characteristics in Randolph County
Housing Structures in Randolph County
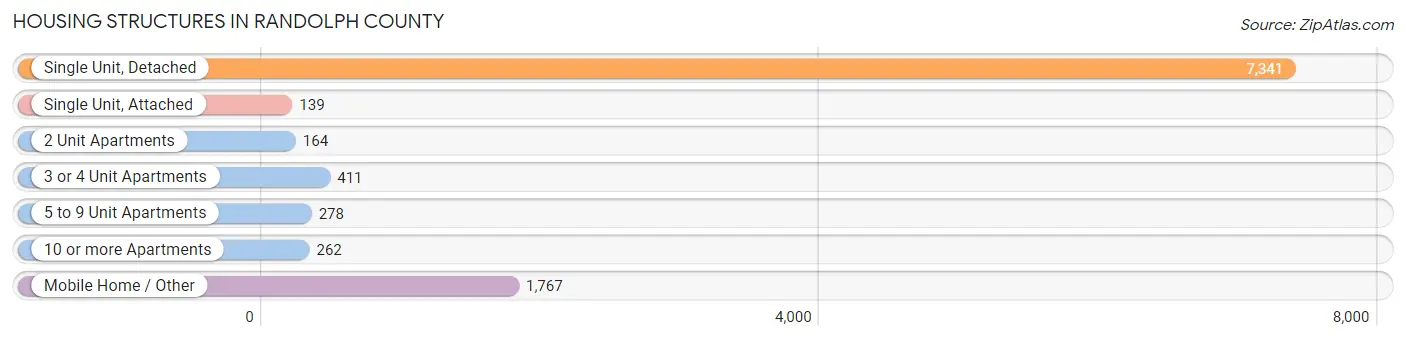
| Structure Type | # Housing Units | % Housing Units |
| Single Unit, Detached | 7,341 | 70.9% |
| Single Unit, Attached | 139 | 1.3% |
| 2 Unit Apartments | 164 | 1.6% |
| 3 or 4 Unit Apartments | 411 | 4.0% |
| 5 to 9 Unit Apartments | 278 | 2.7% |
| 10 or more Apartments | 262 | 2.5% |
| Mobile Home / Other | 1,767 | 17.1% |
| Total | 10,362 | 100.0% |
Housing Structures by Occupancy in Randolph County
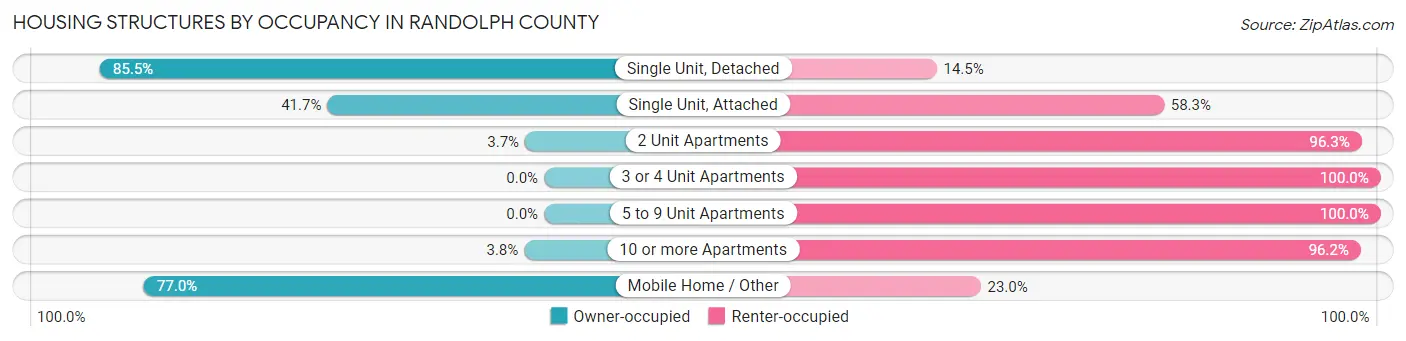
| Structure Type | Owner-occupied | Renter-occupied |
| Single Unit, Detached | 6,276 (85.5%) | 1,065 (14.5%) |
| Single Unit, Attached | 58 (41.7%) | 81 (58.3%) |
| 2 Unit Apartments | 6 (3.7%) | 158 (96.3%) |
| 3 or 4 Unit Apartments | 0 (0.0%) | 411 (100.0%) |
| 5 to 9 Unit Apartments | 0 (0.0%) | 278 (100.0%) |
| 10 or more Apartments | 10 (3.8%) | 252 (96.2%) |
| Mobile Home / Other | 1,361 (77.0%) | 406 (23.0%) |
| Total | 7,711 (74.4%) | 2,651 (25.6%) |
Housing Structures by Number of Rooms in Randolph County
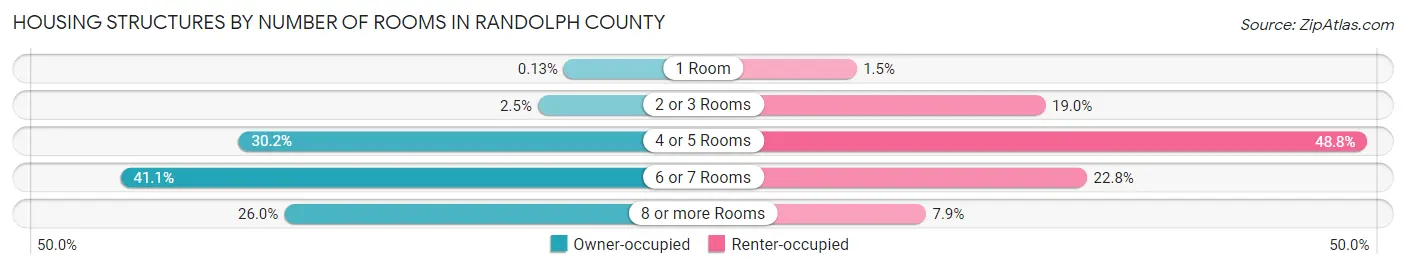
| Number of Rooms | Owner-occupied | Renter-occupied |
| 1 Room | 10 (0.1%) | 40 (1.5%) |
| 2 or 3 Rooms | 196 (2.5%) | 503 (19.0%) |
| 4 or 5 Rooms | 2,329 (30.2%) | 1,293 (48.8%) |
| 6 or 7 Rooms | 3,171 (41.1%) | 605 (22.8%) |
| 8 or more Rooms | 2,005 (26.0%) | 210 (7.9%) |
| Total | 7,711 (100.0%) | 2,651 (100.0%) |
Housing Structure by Heating Type in Randolph County
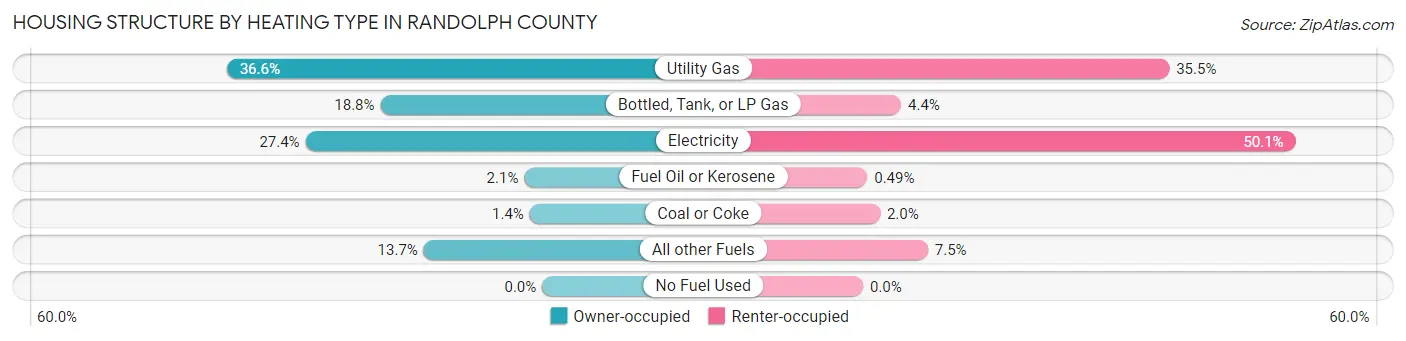
| Heating Type | Owner-occupied | Renter-occupied |
| Utility Gas | 2,819 (36.6%) | 941 (35.5%) |
| Bottled, Tank, or LP Gas | 1,446 (18.8%) | 117 (4.4%) |
| Electricity | 2,116 (27.4%) | 1,329 (50.1%) |
| Fuel Oil or Kerosene | 160 (2.1%) | 13 (0.5%) |
| Coal or Coke | 111 (1.4%) | 52 (2.0%) |
| All other Fuels | 1,059 (13.7%) | 199 (7.5%) |
| No Fuel Used | 0 (0.0%) | 0 (0.0%) |
| Total | 7,711 (100.0%) | 2,651 (100.0%) |
Household Vehicle Usage in Randolph County
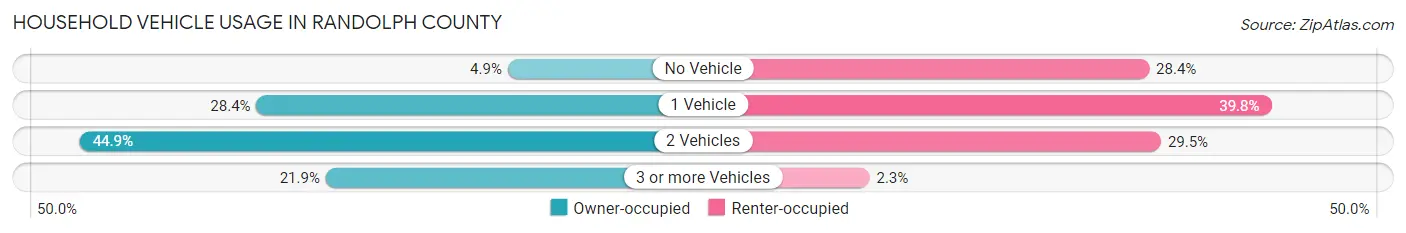
| Vehicles per Household | Owner-occupied | Renter-occupied |
| No Vehicle | 378 (4.9%) | 753 (28.4%) |
| 1 Vehicle | 2,187 (28.4%) | 1,055 (39.8%) |
| 2 Vehicles | 3,458 (44.9%) | 782 (29.5%) |
| 3 or more Vehicles | 1,688 (21.9%) | 61 (2.3%) |
| Total | 7,711 (100.0%) | 2,651 (100.0%) |
Real Estate & Mortgages in Randolph County
Real Estate and Mortgage Overview in Randolph County
| Characteristic | Without Mortgage | With Mortgage |
| Housing Units | 4,665 | 3,046 |
| Median Property Value | $111,200 | $150,700 |
| Median Household Income | $49,916 | $459 |
| Monthly Housing Costs | $339 | $46 |
| Real Estate Taxes | $468 | $67 |
Property Value by Mortgage Status in Randolph County
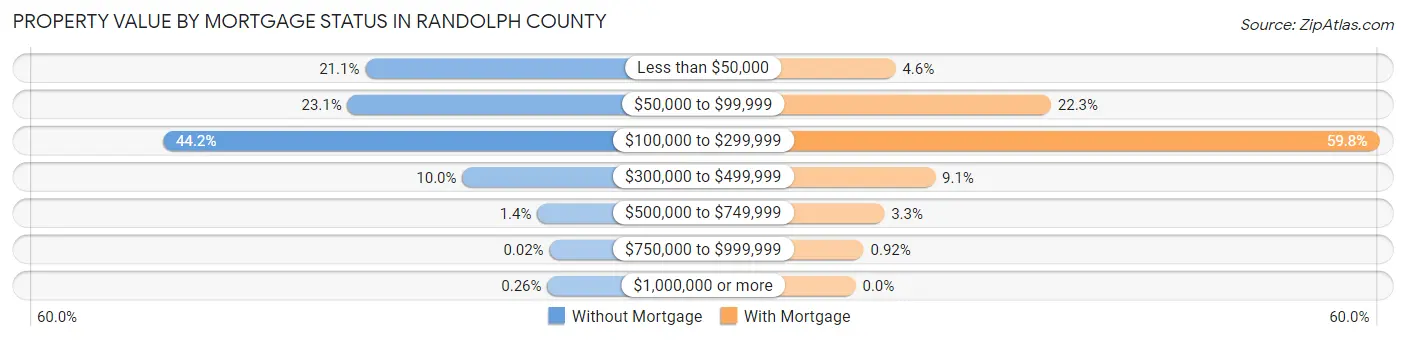
| Property Value | Without Mortgage | With Mortgage |
| Less than $50,000 | 983 (21.1%) | 139 (4.6%) |
| $50,000 to $99,999 | 1,077 (23.1%) | 680 (22.3%) |
| $100,000 to $299,999 | 2,061 (44.2%) | 1,822 (59.8%) |
| $300,000 to $499,999 | 465 (10.0%) | 277 (9.1%) |
| $500,000 to $749,999 | 66 (1.4%) | 100 (3.3%) |
| $750,000 to $999,999 | 1 (0.0%) | 28 (0.9%) |
| $1,000,000 or more | 12 (0.3%) | 0 (0.0%) |
| Total | 4,665 (100.0%) | 3,046 (100.0%) |
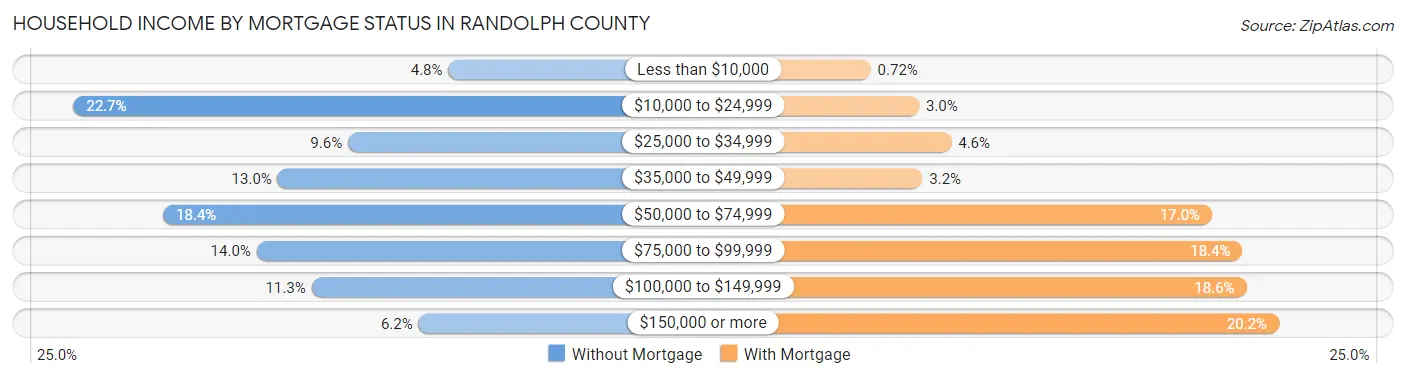
Household Income by Mortgage Status in Randolph County
| Household Income | Without Mortgage | With Mortgage |
| Less than $10,000 | 225 (4.8%) | 22 (0.7%) |
| $10,000 to $24,999 | 1,058 (22.7%) | 92 (3.0%) |
| $25,000 to $34,999 | 448 (9.6%) | 139 (4.6%) |
| $35,000 to $49,999 | 604 (13.0%) | 97 (3.2%) |
| $50,000 to $74,999 | 859 (18.4%) | 517 (17.0%) |
| $75,000 to $99,999 | 651 (14.0%) | 561 (18.4%) |
| $100,000 to $149,999 | 529 (11.3%) | 567 (18.6%) |
| $150,000 or more | 291 (6.2%) | 614 (20.2%) |
| Total | 4,665 (100.0%) | 3,046 (100.0%) |
Property Value to Household Income Ratio in Randolph County
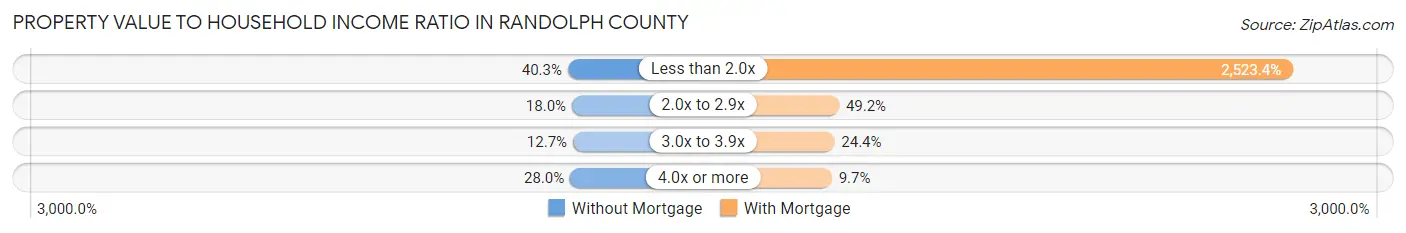
| Value-to-Income Ratio | Without Mortgage | With Mortgage |
| Less than 2.0x | 1,879 (40.3%) | 76,863 (2,523.4%) |
| 2.0x to 2.9x | 841 (18.0%) | 1,498 (49.2%) |
| 3.0x to 3.9x | 593 (12.7%) | 742 (24.4%) |
| 4.0x or more | 1,306 (28.0%) | 296 (9.7%) |
| Total | 4,665 (100.0%) | 3,046 (100.0%) |
Real Estate Taxes by Mortgage Status in Randolph County
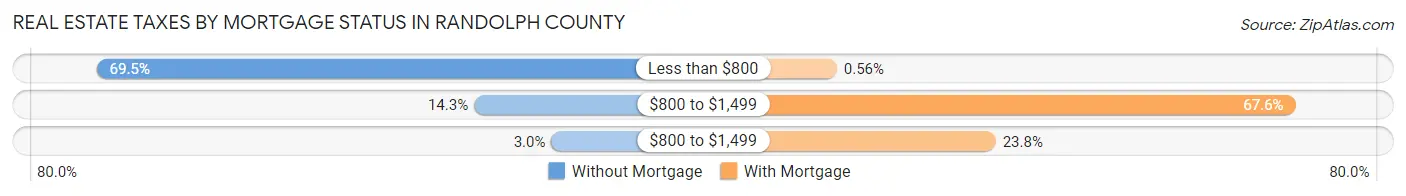
| Property Taxes | Without Mortgage | With Mortgage |
| Less than $800 | 3,241 (69.5%) | 17 (0.6%) |
| $800 to $1,499 | 669 (14.3%) | 2,058 (67.6%) |
| $800 to $1,499 | 142 (3.0%) | 724 (23.8%) |
| Total | 4,665 (100.0%) | 3,046 (100.0%) |
Health & Disability in Randolph County
Health Insurance Coverage by Age in Randolph County
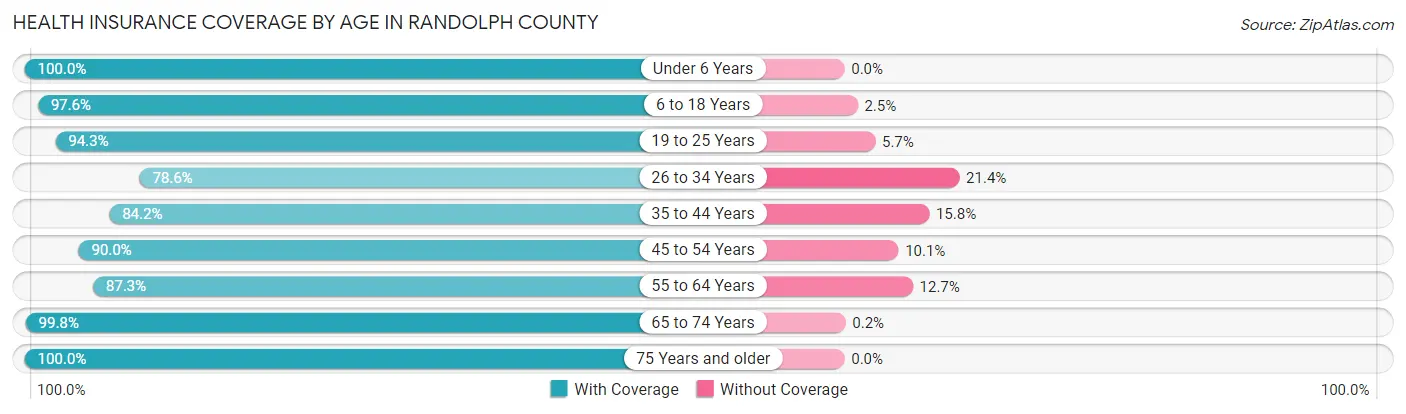
| Age Bracket | With Coverage | Without Coverage |
| Under 6 Years | 1,603 (100.0%) | 0 (0.0%) |
| 6 to 18 Years | 3,708 (97.6%) | 93 (2.5%) |
| 19 to 25 Years | 2,172 (94.3%) | 132 (5.7%) |
| 26 to 34 Years | 1,853 (78.6%) | 505 (21.4%) |
| 35 to 44 Years | 2,454 (84.2%) | 460 (15.8%) |
| 45 to 54 Years | 2,873 (89.9%) | 321 (10.1%) |
| 55 to 64 Years | 3,337 (87.3%) | 487 (12.7%) |
| 65 to 74 Years | 3,480 (99.8%) | 7 (0.2%) |
| 75 Years and older | 2,475 (100.0%) | 0 (0.0%) |
| Total | 23,955 (92.3%) | 2,005 (7.7%) |
Health Insurance Coverage by Citizenship Status in Randolph County
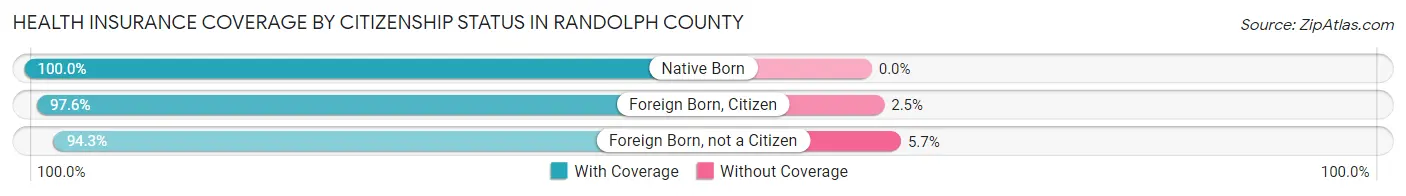
| Citizenship Status | With Coverage | Without Coverage |
| Native Born | 1,603 (100.0%) | 0 (0.0%) |
| Foreign Born, Citizen | 3,708 (97.6%) | 93 (2.5%) |
| Foreign Born, not a Citizen | 2,172 (94.3%) | 132 (5.7%) |
Health Insurance Coverage by Household Income in Randolph County
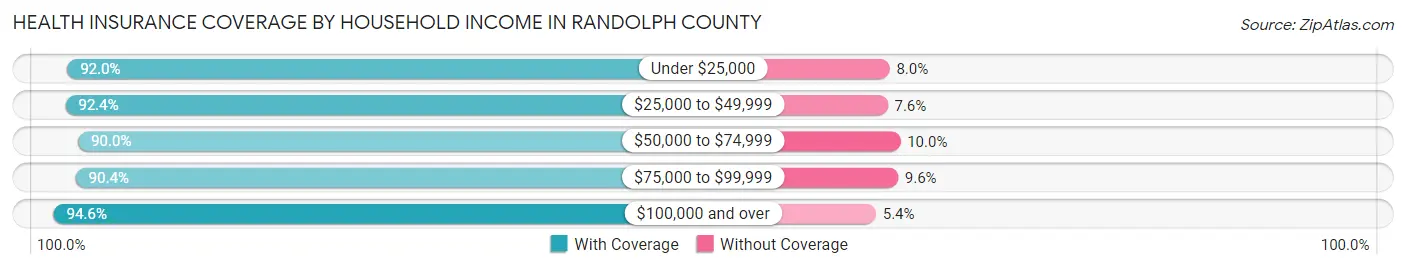
| Household Income | With Coverage | Without Coverage |
| Under $25,000 | 3,972 (92.0%) | 345 (8.0%) |
| $25,000 to $49,999 | 5,036 (92.4%) | 416 (7.6%) |
| $50,000 to $74,999 | 4,344 (90.0%) | 483 (10.0%) |
| $75,000 to $99,999 | 3,063 (90.4%) | 324 (9.6%) |
| $100,000 and over | 7,127 (94.6%) | 409 (5.4%) |
Public vs Private Health Insurance Coverage by Age in Randolph County
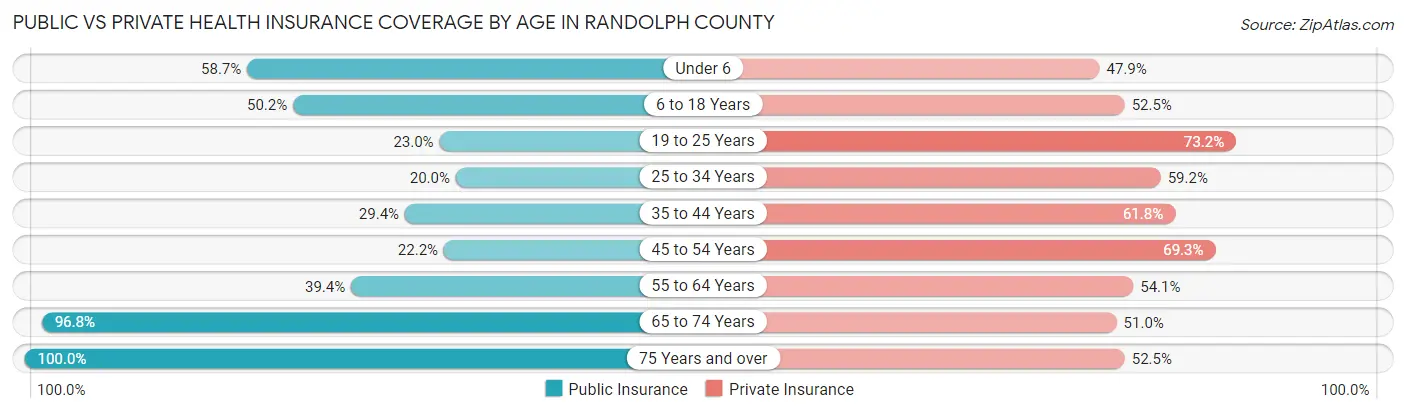
| Age Bracket | Public Insurance | Private Insurance |
| Under 6 | 941 (58.7%) | 767 (47.8%) |
| 6 to 18 Years | 1,907 (50.2%) | 1,996 (52.5%) |
| 19 to 25 Years | 530 (23.0%) | 1,686 (73.2%) |
| 25 to 34 Years | 471 (20.0%) | 1,396 (59.2%) |
| 35 to 44 Years | 857 (29.4%) | 1,802 (61.8%) |
| 45 to 54 Years | 708 (22.2%) | 2,214 (69.3%) |
| 55 to 64 Years | 1,507 (39.4%) | 2,069 (54.1%) |
| 65 to 74 Years | 3,376 (96.8%) | 1,779 (51.0%) |
| 75 Years and over | 2,475 (100.0%) | 1,300 (52.5%) |
| Total | 12,772 (49.2%) | 15,009 (57.8%) |
Disability Status by Sex by Age in Randolph County
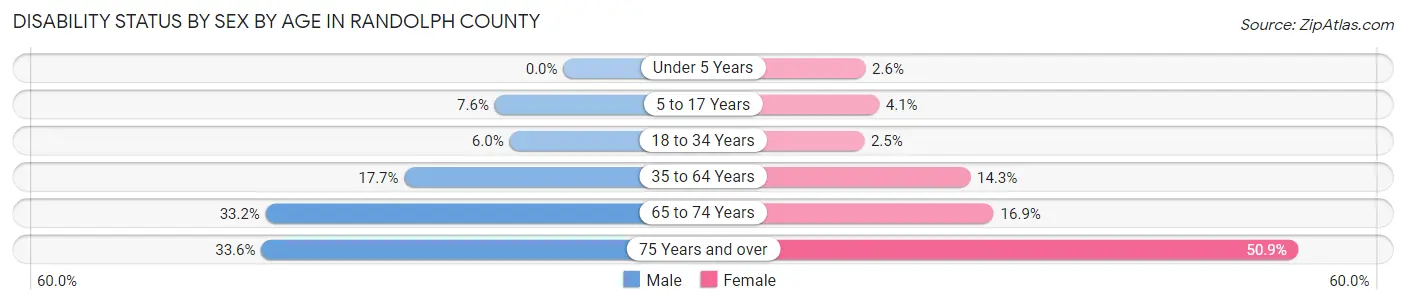
| Age Bracket | Male | Female |
| Under 5 Years | 0 (0.0%) | 18 (2.6%) |
| 5 to 17 Years | 144 (7.6%) | 75 (4.1%) |
| 18 to 34 Years | 157 (6.0%) | 58 (2.5%) |
| 35 to 64 Years | 897 (17.7%) | 695 (14.3%) |
| 65 to 74 Years | 556 (33.2%) | 306 (16.9%) |
| 75 Years and over | 367 (33.6%) | 704 (50.9%) |
Disability Class by Sex by Age in Randolph County
Disability Class: Hearing Difficulty
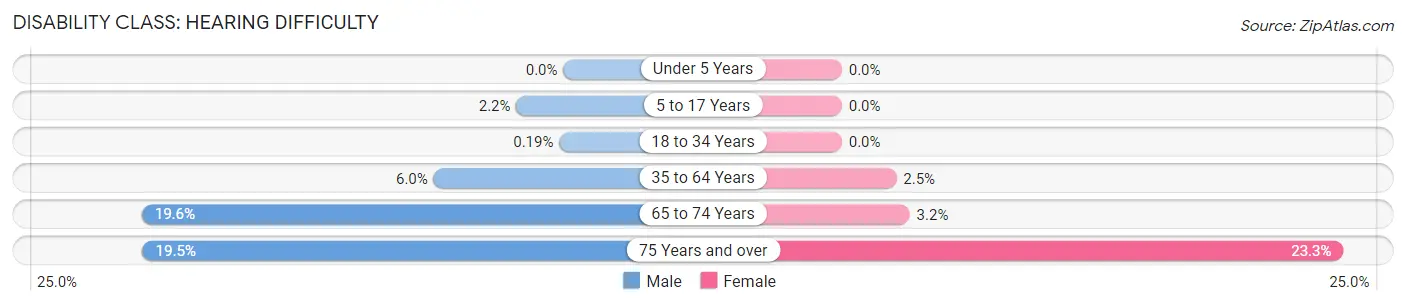
| Age Bracket | Male | Female |
| Under 5 Years | 0 (0.0%) | 0 (0.0%) |
| 5 to 17 Years | 41 (2.2%) | 0 (0.0%) |
| 18 to 34 Years | 5 (0.2%) | 0 (0.0%) |
| 35 to 64 Years | 305 (6.0%) | 123 (2.5%) |
| 65 to 74 Years | 328 (19.6%) | 57 (3.2%) |
| 75 Years and over | 213 (19.5%) | 322 (23.3%) |
Disability Class: Vision Difficulty
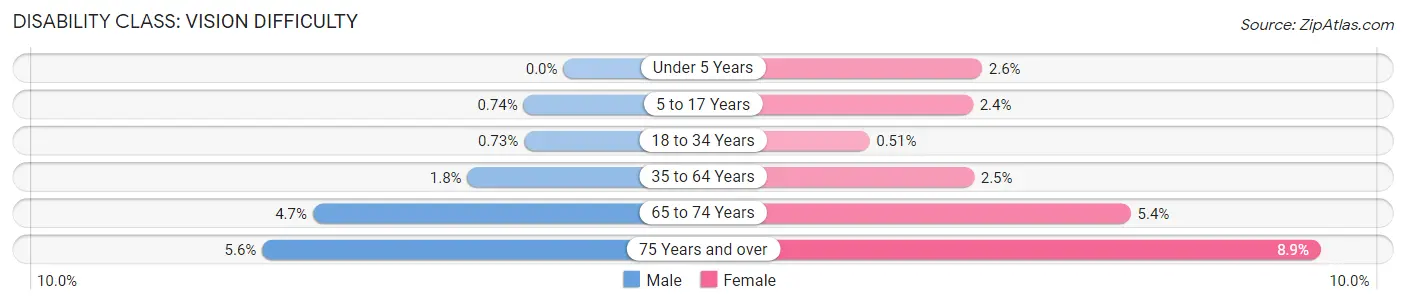
| Age Bracket | Male | Female |
| Under 5 Years | 0 (0.0%) | 18 (2.6%) |
| 5 to 17 Years | 14 (0.7%) | 44 (2.4%) |
| 18 to 34 Years | 19 (0.7%) | 12 (0.5%) |
| 35 to 64 Years | 90 (1.8%) | 119 (2.5%) |
| 65 to 74 Years | 78 (4.6%) | 97 (5.4%) |
| 75 Years and over | 61 (5.6%) | 123 (8.9%) |
Disability Class: Cognitive Difficulty
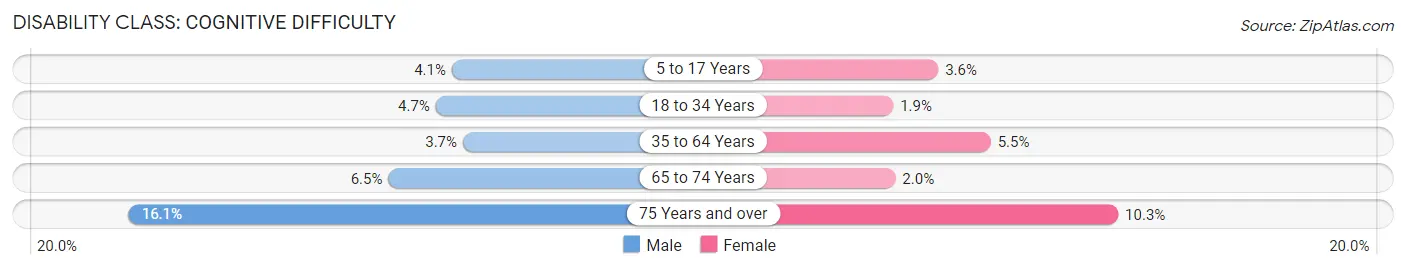
| Age Bracket | Male | Female |
| 5 to 17 Years | 78 (4.1%) | 65 (3.6%) |
| 18 to 34 Years | 124 (4.7%) | 45 (1.9%) |
| 35 to 64 Years | 189 (3.7%) | 269 (5.5%) |
| 65 to 74 Years | 109 (6.5%) | 36 (2.0%) |
| 75 Years and over | 176 (16.1%) | 142 (10.3%) |
Disability Class: Ambulatory Difficulty
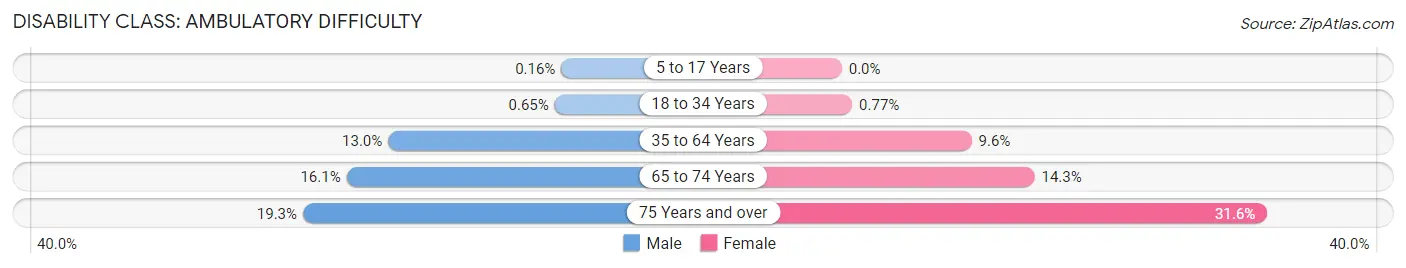
| Age Bracket | Male | Female |
| 5 to 17 Years | 3 (0.2%) | 0 (0.0%) |
| 18 to 34 Years | 17 (0.6%) | 18 (0.8%) |
| 35 to 64 Years | 659 (13.0%) | 469 (9.6%) |
| 65 to 74 Years | 270 (16.1%) | 259 (14.3%) |
| 75 Years and over | 211 (19.3%) | 437 (31.6%) |
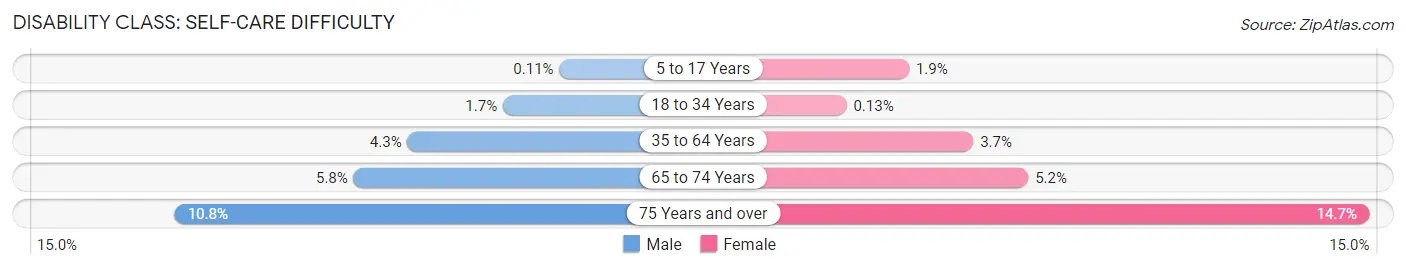
Disability Class: Self-Care Difficulty
| Age Bracket | Male | Female |
| 5 to 17 Years | 2 (0.1%) | 34 (1.9%) |
| 18 to 34 Years | 44 (1.7%) | 3 (0.1%) |
| 35 to 64 Years | 220 (4.3%) | 178 (3.7%) |
| 65 to 74 Years | 98 (5.8%) | 94 (5.2%) |
| 75 Years and over | 118 (10.8%) | 203 (14.7%) |
Technology Access in Randolph County
Computing Device Access in Randolph County
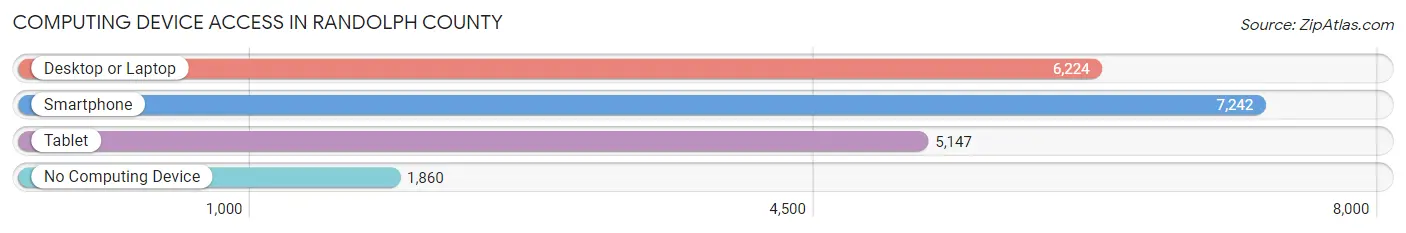
| Device Type | # Households | % Households |
| Desktop or Laptop | 6,224 | 60.1% |
| Smartphone | 7,242 | 69.9% |
| Tablet | 5,147 | 49.7% |
| No Computing Device | 1,860 | 17.9% |
| Total | 10,362 | 100.0% |
Internet Access in Randolph County
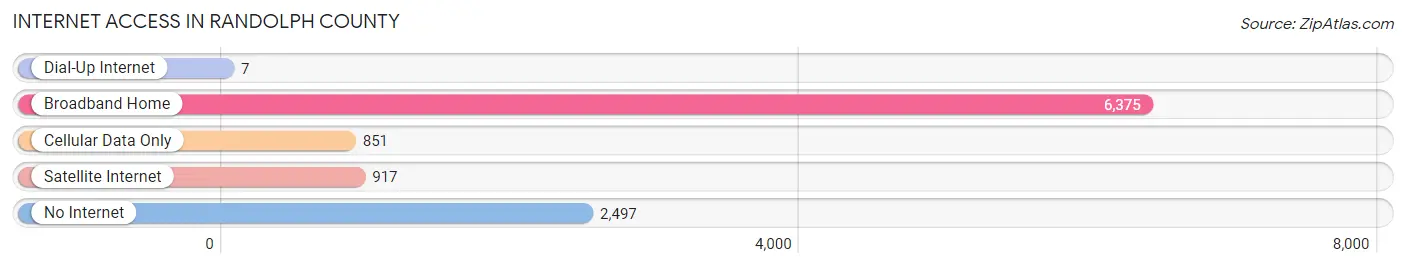
| Internet Type | # Households | % Households |
| Dial-Up Internet | 7 | 0.1% |
| Broadband Home | 6,375 | 61.5% |
| Cellular Data Only | 851 | 8.2% |
| Satellite Internet | 917 | 8.8% |
| No Internet | 2,497 | 24.1% |
| Total | 10,362 | 100.0% |
Randolph County Summary
Randolph County, West Virginia is located in the eastern part of the state and is part of the Potomac Highlands region. It is bordered by Tucker County to the north, Pendleton County to the east, Pocahontas County to the south, and Barbour County to the west. The county seat is Elkins, and the county has a total area of 541 square miles.
History
Randolph County was formed in 1787 from Harrison County and named for Edmund Jennings Randolph, the first United States Attorney General. The county was part of the vast area of western Virginia that was ceded to the United States in 1784. The county was divided into two parts in 1818, with the northern part becoming Tucker County.
The county was home to several Native American tribes, including the Monongahela, Shawnee, and Delaware. The first European settlers arrived in the area in the late 1700s, and the county was officially established in 1787.
The county was home to several prominent figures in American history, including Senator Henry Gassaway Davis, who was born in the county in 1823. Davis was a major figure in the development of the coal and railroad industries in West Virginia.
Geography
Randolph County is located in the eastern part of West Virginia and is part of the Potomac Highlands region. It is bordered by Tucker County to the north, Pendleton County to the east, Pocahontas County to the south, and Barbour County to the west. The county has a total area of 541 square miles, with the Cheat River running through the county.
The terrain of Randolph County is mostly mountainous, with elevations ranging from 1,000 to 4,000 feet. The highest point in the county is Spruce Knob, which has an elevation of 4,863 feet. The county is home to several state parks, including Blackwater Falls State Park, Canaan Valley State Park, and Monongahela National Forest.
Economy
The economy of Randolph County is largely based on agriculture, forestry, and tourism. The county is home to several large farms, and the timber industry is also an important part of the local economy. Tourism is also a major contributor to the economy, with the county’s many state parks and outdoor recreation areas attracting visitors from all over the country.
The county is also home to several manufacturing companies, including a paper mill, a furniture factory, and a plastics plant. The county is also home to several coal mines, and the coal industry is an important part of the local economy.
Demographics
As of the 2010 census, Randolph County had a population of 29,405. The population is largely white (94.3%), with small percentages of African Americans (2.7%), Native Americans (0.5%), Asians (0.3%), and other races (2.2%). The median household income in the county is $37,945, and the median age is 42.7 years.
Conclusion
Randolph County, West Virginia is located in the eastern part of the state and is part of the Potomac Highlands region. It is bordered by Tucker County to the north, Pendleton County to the east, Pocahontas County to the south, and Barbour County to the west. The county has a total area of 541 square miles, and the population is largely white. The economy of Randolph County is largely based on agriculture, forestry, and tourism, and the county is home to several state parks and outdoor recreation areas.
Common Questions
What is the Total Population of Randolph County?
Total Population of Randolph County is 28,005.
What is the Total Male Population of Randolph County?
Total Male Population of Randolph County is 14,750.
What is the Total Female Population of Randolph County?
Total Female Population of Randolph County is 13,255.
What is the Ratio of Males per 100 Females in Randolph County?
There are 111.28 Males per 100 Females in Randolph County.
What is the Ratio of Females per 100 Males in Randolph County?
There are 89.86 Females per 100 Males in Randolph County.
What is the Median Population Age in Randolph County?
Median Population Age in Randolph County is 44.6 Years.
What is the Average Family Size in Randolph County
Average Family Size in Randolph County is 3.2 People.
What is the Average Household Size in Randolph County
Average Household Size in Randolph County is 2.5 People.
What is Per Capita Income in Randolph County?
Per Capita income in Randolph County is $26,289.
What is the Median Family Income in Randolph County?
Median Family Income in Randolph County is $64,084.
What is the Median Household income in Randolph County?
Median Household Income in Randolph County is $51,186.
What is Income or Wage Gap in Randolph County?
Income or Wage Gap in Randolph County is 26.0%.
Women in Randolph County earn 74.0 cents for every dollar earned by a man.
What is Family Income Deficit in Randolph County?
Family Income Deficit in Randolph County is $8,680.
Families that are below poverty line in Randolph County earn $8,680 less on average than the poverty threshold level.
What is Inequality or Gini Index in Randolph County?
Inequality or Gini Index in Randolph County is 0.44.
How Large is the Labor Force in Randolph County?
There are 11,495 People in the Labor Forcein in Randolph County.
What is the Percentage of People in the Labor Force in Randolph County?
49.0% of People are in the Labor Force in Randolph County.
What is the Unemployment Rate in Randolph County?
Unemployment Rate in Randolph County is 7.3%.