Raleigh County, WV
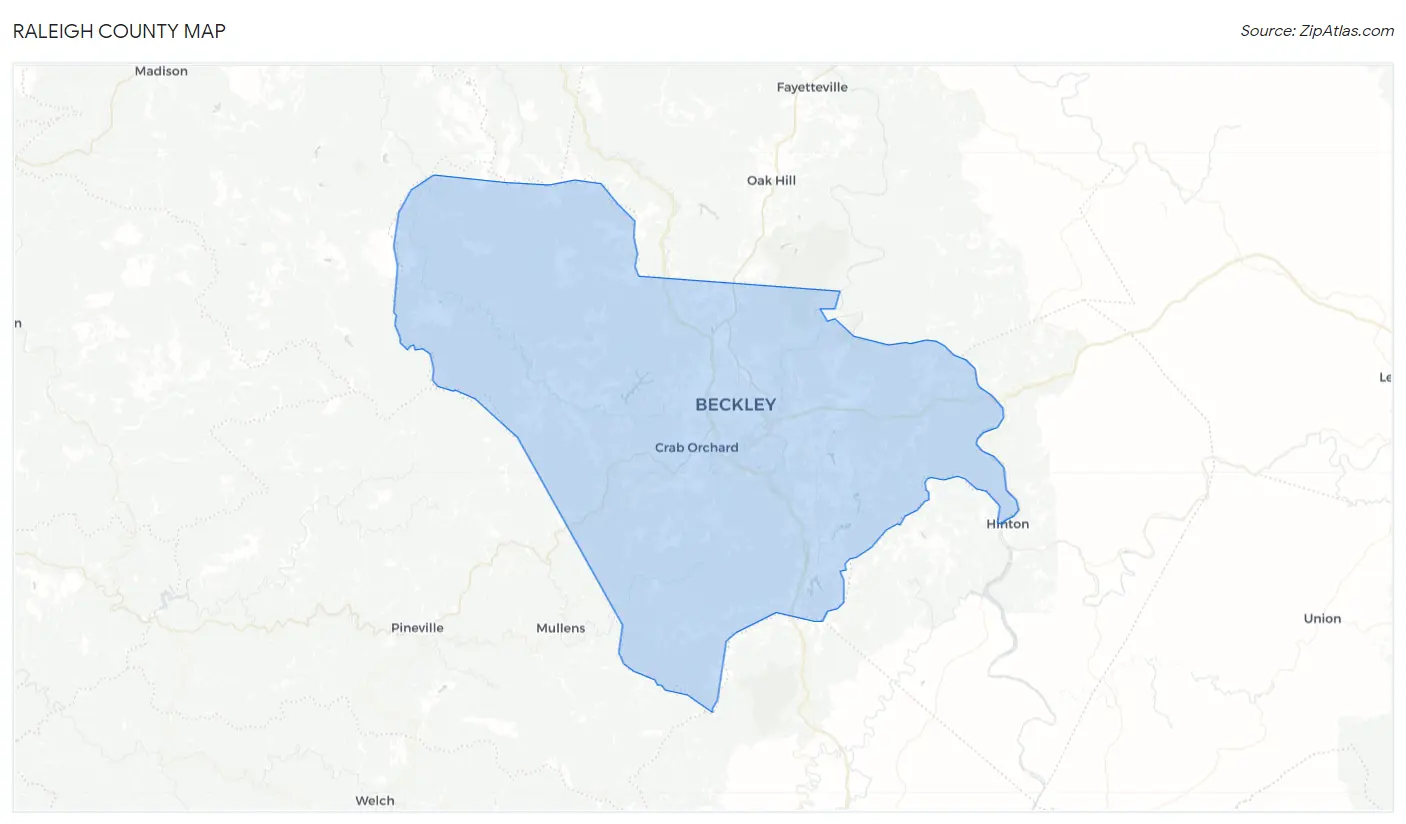
Raleigh County Map
Raleigh County Overview
74,303
TOTAL POPULATION
37,402
MALE POPULATION
36,901
FEMALE POPULATION
101.36
MALES / 100 FEMALES
98.66
FEMALES / 100 MALES
42.6
MEDIAN AGE
3.0
AVG FAMILY SIZE
2.4
AVG HOUSEHOLD SIZE
$27,724
PER CAPITA INCOME
$65,294
AVG FAMILY INCOME
$47,975
AVG HOUSEHOLD INCOME
30.4%
WAGE / INCOME GAP [ % ]
69.6¢/ $1
WAGE / INCOME GAP [ $ ]
$12,071
FAMILY INCOME DEFICIT
0.49
INEQUALITY / GINI INDEX
29,015
LABOR FORCE [ PEOPLE ]
48.1%
PERCENT IN LABOR FORCE
7.1%
UNEMPLOYMENT RATE
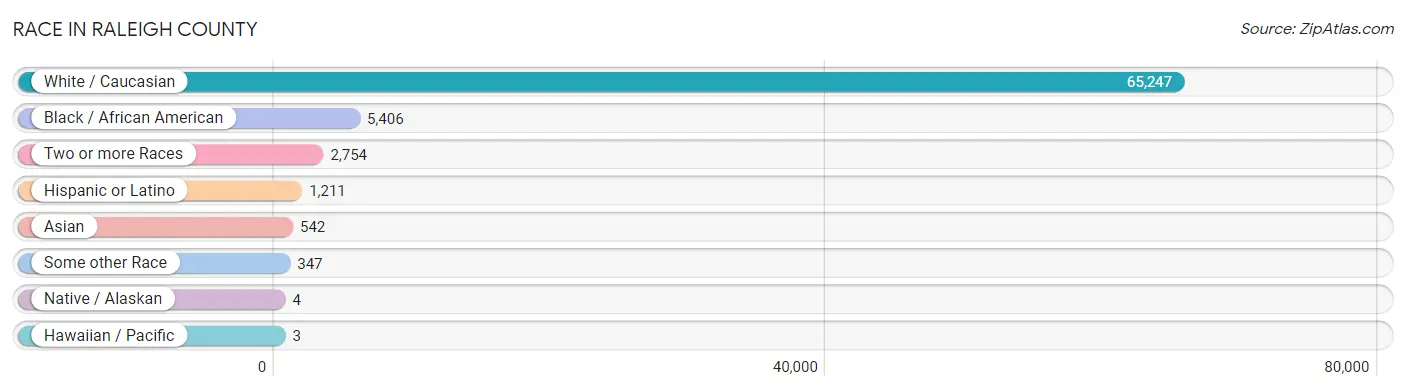
Race in Raleigh County
The most populous races in Raleigh County are White / Caucasian (65,247 | 87.8%), Black / African American (5,406 | 7.3%), and Two or more Races (2,754 | 3.7%).
| Race | # Population | % Population |
| Asian | 542 | 0.7% |
| Black / African American | 5,406 | 7.3% |
| Hawaiian / Pacific | 3 | 0.0% |
| Hispanic or Latino | 1,211 | 1.6% |
| Native / Alaskan | 4 | 0.0% |
| White / Caucasian | 65,247 | 87.8% |
| Two or more Races | 2,754 | 3.7% |
| Some other Race | 347 | 0.5% |
| Total | 74,303 | 100.0% |
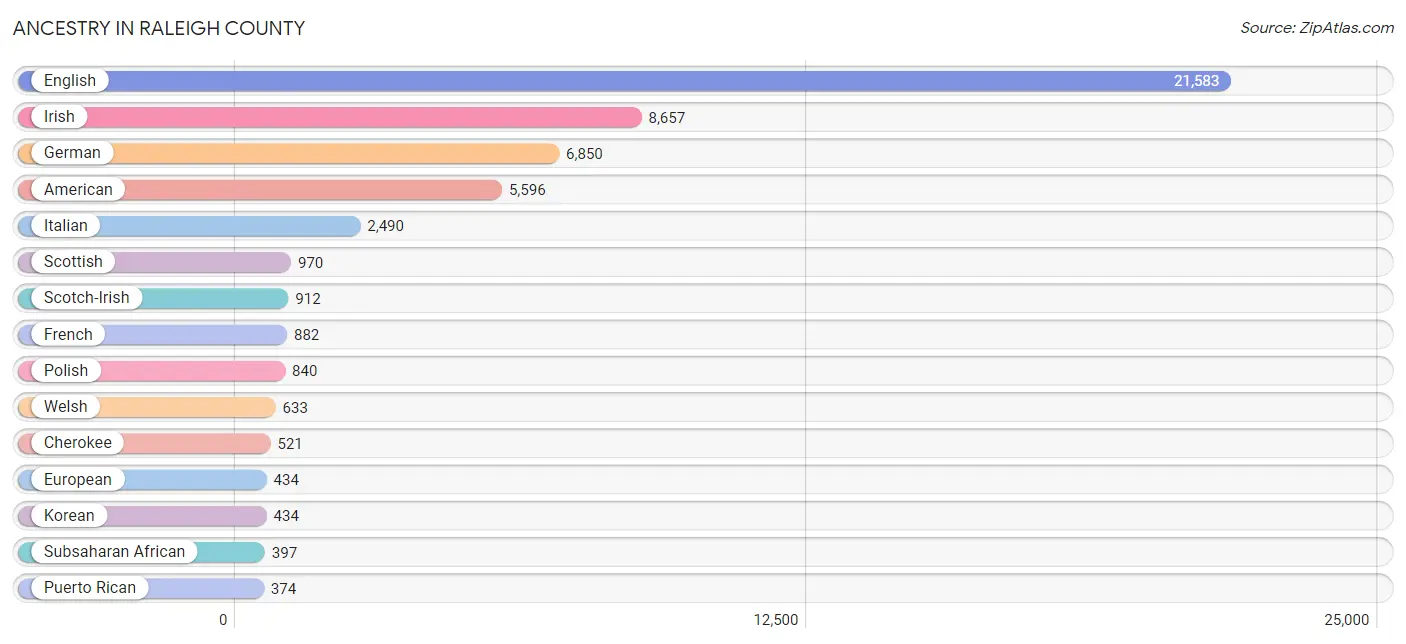
Ancestry in Raleigh County
The most populous ancestries reported in Raleigh County are English (21,583 | 29.0%), Irish (8,657 | 11.7%), German (6,850 | 9.2%), American (5,596 | 7.5%), and Italian (2,490 | 3.4%), together accounting for 60.8% of all Raleigh County residents.
| Ancestry | # Population | % Population |
| African | 276 | 0.4% |
| American | 5,596 | 7.5% |
| Apache | 16 | 0.0% |
| Arab | 259 | 0.4% |
| Australian | 31 | 0.0% |
| Austrian | 18 | 0.0% |
| Belgian | 8 | 0.0% |
| Bhutanese | 52 | 0.1% |
| British | 153 | 0.2% |
| Bulgarian | 28 | 0.0% |
| Burmese | 16 | 0.0% |
| Canadian | 10 | 0.0% |
| Central American | 7 | 0.0% |
| Cherokee | 521 | 0.7% |
| Chippewa | 4 | 0.0% |
| Colombian | 9 | 0.0% |
| Cuban | 240 | 0.3% |
| Czech | 24 | 0.0% |
| Czechoslovakian | 40 | 0.1% |
| Dominican | 6 | 0.0% |
| Dutch | 249 | 0.3% |
| Eastern European | 260 | 0.4% |
| Egyptian | 62 | 0.1% |
| English | 21,583 | 29.0% |
| European | 434 | 0.6% |
| Finnish | 114 | 0.2% |
| French | 882 | 1.2% |
| French Canadian | 155 | 0.2% |
| German | 6,850 | 9.2% |
| Greek | 51 | 0.1% |
| Guatemalan | 4 | 0.0% |
| Hungarian | 264 | 0.4% |
| Indian (Asian) | 36 | 0.1% |
| Iranian | 9 | 0.0% |
| Irish | 8,657 | 11.7% |
| Israeli | 14 | 0.0% |
| Italian | 2,490 | 3.4% |
| Jamaican | 3 | 0.0% |
| Jordanian | 4 | 0.0% |
| Korean | 434 | 0.6% |
| Lebanese | 146 | 0.2% |
| Liberian | 90 | 0.1% |
| Lithuanian | 61 | 0.1% |
| Mexican | 284 | 0.4% |
| Native Hawaiian | 3 | 0.0% |
| Nigerian | 15 | 0.0% |
| Northern European | 53 | 0.1% |
| Norwegian | 172 | 0.2% |
| Pakistani | 56 | 0.1% |
| Palestinian | 33 | 0.0% |
| Pennsylvania German | 18 | 0.0% |
| Polish | 840 | 1.1% |
| Portuguese | 4 | 0.0% |
| Puerto Rican | 374 | 0.5% |
| Romanian | 22 | 0.0% |
| Russian | 146 | 0.2% |
| Salvadoran | 3 | 0.0% |
| Scandinavian | 33 | 0.0% |
| Scotch-Irish | 912 | 1.2% |
| Scottish | 970 | 1.3% |
| Serbian | 4 | 0.0% |
| Sioux | 56 | 0.1% |
| Slavic | 10 | 0.0% |
| Slovak | 8 | 0.0% |
| Slovene | 13 | 0.0% |
| South African | 16 | 0.0% |
| South American | 59 | 0.1% |
| Spaniard | 33 | 0.0% |
| Sri Lankan | 150 | 0.2% |
| Subsaharan African | 397 | 0.5% |
| Swedish | 31 | 0.0% |
| Swiss | 17 | 0.0% |
| Syrian | 2 | 0.0% |
| Thai | 218 | 0.3% |
| Turkish | 12 | 0.0% |
| Venezuelan | 50 | 0.1% |
| Welsh | 633 | 0.9% | View All 77 Rows |
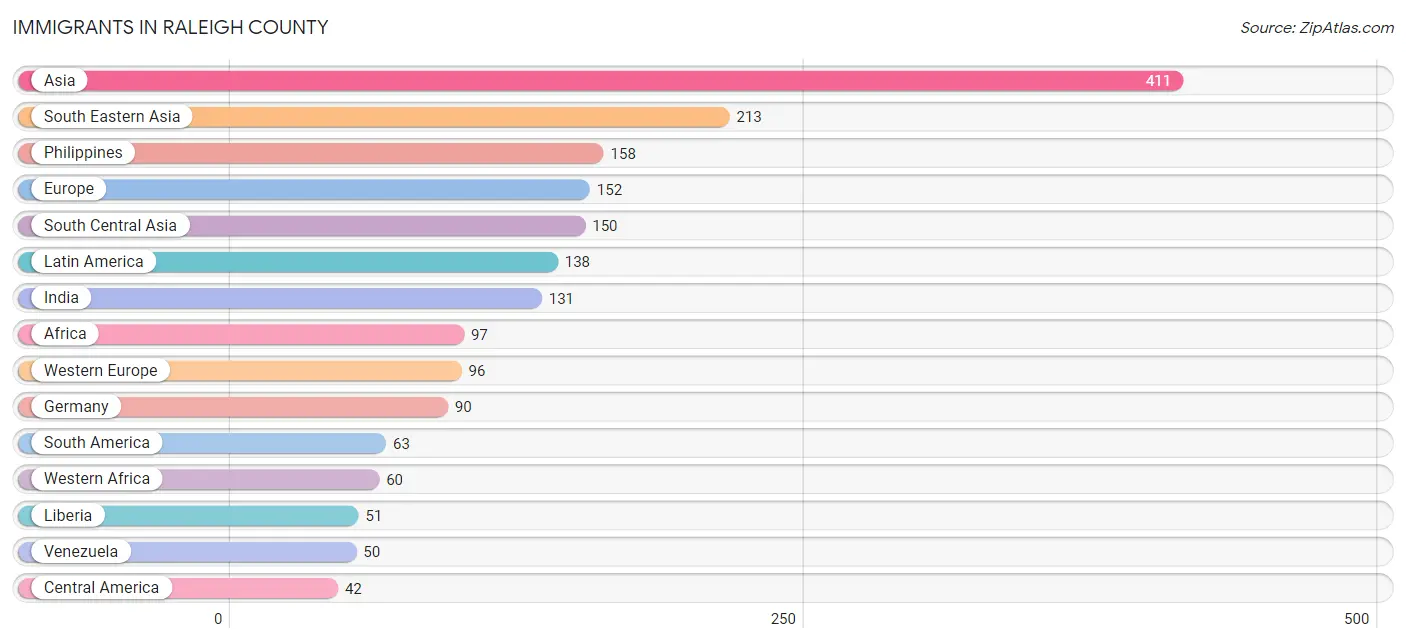
Immigrants in Raleigh County
The most numerous immigrant groups reported in Raleigh County came from Asia (411 | 0.5%), South Eastern Asia (213 | 0.3%), Philippines (158 | 0.2%), Europe (152 | 0.2%), and South Central Asia (150 | 0.2%), together accounting for 1.4% of all Raleigh County residents.
| Immigration Origin | # Population | % Population |
| Africa | 97 | 0.1% |
| Asia | 411 | 0.5% |
| Australia | 31 | 0.0% |
| Brazil | 13 | 0.0% |
| Canada | 19 | 0.0% |
| Caribbean | 33 | 0.0% |
| Central America | 42 | 0.1% |
| China | 7 | 0.0% |
| Cuba | 13 | 0.0% |
| Dominican Republic | 9 | 0.0% |
| Eastern Africa | 9 | 0.0% |
| Eastern Asia | 20 | 0.0% |
| Eastern Europe | 30 | 0.0% |
| Egypt | 12 | 0.0% |
| El Salvador | 3 | 0.0% |
| England | 14 | 0.0% |
| Europe | 152 | 0.2% |
| Germany | 90 | 0.1% |
| Ghana | 9 | 0.0% |
| India | 131 | 0.2% |
| Iran | 9 | 0.0% |
| Israel | 10 | 0.0% |
| Italy | 12 | 0.0% |
| Jamaica | 11 | 0.0% |
| Kazakhstan | 10 | 0.0% |
| Korea | 13 | 0.0% |
| Latin America | 138 | 0.2% |
| Liberia | 51 | 0.1% |
| Mexico | 39 | 0.1% |
| Northern Africa | 12 | 0.0% |
| Northern Europe | 14 | 0.0% |
| Oceania | 31 | 0.0% |
| Philippines | 158 | 0.2% |
| Russia | 20 | 0.0% |
| Somalia | 9 | 0.0% |
| South Africa | 16 | 0.0% |
| South America | 63 | 0.1% |
| South Central Asia | 150 | 0.2% |
| South Eastern Asia | 213 | 0.3% |
| Southern Europe | 12 | 0.0% |
| Switzerland | 6 | 0.0% |
| Syria | 18 | 0.0% |
| Thailand | 20 | 0.0% |
| Ukraine | 5 | 0.0% |
| Venezuela | 50 | 0.1% |
| Vietnam | 35 | 0.1% |
| Western Africa | 60 | 0.1% |
| Western Asia | 28 | 0.0% |
| Western Europe | 96 | 0.1% | View All 49 Rows |
Sex and Age in Raleigh County
Sex and Age in Raleigh County
The most populous age groups in Raleigh County are 65 to 69 Years (2,555 | 6.8%) for men and 60 to 64 Years (2,659 | 7.2%) for women.
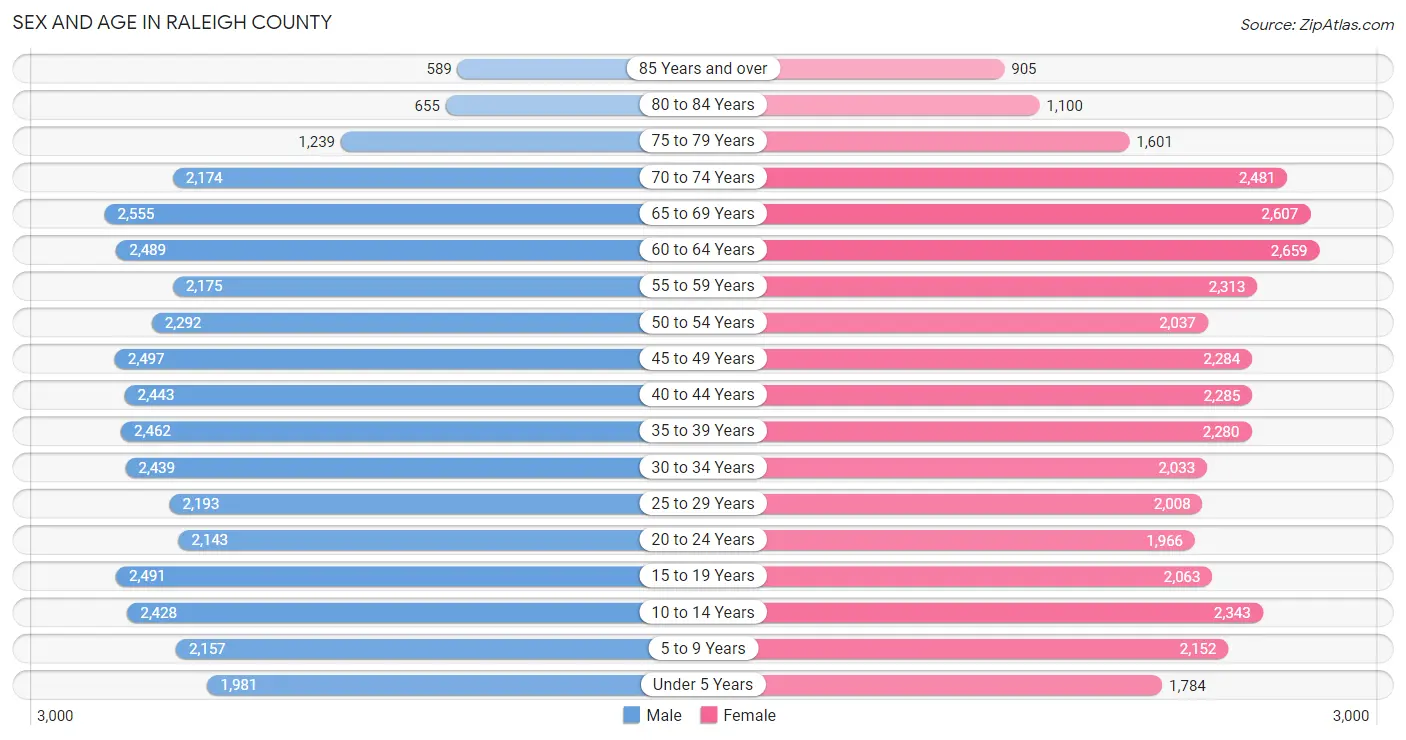
| Age Bracket | Male | Female |
| Under 5 Years | 1,981 (5.3%) | 1,784 (4.8%) |
| 5 to 9 Years | 2,157 (5.8%) | 2,152 (5.8%) |
| 10 to 14 Years | 2,428 (6.5%) | 2,343 (6.4%) |
| 15 to 19 Years | 2,491 (6.7%) | 2,063 (5.6%) |
| 20 to 24 Years | 2,143 (5.7%) | 1,966 (5.3%) |
| 25 to 29 Years | 2,193 (5.9%) | 2,008 (5.4%) |
| 30 to 34 Years | 2,439 (6.5%) | 2,033 (5.5%) |
| 35 to 39 Years | 2,462 (6.6%) | 2,280 (6.2%) |
| 40 to 44 Years | 2,443 (6.5%) | 2,285 (6.2%) |
| 45 to 49 Years | 2,497 (6.7%) | 2,284 (6.2%) |
| 50 to 54 Years | 2,292 (6.1%) | 2,037 (5.5%) |
| 55 to 59 Years | 2,175 (5.8%) | 2,313 (6.3%) |
| 60 to 64 Years | 2,489 (6.7%) | 2,659 (7.2%) |
| 65 to 69 Years | 2,555 (6.8%) | 2,607 (7.1%) |
| 70 to 74 Years | 2,174 (5.8%) | 2,481 (6.7%) |
| 75 to 79 Years | 1,239 (3.3%) | 1,601 (4.3%) |
| 80 to 84 Years | 655 (1.8%) | 1,100 (3.0%) |
| 85 Years and over | 589 (1.6%) | 905 (2.5%) |
| Total | 37,402 (100.0%) | 36,901 (100.0%) |
Families and Households in Raleigh County
Median Family Size in Raleigh County
The median family size in Raleigh County is 3.04 persons per family, with single male/father families (1,347 | 7.2%) accounting for the largest median family size of 3.39 persons per family. On the other hand, married-couple families (13,703 | 73.2%) represent the smallest median family size with 2.97 persons per family.
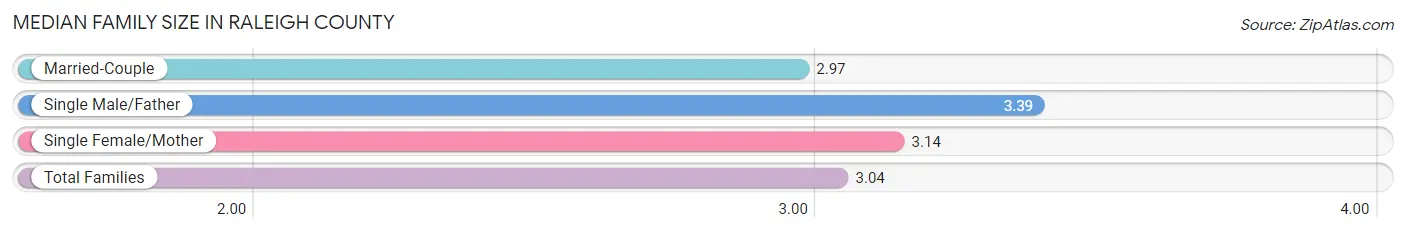
| Family Type | # Families | Family Size |
| Married-Couple | 13,703 (73.2%) | 2.97 |
| Single Male/Father | 1,347 (7.2%) | 3.39 |
| Single Female/Mother | 3,680 (19.7%) | 3.14 |
| Total Families | 18,730 (100.0%) | 3.04 |
Median Household Size in Raleigh County
The median household size in Raleigh County is 2.42 persons per household, with single male/father households (1,347 | 4.6%) accounting for the largest median household size of 3.63 persons per household. non-family households (10,665 | 36.3%) represent the smallest median household size with 1.16 persons per household.
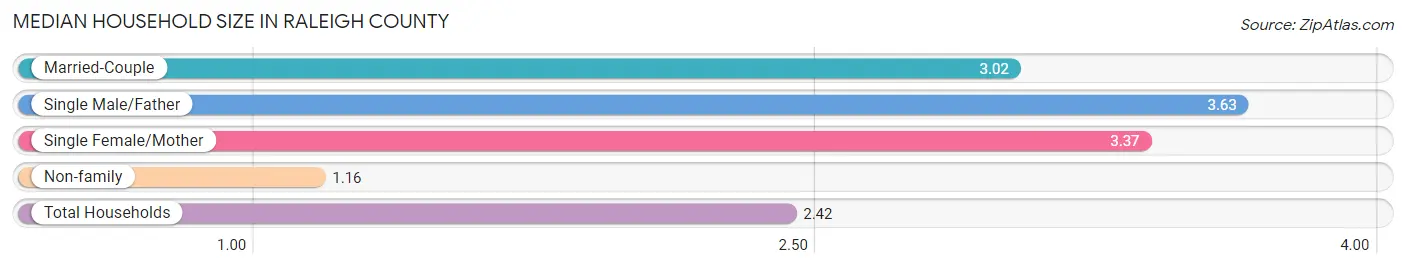
| Household Type | # Households | Household Size |
| Married-Couple | 13,703 (46.6%) | 3.02 |
| Single Male/Father | 1,347 (4.6%) | 3.63 |
| Single Female/Mother | 3,680 (12.5%) | 3.37 |
| Non-family | 10,665 (36.3%) | 1.16 |
| Total Households | 29,395 (100.0%) | 2.42 |
Household Size by Marriage Status in Raleigh County
Out of a total of 29,395 households in Raleigh County, 18,730 (63.7%) are family households, while 10,665 (36.3%) are nonfamily households. The most numerous type of family households are 2-person households, comprising 9,141, and the most common type of nonfamily households are 1-person households, comprising 9,277.
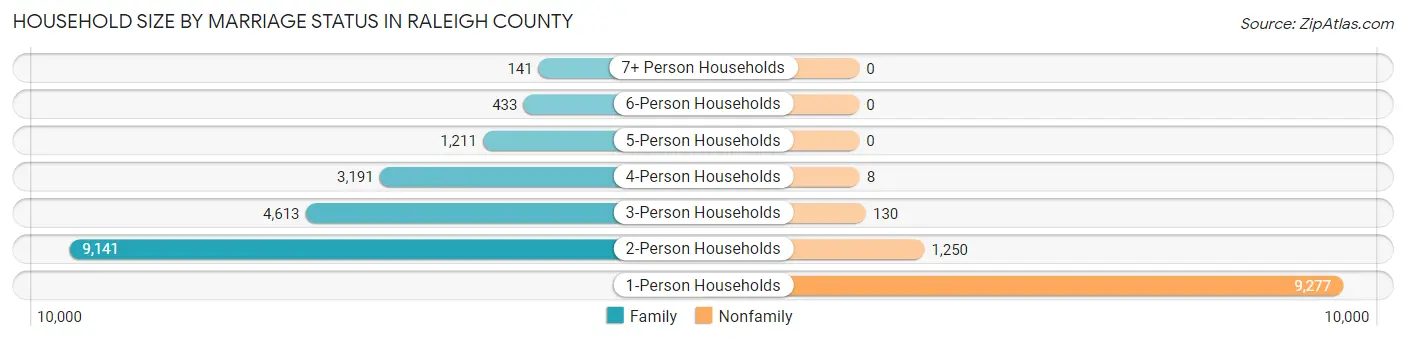
| Household Size | Family Households | Nonfamily Households |
| 1-Person Households | - | 9,277 (31.6%) |
| 2-Person Households | 9,141 (31.1%) | 1,250 (4.3%) |
| 3-Person Households | 4,613 (15.7%) | 130 (0.4%) |
| 4-Person Households | 3,191 (10.9%) | 8 (0.0%) |
| 5-Person Households | 1,211 (4.1%) | 0 (0.0%) |
| 6-Person Households | 433 (1.5%) | 0 (0.0%) |
| 7+ Person Households | 141 (0.5%) | 0 (0.0%) |
| Total | 18,730 (63.7%) | 10,665 (36.3%) |
Female Fertility in Raleigh County
Fertility by Age in Raleigh County
Average fertility rate in Raleigh County is 36.0 births per 1,000 women. Women in the age bracket of 20 to 34 years have the highest fertility rate with 61.0 births per 1,000 women. Women in the age bracket of 20 to 34 years acount for 66.8% of all women with births.
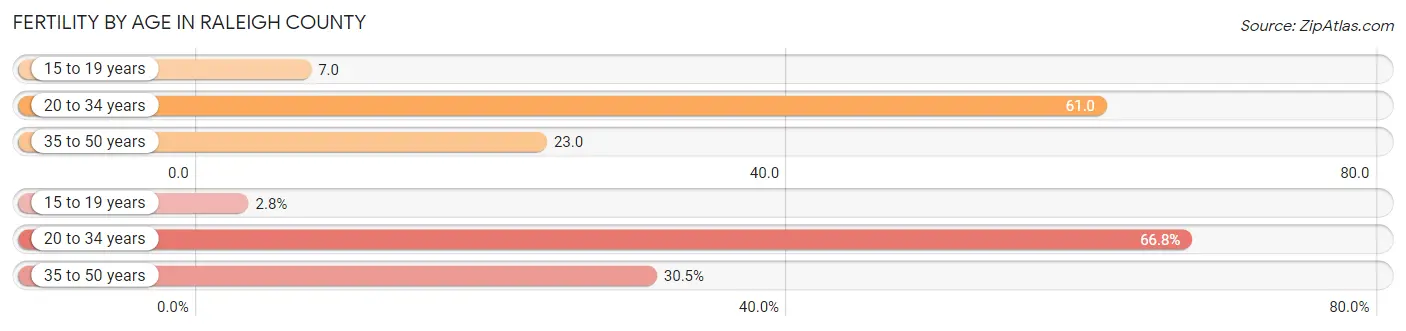
| Age Bracket | Women with Births | Births / 1,000 Women |
| 15 to 19 years | 15 (2.8%) | 7.0 |
| 20 to 34 years | 364 (66.8%) | 61.0 |
| 35 to 50 years | 166 (30.5%) | 23.0 |
| Total | 545 (100.0%) | 36.0 |
Fertility by Age by Marriage Status in Raleigh County
43.9% of women with births (545) in Raleigh County are married. The highest percentage of unmarried women with births falls into 20 to 34 years age bracket with 59.3% of them unmarried at the time of birth, while the lowest percentage of unmarried women with births belong to 15 to 19 years age bracket with 0.0% of them unmarried.
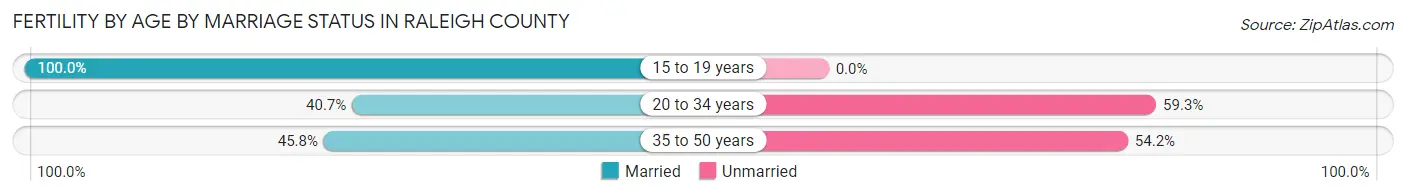
| Age Bracket | Married | Unmarried |
| 15 to 19 years | 15 (100.0%) | 0 (0.0%) |
| 20 to 34 years | 148 (40.7%) | 216 (59.3%) |
| 35 to 50 years | 76 (45.8%) | 90 (54.2%) |
| Total | 239 (43.9%) | 306 (56.1%) |
Fertility by Education in Raleigh County
Average fertility rate in Raleigh County is 36.0 births per 1,000 women. Women with the education attainment of college or associate's degree have the highest fertility rate of 64.0 births per 1,000 women, while women with the education attainment of less than high school have the lowest fertility at 1.0 births per 1,000 women. Women with the education attainment of college or associate's degree represent 58.9% of all women with births.
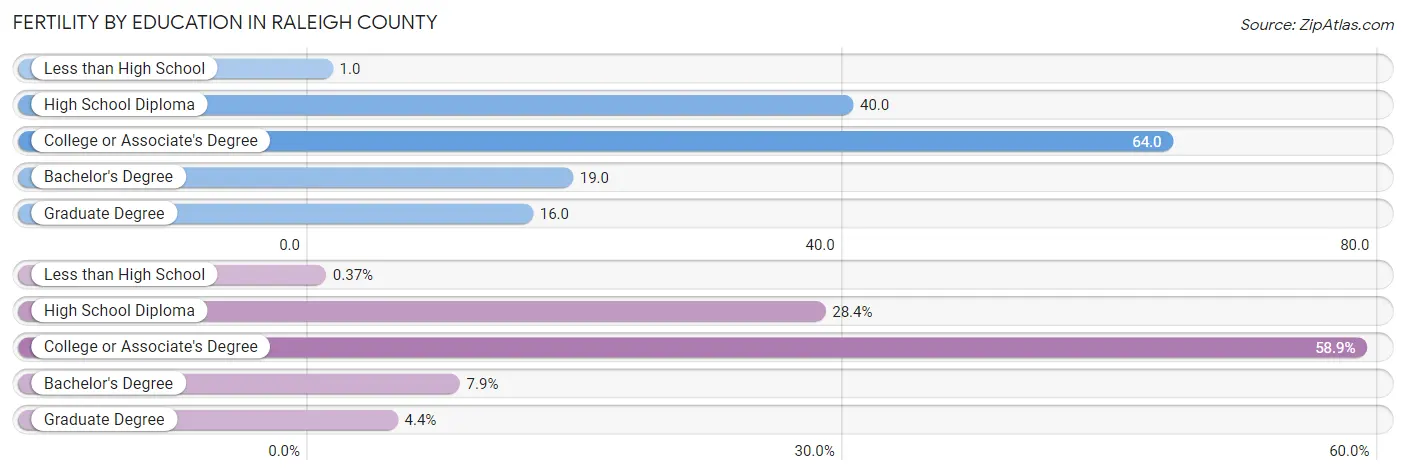
| Educational Attainment | Women with Births | Births / 1,000 Women |
| Less than High School | 2 (0.4%) | 1.0 |
| High School Diploma | 155 (28.4%) | 40.0 |
| College or Associate's Degree | 321 (58.9%) | 64.0 |
| Bachelor's Degree | 43 (7.9%) | 19.0 |
| Graduate Degree | 24 (4.4%) | 16.0 |
| Total | 545 (100.0%) | 36.0 |
Fertility by Education by Marriage Status in Raleigh County
56.1% of women with births in Raleigh County are unmarried. Women with the educational attainment of graduate degree are most likely to be married with 100.0% of them married at childbirth, while women with the educational attainment of less than high school are least likely to be married with 100.0% of them unmarried at childbirth.
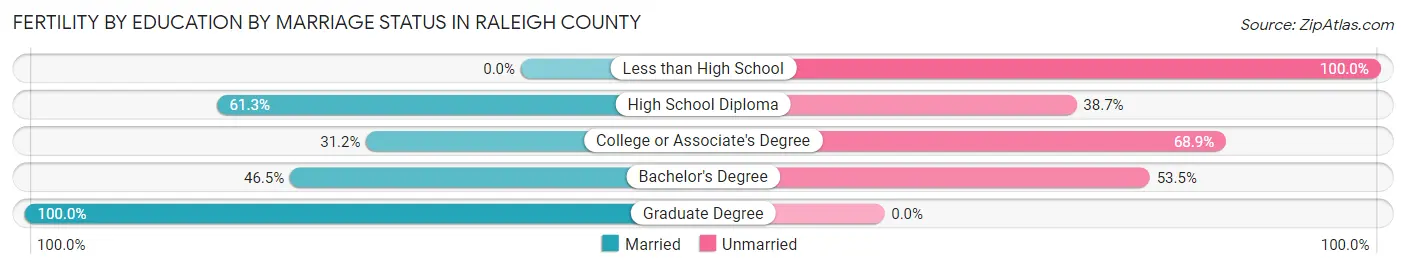
| Educational Attainment | Married | Unmarried |
| Less than High School | 0 (0.0%) | 2 (100.0%) |
| High School Diploma | 95 (61.3%) | 60 (38.7%) |
| College or Associate's Degree | 100 (31.1%) | 221 (68.9%) |
| Bachelor's Degree | 20 (46.5%) | 23 (53.5%) |
| Graduate Degree | 24 (100.0%) | 0 (0.0%) |
| Total | 239 (43.9%) | 306 (56.1%) |
Income in Raleigh County
Income Overview in Raleigh County
Per Capita Income in Raleigh County is $27,724, while median incomes of families and households are $65,294 and $47,975 respectively.
| Characteristic | Number | Measure |
| Per Capita Income | 74,303 | $27,724 |
| Median Family Income | 18,730 | $65,294 |
| Mean Family Income | 18,730 | $81,224 |
| Median Household Income | 29,395 | $47,975 |
| Mean Household Income | 29,395 | $67,591 |
| Income Deficit | 18,730 | $12,071 |
| Wage / Income Gap (%) | 74,303 | 30.38% |
| Wage / Income Gap ($) | 74,303 | 69.62¢ per $1 |
| Gini / Inequality Index | 74,303 | 0.49 |
Earnings by Sex in Raleigh County
Average Earnings in Raleigh County are $33,855, $41,155 for men and $28,651 for women, a difference of 30.4%.
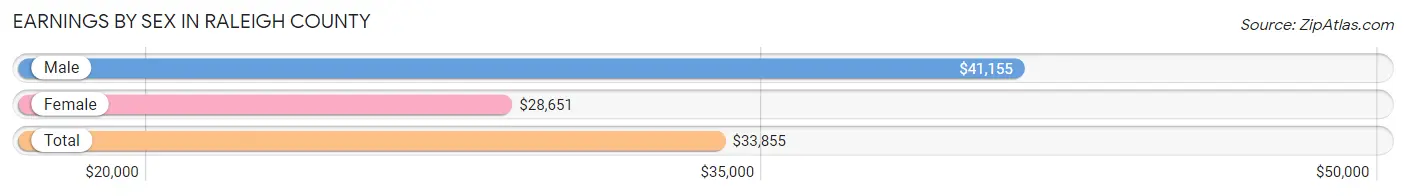
| Sex | Number | Average Earnings |
| Male | 16,067 (52.4%) | $41,155 |
| Female | 14,610 (47.6%) | $28,651 |
| Total | 30,677 (100.0%) | $33,855 |
Earnings by Sex by Income Bracket in Raleigh County
The most common earnings brackets in Raleigh County are $100,000+ for men (1,922 | 12.0%) and $30,000 to $34,999 for women (1,208 | 8.3%).
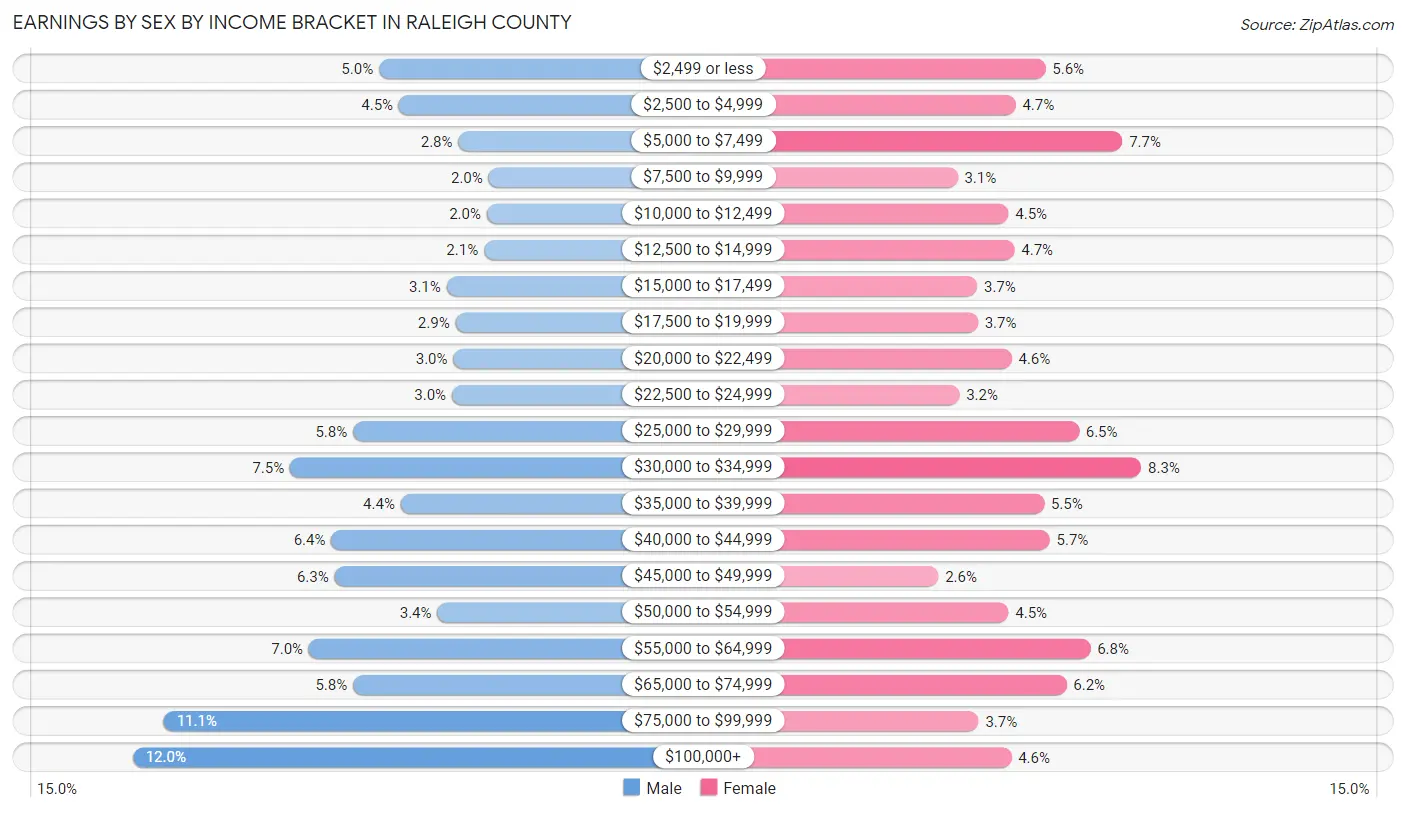
| Income | Male | Female |
| $2,499 or less | 810 (5.0%) | 815 (5.6%) |
| $2,500 to $4,999 | 720 (4.5%) | 692 (4.7%) |
| $5,000 to $7,499 | 451 (2.8%) | 1,131 (7.7%) |
| $7,500 to $9,999 | 315 (2.0%) | 454 (3.1%) |
| $10,000 to $12,499 | 323 (2.0%) | 664 (4.5%) |
| $12,500 to $14,999 | 335 (2.1%) | 688 (4.7%) |
| $15,000 to $17,499 | 505 (3.1%) | 535 (3.7%) |
| $17,500 to $19,999 | 464 (2.9%) | 537 (3.7%) |
| $20,000 to $22,499 | 474 (2.9%) | 676 (4.6%) |
| $22,500 to $24,999 | 481 (3.0%) | 461 (3.2%) |
| $25,000 to $29,999 | 927 (5.8%) | 952 (6.5%) |
| $30,000 to $34,999 | 1,212 (7.5%) | 1,208 (8.3%) |
| $35,000 to $39,999 | 711 (4.4%) | 809 (5.5%) |
| $40,000 to $44,999 | 1,025 (6.4%) | 833 (5.7%) |
| $45,000 to $49,999 | 1,010 (6.3%) | 375 (2.6%) |
| $50,000 to $54,999 | 547 (3.4%) | 663 (4.5%) |
| $55,000 to $64,999 | 1,126 (7.0%) | 999 (6.8%) |
| $65,000 to $74,999 | 927 (5.8%) | 902 (6.2%) |
| $75,000 to $99,999 | 1,782 (11.1%) | 541 (3.7%) |
| $100,000+ | 1,922 (12.0%) | 675 (4.6%) |
| Total | 16,067 (100.0%) | 14,610 (100.0%) |
Earnings by Sex by Educational Attainment in Raleigh County
Average earnings in Raleigh County are $45,595 for men and $31,992 for women, a difference of 29.8%. Men with an educational attainment of graduate degree enjoy the highest average annual earnings of $89,572, while those with less than high school education earn the least with $24,408. Women with an educational attainment of bachelor's degree earn the most with the average annual earnings of $55,581, while those with less than high school education have the smallest earnings of $14,794.
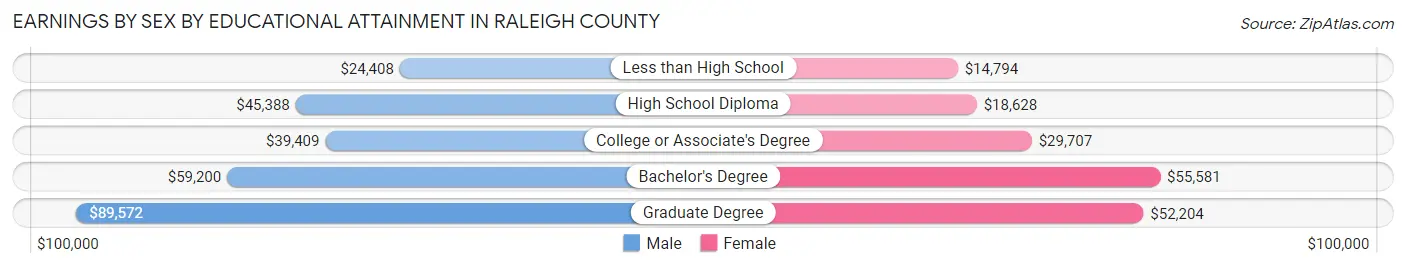
| Educational Attainment | Male Income | Female Income |
| Less than High School | $24,408 | $14,794 |
| High School Diploma | $45,388 | $18,628 |
| College or Associate's Degree | $39,409 | $29,707 |
| Bachelor's Degree | $59,200 | $55,581 |
| Graduate Degree | $89,572 | $52,204 |
| Total | $45,595 | $31,992 |
Family Income in Raleigh County
Family Income Brackets in Raleigh County
According to the Raleigh County family income data, there are 3,615 families falling into the $50,000 to $74,999 income range, which is the most common income bracket and makes up 19.3% of all families. Conversely, the $10,000 to $14,999 income bracket is the least frequent group with only 674 families (3.6%) belonging to this category.
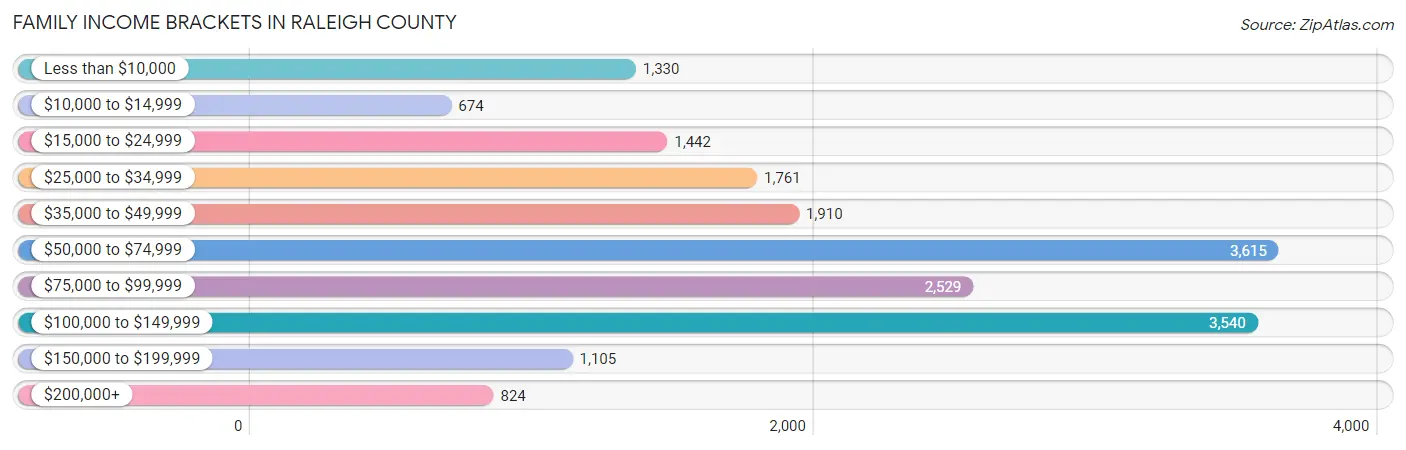
| Income Bracket | # Families | % Families |
| Less than $10,000 | 1,330 | 7.1% |
| $10,000 to $14,999 | 674 | 3.6% |
| $15,000 to $24,999 | 1,442 | 7.7% |
| $25,000 to $34,999 | 1,761 | 9.4% |
| $35,000 to $49,999 | 1,910 | 10.2% |
| $50,000 to $74,999 | 3,615 | 19.3% |
| $75,000 to $99,999 | 2,529 | 13.5% |
| $100,000 to $149,999 | 3,540 | 18.9% |
| $150,000 to $199,999 | 1,105 | 5.9% |
| $200,000+ | 824 | 4.4% |
Family Income by Famaliy Size in Raleigh County
6-person families (317 | 1.7%) account for the highest median family income in Raleigh County with $98,250 per family, while 2-person families (9,687 | 51.7%) have the highest median income of $28,594 per family member.
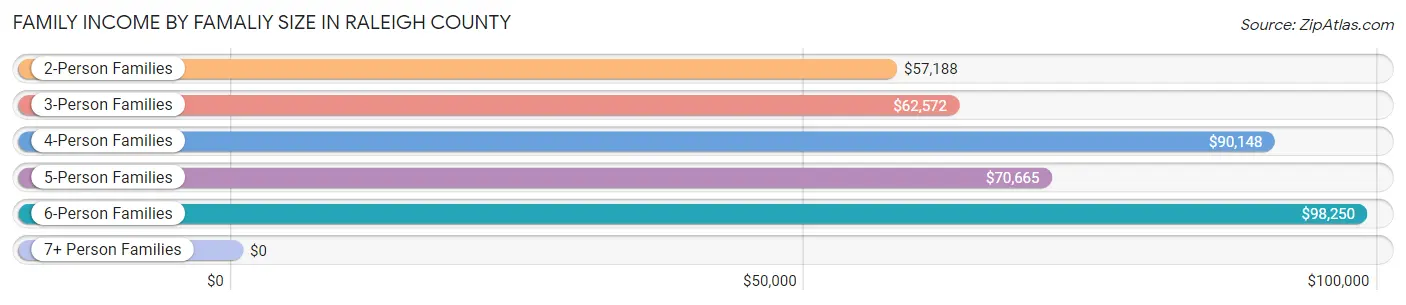
| Income Bracket | # Families | Median Income |
| 2-Person Families | 9,687 (51.7%) | $57,188 |
| 3-Person Families | 4,378 (23.4%) | $62,572 |
| 4-Person Families | 3,047 (16.3%) | $90,148 |
| 5-Person Families | 1,196 (6.4%) | $70,665 |
| 6-Person Families | 317 (1.7%) | $98,250 |
| 7+ Person Families | 105 (0.6%) | $0 |
| Total | 18,730 (100.0%) | $65,294 |
Family Income by Number of Earners in Raleigh County
The median family income in Raleigh County is $65,294, with families comprising 3+ earners (864) having the highest median family income of $117,209, while families with no earners (5,015) have the lowest median family income of $38,137, accounting for 4.6% and 26.8% of families, respectively.
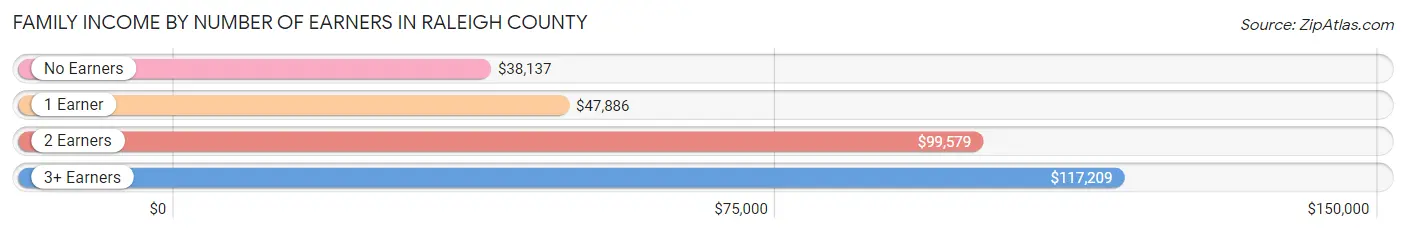
| Number of Earners | # Families | Median Income |
| No Earners | 5,015 (26.8%) | $38,137 |
| 1 Earner | 6,606 (35.3%) | $47,886 |
| 2 Earners | 6,245 (33.3%) | $99,579 |
| 3+ Earners | 864 (4.6%) | $117,209 |
| Total | 18,730 (100.0%) | $65,294 |
Household Income in Raleigh County
Household Income Brackets in Raleigh County
With 4,527 households falling in the category, the $50,000 to $74,999 income range is the most frequent in Raleigh County, accounting for 15.4% of all households. In contrast, only 941 households (3.2%) fall into the $200,000+ income bracket, making it the least populous group.
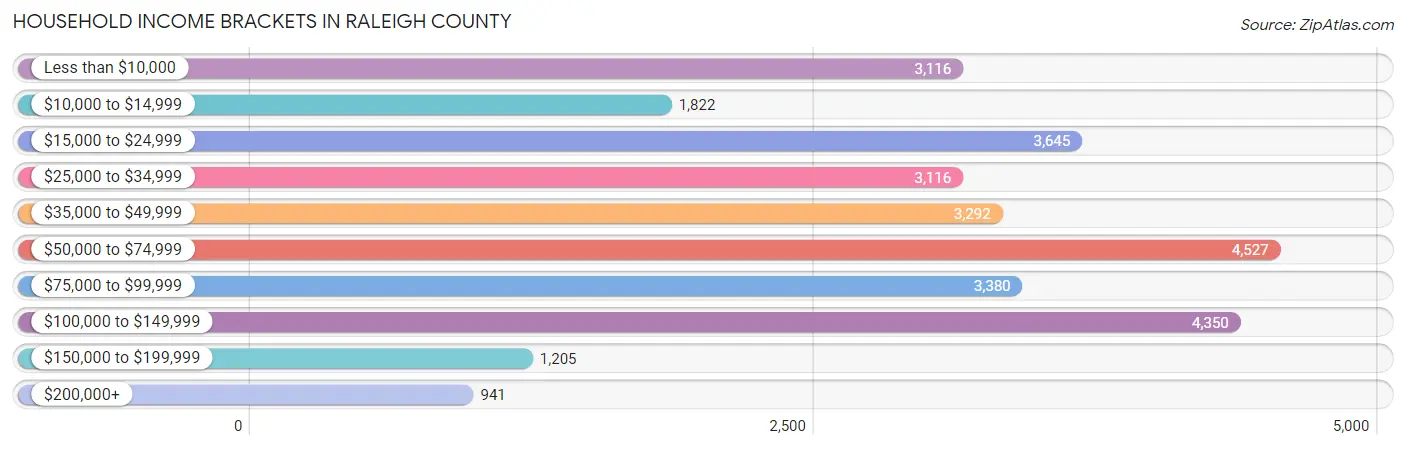
| Income Bracket | # Households | % Households |
| Less than $10,000 | 3,116 | 10.6% |
| $10,000 to $14,999 | 1,822 | 6.2% |
| $15,000 to $24,999 | 3,645 | 12.4% |
| $25,000 to $34,999 | 3,116 | 10.6% |
| $35,000 to $49,999 | 3,292 | 11.2% |
| $50,000 to $74,999 | 4,527 | 15.4% |
| $75,000 to $99,999 | 3,380 | 11.5% |
| $100,000 to $149,999 | 4,350 | 14.8% |
| $150,000 to $199,999 | 1,205 | 4.1% |
| $200,000+ | 941 | 3.2% |
Household Income by Householder Age in Raleigh County
The median household income in Raleigh County is $47,975, with the highest median household income of $70,355 found in the 25 to 44 years age bracket for the primary householder. A total of 7,812 households (26.6%) fall into this category. Meanwhile, the 15 to 24 years age bracket for the primary householder has the lowest median household income of $25,500, with 664 households (2.3%) in this group.
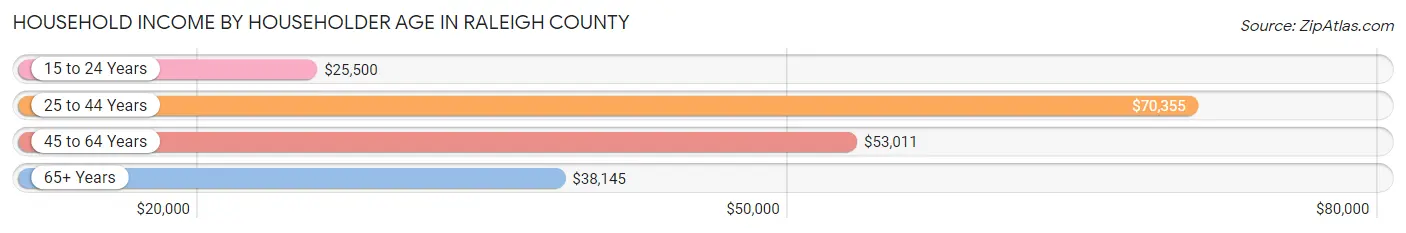
| Income Bracket | # Households | Median Income |
| 15 to 24 Years | 664 (2.3%) | $25,500 |
| 25 to 44 Years | 7,812 (26.6%) | $70,355 |
| 45 to 64 Years | 10,579 (36.0%) | $53,011 |
| 65+ Years | 10,340 (35.2%) | $38,145 |
| Total | 29,395 (100.0%) | $47,975 |
Poverty in Raleigh County
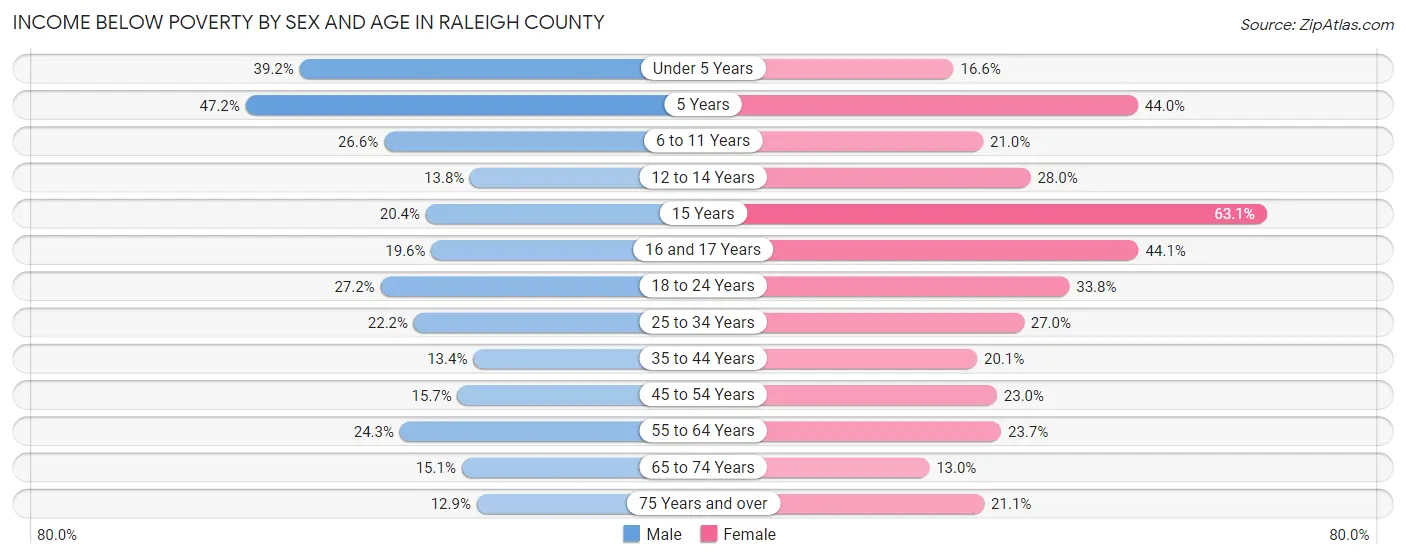
Income Below Poverty by Sex and Age in Raleigh County
With 20.5% poverty level for males and 23.5% for females among the residents of Raleigh County, 5 year old males and 15 year old females are the most vulnerable to poverty, with 268 males (47.2%) and 328 females (63.1%) in their respective age groups living below the poverty level.
| Age Bracket | Male | Female |
| Under 5 Years | 661 (39.2%) | 287 (16.6%) |
| 5 Years | 268 (47.2%) | 281 (44.0%) |
| 6 to 11 Years | 717 (26.6%) | 538 (21.0%) |
| 12 to 14 Years | 180 (13.8%) | 353 (28.0%) |
| 15 Years | 125 (20.4%) | 328 (63.1%) |
| 16 and 17 Years | 156 (19.6%) | 346 (44.1%) |
| 18 to 24 Years | 744 (27.2%) | 858 (33.8%) |
| 25 to 34 Years | 837 (22.2%) | 1,075 (27.0%) |
| 35 to 44 Years | 572 (13.4%) | 894 (20.1%) |
| 45 to 54 Years | 713 (15.7%) | 995 (23.0%) |
| 55 to 64 Years | 1,115 (24.3%) | 1,169 (23.7%) |
| 65 to 74 Years | 701 (15.1%) | 655 (13.0%) |
| 75 Years and over | 312 (12.9%) | 733 (21.1%) |
| Total | 7,101 (20.5%) | 8,512 (23.5%) |
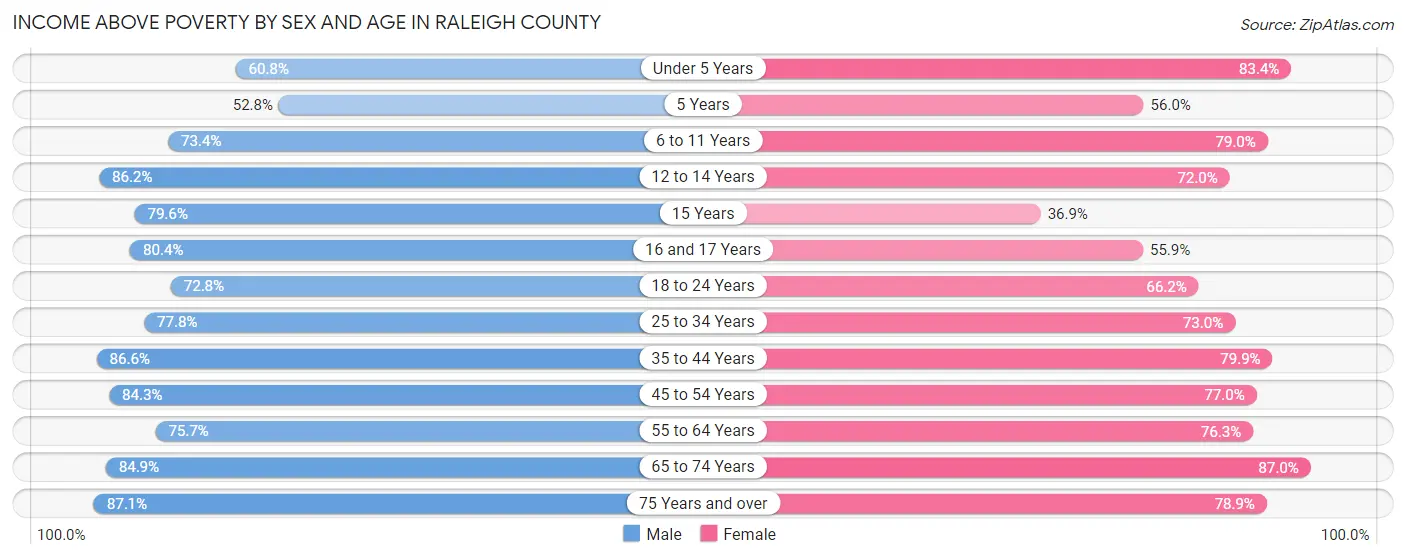
Income Above Poverty by Sex and Age in Raleigh County
According to the poverty statistics in Raleigh County, males aged 75 years and over and females aged 65 to 74 years are the age groups that are most secure financially, with 87.1% of males and 87.0% of females in these age groups living above the poverty line.
| Age Bracket | Male | Female |
| Under 5 Years | 1,027 (60.8%) | 1,442 (83.4%) |
| 5 Years | 300 (52.8%) | 358 (56.0%) |
| 6 to 11 Years | 1,975 (73.4%) | 2,027 (79.0%) |
| 12 to 14 Years | 1,121 (86.2%) | 907 (72.0%) |
| 15 Years | 487 (79.6%) | 192 (36.9%) |
| 16 and 17 Years | 640 (80.4%) | 439 (55.9%) |
| 18 to 24 Years | 1,995 (72.8%) | 1,682 (66.2%) |
| 25 to 34 Years | 2,934 (77.8%) | 2,903 (73.0%) |
| 35 to 44 Years | 3,703 (86.6%) | 3,558 (79.9%) |
| 45 to 54 Years | 3,828 (84.3%) | 3,326 (77.0%) |
| 55 to 64 Years | 3,475 (75.7%) | 3,771 (76.3%) |
| 65 to 74 Years | 3,944 (84.9%) | 4,390 (87.0%) |
| 75 Years and over | 2,115 (87.1%) | 2,734 (78.9%) |
| Total | 27,544 (79.5%) | 27,729 (76.5%) |
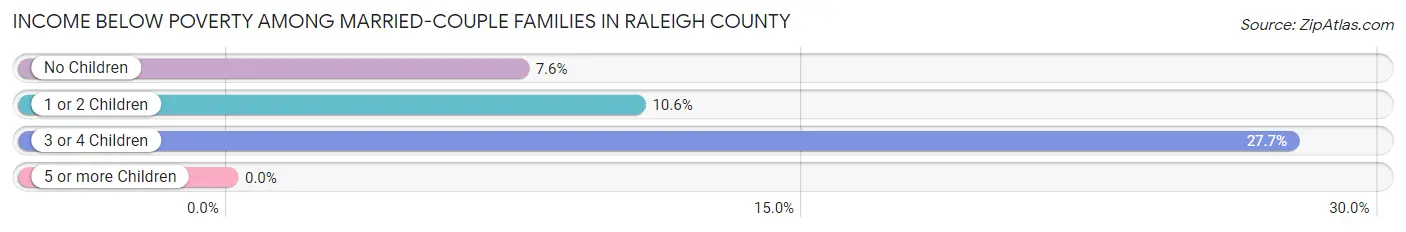
Income Below Poverty Among Married-Couple Families in Raleigh County
The poverty statistics for married-couple families in Raleigh County show that 9.9% or 1,361 of the total 13,703 families live below the poverty line. Families with 3 or 4 children have the highest poverty rate of 27.7%, comprising of 259 families. On the other hand, families with 5 or more children have the lowest poverty rate of 0.0%, which includes 0 families.
| Children | Above Poverty | Below Poverty |
| No Children | 7,690 (92.4%) | 632 (7.6%) |
| 1 or 2 Children | 3,946 (89.4%) | 470 (10.6%) |
| 3 or 4 Children | 676 (72.3%) | 259 (27.7%) |
| 5 or more Children | 30 (100.0%) | 0 (0.0%) |
| Total | 12,342 (90.1%) | 1,361 (9.9%) |
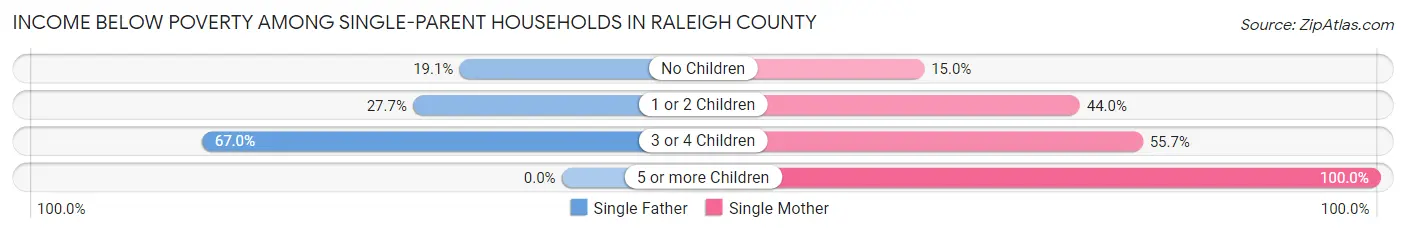
Income Below Poverty Among Single-Parent Households in Raleigh County
According to the poverty data in Raleigh County, 26.0% or 350 single-father households and 36.5% or 1,343 single-mother households are living below the poverty line. Among single-father households, those with 3 or 4 children have the highest poverty rate, with 69 households (67.0%) experiencing poverty. Likewise, among single-mother households, those with 5 or more children have the highest poverty rate, with 44 households (100.0%) falling below the poverty line.
| Children | Single Father | Single Mother |
| No Children | 140 (19.1%) | 183 (15.0%) |
| 1 or 2 Children | 141 (27.7%) | 862 (44.0%) |
| 3 or 4 Children | 69 (67.0%) | 254 (55.7%) |
| 5 or more Children | 0 (0.0%) | 44 (100.0%) |
| Total | 350 (26.0%) | 1,343 (36.5%) |
Income Below Poverty Among Married-Couple vs Single-Parent Households in Raleigh County
The poverty data for Raleigh County shows that 1,361 of the married-couple family households (9.9%) and 1,693 of the single-parent households (33.7%) are living below the poverty level. Within the married-couple family households, those with 3 or 4 children have the highest poverty rate, with 259 households (27.7%) falling below the poverty line. Among the single-parent households, those with 5 or more children have the highest poverty rate, with 44 household (100.0%) living below poverty.
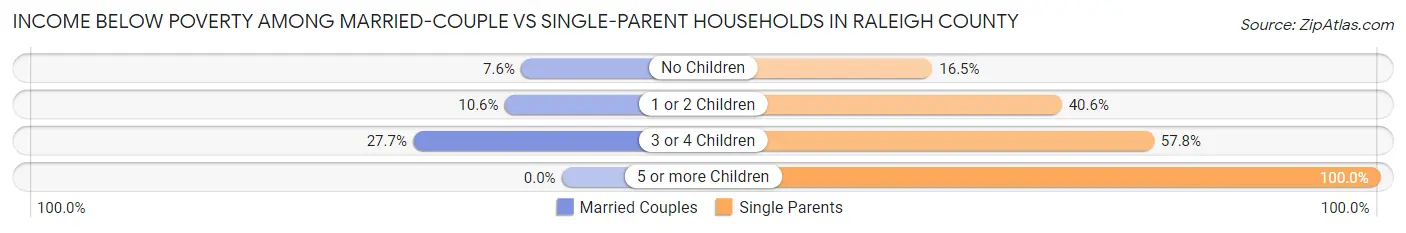
| Children | Married-Couple Families | Single-Parent Households |
| No Children | 632 (7.6%) | 323 (16.5%) |
| 1 or 2 Children | 470 (10.6%) | 1,003 (40.6%) |
| 3 or 4 Children | 259 (27.7%) | 323 (57.8%) |
| 5 or more Children | 0 (0.0%) | 44 (100.0%) |
| Total | 1,361 (9.9%) | 1,693 (33.7%) |
Employment Characteristics in Raleigh County
Employment by Class of Employer in Raleigh County
Among the 26,338 employed individuals in Raleigh County, private company employees (17,371 | 65.9%), local government employees (2,127 | 8.1%), and state government employees (1,708 | 6.5%) make up the most common classes of employment.
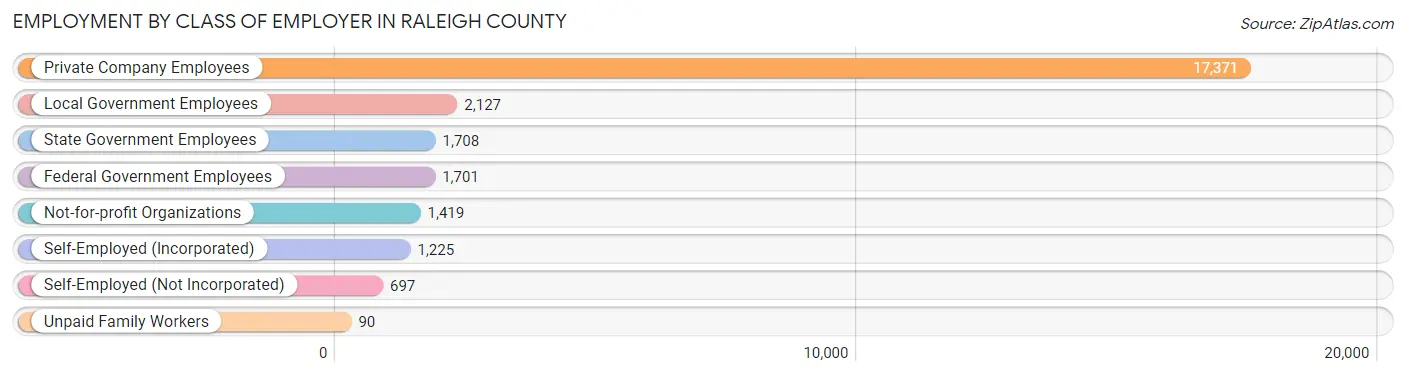
| Employer Class | # Employees | % Employees |
| Private Company Employees | 17,371 | 65.9% |
| Self-Employed (Incorporated) | 1,225 | 4.6% |
| Self-Employed (Not Incorporated) | 697 | 2.6% |
| Not-for-profit Organizations | 1,419 | 5.4% |
| Local Government Employees | 2,127 | 8.1% |
| State Government Employees | 1,708 | 6.5% |
| Federal Government Employees | 1,701 | 6.5% |
| Unpaid Family Workers | 90 | 0.3% |
| Total | 26,338 | 100.0% |
Employment Status by Age in Raleigh County
According to the labor force statistics for Raleigh County, out of the total population over 16 years of age (60,323), 48.1% or 29,015 individuals are in the labor force, with 7.1% or 2,060 of them unemployed. The age group with the highest labor force participation rate is 25 to 29 years, with 71.6% or 3,008 individuals in the labor force. Within the labor force, the 20 to 24 years age range has the highest percentage of unemployed individuals, with 14.4% or 356 of them being unemployed.
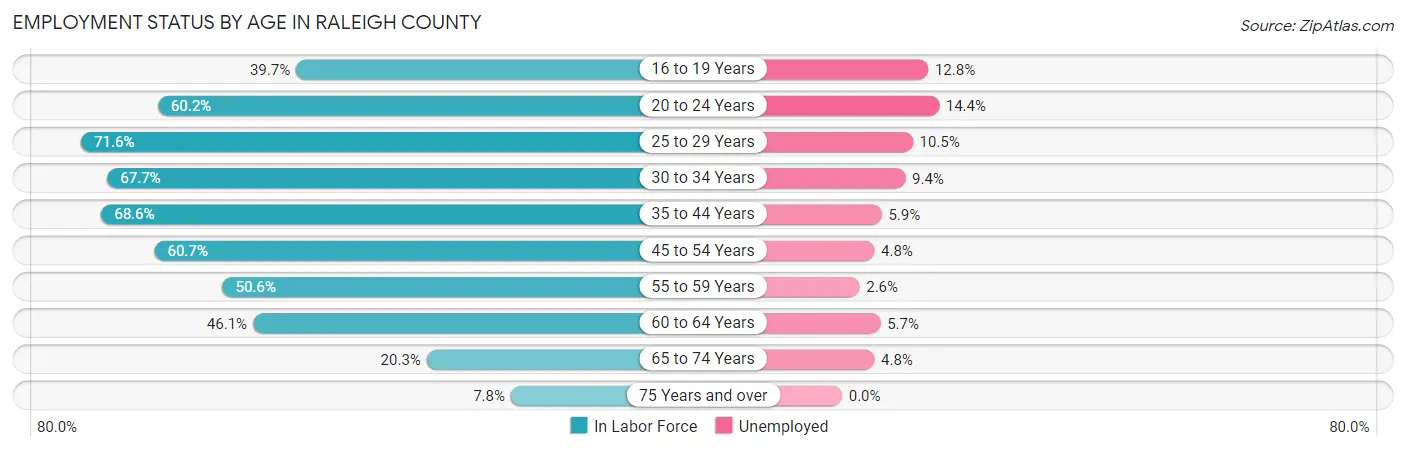
| Age Bracket | In Labor Force | Unemployed |
| 16 to 19 Years | 1,357 (39.7%) | 174 (12.8%) |
| 20 to 24 Years | 2,474 (60.2%) | 356 (14.4%) |
| 25 to 29 Years | 3,008 (71.6%) | 316 (10.5%) |
| 30 to 34 Years | 3,028 (67.7%) | 285 (9.4%) |
| 35 to 44 Years | 6,496 (68.6%) | 383 (5.9%) |
| 45 to 54 Years | 5,530 (60.7%) | 265 (4.8%) |
| 55 to 59 Years | 2,271 (50.6%) | 59 (2.6%) |
| 60 to 64 Years | 2,373 (46.1%) | 135 (5.7%) |
| 65 to 74 Years | 1,993 (20.3%) | 96 (4.8%) |
| 75 Years and over | 475 (7.8%) | 0 (0.0%) |
| Total | 29,015 (48.1%) | 2,060 (7.1%) |
Employment Status by Educational Attainment in Raleigh County
According to labor force statistics for Raleigh County, 61.5% of individuals (22,687) out of the total population between 25 and 64 years of age (36,889) are in the labor force, with 6.3% or 1,429 of them being unemployed. The group with the highest labor force participation rate are those with the educational attainment of bachelor's degree or higher, with 84.5% or 6,819 individuals in the labor force. Within the labor force, individuals with less than high school education have the highest percentage of unemployment, with 16.2% or 195 of them being unemployed.
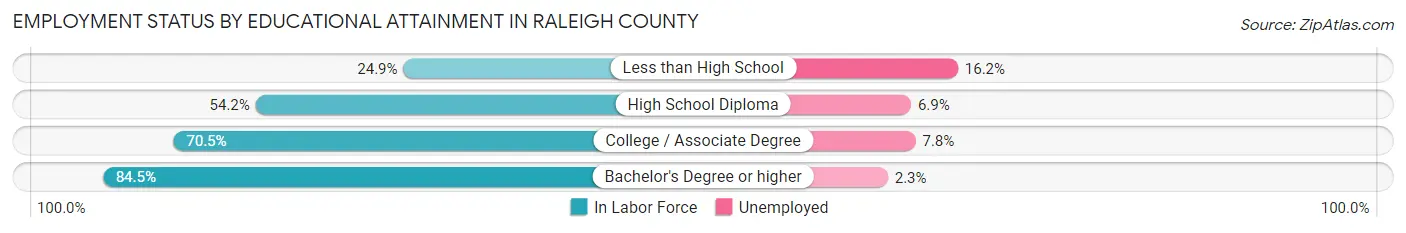
| Educational Attainment | In Labor Force | Unemployed |
| Less than High School | 1,206 (24.9%) | 784 (16.2%) |
| High School Diploma | 7,413 (54.2%) | 944 (6.9%) |
| College / Associate Degree | 7,261 (70.5%) | 803 (7.8%) |
| Bachelor's Degree or higher | 6,819 (84.5%) | 186 (2.3%) |
| Total | 22,687 (61.5%) | 2,324 (6.3%) |
Employment Occupations by Sex in Raleigh County
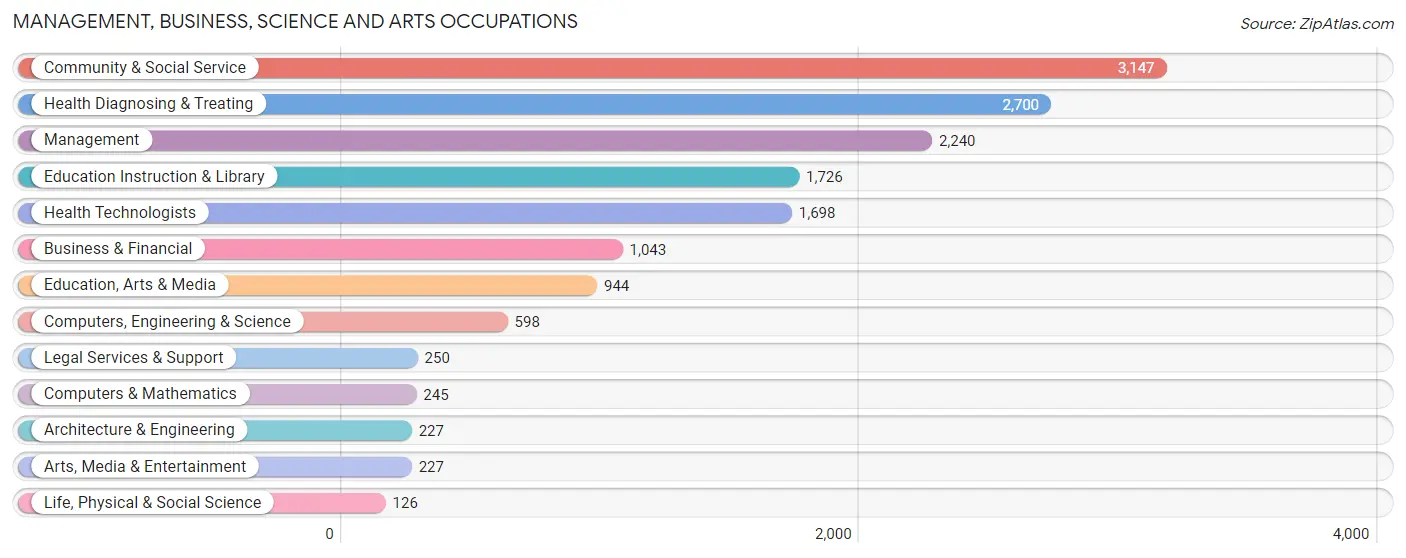
Management, Business, Science and Arts Occupations
The most common Management, Business, Science and Arts occupations in Raleigh County are Community & Social Service (3,147 | 11.7%), Health Diagnosing & Treating (2,700 | 10.1%), Management (2,240 | 8.4%), Education Instruction & Library (1,726 | 6.4%), and Health Technologists (1,698 | 6.3%).
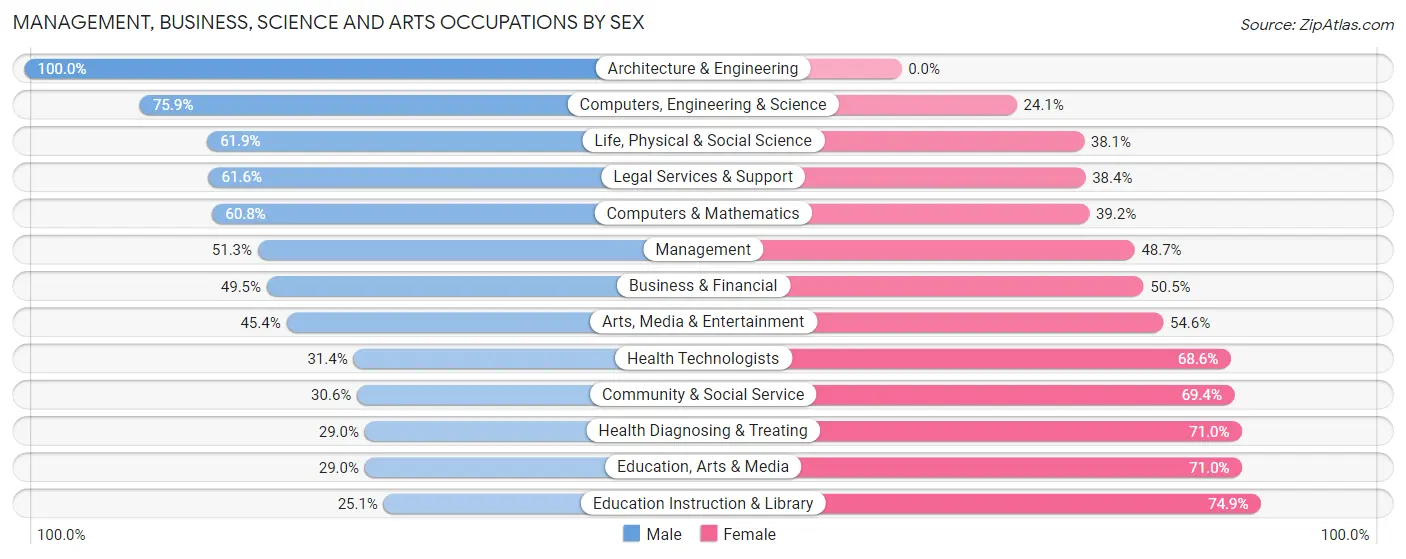
Management, Business, Science and Arts Occupations by Sex
Within the Management, Business, Science and Arts occupations in Raleigh County, the most male-oriented occupations are Architecture & Engineering (100.0%), Computers, Engineering & Science (75.9%), and Life, Physical & Social Science (61.9%), while the most female-oriented occupations are Education Instruction & Library (74.9%), Education, Arts & Media (71.0%), and Health Diagnosing & Treating (71.0%).
| Occupation | Male | Female |
| Management | 1,150 (51.3%) | 1,090 (48.7%) |
| Business & Financial | 516 (49.5%) | 527 (50.5%) |
| Computers, Engineering & Science | 454 (75.9%) | 144 (24.1%) |
| Computers & Mathematics | 149 (60.8%) | 96 (39.2%) |
| Architecture & Engineering | 227 (100.0%) | 0 (0.0%) |
| Life, Physical & Social Science | 78 (61.9%) | 48 (38.1%) |
| Community & Social Service | 964 (30.6%) | 2,183 (69.4%) |
| Education, Arts & Media | 274 (29.0%) | 670 (71.0%) |
| Legal Services & Support | 154 (61.6%) | 96 (38.4%) |
| Education Instruction & Library | 433 (25.1%) | 1,293 (74.9%) |
| Arts, Media & Entertainment | 103 (45.4%) | 124 (54.6%) |
| Health Diagnosing & Treating | 784 (29.0%) | 1,916 (71.0%) |
| Health Technologists | 533 (31.4%) | 1,165 (68.6%) |
| Total (Category) | 3,868 (39.8%) | 5,860 (60.2%) |
| Total (Overall) | 13,717 (51.2%) | 13,068 (48.8%) |
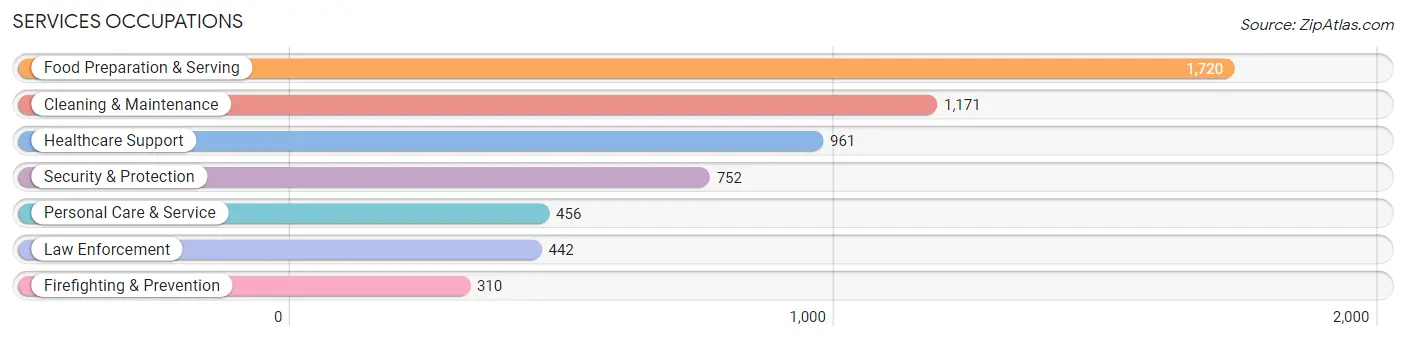
Services Occupations
The most common Services occupations in Raleigh County are Food Preparation & Serving (1,720 | 6.4%), Cleaning & Maintenance (1,171 | 4.4%), Healthcare Support (961 | 3.6%), Security & Protection (752 | 2.8%), and Personal Care & Service (456 | 1.7%).
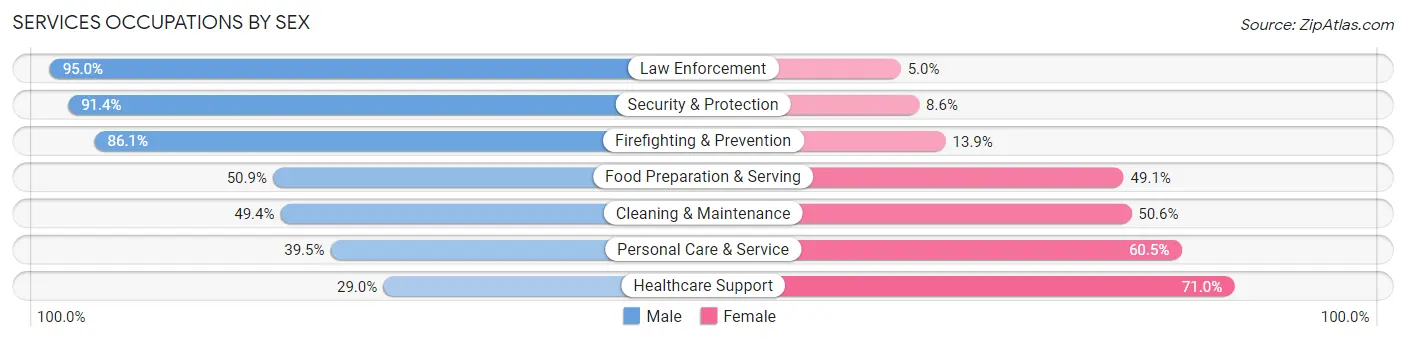
Services Occupations by Sex
Within the Services occupations in Raleigh County, the most male-oriented occupations are Law Enforcement (95.0%), Security & Protection (91.4%), and Firefighting & Prevention (86.1%), while the most female-oriented occupations are Healthcare Support (71.0%), Personal Care & Service (60.5%), and Cleaning & Maintenance (50.6%).
| Occupation | Male | Female |
| Healthcare Support | 279 (29.0%) | 682 (71.0%) |
| Security & Protection | 687 (91.4%) | 65 (8.6%) |
| Firefighting & Prevention | 267 (86.1%) | 43 (13.9%) |
| Law Enforcement | 420 (95.0%) | 22 (5.0%) |
| Food Preparation & Serving | 875 (50.9%) | 845 (49.1%) |
| Cleaning & Maintenance | 578 (49.4%) | 593 (50.6%) |
| Personal Care & Service | 180 (39.5%) | 276 (60.5%) |
| Total (Category) | 2,599 (51.4%) | 2,461 (48.6%) |
| Total (Overall) | 13,717 (51.2%) | 13,068 (48.8%) |
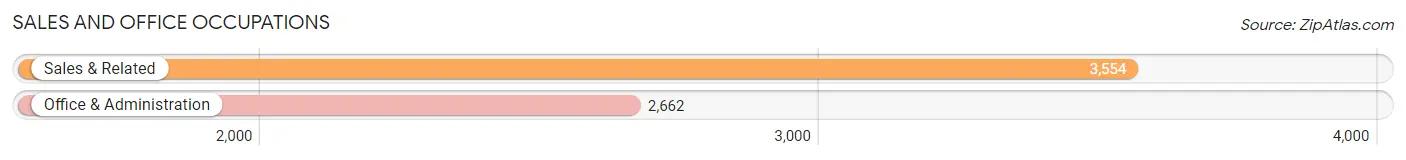
Sales and Office Occupations
The most common Sales and Office occupations in Raleigh County are Sales & Related (3,554 | 13.3%), and Office & Administration (2,662 | 9.9%).
Sales and Office Occupations by Sex
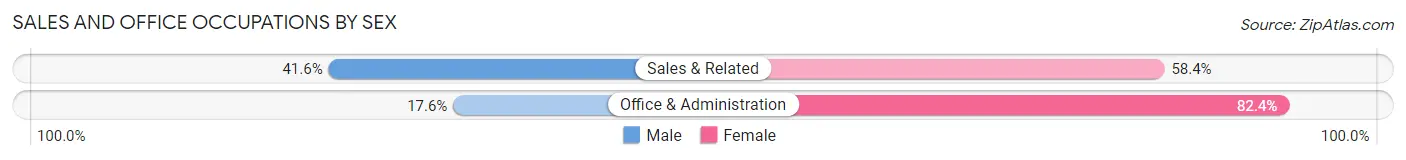
| Occupation | Male | Female |
| Sales & Related | 1,477 (41.6%) | 2,077 (58.4%) |
| Office & Administration | 468 (17.6%) | 2,194 (82.4%) |
| Total (Category) | 1,945 (31.3%) | 4,271 (68.7%) |
| Total (Overall) | 13,717 (51.2%) | 13,068 (48.8%) |
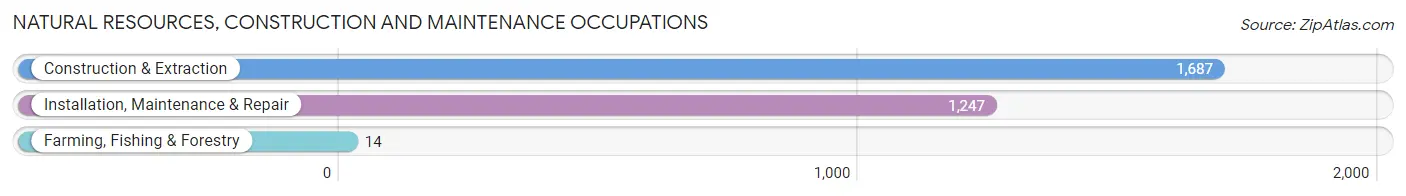
Natural Resources, Construction and Maintenance Occupations
The most common Natural Resources, Construction and Maintenance occupations in Raleigh County are Construction & Extraction (1,687 | 6.3%), Installation, Maintenance & Repair (1,247 | 4.7%), and Farming, Fishing & Forestry (14 | 0.1%).
Natural Resources, Construction and Maintenance Occupations by Sex
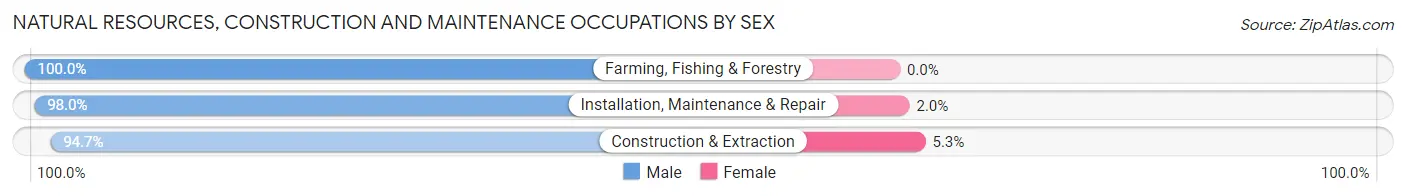
| Occupation | Male | Female |
| Farming, Fishing & Forestry | 14 (100.0%) | 0 (0.0%) |
| Construction & Extraction | 1,597 (94.7%) | 90 (5.3%) |
| Installation, Maintenance & Repair | 1,222 (98.0%) | 25 (2.0%) |
| Total (Category) | 2,833 (96.1%) | 115 (3.9%) |
| Total (Overall) | 13,717 (51.2%) | 13,068 (48.8%) |
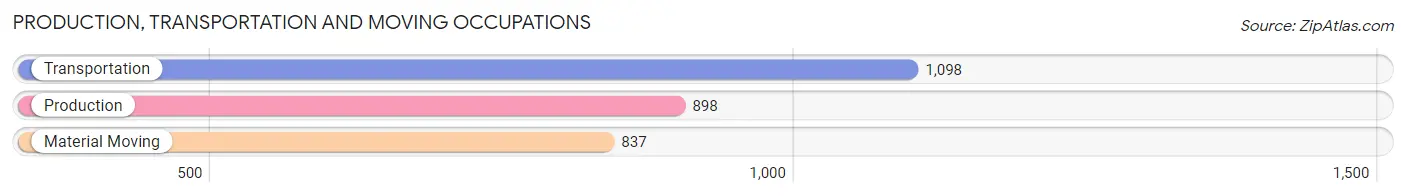
Production, Transportation and Moving Occupations
The most common Production, Transportation and Moving occupations in Raleigh County are Transportation (1,098 | 4.1%), Production (898 | 3.4%), and Material Moving (837 | 3.1%).
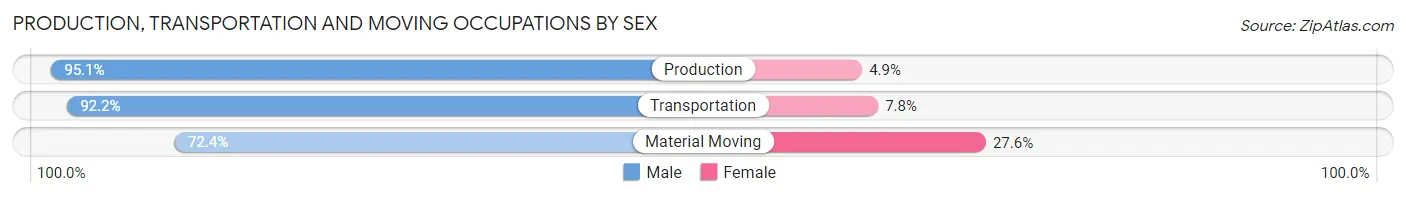
Production, Transportation and Moving Occupations by Sex
| Occupation | Male | Female |
| Production | 854 (95.1%) | 44 (4.9%) |
| Transportation | 1,012 (92.2%) | 86 (7.8%) |
| Material Moving | 606 (72.4%) | 231 (27.6%) |
| Total (Category) | 2,472 (87.3%) | 361 (12.7%) |
| Total (Overall) | 13,717 (51.2%) | 13,068 (48.8%) |
Employment Industries by Sex in Raleigh County
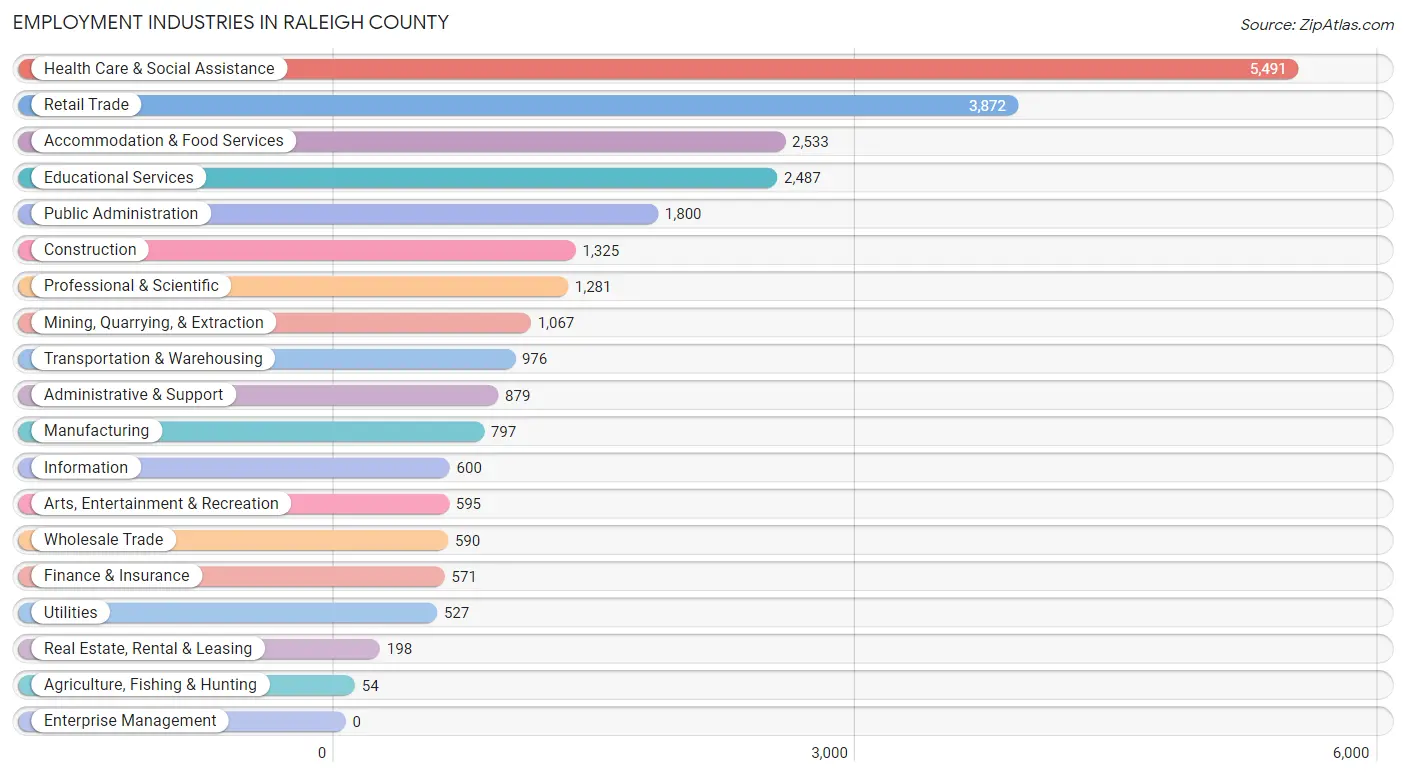
Employment Industries in Raleigh County
The major employment industries in Raleigh County include Health Care & Social Assistance (5,491 | 20.5%), Retail Trade (3,872 | 14.5%), Accommodation & Food Services (2,533 | 9.5%), Educational Services (2,487 | 9.3%), and Public Administration (1,800 | 6.7%).
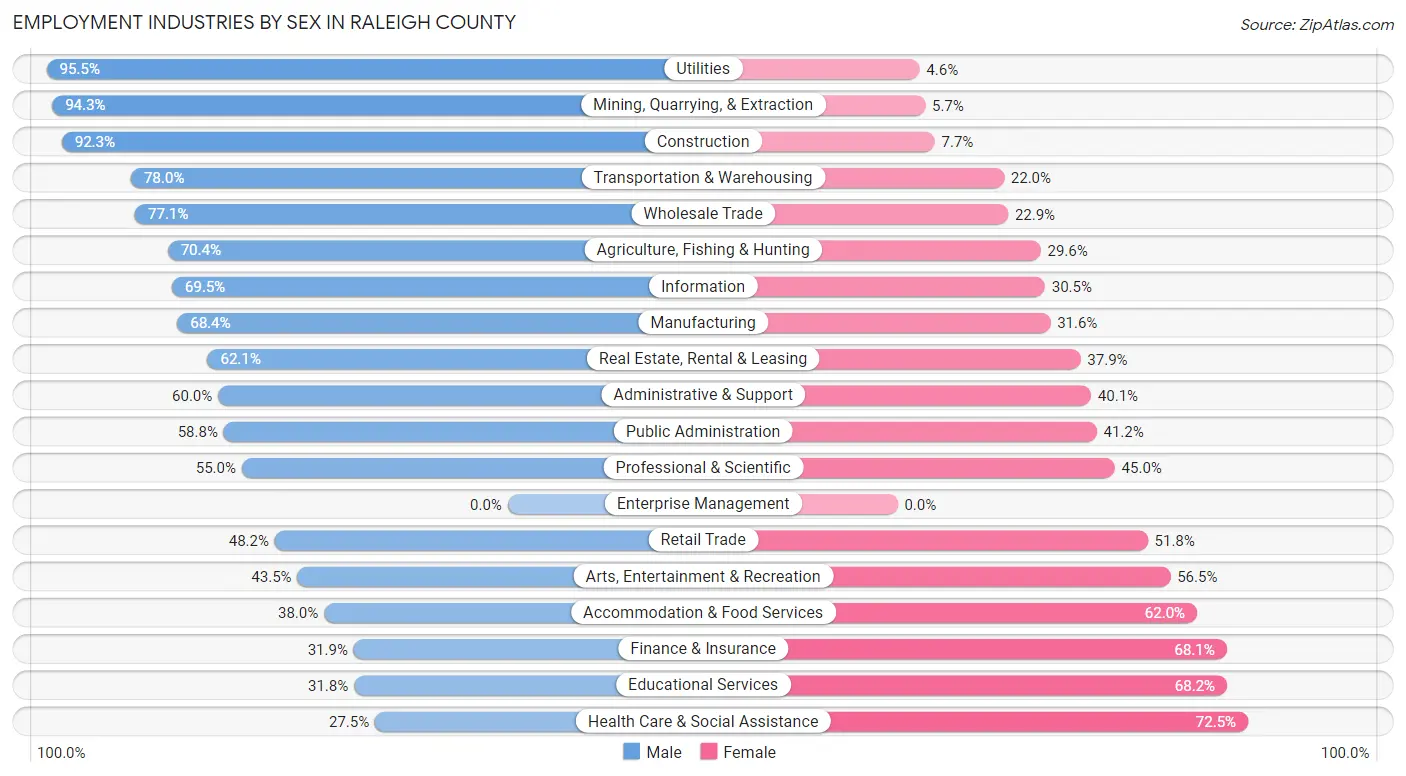
Employment Industries by Sex in Raleigh County
The Raleigh County industries that see more men than women are Utilities (95.5%), Mining, Quarrying, & Extraction (94.3%), and Construction (92.3%), whereas the industries that tend to have a higher number of women are Health Care & Social Assistance (72.5%), Educational Services (68.2%), and Finance & Insurance (68.1%).
| Industry | Male | Female |
| Agriculture, Fishing & Hunting | 38 (70.4%) | 16 (29.6%) |
| Mining, Quarrying, & Extraction | 1,006 (94.3%) | 61 (5.7%) |
| Construction | 1,223 (92.3%) | 102 (7.7%) |
| Manufacturing | 545 (68.4%) | 252 (31.6%) |
| Wholesale Trade | 455 (77.1%) | 135 (22.9%) |
| Retail Trade | 1,867 (48.2%) | 2,005 (51.8%) |
| Transportation & Warehousing | 761 (78.0%) | 215 (22.0%) |
| Utilities | 503 (95.5%) | 24 (4.5%) |
| Information | 417 (69.5%) | 183 (30.5%) |
| Finance & Insurance | 182 (31.9%) | 389 (68.1%) |
| Real Estate, Rental & Leasing | 123 (62.1%) | 75 (37.9%) |
| Professional & Scientific | 705 (55.0%) | 576 (45.0%) |
| Enterprise Management | 0 (0.0%) | 0 (0.0%) |
| Administrative & Support | 527 (60.0%) | 352 (40.1%) |
| Educational Services | 791 (31.8%) | 1,696 (68.2%) |
| Health Care & Social Assistance | 1,508 (27.5%) | 3,983 (72.5%) |
| Arts, Entertainment & Recreation | 259 (43.5%) | 336 (56.5%) |
| Accommodation & Food Services | 963 (38.0%) | 1,570 (62.0%) |
| Public Administration | 1,058 (58.8%) | 742 (41.2%) |
| Total | 13,717 (51.2%) | 13,068 (48.8%) |
Education in Raleigh County
School Enrollment in Raleigh County
The most common levels of schooling among the 13,324 students in Raleigh County are middle school (3,105 | 23.3%), high school (3,102 | 23.3%), and elementary school (2,876 | 21.6%).
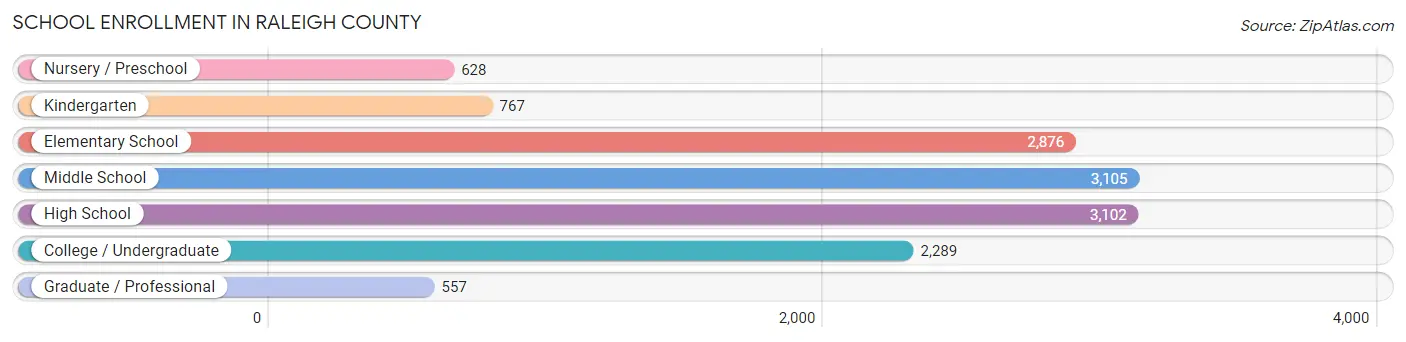
| School Level | # Students | % Students |
| Nursery / Preschool | 628 | 4.7% |
| Kindergarten | 767 | 5.8% |
| Elementary School | 2,876 | 21.6% |
| Middle School | 3,105 | 23.3% |
| High School | 3,102 | 23.3% |
| College / Undergraduate | 2,289 | 17.2% |
| Graduate / Professional | 557 | 4.2% |
| Total | 13,324 | 100.0% |
School Enrollment by Age by Funding Source in Raleigh County
Out of a total of 13,324 students who are enrolled in schools in Raleigh County, 1,772 (13.3%) attend a private institution, while the remaining 11,552 (86.7%) are enrolled in public schools. The age group of 3 to 4 year olds has the highest likelihood of being enrolled in private schools, with 122 (32.0% in the age bracket) enrolled. Conversely, the age group of 15 to 17 year olds has the lowest likelihood of being enrolled in a private school, with 1,917 (91.9% in the age bracket) attending a public institution.
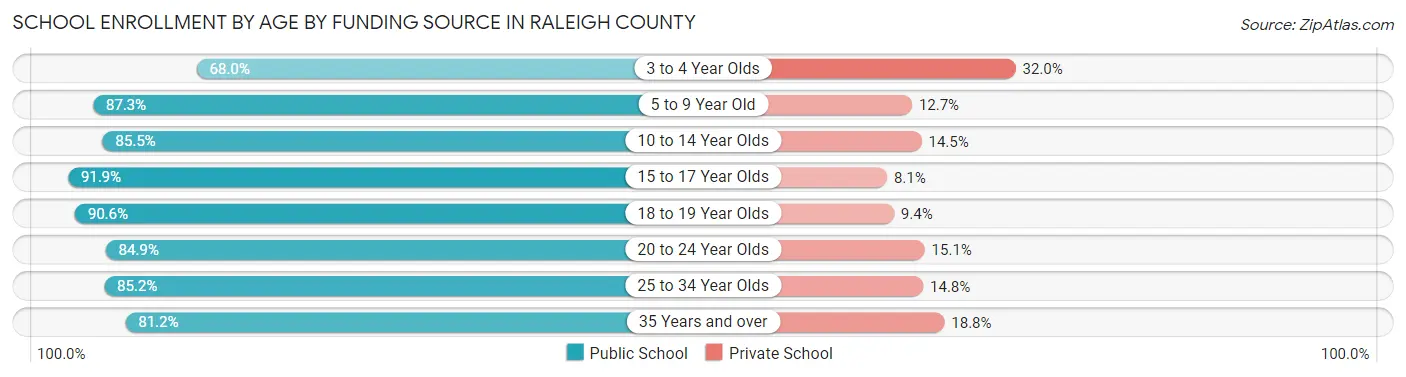
| Age Bracket | Public School | Private School |
| 3 to 4 Year Olds | 259 (68.0%) | 122 (32.0%) |
| 5 to 9 Year Old | 2,992 (87.3%) | 436 (12.7%) |
| 10 to 14 Year Olds | 3,349 (85.5%) | 568 (14.5%) |
| 15 to 17 Year Olds | 1,917 (91.9%) | 168 (8.1%) |
| 18 to 19 Year Olds | 1,065 (90.6%) | 110 (9.4%) |
| 20 to 24 Year Olds | 1,052 (84.9%) | 187 (15.1%) |
| 25 to 34 Year Olds | 564 (85.2%) | 98 (14.8%) |
| 35 Years and over | 355 (81.2%) | 82 (18.8%) |
| Total | 11,552 (86.7%) | 1,772 (13.3%) |
Educational Attainment by Field of Study in Raleigh County
Business (2,393 | 20.6%), education (2,221 | 19.1%), science & technology (1,943 | 16.7%), arts & humanities (1,003 | 8.6%), and bio, nature & agricultural (731 | 6.3%) are the most common fields of study among 11,638 individuals in Raleigh County who have obtained a bachelor's degree or higher.
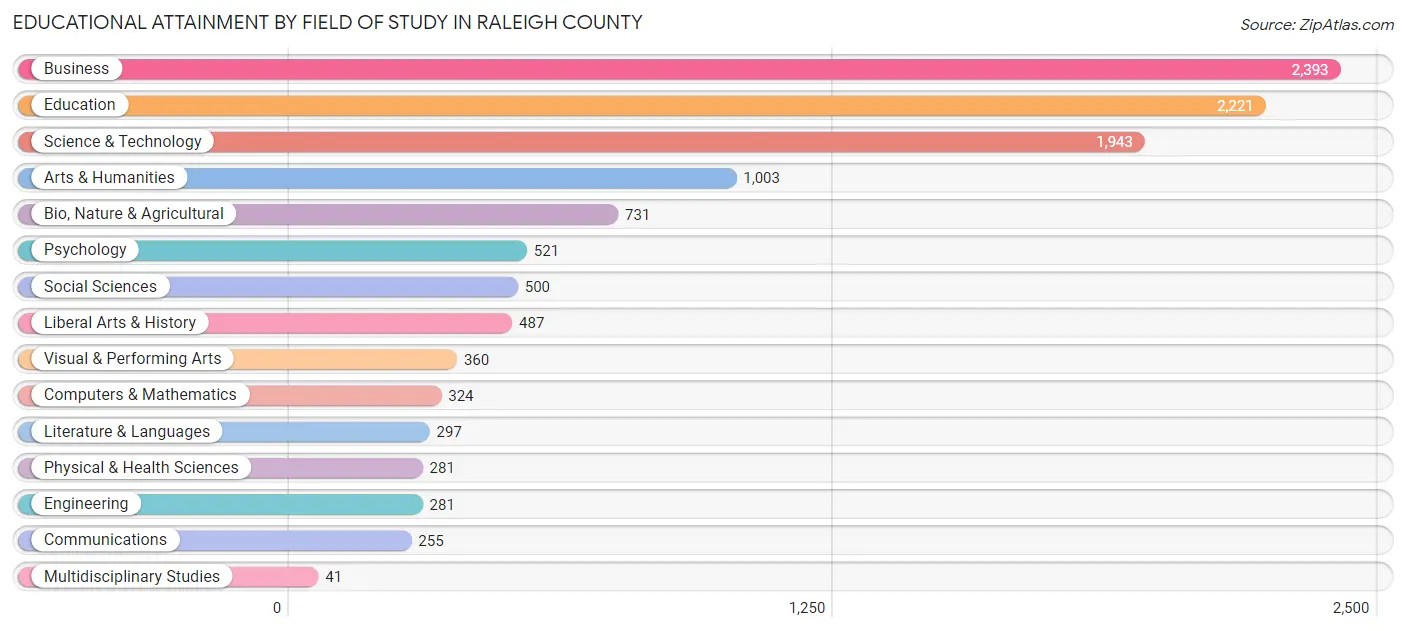
| Field of Study | # Graduates | % Graduates |
| Computers & Mathematics | 324 | 2.8% |
| Bio, Nature & Agricultural | 731 | 6.3% |
| Physical & Health Sciences | 281 | 2.4% |
| Psychology | 521 | 4.5% |
| Social Sciences | 500 | 4.3% |
| Engineering | 281 | 2.4% |
| Multidisciplinary Studies | 41 | 0.4% |
| Science & Technology | 1,943 | 16.7% |
| Business | 2,393 | 20.6% |
| Education | 2,221 | 19.1% |
| Literature & Languages | 297 | 2.5% |
| Liberal Arts & History | 487 | 4.2% |
| Visual & Performing Arts | 360 | 3.1% |
| Communications | 255 | 2.2% |
| Arts & Humanities | 1,003 | 8.6% |
| Total | 11,638 | 100.0% |
Transportation & Commute in Raleigh County
Vehicle Availability by Sex in Raleigh County
The most prevalent vehicle ownership categories in Raleigh County are males with 2 vehicles (6,279, accounting for 46.6%) and females with 2 vehicles (5,795, making up 49.5%).
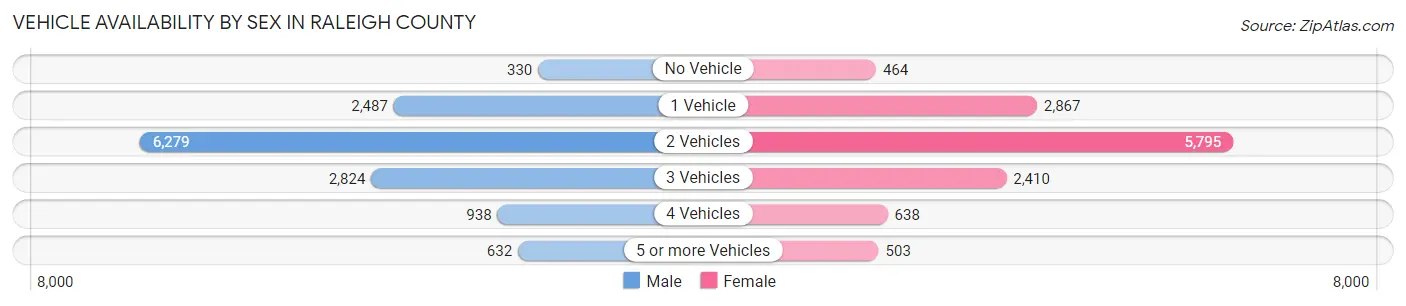
| Vehicles Available | Male | Female |
| No Vehicle | 330 (2.5%) | 464 (3.7%) |
| 1 Vehicle | 2,487 (18.4%) | 2,867 (22.6%) |
| 2 Vehicles | 6,279 (46.6%) | 5,795 (45.7%) |
| 3 Vehicles | 2,824 (20.9%) | 2,410 (19.0%) |
| 4 Vehicles | 938 (7.0%) | 638 (5.0%) |
| 5 or more Vehicles | 632 (4.7%) | 503 (4.0%) |
| Total | 13,490 (100.0%) | 12,677 (100.0%) |
Commute Time in Raleigh County
The most frequently occuring commute durations in Raleigh County are 15 to 19 minutes (4,791 commuters, 19.2%), 20 to 24 minutes (4,403 commuters, 17.6%), and 10 to 14 minutes (4,202 commuters, 16.8%).
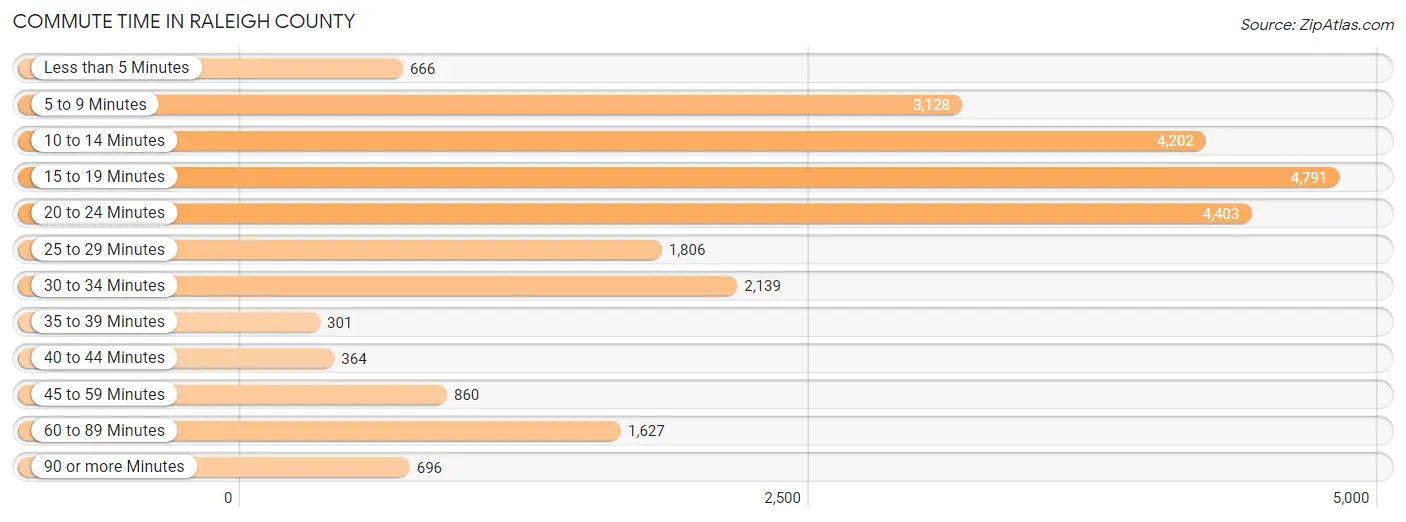
| Commute Time | # Commuters | % Commuters |
| Less than 5 Minutes | 666 | 2.7% |
| 5 to 9 Minutes | 3,128 | 12.5% |
| 10 to 14 Minutes | 4,202 | 16.8% |
| 15 to 19 Minutes | 4,791 | 19.2% |
| 20 to 24 Minutes | 4,403 | 17.6% |
| 25 to 29 Minutes | 1,806 | 7.2% |
| 30 to 34 Minutes | 2,139 | 8.6% |
| 35 to 39 Minutes | 301 | 1.2% |
| 40 to 44 Minutes | 364 | 1.5% |
| 45 to 59 Minutes | 860 | 3.4% |
| 60 to 89 Minutes | 1,627 | 6.5% |
| 90 or more Minutes | 696 | 2.8% |
Commute Time by Sex in Raleigh County
The most common commute times in Raleigh County are 20 to 24 minutes (2,467 commuters, 19.1%) for males and 15 to 19 minutes (2,845 commuters, 23.6%) for females.
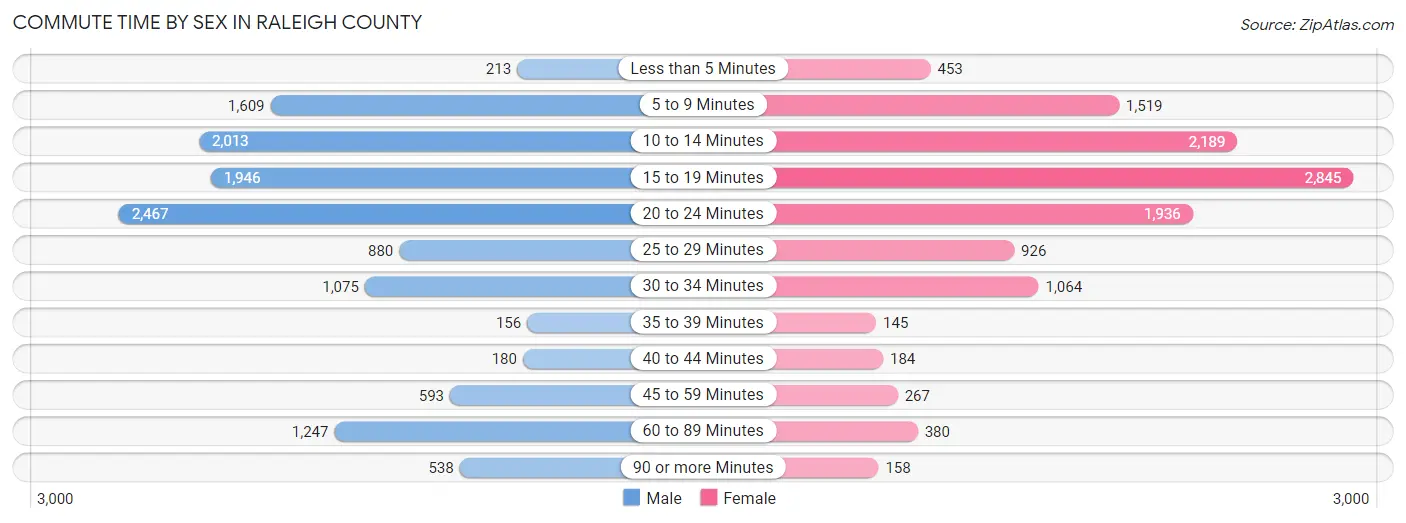
| Commute Time | Male | Female |
| Less than 5 Minutes | 213 (1.7%) | 453 (3.7%) |
| 5 to 9 Minutes | 1,609 (12.5%) | 1,519 (12.6%) |
| 10 to 14 Minutes | 2,013 (15.6%) | 2,189 (18.1%) |
| 15 to 19 Minutes | 1,946 (15.1%) | 2,845 (23.6%) |
| 20 to 24 Minutes | 2,467 (19.1%) | 1,936 (16.1%) |
| 25 to 29 Minutes | 880 (6.8%) | 926 (7.7%) |
| 30 to 34 Minutes | 1,075 (8.3%) | 1,064 (8.8%) |
| 35 to 39 Minutes | 156 (1.2%) | 145 (1.2%) |
| 40 to 44 Minutes | 180 (1.4%) | 184 (1.5%) |
| 45 to 59 Minutes | 593 (4.6%) | 267 (2.2%) |
| 60 to 89 Minutes | 1,247 (9.7%) | 380 (3.2%) |
| 90 or more Minutes | 538 (4.2%) | 158 (1.3%) |
Time of Departure to Work by Sex in Raleigh County
The most frequent times of departure to work in Raleigh County are 8:00 AM to 8:29 AM (1,859, 14.4%) for males and 7:00 AM to 7:29 AM (2,103, 17.4%) for females.
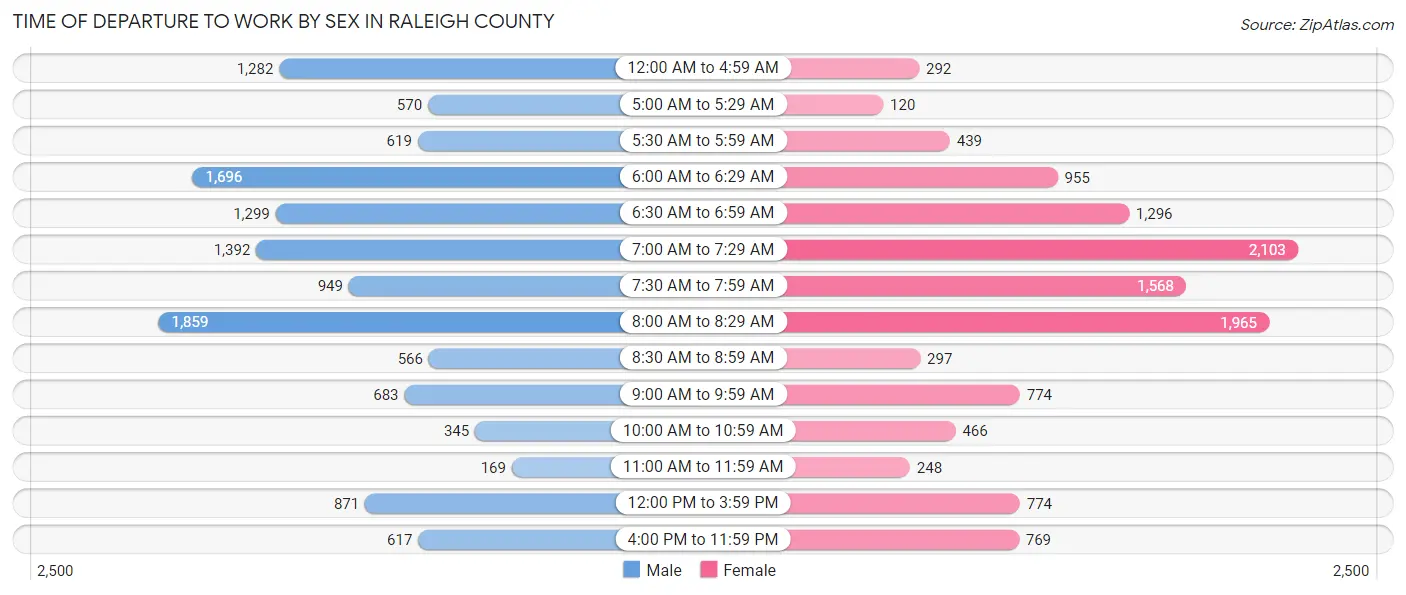
| Time of Departure | Male | Female |
| 12:00 AM to 4:59 AM | 1,282 (9.9%) | 292 (2.4%) |
| 5:00 AM to 5:29 AM | 570 (4.4%) | 120 (1.0%) |
| 5:30 AM to 5:59 AM | 619 (4.8%) | 439 (3.6%) |
| 6:00 AM to 6:29 AM | 1,696 (13.1%) | 955 (7.9%) |
| 6:30 AM to 6:59 AM | 1,299 (10.1%) | 1,296 (10.7%) |
| 7:00 AM to 7:29 AM | 1,392 (10.8%) | 2,103 (17.4%) |
| 7:30 AM to 7:59 AM | 949 (7.3%) | 1,568 (13.0%) |
| 8:00 AM to 8:29 AM | 1,859 (14.4%) | 1,965 (16.3%) |
| 8:30 AM to 8:59 AM | 566 (4.4%) | 297 (2.5%) |
| 9:00 AM to 9:59 AM | 683 (5.3%) | 774 (6.4%) |
| 10:00 AM to 10:59 AM | 345 (2.7%) | 466 (3.9%) |
| 11:00 AM to 11:59 AM | 169 (1.3%) | 248 (2.1%) |
| 12:00 PM to 3:59 PM | 871 (6.7%) | 774 (6.4%) |
| 4:00 PM to 11:59 PM | 617 (4.8%) | 769 (6.4%) |
| Total | 12,917 (100.0%) | 12,066 (100.0%) |
Housing Occupancy in Raleigh County
Occupancy by Ownership in Raleigh County
Of the total 29,395 dwellings in Raleigh County, owner-occupied units account for 22,065 (75.1%), while renter-occupied units make up 7,330 (24.9%).
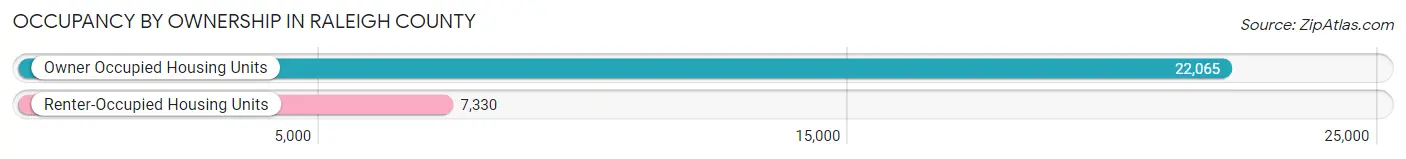
| Occupancy | # Housing Units | % Housing Units |
| Owner Occupied Housing Units | 22,065 | 75.1% |
| Renter-Occupied Housing Units | 7,330 | 24.9% |
| Total Occupied Housing Units | 29,395 | 100.0% |
Occupancy by Household Size in Raleigh County
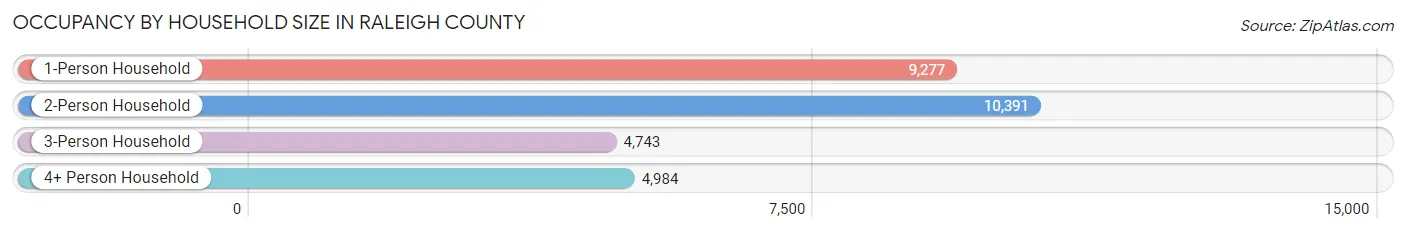
| Household Size | # Housing Units | % Housing Units |
| 1-Person Household | 9,277 | 31.6% |
| 2-Person Household | 10,391 | 35.3% |
| 3-Person Household | 4,743 | 16.1% |
| 4+ Person Household | 4,984 | 17.0% |
| Total Housing Units | 29,395 | 100.0% |
Occupancy by Ownership by Household Size in Raleigh County
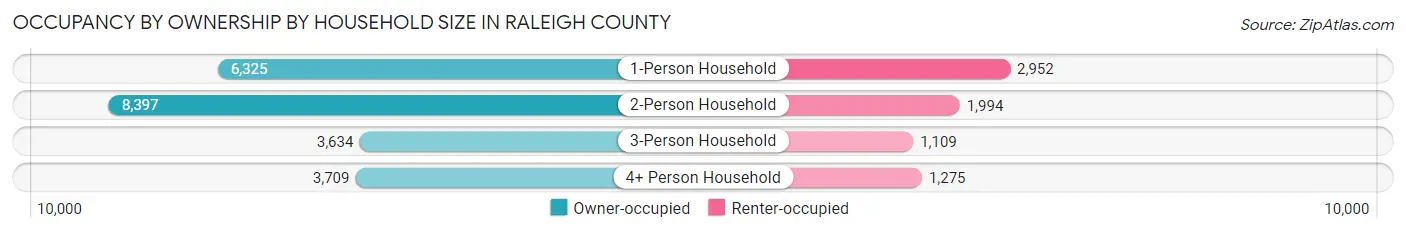
| Household Size | Owner-occupied | Renter-occupied |
| 1-Person Household | 6,325 (68.2%) | 2,952 (31.8%) |
| 2-Person Household | 8,397 (80.8%) | 1,994 (19.2%) |
| 3-Person Household | 3,634 (76.6%) | 1,109 (23.4%) |
| 4+ Person Household | 3,709 (74.4%) | 1,275 (25.6%) |
| Total Housing Units | 22,065 (75.1%) | 7,330 (24.9%) |
Occupancy by Educational Attainment in Raleigh County
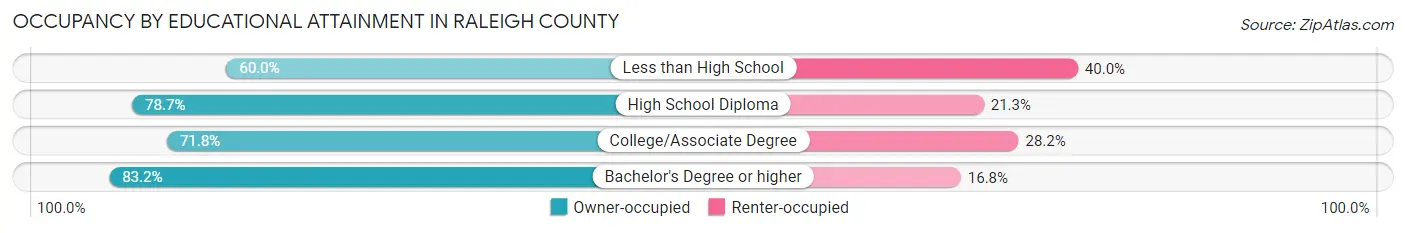
| Household Size | Owner-occupied | Renter-occupied |
| Less than High School | 2,376 (60.0%) | 1,584 (40.0%) |
| High School Diploma | 7,973 (78.7%) | 2,162 (21.3%) |
| College/Associate Degree | 6,369 (71.8%) | 2,505 (28.2%) |
| Bachelor's Degree or higher | 5,347 (83.2%) | 1,079 (16.8%) |
Occupancy by Age of Householder in Raleigh County
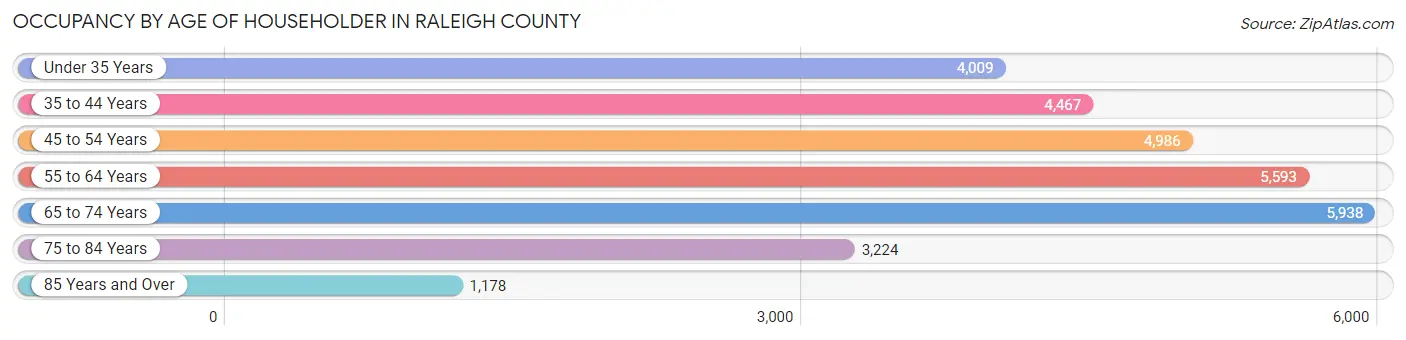
| Age Bracket | # Households | % Households |
| Under 35 Years | 4,009 | 13.6% |
| 35 to 44 Years | 4,467 | 15.2% |
| 45 to 54 Years | 4,986 | 17.0% |
| 55 to 64 Years | 5,593 | 19.0% |
| 65 to 74 Years | 5,938 | 20.2% |
| 75 to 84 Years | 3,224 | 11.0% |
| 85 Years and Over | 1,178 | 4.0% |
| Total | 29,395 | 100.0% |
Housing Finances in Raleigh County
Median Income by Occupancy in Raleigh County
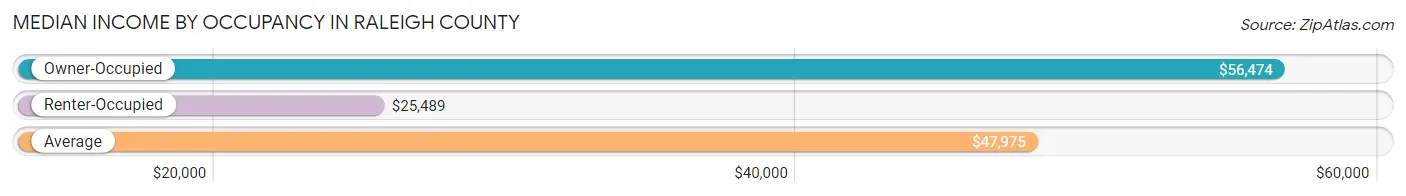
| Occupancy Type | # Households | Median Income |
| Owner-Occupied | 22,065 (75.1%) | $56,474 |
| Renter-Occupied | 7,330 (24.9%) | $25,489 |
| Average | 29,395 (100.0%) | $47,975 |
Occupancy by Householder Income Bracket in Raleigh County
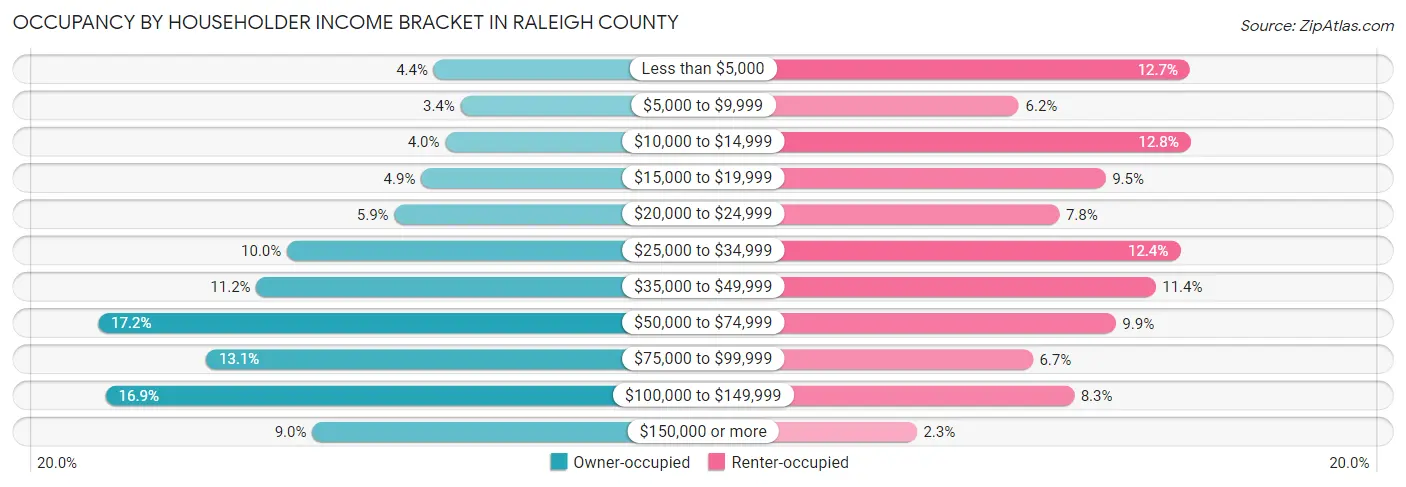
| Income Bracket | Owner-occupied | Renter-occupied |
| Less than $5,000 | 972 (4.4%) | 933 (12.7%) |
| $5,000 to $9,999 | 749 (3.4%) | 455 (6.2%) |
| $10,000 to $14,999 | 876 (4.0%) | 935 (12.8%) |
| $15,000 to $19,999 | 1,080 (4.9%) | 697 (9.5%) |
| $20,000 to $24,999 | 1,305 (5.9%) | 568 (7.7%) |
| $25,000 to $34,999 | 2,207 (10.0%) | 906 (12.4%) |
| $35,000 to $49,999 | 2,465 (11.2%) | 837 (11.4%) |
| $50,000 to $74,999 | 3,796 (17.2%) | 726 (9.9%) |
| $75,000 to $99,999 | 2,889 (13.1%) | 494 (6.7%) |
| $100,000 to $149,999 | 3,731 (16.9%) | 609 (8.3%) |
| $150,000 or more | 1,995 (9.0%) | 170 (2.3%) |
| Total | 22,065 (100.0%) | 7,330 (100.0%) |
Monthly Housing Cost Tiers in Raleigh County
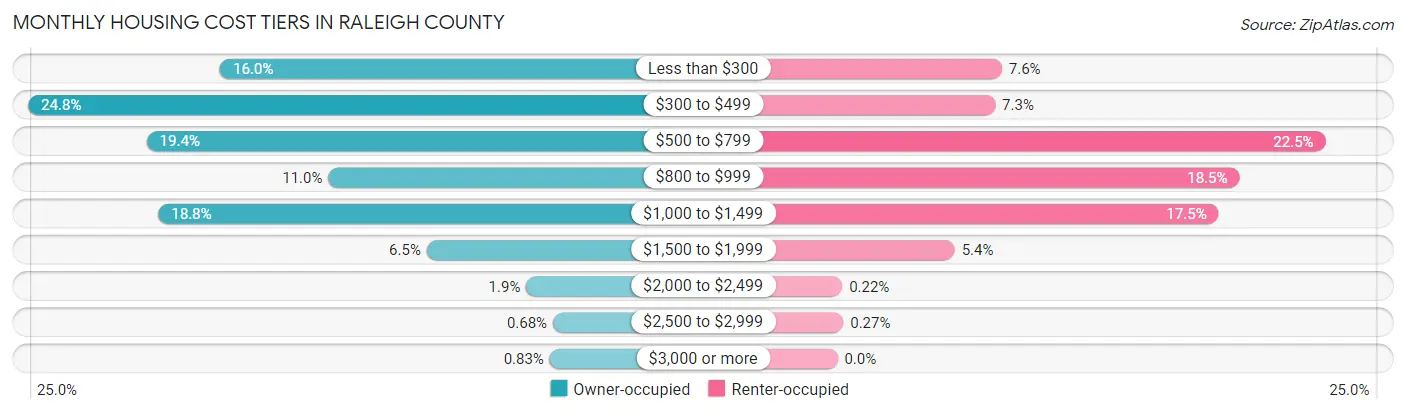
| Monthly Cost | Owner-occupied | Renter-occupied |
| Less than $300 | 3,530 (16.0%) | 555 (7.6%) |
| $300 to $499 | 5,481 (24.8%) | 532 (7.3%) |
| $500 to $799 | 4,277 (19.4%) | 1,646 (22.5%) |
| $800 to $999 | 2,432 (11.0%) | 1,356 (18.5%) |
| $1,000 to $1,499 | 4,158 (18.8%) | 1,286 (17.5%) |
| $1,500 to $1,999 | 1,433 (6.5%) | 396 (5.4%) |
| $2,000 to $2,499 | 422 (1.9%) | 16 (0.2%) |
| $2,500 to $2,999 | 149 (0.7%) | 20 (0.3%) |
| $3,000 or more | 183 (0.8%) | 0 (0.0%) |
| Total | 22,065 (100.0%) | 7,330 (100.0%) |
Physical Housing Characteristics in Raleigh County
Housing Structures in Raleigh County
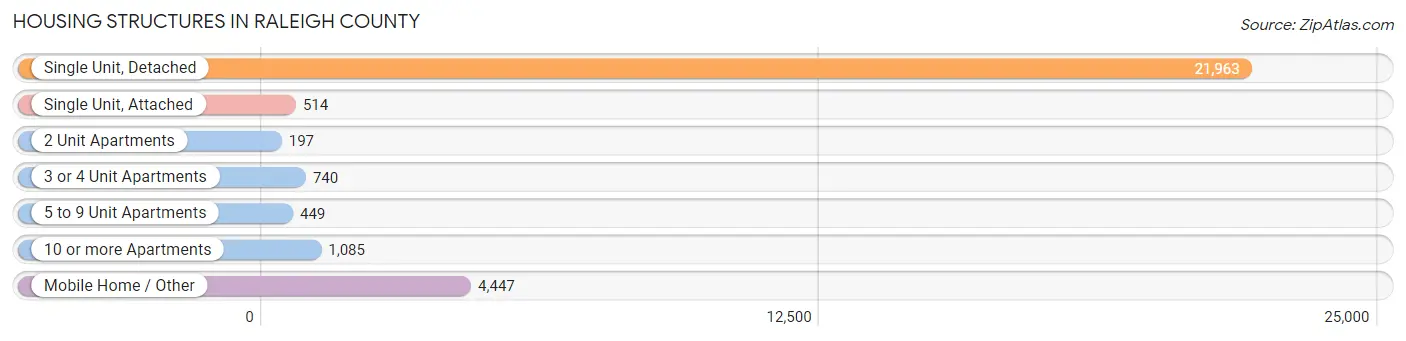
| Structure Type | # Housing Units | % Housing Units |
| Single Unit, Detached | 21,963 | 74.7% |
| Single Unit, Attached | 514 | 1.8% |
| 2 Unit Apartments | 197 | 0.7% |
| 3 or 4 Unit Apartments | 740 | 2.5% |
| 5 to 9 Unit Apartments | 449 | 1.5% |
| 10 or more Apartments | 1,085 | 3.7% |
| Mobile Home / Other | 4,447 | 15.1% |
| Total | 29,395 | 100.0% |
Housing Structures by Occupancy in Raleigh County
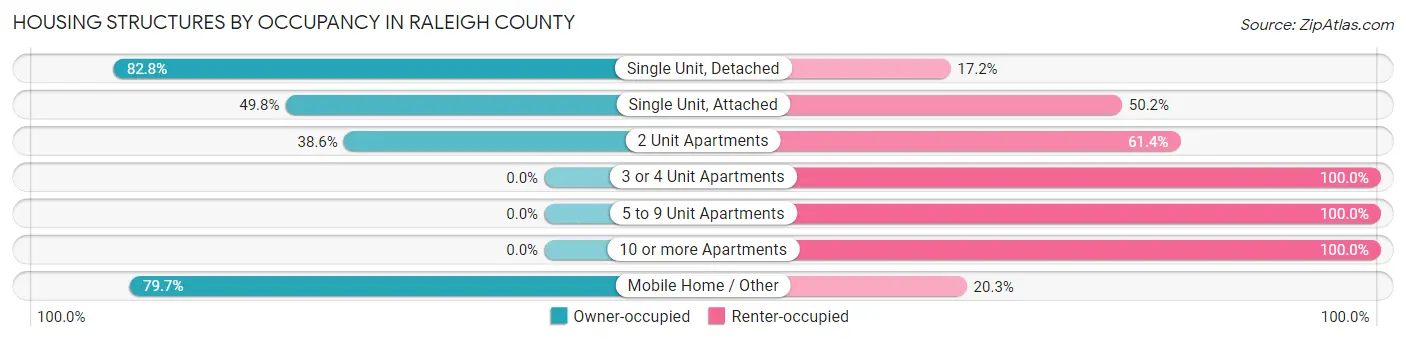
| Structure Type | Owner-occupied | Renter-occupied |
| Single Unit, Detached | 18,189 (82.8%) | 3,774 (17.2%) |
| Single Unit, Attached | 256 (49.8%) | 258 (50.2%) |
| 2 Unit Apartments | 76 (38.6%) | 121 (61.4%) |
| 3 or 4 Unit Apartments | 0 (0.0%) | 740 (100.0%) |
| 5 to 9 Unit Apartments | 0 (0.0%) | 449 (100.0%) |
| 10 or more Apartments | 0 (0.0%) | 1,085 (100.0%) |
| Mobile Home / Other | 3,544 (79.7%) | 903 (20.3%) |
| Total | 22,065 (75.1%) | 7,330 (24.9%) |
Housing Structures by Number of Rooms in Raleigh County
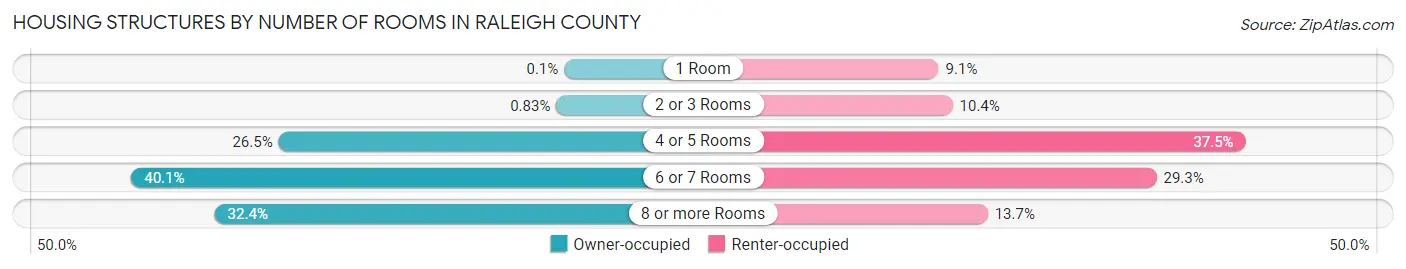
| Number of Rooms | Owner-occupied | Renter-occupied |
| 1 Room | 22 (0.1%) | 669 (9.1%) |
| 2 or 3 Rooms | 183 (0.8%) | 764 (10.4%) |
| 4 or 5 Rooms | 5,852 (26.5%) | 2,749 (37.5%) |
| 6 or 7 Rooms | 8,854 (40.1%) | 2,146 (29.3%) |
| 8 or more Rooms | 7,154 (32.4%) | 1,002 (13.7%) |
| Total | 22,065 (100.0%) | 7,330 (100.0%) |
Housing Structure by Heating Type in Raleigh County
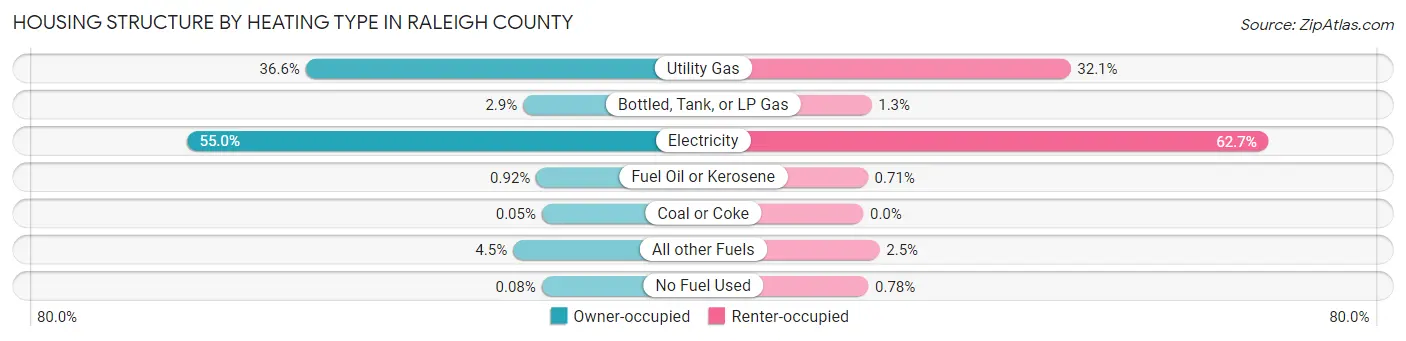
| Heating Type | Owner-occupied | Renter-occupied |
| Utility Gas | 8,064 (36.5%) | 2,349 (32.1%) |
| Bottled, Tank, or LP Gas | 648 (2.9%) | 93 (1.3%) |
| Electricity | 12,126 (55.0%) | 4,594 (62.7%) |
| Fuel Oil or Kerosene | 204 (0.9%) | 52 (0.7%) |
| Coal or Coke | 12 (0.1%) | 0 (0.0%) |
| All other Fuels | 994 (4.5%) | 185 (2.5%) |
| No Fuel Used | 17 (0.1%) | 57 (0.8%) |
| Total | 22,065 (100.0%) | 7,330 (100.0%) |
Household Vehicle Usage in Raleigh County
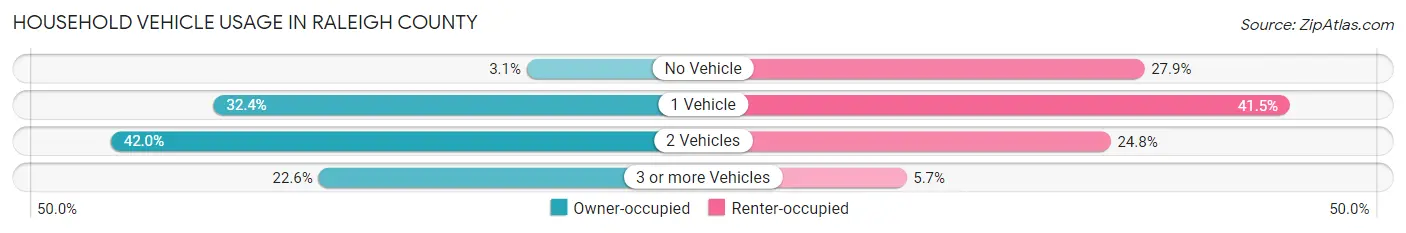
| Vehicles per Household | Owner-occupied | Renter-occupied |
| No Vehicle | 688 (3.1%) | 2,048 (27.9%) |
| 1 Vehicle | 7,143 (32.4%) | 3,045 (41.5%) |
| 2 Vehicles | 9,256 (41.9%) | 1,817 (24.8%) |
| 3 or more Vehicles | 4,978 (22.6%) | 420 (5.7%) |
| Total | 22,065 (100.0%) | 7,330 (100.0%) |
Real Estate & Mortgages in Raleigh County
Real Estate and Mortgage Overview in Raleigh County
| Characteristic | Without Mortgage | With Mortgage |
| Housing Units | 11,618 | 10,447 |
| Median Property Value | $104,600 | $157,100 |
| Median Household Income | $41,437 | $1,275 |
| Monthly Housing Costs | $382 | $183 |
| Real Estate Taxes | $584 | $398 |
Property Value by Mortgage Status in Raleigh County
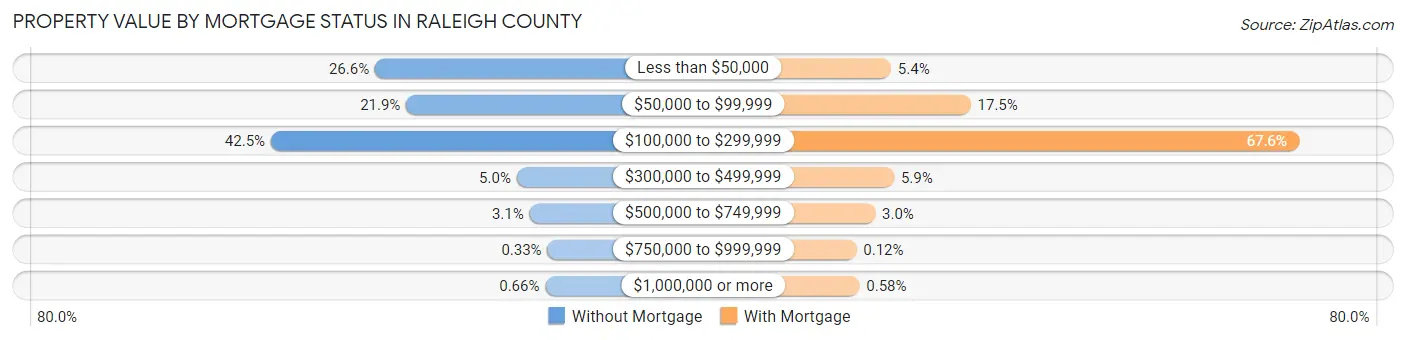
| Property Value | Without Mortgage | With Mortgage |
| Less than $50,000 | 3,092 (26.6%) | 563 (5.4%) |
| $50,000 to $99,999 | 2,539 (21.8%) | 1,831 (17.5%) |
| $100,000 to $299,999 | 4,934 (42.5%) | 7,057 (67.5%) |
| $300,000 to $499,999 | 582 (5.0%) | 611 (5.9%) |
| $500,000 to $749,999 | 356 (3.1%) | 311 (3.0%) |
| $750,000 to $999,999 | 38 (0.3%) | 13 (0.1%) |
| $1,000,000 or more | 77 (0.7%) | 61 (0.6%) |
| Total | 11,618 (100.0%) | 10,447 (100.0%) |
Household Income by Mortgage Status in Raleigh County
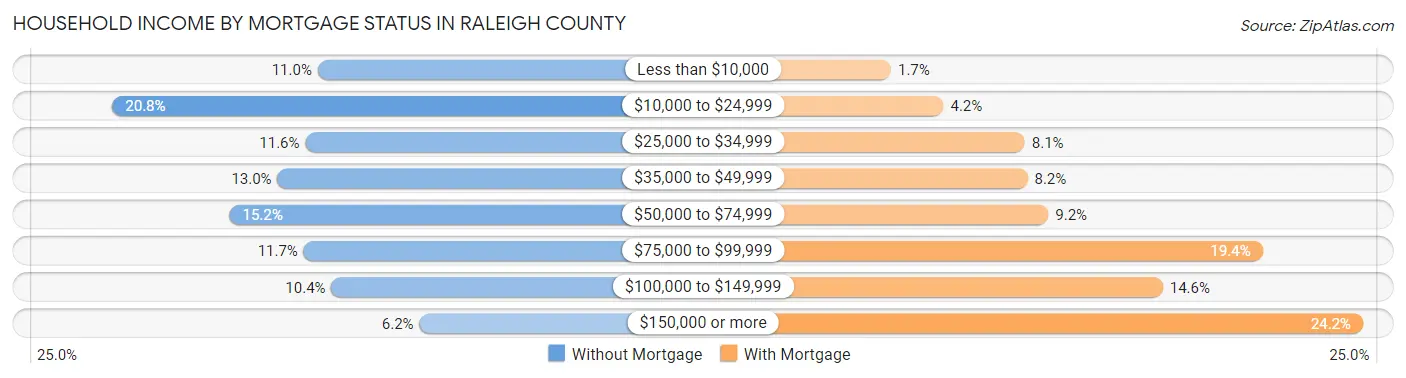
| Household Income | Without Mortgage | With Mortgage |
| Less than $10,000 | 1,283 (11.0%) | 177 (1.7%) |
| $10,000 to $24,999 | 2,419 (20.8%) | 438 (4.2%) |
| $25,000 to $34,999 | 1,351 (11.6%) | 842 (8.1%) |
| $35,000 to $49,999 | 1,506 (13.0%) | 856 (8.2%) |
| $50,000 to $74,999 | 1,771 (15.2%) | 959 (9.2%) |
| $75,000 to $99,999 | 1,361 (11.7%) | 2,025 (19.4%) |
| $100,000 to $149,999 | 1,207 (10.4%) | 1,528 (14.6%) |
| $150,000 or more | 720 (6.2%) | 2,524 (24.2%) |
| Total | 11,618 (100.0%) | 10,447 (100.0%) |
Property Value to Household Income Ratio in Raleigh County
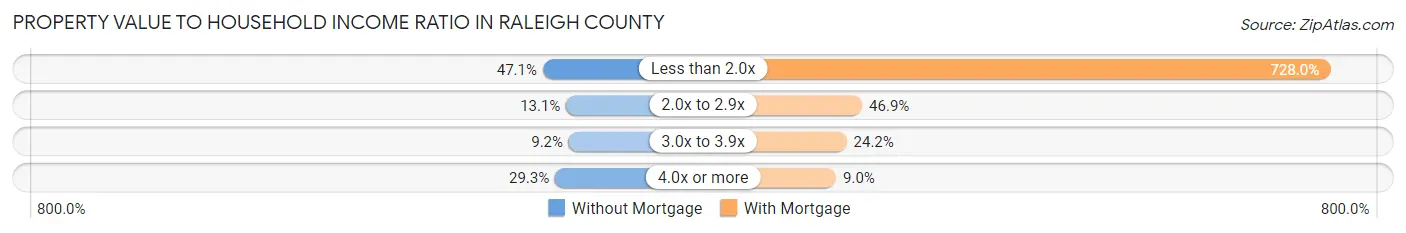
| Value-to-Income Ratio | Without Mortgage | With Mortgage |
| Less than 2.0x | 5,467 (47.1%) | 76,052 (728.0%) |
| 2.0x to 2.9x | 1,524 (13.1%) | 4,895 (46.9%) |
| 3.0x to 3.9x | 1,072 (9.2%) | 2,532 (24.2%) |
| 4.0x or more | 3,404 (29.3%) | 935 (8.9%) |
| Total | 11,618 (100.0%) | 10,447 (100.0%) |
Real Estate Taxes by Mortgage Status in Raleigh County
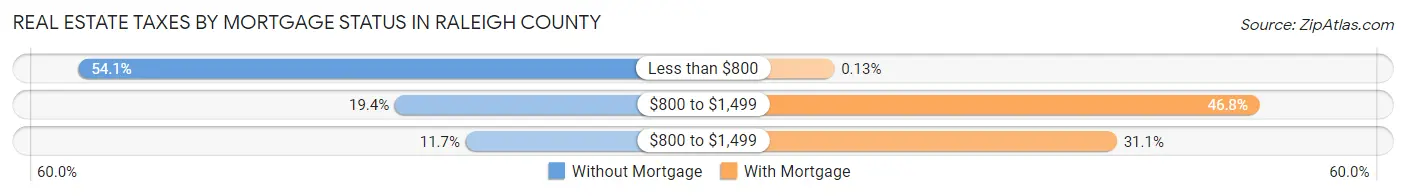
| Property Taxes | Without Mortgage | With Mortgage |
| Less than $800 | 6,285 (54.1%) | 14 (0.1%) |
| $800 to $1,499 | 2,254 (19.4%) | 4,886 (46.8%) |
| $800 to $1,499 | 1,353 (11.7%) | 3,248 (31.1%) |
| Total | 11,618 (100.0%) | 10,447 (100.0%) |
Health & Disability in Raleigh County
Health Insurance Coverage by Age in Raleigh County
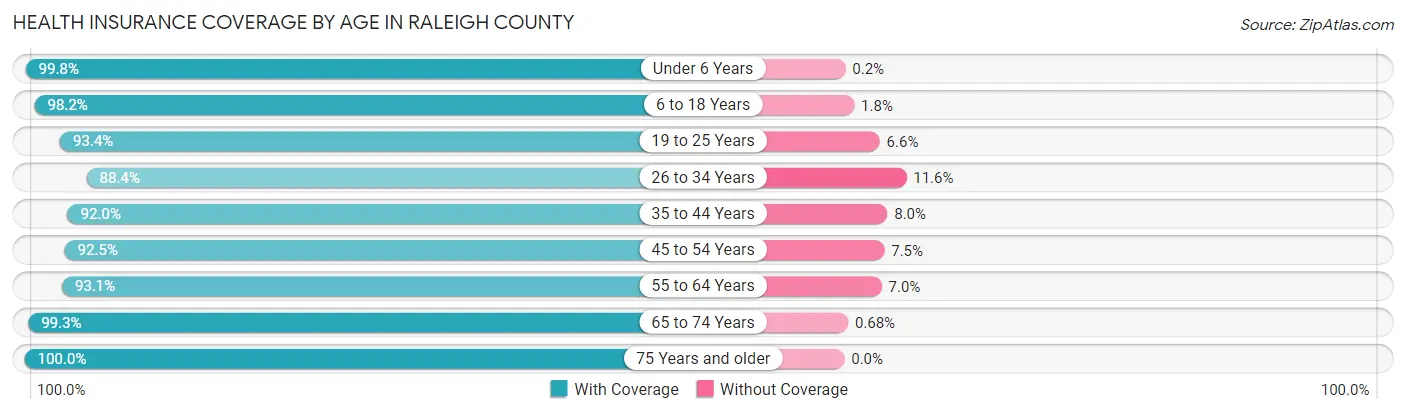
| Age Bracket | With Coverage | Without Coverage |
| Under 6 Years | 4,962 (99.8%) | 10 (0.2%) |
| 6 to 18 Years | 11,549 (98.2%) | 216 (1.8%) |
| 19 to 25 Years | 4,834 (93.4%) | 341 (6.6%) |
| 26 to 34 Years | 6,133 (88.4%) | 802 (11.6%) |
| 35 to 44 Years | 8,008 (92.0%) | 698 (8.0%) |
| 45 to 54 Years | 8,201 (92.5%) | 661 (7.5%) |
| 55 to 64 Years | 8,868 (93.0%) | 662 (7.0%) |
| 65 to 74 Years | 9,624 (99.3%) | 66 (0.7%) |
| 75 Years and older | 5,894 (100.0%) | 0 (0.0%) |
| Total | 68,073 (95.2%) | 3,456 (4.8%) |
Health Insurance Coverage by Citizenship Status in Raleigh County
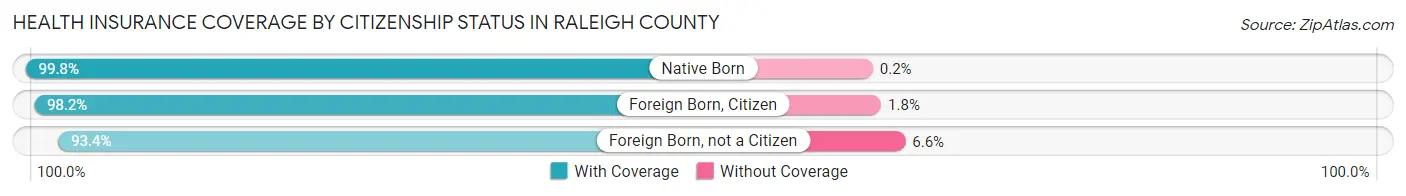
| Citizenship Status | With Coverage | Without Coverage |
| Native Born | 4,962 (99.8%) | 10 (0.2%) |
| Foreign Born, Citizen | 11,549 (98.2%) | 216 (1.8%) |
| Foreign Born, not a Citizen | 4,834 (93.4%) | 341 (6.6%) |
Health Insurance Coverage by Household Income in Raleigh County
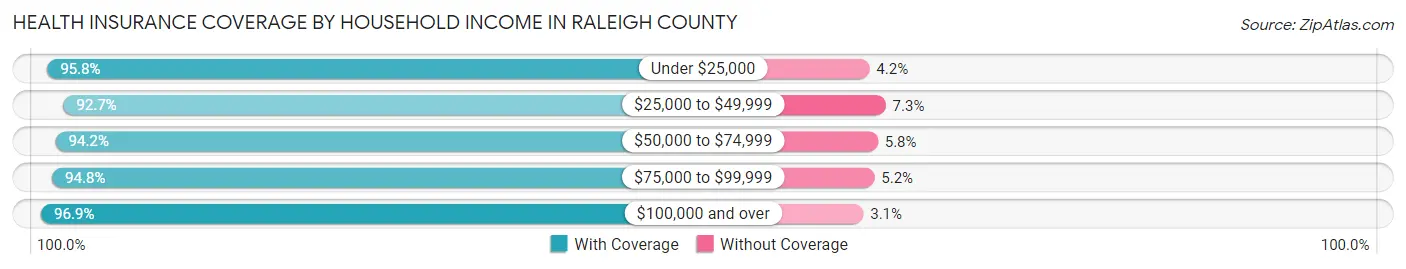
| Household Income | With Coverage | Without Coverage |
| Under $25,000 | 15,816 (95.8%) | 700 (4.2%) |
| $25,000 to $49,999 | 11,929 (92.7%) | 936 (7.3%) |
| $50,000 to $74,999 | 11,162 (94.2%) | 688 (5.8%) |
| $75,000 to $99,999 | 9,004 (94.8%) | 490 (5.2%) |
| $100,000 and over | 19,496 (96.9%) | 622 (3.1%) |
Public vs Private Health Insurance Coverage by Age in Raleigh County
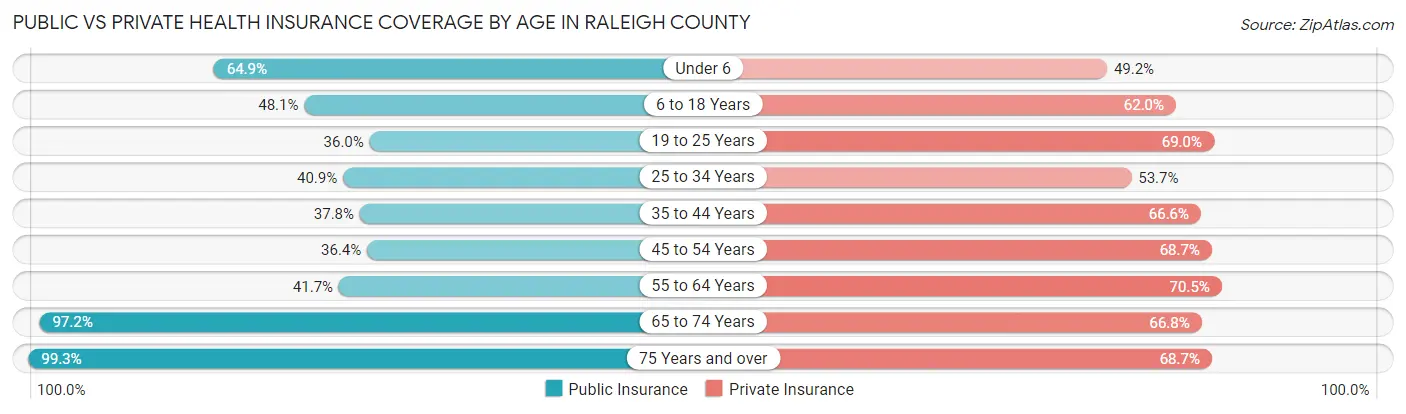
| Age Bracket | Public Insurance | Private Insurance |
| Under 6 | 3,226 (64.9%) | 2,447 (49.2%) |
| 6 to 18 Years | 5,657 (48.1%) | 7,294 (62.0%) |
| 19 to 25 Years | 1,861 (36.0%) | 3,573 (69.0%) |
| 25 to 34 Years | 2,836 (40.9%) | 3,726 (53.7%) |
| 35 to 44 Years | 3,288 (37.8%) | 5,802 (66.6%) |
| 45 to 54 Years | 3,228 (36.4%) | 6,084 (68.6%) |
| 55 to 64 Years | 3,970 (41.7%) | 6,719 (70.5%) |
| 65 to 74 Years | 9,422 (97.2%) | 6,470 (66.8%) |
| 75 Years and over | 5,853 (99.3%) | 4,047 (68.7%) |
| Total | 39,341 (55.0%) | 46,162 (64.5%) |
Disability Status by Sex by Age in Raleigh County
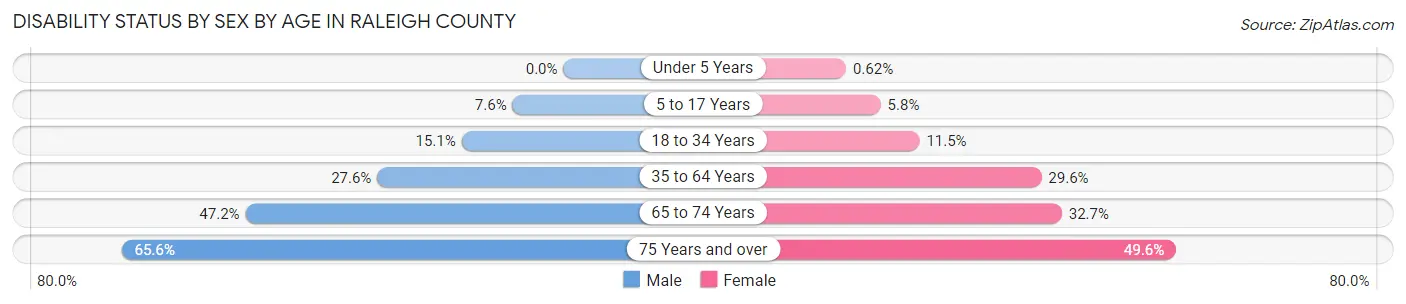
| Age Bracket | Male | Female |
| Under 5 Years | 0 (0.0%) | 11 (0.6%) |
| 5 to 17 Years | 452 (7.5%) | 335 (5.8%) |
| 18 to 34 Years | 996 (15.1%) | 772 (11.5%) |
| 35 to 64 Years | 3,700 (27.6%) | 4,064 (29.6%) |
| 65 to 74 Years | 2,193 (47.2%) | 1,648 (32.7%) |
| 75 Years and over | 1,592 (65.6%) | 1,721 (49.6%) |
Disability Class by Sex by Age in Raleigh County
Disability Class: Hearing Difficulty
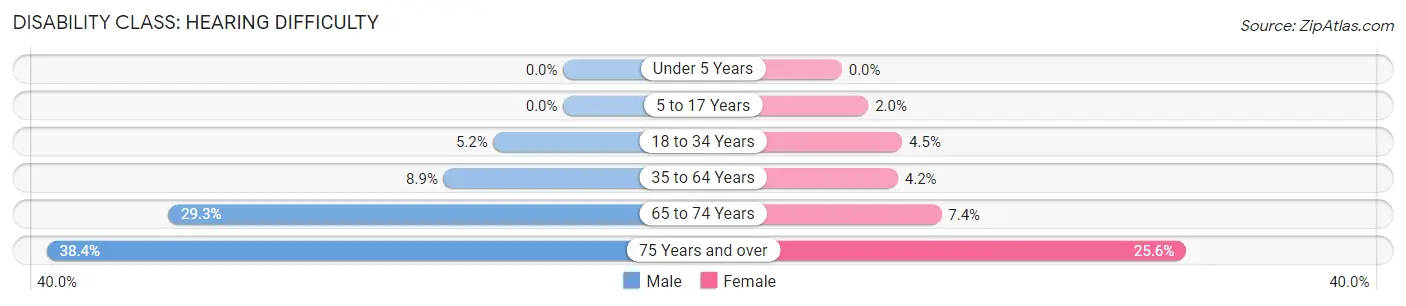
| Age Bracket | Male | Female |
| Under 5 Years | 0 (0.0%) | 0 (0.0%) |
| 5 to 17 Years | 0 (0.0%) | 114 (2.0%) |
| 18 to 34 Years | 341 (5.2%) | 300 (4.5%) |
| 35 to 64 Years | 1,189 (8.9%) | 570 (4.2%) |
| 65 to 74 Years | 1,363 (29.3%) | 373 (7.4%) |
| 75 Years and over | 931 (38.4%) | 886 (25.6%) |
Disability Class: Vision Difficulty
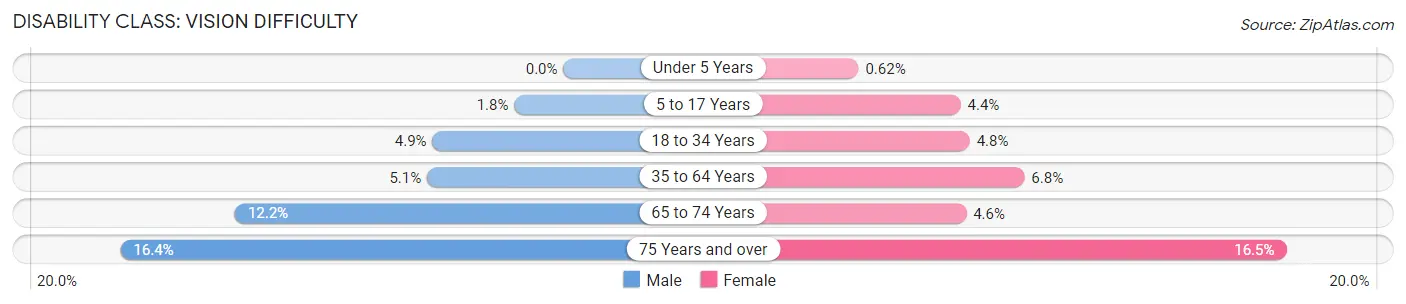
| Age Bracket | Male | Female |
| Under 5 Years | 0 (0.0%) | 11 (0.6%) |
| 5 to 17 Years | 109 (1.8%) | 256 (4.4%) |
| 18 to 34 Years | 320 (4.9%) | 318 (4.8%) |
| 35 to 64 Years | 677 (5.1%) | 930 (6.8%) |
| 65 to 74 Years | 566 (12.2%) | 233 (4.6%) |
| 75 Years and over | 399 (16.4%) | 572 (16.5%) |
Disability Class: Cognitive Difficulty
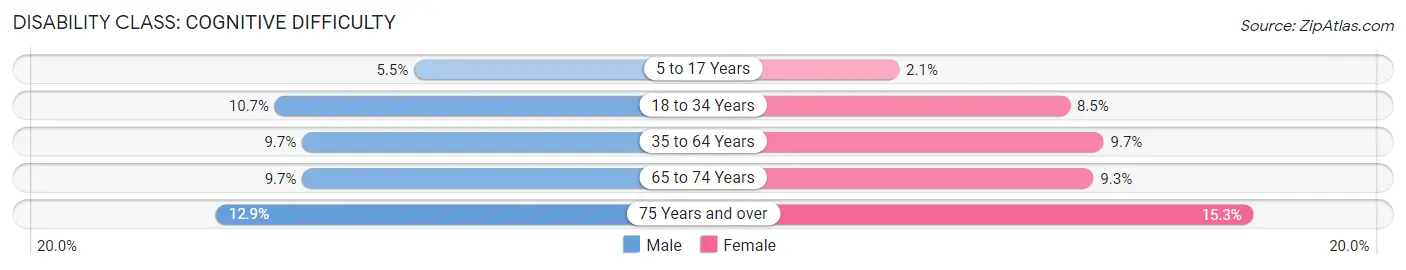
| Age Bracket | Male | Female |
| 5 to 17 Years | 332 (5.5%) | 124 (2.1%) |
| 18 to 34 Years | 706 (10.7%) | 567 (8.5%) |
| 35 to 64 Years | 1,299 (9.7%) | 1,333 (9.7%) |
| 65 to 74 Years | 450 (9.7%) | 471 (9.3%) |
| 75 Years and over | 313 (12.9%) | 530 (15.3%) |
Disability Class: Ambulatory Difficulty
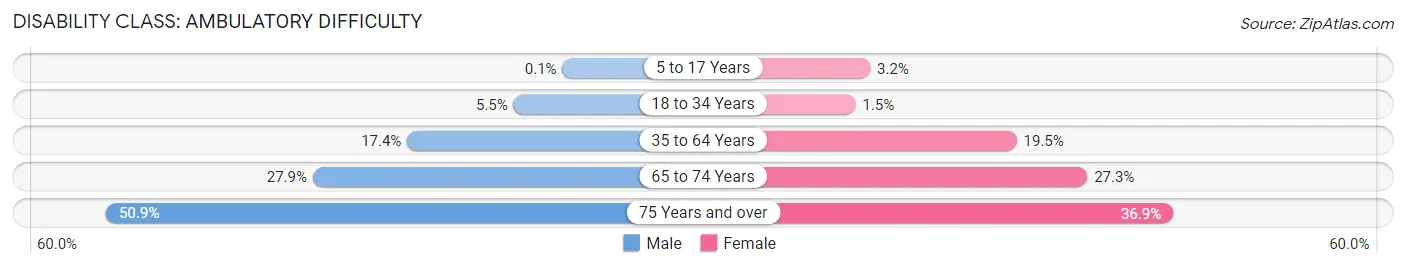
| Age Bracket | Male | Female |
| 5 to 17 Years | 6 (0.1%) | 183 (3.2%) |
| 18 to 34 Years | 365 (5.5%) | 102 (1.5%) |
| 35 to 64 Years | 2,328 (17.4%) | 2,670 (19.5%) |
| 65 to 74 Years | 1,296 (27.9%) | 1,379 (27.3%) |
| 75 Years and over | 1,236 (50.9%) | 1,279 (36.9%) |
Disability Class: Self-Care Difficulty
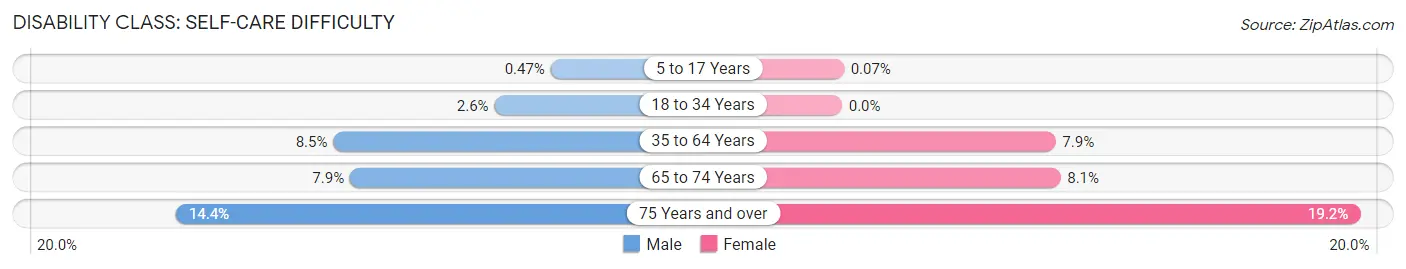
| Age Bracket | Male | Female |
| 5 to 17 Years | 28 (0.5%) | 4 (0.1%) |
| 18 to 34 Years | 169 (2.6%) | 0 (0.0%) |
| 35 to 64 Years | 1,143 (8.5%) | 1,088 (7.9%) |
| 65 to 74 Years | 368 (7.9%) | 409 (8.1%) |
| 75 Years and over | 349 (14.4%) | 667 (19.2%) |
Technology Access in Raleigh County
Computing Device Access in Raleigh County
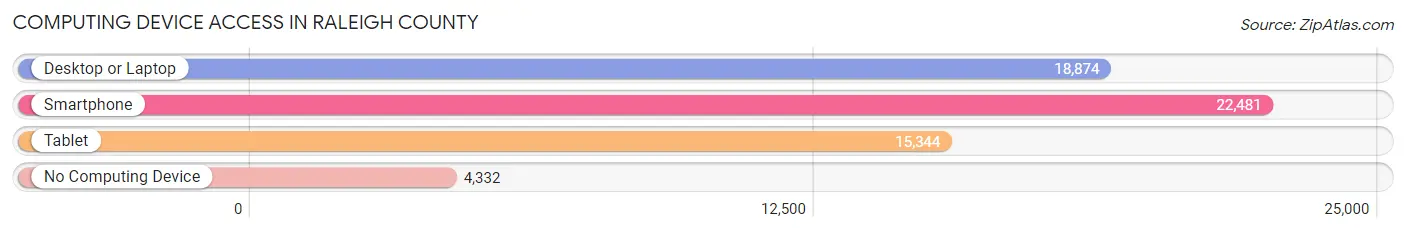
| Device Type | # Households | % Households |
| Desktop or Laptop | 18,874 | 64.2% |
| Smartphone | 22,481 | 76.5% |
| Tablet | 15,344 | 52.2% |
| No Computing Device | 4,332 | 14.7% |
| Total | 29,395 | 100.0% |
Internet Access in Raleigh County
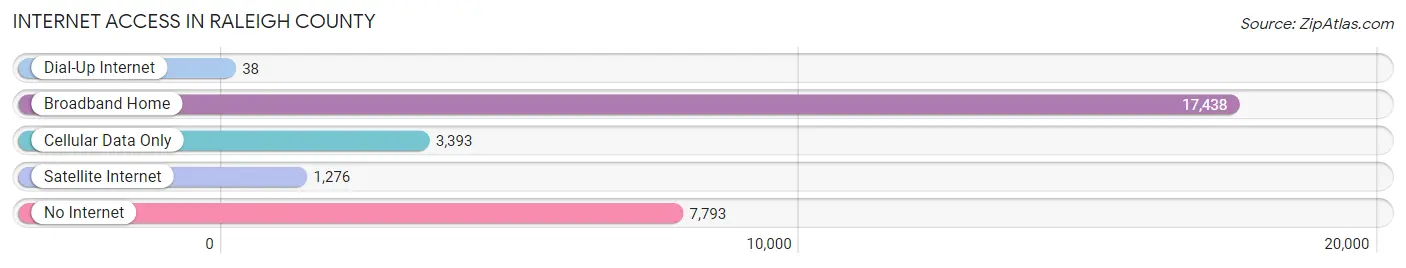
| Internet Type | # Households | % Households |
| Dial-Up Internet | 38 | 0.1% |
| Broadband Home | 17,438 | 59.3% |
| Cellular Data Only | 3,393 | 11.5% |
| Satellite Internet | 1,276 | 4.3% |
| No Internet | 7,793 | 26.5% |
| Total | 29,395 | 100.0% |
Raleigh County Summary
Raleigh County, West Virginia is located in the southern part of the state and is part of the Beckley-Oak Hill Metropolitan Statistical Area. It is bordered by Fayette County to the north, Summers County to the east, Mercer County to the south, and Wyoming County to the west. The county seat is Beckley, and the largest city is Beckley. As of the 2010 census, the population of Raleigh County was 78,859.
History
Raleigh County was formed in 1850 from parts of Fayette, Kanawha, and Logan counties. It was named for Sir Walter Raleigh, an English explorer and colonizer. The county was home to several Native American tribes, including the Shawnee, Cherokee, and Mingo. The first European settlers arrived in the area in the late 1700s.
The county was home to several coal mining towns, including Beckley, Eccles, and Sophia. The coal industry was the main source of employment in the county until the mid-1900s. The county also had several timber and lumber mills, as well as several small manufacturing plants.
Geography
Raleigh County is located in the Appalachian Mountains of southern West Virginia. The county is mostly mountainous, with the highest point being Pine Mountain at 3,912 feet. The county is drained by the New River, which flows through the county from north to south.
The county has a total area of 545 square miles, of which 543 square miles is land and 2.2 square miles is water. The county is home to several state parks, including Grandview State Park, Bluestone State Park, and Pipestem Resort State Park.
Economy
Raleigh County’s economy is largely based on coal mining, timber, and tourism. The county is home to several coal mines, including the Beckley Mine, the Eccles Mine, and the Sophia Mine. The county also has several timber and lumber mills, as well as several small manufacturing plants.
Tourism is also an important part of the county’s economy. The county is home to several state parks, including Grandview State Park, Bluestone State Park, and Pipestem Resort State Park. The county is also home to several historic sites, including the Beckley Exhibition Coal Mine and the Raleigh County Courthouse.
Demographics
As of the 2010 census, the population of Raleigh County was 78,859. The population was spread out, with 24.3% under the age of 18, 8.2% from 18 to 24, 28.2% from 25 to 44, 24.7% from 45 to 64, and 14.6% who were 65 years of age or older. The median age was 37.4 years.
The racial makeup of the county was 92.2% White, 4.3% African American, 0.3% Native American, 0.7% Asian, 0.1% Pacific Islander, 0.7% from other races, and 1.7% from two or more races. Hispanic or Latino of any race were 1.9% of the population.
The median income for a household in the county was $37,945, and the median income for a family was $45,945. The per capita income for the county was $20,845. About 11.2% of families and 14.3% of the population were below the poverty line, including 19.2% of those under age 18 and 10.2% of those age 65 or over.
Common Questions
What is the Total Population of Raleigh County?
Total Population of Raleigh County is 74,303.
What is the Total Male Population of Raleigh County?
Total Male Population of Raleigh County is 37,402.
What is the Total Female Population of Raleigh County?
Total Female Population of Raleigh County is 36,901.
What is the Ratio of Males per 100 Females in Raleigh County?
There are 101.36 Males per 100 Females in Raleigh County.
What is the Ratio of Females per 100 Males in Raleigh County?
There are 98.66 Females per 100 Males in Raleigh County.
What is the Median Population Age in Raleigh County?
Median Population Age in Raleigh County is 42.6 Years.
What is the Average Family Size in Raleigh County
Average Family Size in Raleigh County is 3.0 People.
What is the Average Household Size in Raleigh County
Average Household Size in Raleigh County is 2.4 People.
What is Per Capita Income in Raleigh County?
Per Capita income in Raleigh County is $27,724.
What is the Median Family Income in Raleigh County?
Median Family Income in Raleigh County is $65,294.
What is the Median Household income in Raleigh County?
Median Household Income in Raleigh County is $47,975.
What is Income or Wage Gap in Raleigh County?
Income or Wage Gap in Raleigh County is 30.4%.
Women in Raleigh County earn 69.6 cents for every dollar earned by a man.
What is Family Income Deficit in Raleigh County?
Family Income Deficit in Raleigh County is $12,071.
Families that are below poverty line in Raleigh County earn $12,071 less on average than the poverty threshold level.
What is Inequality or Gini Index in Raleigh County?
Inequality or Gini Index in Raleigh County is 0.49.
How Large is the Labor Force in Raleigh County?
There are 29,015 People in the Labor Forcein in Raleigh County.
What is the Percentage of People in the Labor Force in Raleigh County?
48.1% of People are in the Labor Force in Raleigh County.
What is the Unemployment Rate in Raleigh County?
Unemployment Rate in Raleigh County is 7.1%.