Putnam County, WV
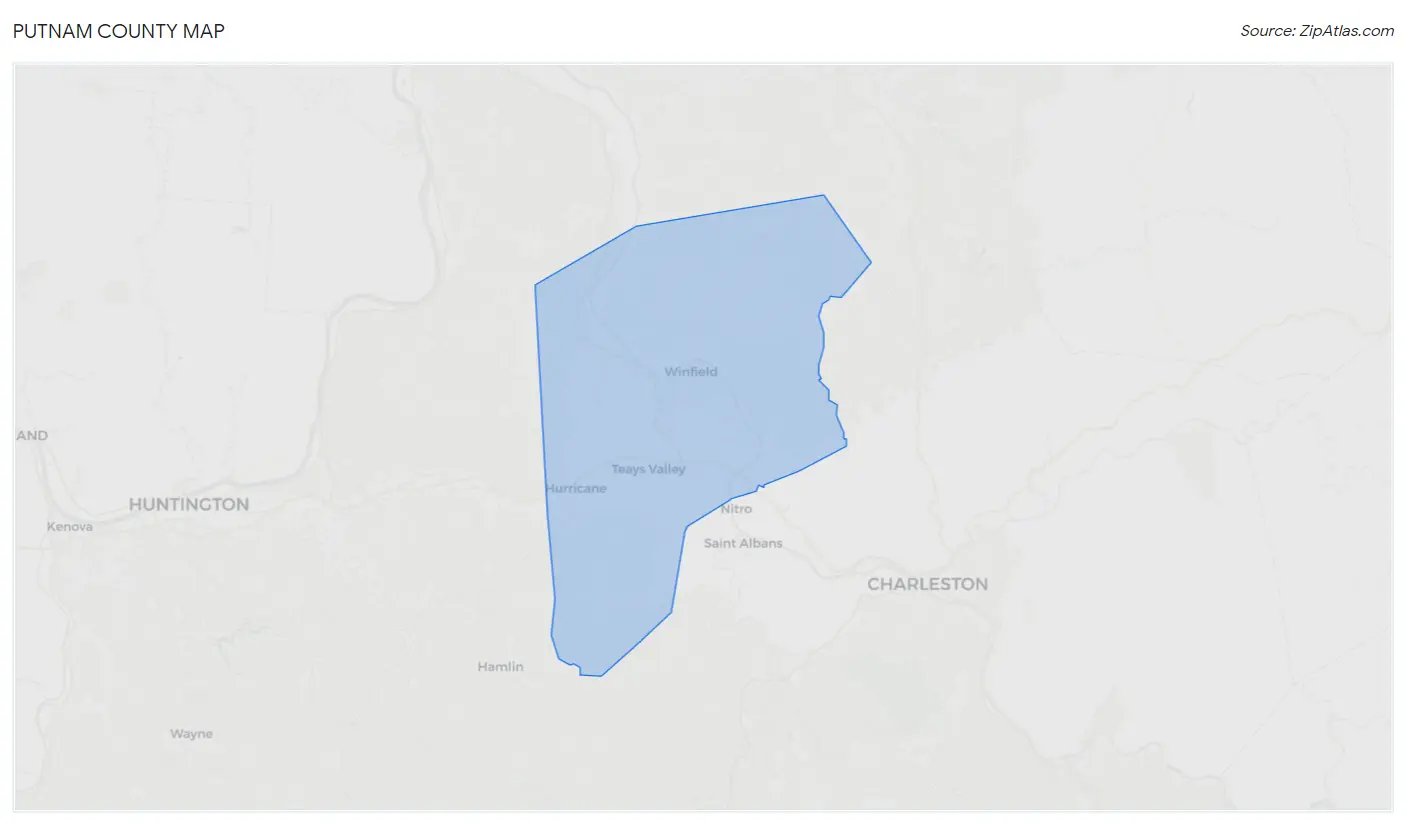
Putnam County Map
Putnam County Overview
57,347
TOTAL POPULATION
28,611
MALE POPULATION
28,736
FEMALE POPULATION
99.57
MALES / 100 FEMALES
100.44
FEMALES / 100 MALES
42.2
MEDIAN AGE
3.0
AVG FAMILY SIZE
2.5
AVG HOUSEHOLD SIZE
$38,589
PER CAPITA INCOME
$90,102
AVG FAMILY INCOME
$75,725
AVG HOUSEHOLD INCOME
35.5%
WAGE / INCOME GAP [ % ]
64.5¢/ $1
WAGE / INCOME GAP [ $ ]
$11,806
FAMILY INCOME DEFICIT
0.42
INEQUALITY / GINI INDEX
27,179
LABOR FORCE [ PEOPLE ]
58.6%
PERCENT IN LABOR FORCE
3.8%
UNEMPLOYMENT RATE
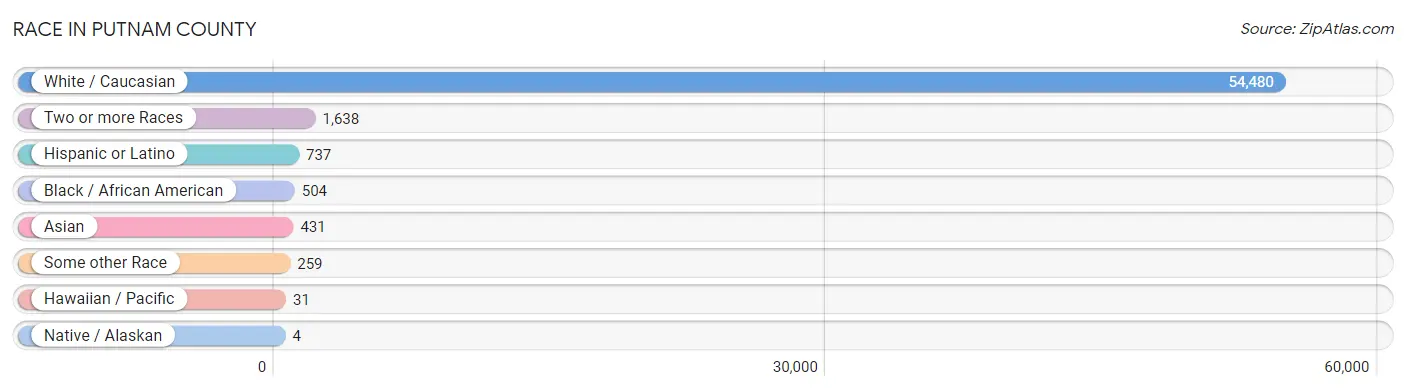
Race in Putnam County
The most populous races in Putnam County are White / Caucasian (54,480 | 95.0%), Two or more Races (1,638 | 2.9%), and Hispanic or Latino (737 | 1.3%).
| Race | # Population | % Population |
| Asian | 431 | 0.7% |
| Black / African American | 504 | 0.9% |
| Hawaiian / Pacific | 31 | 0.1% |
| Hispanic or Latino | 737 | 1.3% |
| Native / Alaskan | 4 | 0.0% |
| White / Caucasian | 54,480 | 95.0% |
| Two or more Races | 1,638 | 2.9% |
| Some other Race | 259 | 0.4% |
| Total | 57,347 | 100.0% |
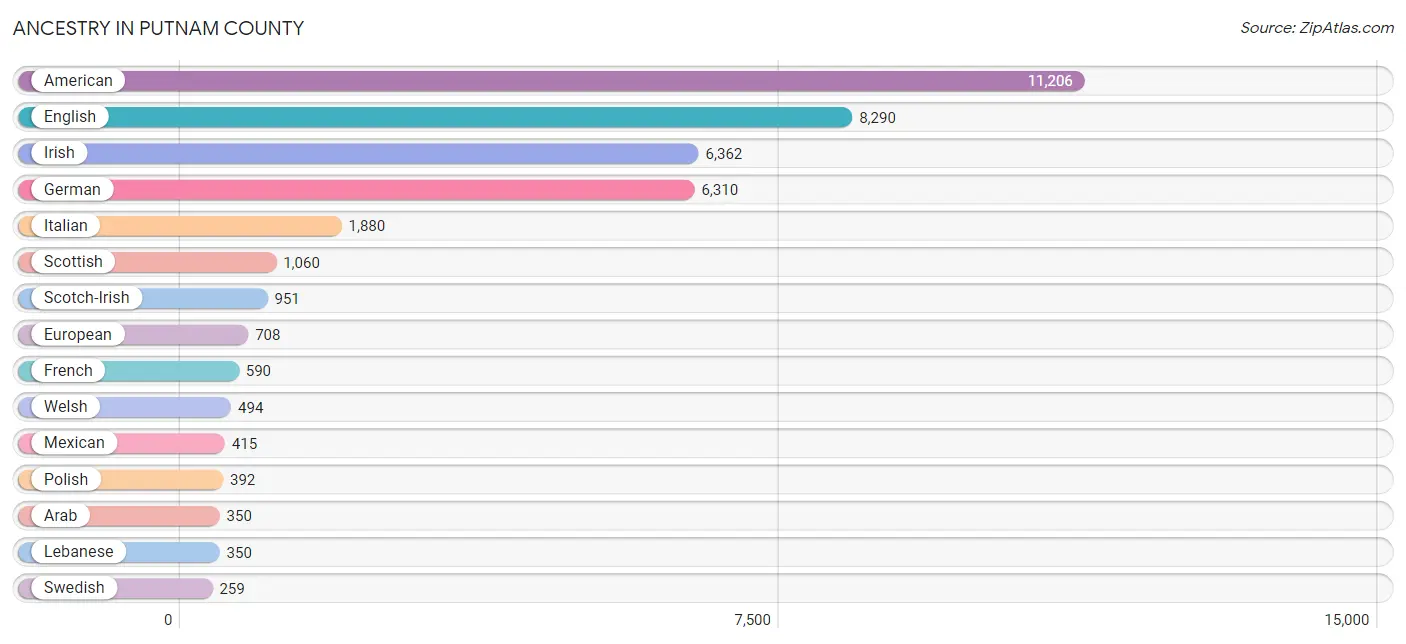
Ancestry in Putnam County
The most populous ancestries reported in Putnam County are American (11,206 | 19.5%), English (8,290 | 14.5%), Irish (6,362 | 11.1%), German (6,310 | 11.0%), and Italian (1,880 | 3.3%), together accounting for 59.4% of all Putnam County residents.
| Ancestry | # Population | % Population |
| African | 26 | 0.1% |
| American | 11,206 | 19.5% |
| Arab | 350 | 0.6% |
| Bhutanese | 246 | 0.4% |
| Blackfeet | 128 | 0.2% |
| British | 94 | 0.2% |
| Burmese | 47 | 0.1% |
| Canadian | 29 | 0.1% |
| Central American | 8 | 0.0% |
| Cherokee | 71 | 0.1% |
| Chickasaw | 38 | 0.1% |
| Choctaw | 38 | 0.1% |
| Croatian | 32 | 0.1% |
| Cuban | 61 | 0.1% |
| Czech | 52 | 0.1% |
| Czechoslovakian | 12 | 0.0% |
| Danish | 28 | 0.1% |
| Delaware | 5 | 0.0% |
| Dutch | 180 | 0.3% |
| Eastern European | 19 | 0.0% |
| English | 8,290 | 14.5% |
| Estonian | 16 | 0.0% |
| European | 708 | 1.2% |
| French | 590 | 1.0% |
| French Canadian | 30 | 0.1% |
| German | 6,310 | 11.0% |
| Greek | 162 | 0.3% |
| Guyanese | 28 | 0.1% |
| Hungarian | 141 | 0.3% |
| Inupiat | 69 | 0.1% |
| Irish | 6,362 | 11.1% |
| Italian | 1,880 | 3.3% |
| Japanese | 10 | 0.0% |
| Korean | 234 | 0.4% |
| Laotian | 18 | 0.0% |
| Lebanese | 350 | 0.6% |
| Mexican | 415 | 0.7% |
| Native Hawaiian | 44 | 0.1% |
| Nigerian | 64 | 0.1% |
| Northern European | 39 | 0.1% |
| Norwegian | 56 | 0.1% |
| Pennsylvania German | 4 | 0.0% |
| Polish | 392 | 0.7% |
| Portuguese | 50 | 0.1% |
| Puerto Rican | 156 | 0.3% |
| Romanian | 27 | 0.1% |
| Russian | 22 | 0.0% |
| Salvadoran | 8 | 0.0% |
| Scandinavian | 191 | 0.3% |
| Scotch-Irish | 951 | 1.7% |
| Scottish | 1,060 | 1.8% |
| Sioux | 26 | 0.1% |
| Slavic | 36 | 0.1% |
| Slovak | 35 | 0.1% |
| Spaniard | 13 | 0.0% |
| Subsaharan African | 90 | 0.2% |
| Swedish | 259 | 0.4% |
| Swiss | 157 | 0.3% |
| Thai | 96 | 0.2% |
| Ukrainian | 30 | 0.1% |
| Welsh | 494 | 0.9% |
| West Indian | 13 | 0.0% | View All 62 Rows |
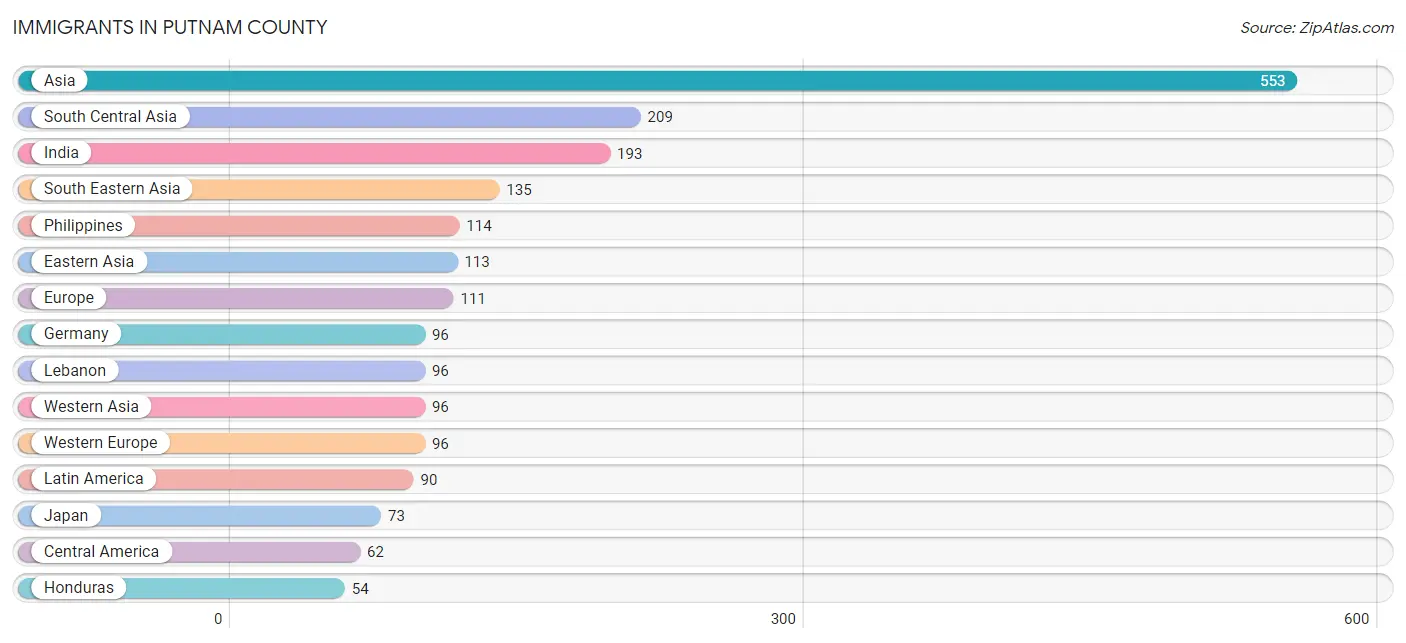
Immigrants in Putnam County
The most numerous immigrant groups reported in Putnam County came from Asia (553 | 1.0%), South Central Asia (209 | 0.4%), India (193 | 0.3%), South Eastern Asia (135 | 0.2%), and Philippines (114 | 0.2%), together accounting for 2.1% of all Putnam County residents.
| Immigration Origin | # Population | % Population |
| Asia | 553 | 1.0% |
| Cambodia | 10 | 0.0% |
| Canada | 22 | 0.0% |
| Central America | 62 | 0.1% |
| Eastern Asia | 113 | 0.2% |
| El Salvador | 8 | 0.0% |
| Europe | 111 | 0.2% |
| Germany | 96 | 0.2% |
| Greece | 15 | 0.0% |
| Guyana | 28 | 0.1% |
| Honduras | 54 | 0.1% |
| India | 193 | 0.3% |
| Indonesia | 11 | 0.0% |
| Iran | 4 | 0.0% |
| Japan | 73 | 0.1% |
| Korea | 40 | 0.1% |
| Latin America | 90 | 0.2% |
| Lebanon | 96 | 0.2% |
| Nepal | 12 | 0.0% |
| Philippines | 114 | 0.2% |
| South America | 28 | 0.1% |
| South Central Asia | 209 | 0.4% |
| South Eastern Asia | 135 | 0.2% |
| Southern Europe | 15 | 0.0% |
| Western Asia | 96 | 0.2% |
| Western Europe | 96 | 0.2% | View All 26 Rows |
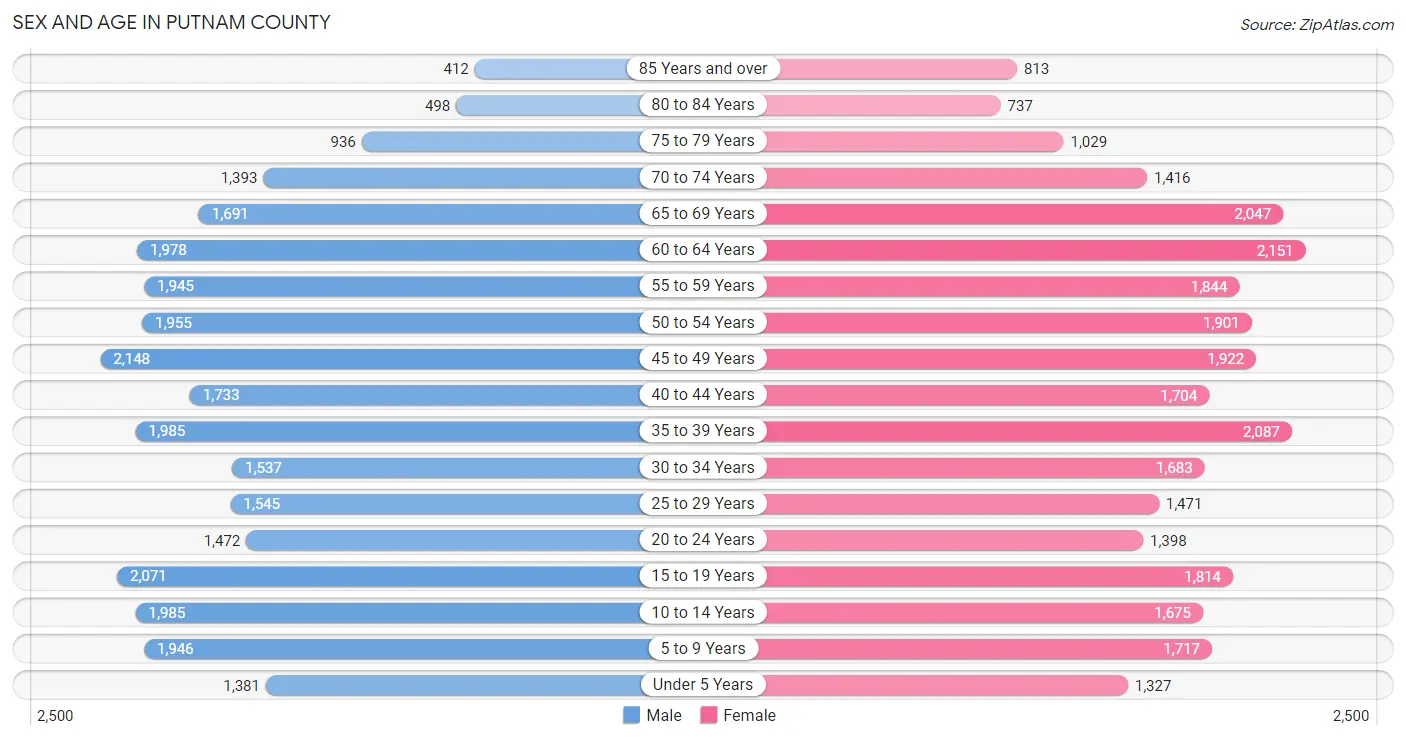
Sex and Age in Putnam County
Sex and Age in Putnam County
The most populous age groups in Putnam County are 45 to 49 Years (2,148 | 7.5%) for men and 60 to 64 Years (2,151 | 7.5%) for women.
| Age Bracket | Male | Female |
| Under 5 Years | 1,381 (4.8%) | 1,327 (4.6%) |
| 5 to 9 Years | 1,946 (6.8%) | 1,717 (6.0%) |
| 10 to 14 Years | 1,985 (6.9%) | 1,675 (5.8%) |
| 15 to 19 Years | 2,071 (7.2%) | 1,814 (6.3%) |
| 20 to 24 Years | 1,472 (5.1%) | 1,398 (4.9%) |
| 25 to 29 Years | 1,545 (5.4%) | 1,471 (5.1%) |
| 30 to 34 Years | 1,537 (5.4%) | 1,683 (5.9%) |
| 35 to 39 Years | 1,985 (6.9%) | 2,087 (7.3%) |
| 40 to 44 Years | 1,733 (6.1%) | 1,704 (5.9%) |
| 45 to 49 Years | 2,148 (7.5%) | 1,922 (6.7%) |
| 50 to 54 Years | 1,955 (6.8%) | 1,901 (6.6%) |
| 55 to 59 Years | 1,945 (6.8%) | 1,844 (6.4%) |
| 60 to 64 Years | 1,978 (6.9%) | 2,151 (7.5%) |
| 65 to 69 Years | 1,691 (5.9%) | 2,047 (7.1%) |
| 70 to 74 Years | 1,393 (4.9%) | 1,416 (4.9%) |
| 75 to 79 Years | 936 (3.3%) | 1,029 (3.6%) |
| 80 to 84 Years | 498 (1.7%) | 737 (2.6%) |
| 85 Years and over | 412 (1.4%) | 813 (2.8%) |
| Total | 28,611 (100.0%) | 28,736 (100.0%) |
Families and Households in Putnam County
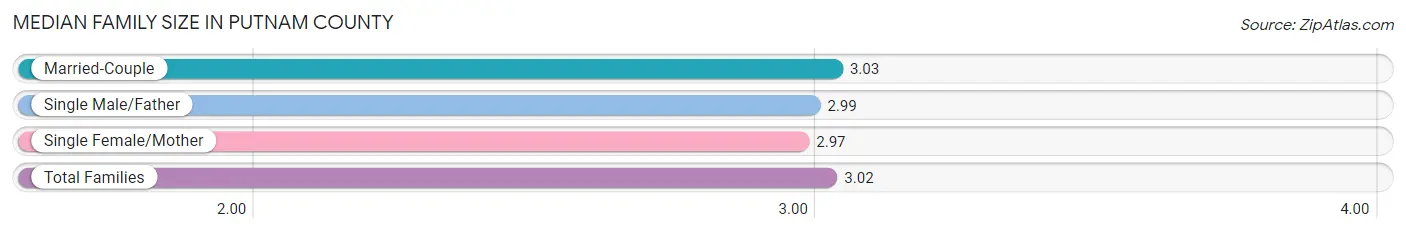
Median Family Size in Putnam County
The median family size in Putnam County is 3.02 persons per family, with married-couple families (12,775 | 80.0%) accounting for the largest median family size of 3.03 persons per family. On the other hand, single female/mother families (2,394 | 15.0%) represent the smallest median family size with 2.97 persons per family.
| Family Type | # Families | Family Size |
| Married-Couple | 12,775 (80.0%) | 3.03 |
| Single Male/Father | 796 (5.0%) | 2.99 |
| Single Female/Mother | 2,394 (15.0%) | 2.97 |
| Total Families | 15,965 (100.0%) | 3.02 |
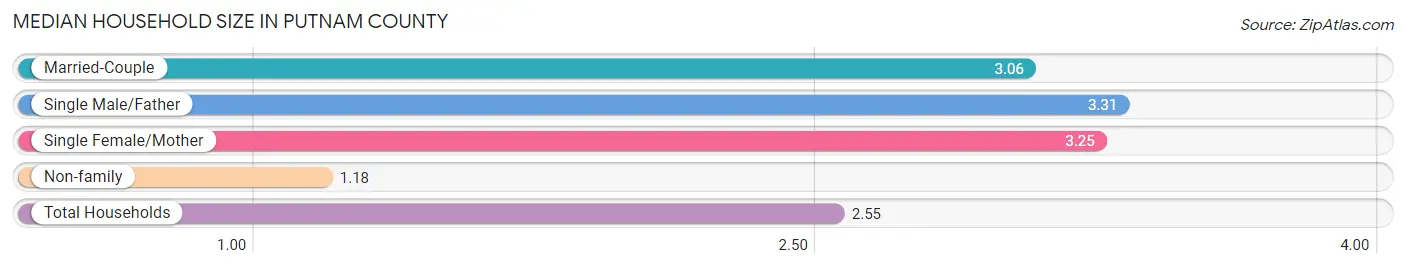
Median Household Size in Putnam County
The median household size in Putnam County is 2.55 persons per household, with single male/father households (796 | 3.5%) accounting for the largest median household size of 3.31 persons per household. non-family households (6,437 | 28.7%) represent the smallest median household size with 1.18 persons per household.
| Household Type | # Households | Household Size |
| Married-Couple | 12,775 (57.0%) | 3.06 |
| Single Male/Father | 796 (3.5%) | 3.31 |
| Single Female/Mother | 2,394 (10.7%) | 3.25 |
| Non-family | 6,437 (28.7%) | 1.18 |
| Total Households | 22,402 (100.0%) | 2.55 |
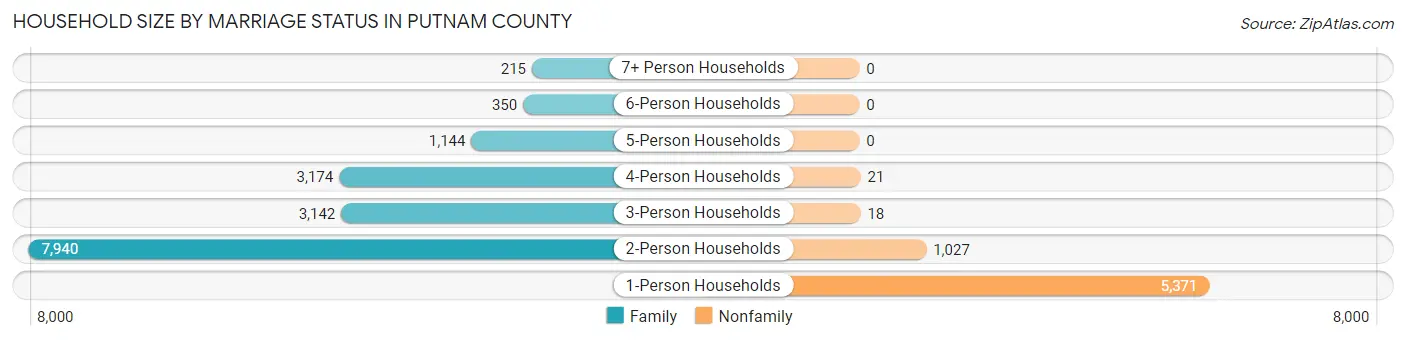
Household Size by Marriage Status in Putnam County
Out of a total of 22,402 households in Putnam County, 15,965 (71.3%) are family households, while 6,437 (28.7%) are nonfamily households. The most numerous type of family households are 2-person households, comprising 7,940, and the most common type of nonfamily households are 1-person households, comprising 5,371.
| Household Size | Family Households | Nonfamily Households |
| 1-Person Households | - | 5,371 (24.0%) |
| 2-Person Households | 7,940 (35.4%) | 1,027 (4.6%) |
| 3-Person Households | 3,142 (14.0%) | 18 (0.1%) |
| 4-Person Households | 3,174 (14.2%) | 21 (0.1%) |
| 5-Person Households | 1,144 (5.1%) | 0 (0.0%) |
| 6-Person Households | 350 (1.6%) | 0 (0.0%) |
| 7+ Person Households | 215 (1.0%) | 0 (0.0%) |
| Total | 15,965 (71.3%) | 6,437 (28.7%) |
Female Fertility in Putnam County
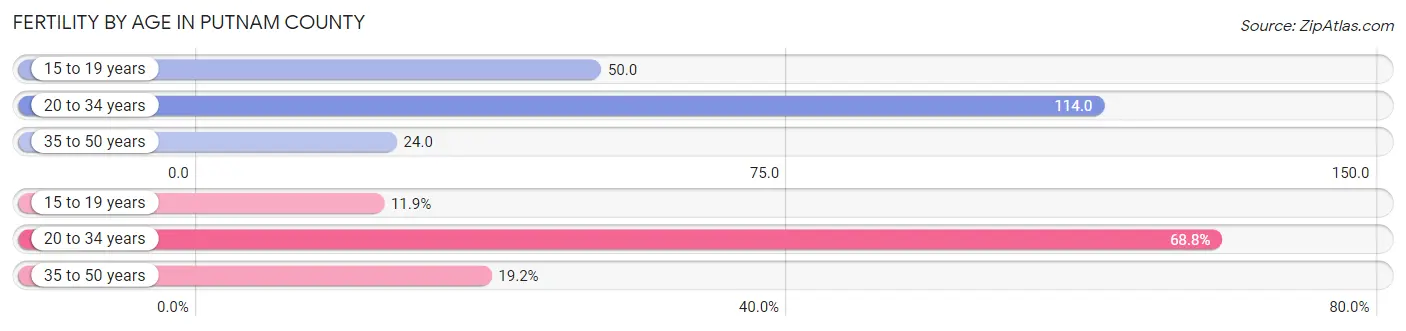
Fertility by Age in Putnam County
Average fertility rate in Putnam County is 61.0 births per 1,000 women. Women in the age bracket of 20 to 34 years have the highest fertility rate with 114.0 births per 1,000 women. Women in the age bracket of 20 to 34 years acount for 68.8% of all women with births.
| Age Bracket | Women with Births | Births / 1,000 Women |
| 15 to 19 years | 90 (11.9%) | 50.0 |
| 20 to 34 years | 519 (68.8%) | 114.0 |
| 35 to 50 years | 145 (19.2%) | 24.0 |
| Total | 754 (100.0%) | 61.0 |
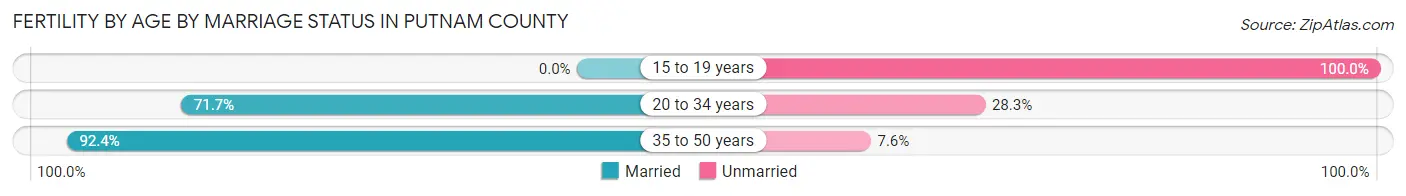
Fertility by Age by Marriage Status in Putnam County
67.1% of women with births (754) in Putnam County are married. The highest percentage of unmarried women with births falls into 15 to 19 years age bracket with 100.0% of them unmarried at the time of birth, while the lowest percentage of unmarried women with births belong to 35 to 50 years age bracket with 7.6% of them unmarried.
| Age Bracket | Married | Unmarried |
| 15 to 19 years | 0 (0.0%) | 90 (100.0%) |
| 20 to 34 years | 372 (71.7%) | 147 (28.3%) |
| 35 to 50 years | 134 (92.4%) | 11 (7.6%) |
| Total | 506 (67.1%) | 248 (32.9%) |
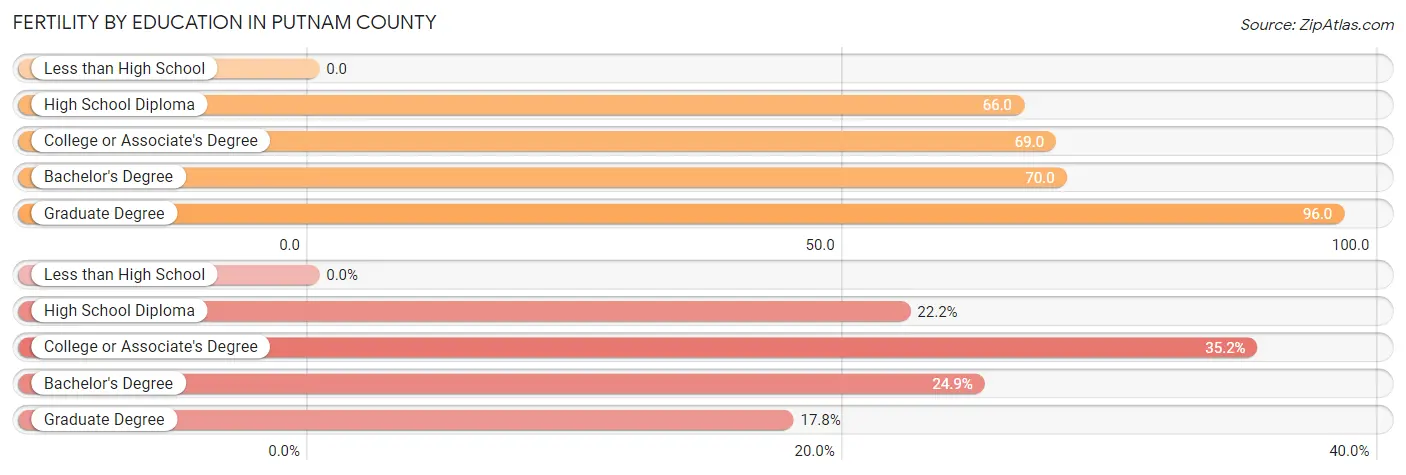
Fertility by Education in Putnam County
| Educational Attainment | Women with Births | Births / 1,000 Women |
| Less than High School | 0 (0.0%) | 0.0 |
| High School Diploma | 167 (22.2%) | 66.0 |
| College or Associate's Degree | 265 (35.1%) | 69.0 |
| Bachelor's Degree | 188 (24.9%) | 70.0 |
| Graduate Degree | 134 (17.8%) | 96.0 |
| Total | 754 (100.0%) | 61.0 |
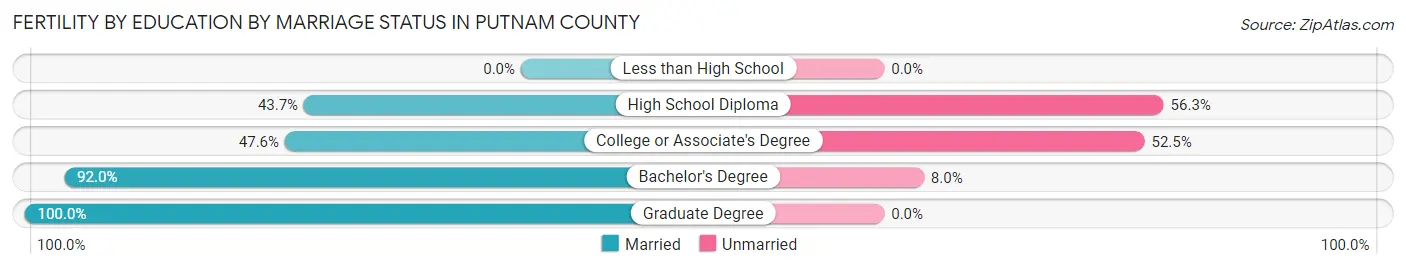
Fertility by Education by Marriage Status in Putnam County
32.9% of women with births in Putnam County are unmarried. Women with the educational attainment of graduate degree are most likely to be married with 100.0% of them married at childbirth, while women with the educational attainment of high school diploma are least likely to be married with 56.3% of them unmarried at childbirth.
| Educational Attainment | Married | Unmarried |
| Less than High School | 0 (0.0%) | 0 (0.0%) |
| High School Diploma | 73 (43.7%) | 94 (56.3%) |
| College or Associate's Degree | 126 (47.5%) | 139 (52.4%) |
| Bachelor's Degree | 173 (92.0%) | 15 (8.0%) |
| Graduate Degree | 134 (100.0%) | 0 (0.0%) |
| Total | 506 (67.1%) | 248 (32.9%) |
Income in Putnam County
Income Overview in Putnam County
Per Capita Income in Putnam County is $38,589, while median incomes of families and households are $90,102 and $75,725 respectively.
| Characteristic | Number | Measure |
| Per Capita Income | 57,347 | $38,589 |
| Median Family Income | 15,965 | $90,102 |
| Mean Family Income | 15,965 | $107,267 |
| Median Household Income | 22,402 | $75,725 |
| Mean Household Income | 22,402 | $95,296 |
| Income Deficit | 15,965 | $11,806 |
| Wage / Income Gap (%) | 57,347 | 35.50% |
| Wage / Income Gap ($) | 57,347 | 64.50¢ per $1 |
| Gini / Inequality Index | 57,347 | 0.42 |
Earnings by Sex in Putnam County
Average Earnings in Putnam County are $47,095, $57,163 for men and $36,869 for women, a difference of 35.5%.
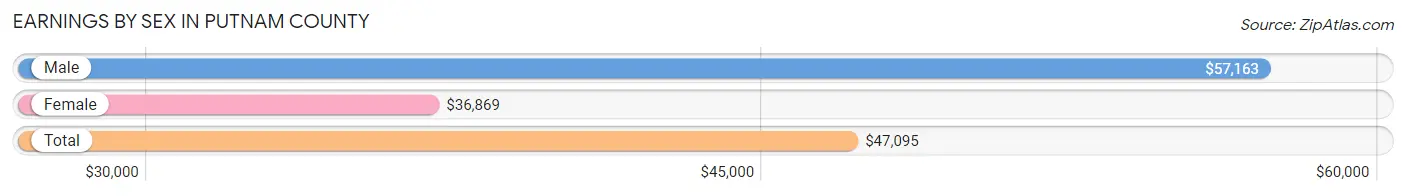
| Sex | Number | Average Earnings |
| Male | 15,083 (54.0%) | $57,163 |
| Female | 12,836 (46.0%) | $36,869 |
| Total | 27,919 (100.0%) | $47,095 |
Earnings by Sex by Income Bracket in Putnam County
The most common earnings brackets in Putnam County are $100,000+ for men (3,315 | 22.0%) and $75,000 to $99,999 for women (1,169 | 9.1%).
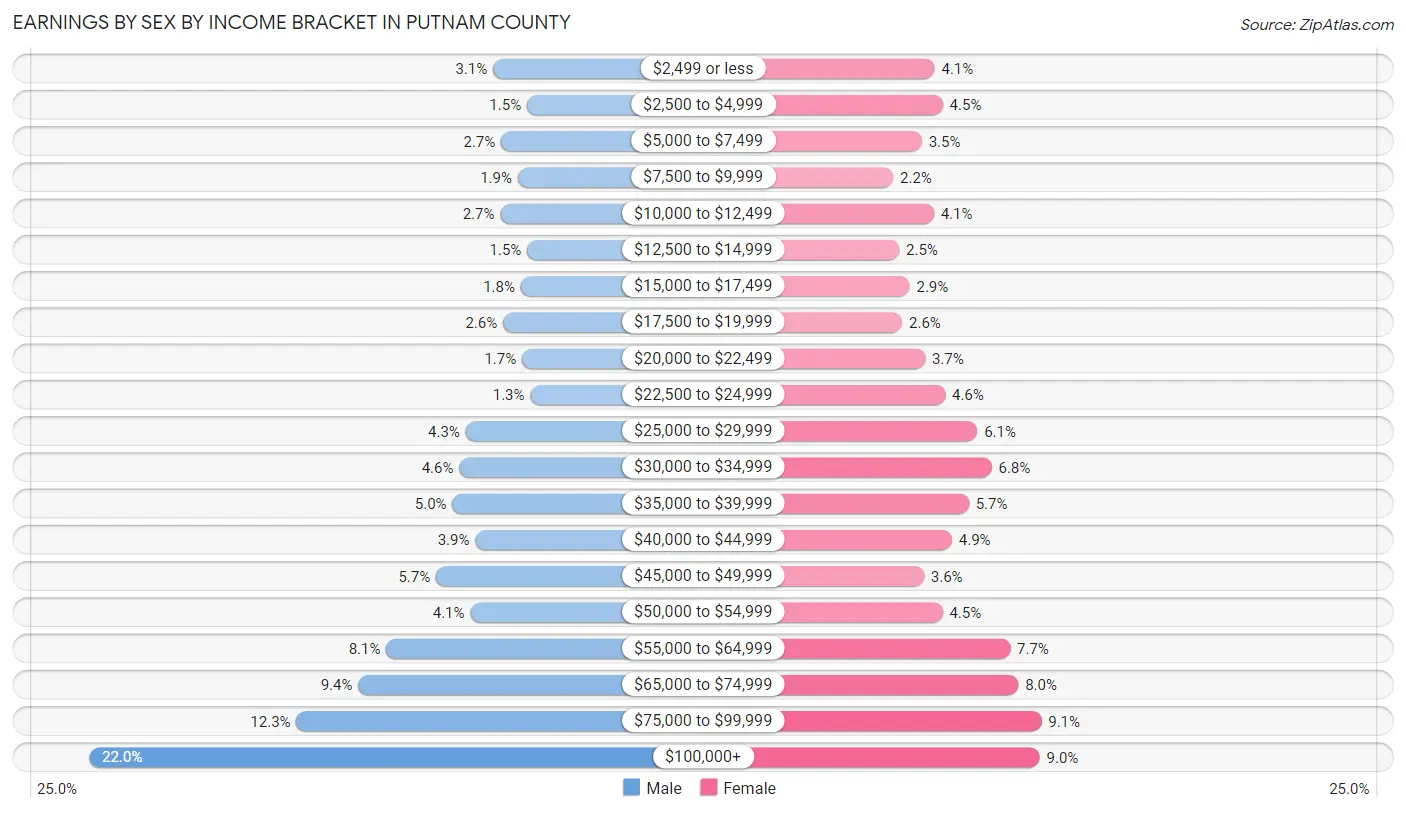
| Income | Male | Female |
| $2,499 or less | 461 (3.1%) | 527 (4.1%) |
| $2,500 to $4,999 | 221 (1.5%) | 576 (4.5%) |
| $5,000 to $7,499 | 404 (2.7%) | 450 (3.5%) |
| $7,500 to $9,999 | 286 (1.9%) | 279 (2.2%) |
| $10,000 to $12,499 | 411 (2.7%) | 522 (4.1%) |
| $12,500 to $14,999 | 220 (1.5%) | 314 (2.5%) |
| $15,000 to $17,499 | 265 (1.8%) | 377 (2.9%) |
| $17,500 to $19,999 | 391 (2.6%) | 333 (2.6%) |
| $20,000 to $22,499 | 257 (1.7%) | 470 (3.7%) |
| $22,500 to $24,999 | 197 (1.3%) | 590 (4.6%) |
| $25,000 to $29,999 | 655 (4.3%) | 784 (6.1%) |
| $30,000 to $34,999 | 700 (4.6%) | 870 (6.8%) |
| $35,000 to $39,999 | 748 (5.0%) | 733 (5.7%) |
| $40,000 to $44,999 | 586 (3.9%) | 631 (4.9%) |
| $45,000 to $49,999 | 864 (5.7%) | 464 (3.6%) |
| $50,000 to $54,999 | 622 (4.1%) | 575 (4.5%) |
| $55,000 to $64,999 | 1,215 (8.1%) | 982 (7.6%) |
| $65,000 to $74,999 | 1,414 (9.4%) | 1,031 (8.0%) |
| $75,000 to $99,999 | 1,851 (12.3%) | 1,169 (9.1%) |
| $100,000+ | 3,315 (22.0%) | 1,159 (9.0%) |
| Total | 15,083 (100.0%) | 12,836 (100.0%) |
Earnings by Sex by Educational Attainment in Putnam County
Average earnings in Putnam County are $64,131 for men and $40,116 for women, a difference of 37.4%. Men with an educational attainment of graduate degree enjoy the highest average annual earnings of $118,917, while those with high school diploma education earn the least with $51,488. Women with an educational attainment of graduate degree earn the most with the average annual earnings of $71,346, while those with less than high school education have the smallest earnings of $18,727.
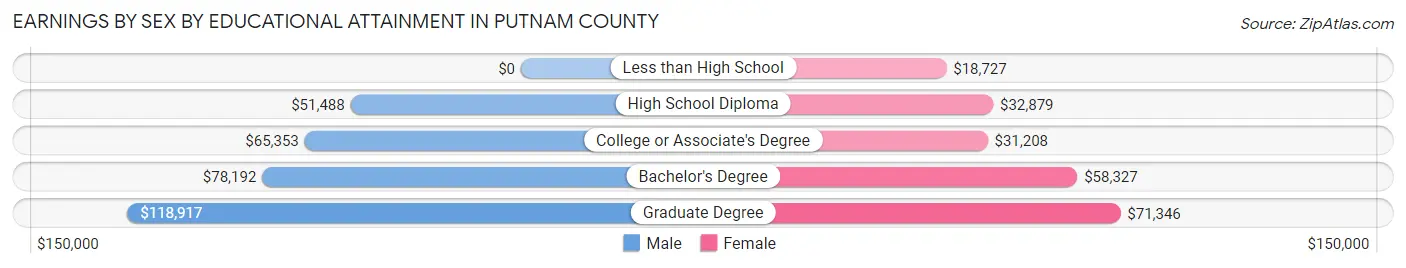
| Educational Attainment | Male Income | Female Income |
| Less than High School | - | - |
| High School Diploma | $51,488 | $32,879 |
| College or Associate's Degree | $65,353 | $31,208 |
| Bachelor's Degree | $78,192 | $58,327 |
| Graduate Degree | $118,917 | $71,346 |
| Total | $64,131 | $40,116 |
Family Income in Putnam County
Family Income Brackets in Putnam County
According to the Putnam County family income data, there are 3,927 families falling into the $100,000 to $149,999 income range, which is the most common income bracket and makes up 24.6% of all families. Conversely, the $10,000 to $14,999 income bracket is the least frequent group with only 112 families (0.7%) belonging to this category.
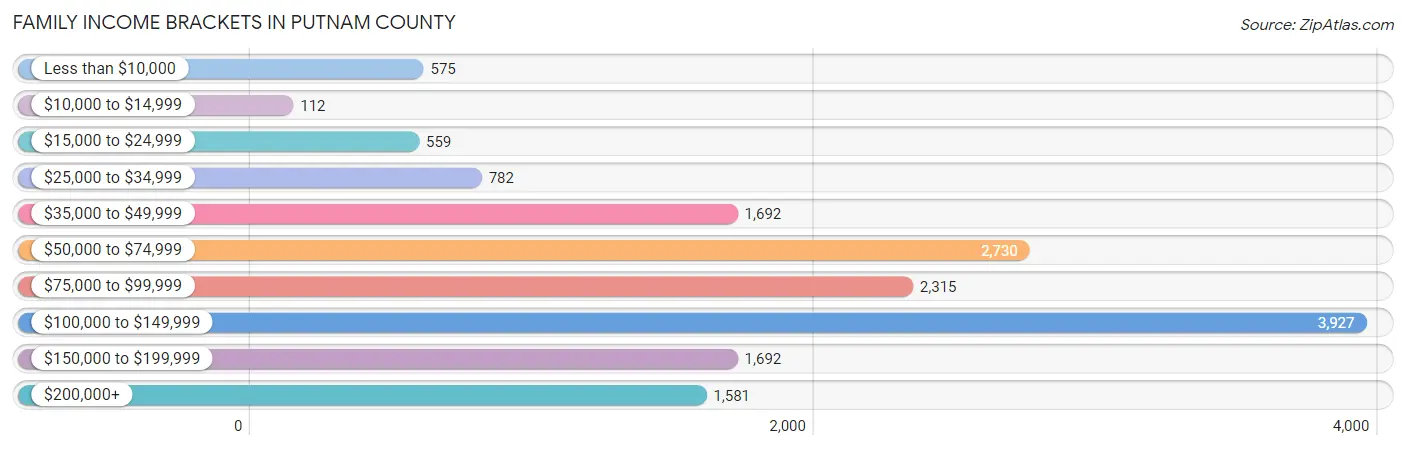
| Income Bracket | # Families | % Families |
| Less than $10,000 | 575 | 3.6% |
| $10,000 to $14,999 | 112 | 0.7% |
| $15,000 to $24,999 | 559 | 3.5% |
| $25,000 to $34,999 | 782 | 4.9% |
| $35,000 to $49,999 | 1,692 | 10.6% |
| $50,000 to $74,999 | 2,730 | 17.1% |
| $75,000 to $99,999 | 2,315 | 14.5% |
| $100,000 to $149,999 | 3,927 | 24.6% |
| $150,000 to $199,999 | 1,692 | 10.6% |
| $200,000+ | 1,581 | 9.9% |
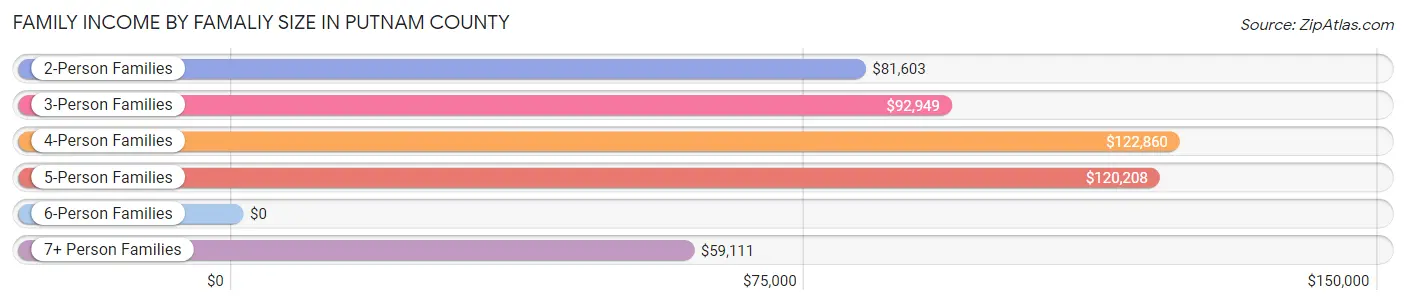
Family Income by Famaliy Size in Putnam County
4-person families (2,844 | 17.8%) account for the highest median family income in Putnam County with $122,860 per family, while 2-person families (8,214 | 51.4%) have the highest median income of $40,802 per family member.
| Income Bracket | # Families | Median Income |
| 2-Person Families | 8,214 (51.4%) | $81,603 |
| 3-Person Families | 3,306 (20.7%) | $92,949 |
| 4-Person Families | 2,844 (17.8%) | $122,860 |
| 5-Person Families | 1,106 (6.9%) | $120,208 |
| 6-Person Families | 303 (1.9%) | $0 |
| 7+ Person Families | 192 (1.2%) | $59,111 |
| Total | 15,965 (100.0%) | $90,102 |
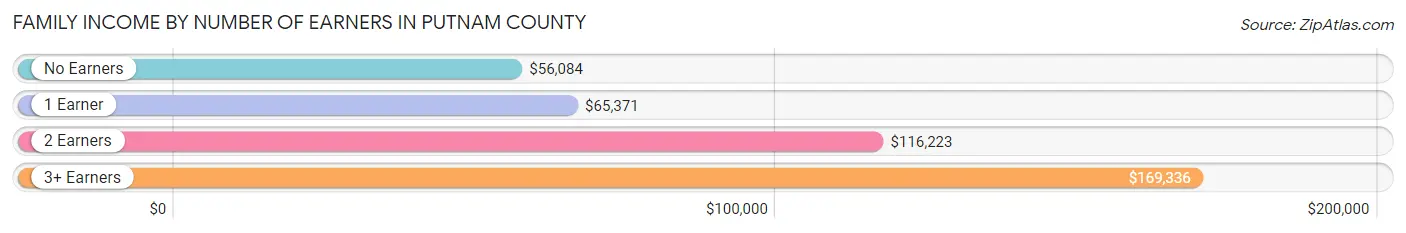
Family Income by Number of Earners in Putnam County
The median family income in Putnam County is $90,102, with families comprising 3+ earners (1,079) having the highest median family income of $169,336, while families with no earners (3,756) have the lowest median family income of $56,084, accounting for 6.8% and 23.5% of families, respectively.
| Number of Earners | # Families | Median Income |
| No Earners | 3,756 (23.5%) | $56,084 |
| 1 Earner | 4,895 (30.7%) | $65,371 |
| 2 Earners | 6,235 (39.1%) | $116,223 |
| 3+ Earners | 1,079 (6.8%) | $169,336 |
| Total | 15,965 (100.0%) | $90,102 |
Household Income in Putnam County
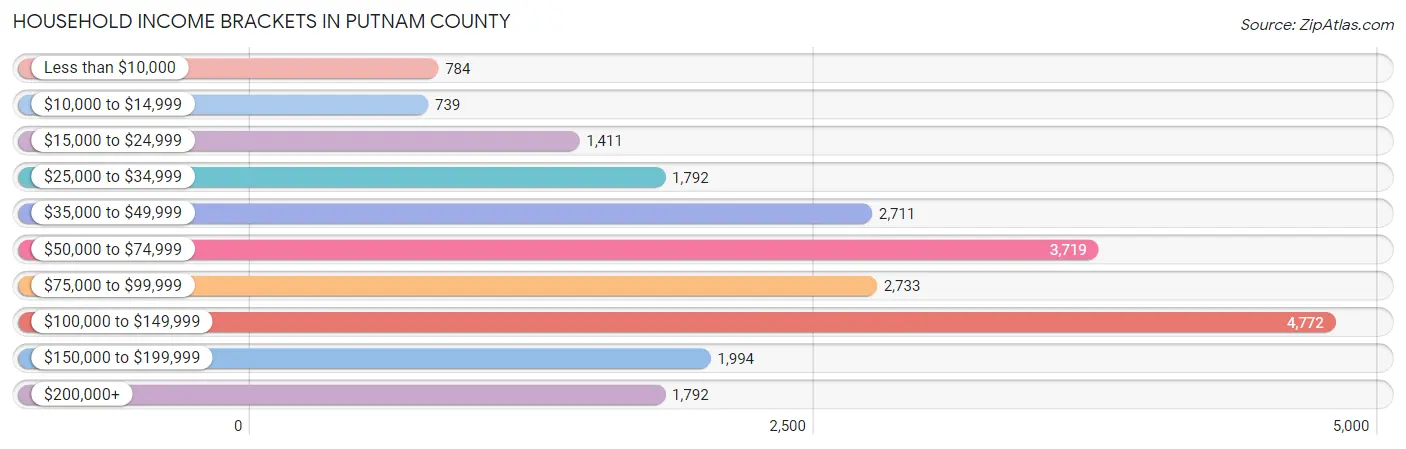
Household Income Brackets in Putnam County
With 4,772 households falling in the category, the $100,000 to $149,999 income range is the most frequent in Putnam County, accounting for 21.3% of all households. In contrast, only 739 households (3.3%) fall into the $10,000 to $14,999 income bracket, making it the least populous group.
| Income Bracket | # Households | % Households |
| Less than $10,000 | 784 | 3.5% |
| $10,000 to $14,999 | 739 | 3.3% |
| $15,000 to $24,999 | 1,411 | 6.3% |
| $25,000 to $34,999 | 1,792 | 8.0% |
| $35,000 to $49,999 | 2,711 | 12.1% |
| $50,000 to $74,999 | 3,719 | 16.6% |
| $75,000 to $99,999 | 2,733 | 12.2% |
| $100,000 to $149,999 | 4,772 | 21.3% |
| $150,000 to $199,999 | 1,994 | 8.9% |
| $200,000+ | 1,792 | 8.0% |
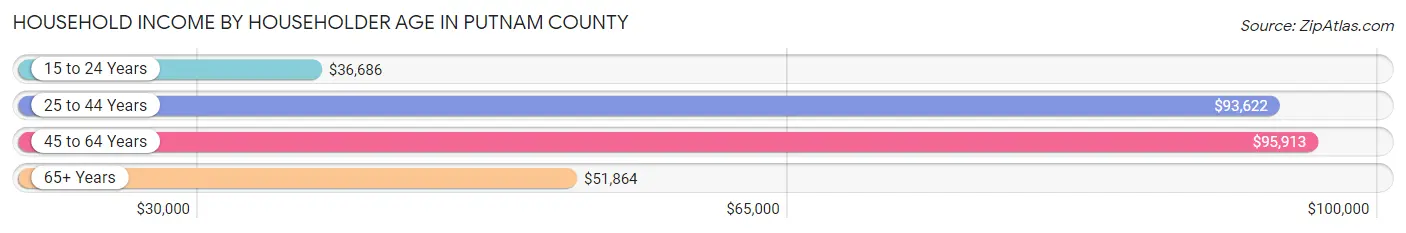
Household Income by Householder Age in Putnam County
The median household income in Putnam County is $75,725, with the highest median household income of $95,913 found in the 45 to 64 years age bracket for the primary householder. A total of 8,731 households (39.0%) fall into this category. Meanwhile, the 15 to 24 years age bracket for the primary householder has the lowest median household income of $36,686, with 500 households (2.2%) in this group.
| Income Bracket | # Households | Median Income |
| 15 to 24 Years | 500 (2.2%) | $36,686 |
| 25 to 44 Years | 6,633 (29.6%) | $93,622 |
| 45 to 64 Years | 8,731 (39.0%) | $95,913 |
| 65+ Years | 6,538 (29.2%) | $51,864 |
| Total | 22,402 (100.0%) | $75,725 |
Poverty in Putnam County
Income Below Poverty by Sex and Age in Putnam County
With 8.8% poverty level for males and 13.1% for females among the residents of Putnam County, 5 year old males and 5 year old females are the most vulnerable to poverty, with 92 males (24.7%) and 150 females (36.9%) in their respective age groups living below the poverty level.
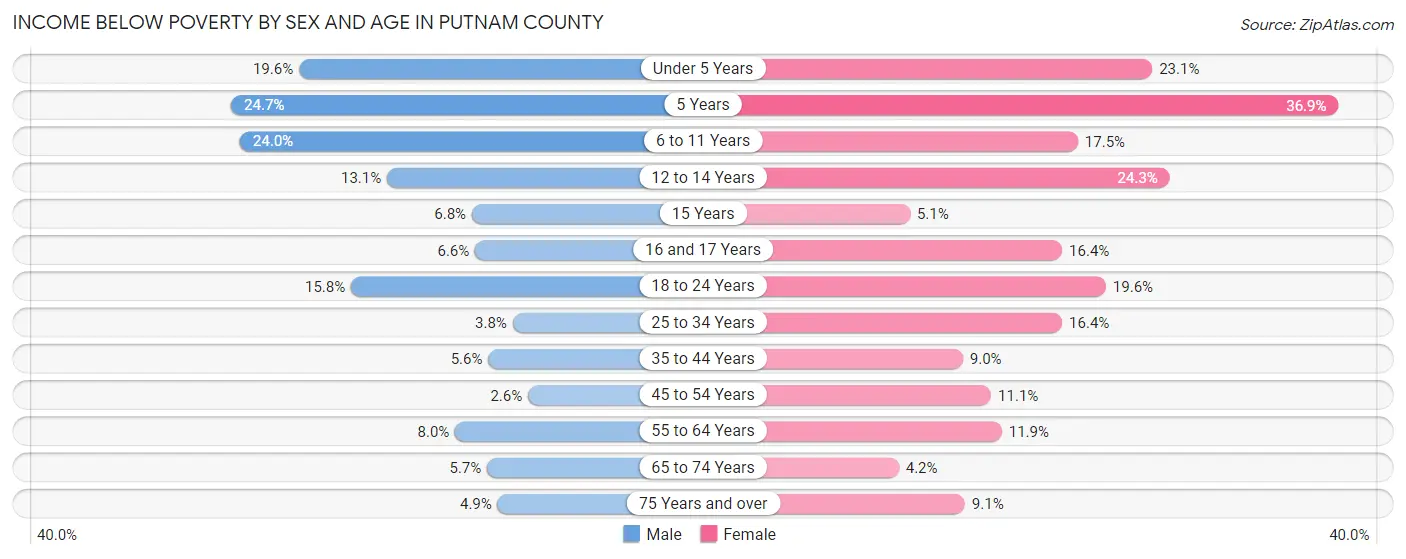
| Age Bracket | Male | Female |
| Under 5 Years | 263 (19.6%) | 301 (23.1%) |
| 5 Years | 92 (24.7%) | 150 (36.9%) |
| 6 to 11 Years | 549 (24.0%) | 319 (17.5%) |
| 12 to 14 Years | 163 (13.1%) | 269 (24.3%) |
| 15 Years | 42 (6.8%) | 16 (5.1%) |
| 16 and 17 Years | 44 (6.6%) | 140 (16.4%) |
| 18 to 24 Years | 355 (15.8%) | 400 (19.6%) |
| 25 to 34 Years | 116 (3.8%) | 516 (16.4%) |
| 35 to 44 Years | 207 (5.6%) | 341 (9.0%) |
| 45 to 54 Years | 107 (2.6%) | 423 (11.1%) |
| 55 to 64 Years | 314 (8.0%) | 473 (11.9%) |
| 65 to 74 Years | 172 (5.7%) | 145 (4.2%) |
| 75 Years and over | 89 (4.9%) | 223 (9.1%) |
| Total | 2,513 (8.8%) | 3,716 (13.1%) |
Income Above Poverty by Sex and Age in Putnam County
According to the poverty statistics in Putnam County, males aged 45 to 54 years and females aged 65 to 74 years are the age groups that are most secure financially, with 97.4% of males and 95.8% of females in these age groups living above the poverty line.
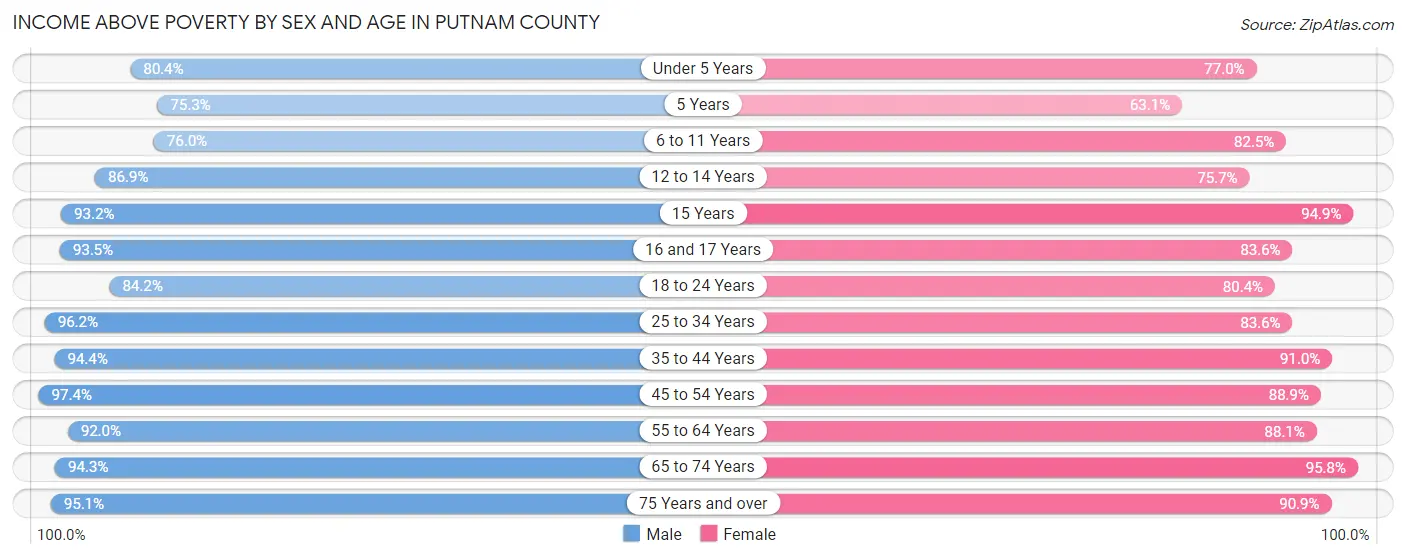
| Age Bracket | Male | Female |
| Under 5 Years | 1,077 (80.4%) | 1,005 (76.9%) |
| 5 Years | 281 (75.3%) | 257 (63.1%) |
| 6 to 11 Years | 1,738 (76.0%) | 1,501 (82.5%) |
| 12 to 14 Years | 1,082 (86.9%) | 836 (75.7%) |
| 15 Years | 577 (93.2%) | 300 (94.9%) |
| 16 and 17 Years | 628 (93.4%) | 716 (83.6%) |
| 18 to 24 Years | 1,897 (84.2%) | 1,640 (80.4%) |
| 25 to 34 Years | 2,966 (96.2%) | 2,638 (83.6%) |
| 35 to 44 Years | 3,511 (94.4%) | 3,450 (91.0%) |
| 45 to 54 Years | 3,979 (97.4%) | 3,390 (88.9%) |
| 55 to 64 Years | 3,597 (92.0%) | 3,508 (88.1%) |
| 65 to 74 Years | 2,868 (94.3%) | 3,285 (95.8%) |
| 75 Years and over | 1,736 (95.1%) | 2,218 (90.9%) |
| Total | 25,937 (91.2%) | 24,744 (86.9%) |
Income Below Poverty Among Married-Couple Families in Putnam County
The poverty statistics for married-couple families in Putnam County show that 3.7% or 478 of the total 12,775 families live below the poverty line. Families with 5 or more children have the highest poverty rate of 51.8%, comprising of 56 families. On the other hand, families with no children have the lowest poverty rate of 1.9%, which includes 145 families.
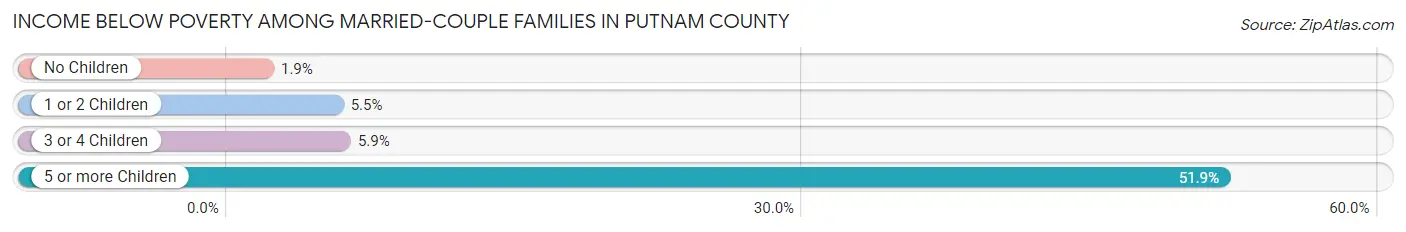
| Children | Above Poverty | Below Poverty |
| No Children | 7,561 (98.1%) | 145 (1.9%) |
| 1 or 2 Children | 3,935 (94.5%) | 230 (5.5%) |
| 3 or 4 Children | 749 (94.1%) | 47 (5.9%) |
| 5 or more Children | 52 (48.1%) | 56 (51.8%) |
| Total | 12,297 (96.3%) | 478 (3.7%) |
Income Below Poverty Among Single-Parent Households in Putnam County
According to the poverty data in Putnam County, 9.8% or 78 single-father households and 30.7% or 735 single-mother households are living below the poverty line. Among single-father households, those with 1 or 2 children have the highest poverty rate, with 65 households (15.8%) experiencing poverty. Likewise, among single-mother households, those with 5 or more children have the highest poverty rate, with 11 households (100.0%) falling below the poverty line.
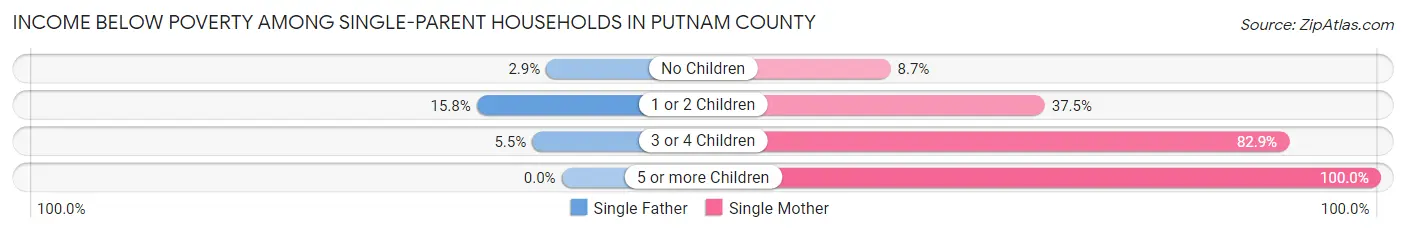
| Children | Single Father | Single Mother |
| No Children | 9 (2.9%) | 74 (8.7%) |
| 1 or 2 Children | 65 (15.8%) | 514 (37.5%) |
| 3 or 4 Children | 4 (5.5%) | 136 (82.9%) |
| 5 or more Children | 0 (0.0%) | 11 (100.0%) |
| Total | 78 (9.8%) | 735 (30.7%) |
Income Below Poverty Among Married-Couple vs Single-Parent Households in Putnam County
The poverty data for Putnam County shows that 478 of the married-couple family households (3.7%) and 813 of the single-parent households (25.5%) are living below the poverty level. Within the married-couple family households, those with 5 or more children have the highest poverty rate, with 56 households (51.8%) falling below the poverty line. Among the single-parent households, those with 5 or more children have the highest poverty rate, with 11 household (100.0%) living below poverty.
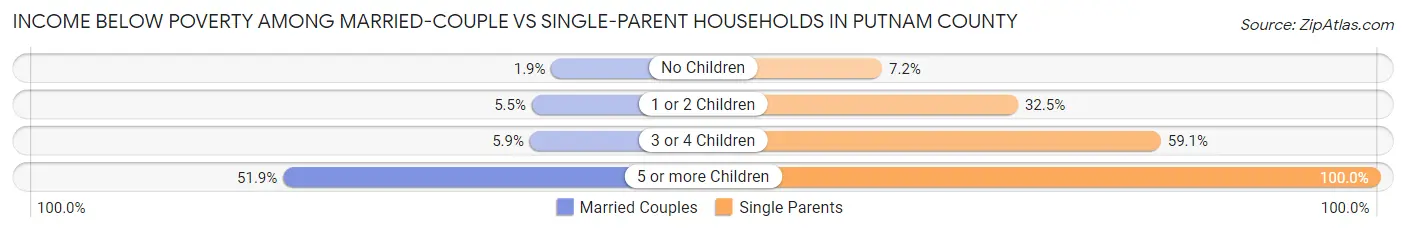
| Children | Married-Couple Families | Single-Parent Households |
| No Children | 145 (1.9%) | 83 (7.2%) |
| 1 or 2 Children | 230 (5.5%) | 579 (32.5%) |
| 3 or 4 Children | 47 (5.9%) | 140 (59.1%) |
| 5 or more Children | 56 (51.8%) | 11 (100.0%) |
| Total | 478 (3.7%) | 813 (25.5%) |
Employment Characteristics in Putnam County
Employment by Class of Employer in Putnam County
Among the 25,790 employed individuals in Putnam County, private company employees (17,445 | 67.6%), not-for-profit organizations (1,966 | 7.6%), and state government employees (1,735 | 6.7%) make up the most common classes of employment.
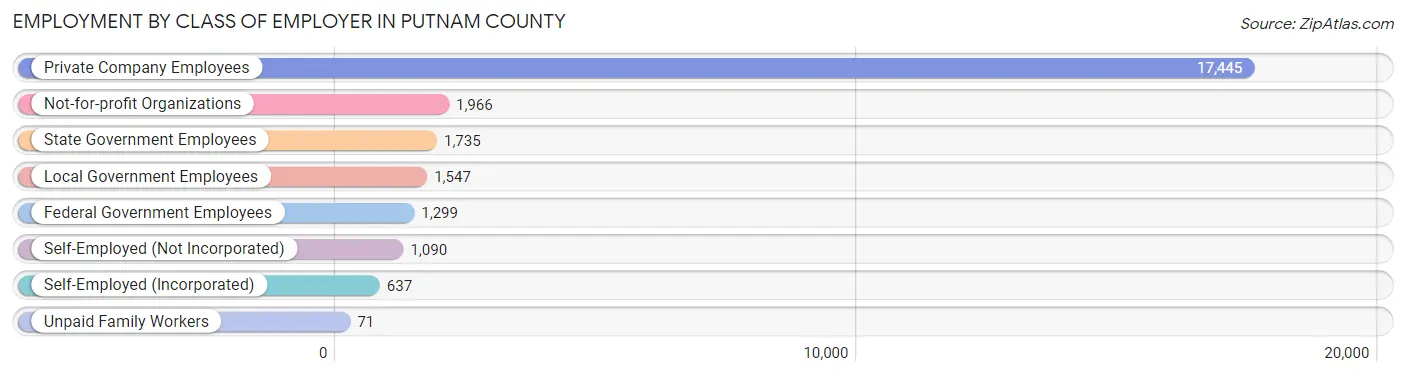
| Employer Class | # Employees | % Employees |
| Private Company Employees | 17,445 | 67.6% |
| Self-Employed (Incorporated) | 637 | 2.5% |
| Self-Employed (Not Incorporated) | 1,090 | 4.2% |
| Not-for-profit Organizations | 1,966 | 7.6% |
| Local Government Employees | 1,547 | 6.0% |
| State Government Employees | 1,735 | 6.7% |
| Federal Government Employees | 1,299 | 5.0% |
| Unpaid Family Workers | 71 | 0.3% |
| Total | 25,790 | 100.0% |
Employment Status by Age in Putnam County
According to the labor force statistics for Putnam County, out of the total population over 16 years of age (46,381), 58.6% or 27,179 individuals are in the labor force, with 3.8% or 1,033 of them unemployed. The age group with the highest labor force participation rate is 25 to 29 years, with 85.9% or 2,591 individuals in the labor force. Within the labor force, the 16 to 19 years age range has the highest percentage of unemployed individuals, with 13.3% or 120 of them being unemployed.
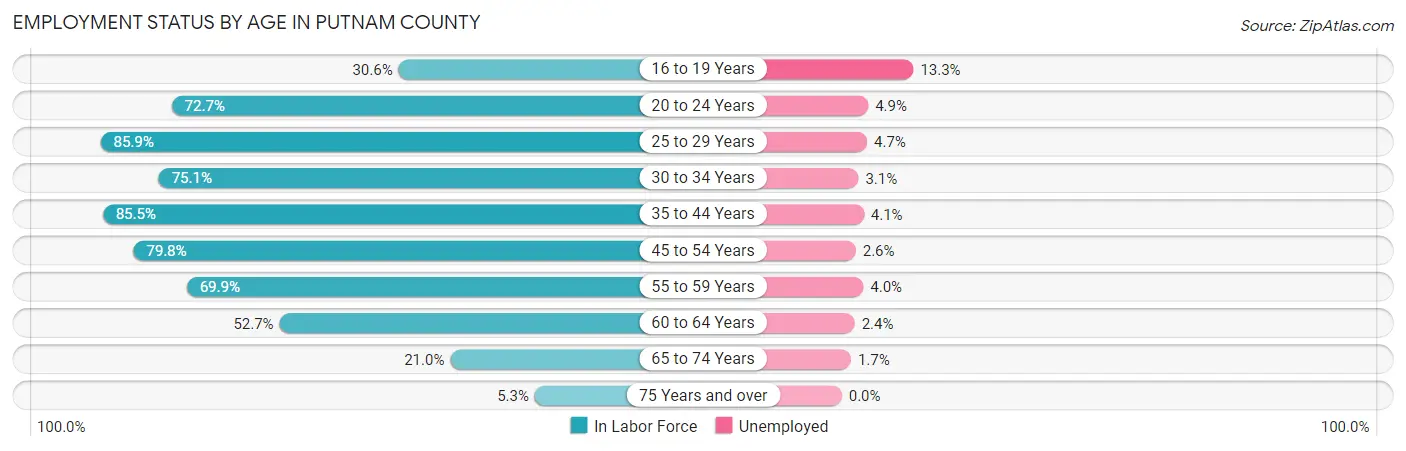
| Age Bracket | In Labor Force | Unemployed |
| 16 to 19 Years | 903 (30.6%) | 120 (13.3%) |
| 20 to 24 Years | 2,086 (72.7%) | 102 (4.9%) |
| 25 to 29 Years | 2,591 (85.9%) | 122 (4.7%) |
| 30 to 34 Years | 2,418 (75.1%) | 75 (3.1%) |
| 35 to 44 Years | 6,420 (85.5%) | 263 (4.1%) |
| 45 to 54 Years | 6,325 (79.8%) | 164 (2.6%) |
| 55 to 59 Years | 2,649 (69.9%) | 106 (4.0%) |
| 60 to 64 Years | 2,176 (52.7%) | 52 (2.4%) |
| 65 to 74 Years | 1,375 (21.0%) | 23 (1.7%) |
| 75 Years and over | 235 (5.3%) | 0 (0.0%) |
| Total | 27,179 (58.6%) | 1,033 (3.8%) |
Employment Status by Educational Attainment in Putnam County
According to labor force statistics for Putnam County, 76.3% of individuals (22,576) out of the total population between 25 and 64 years of age (29,589) are in the labor force, with 3.5% or 790 of them being unemployed. The group with the highest labor force participation rate are those with the educational attainment of bachelor's degree or higher, with 87.5% or 8,899 individuals in the labor force. Within the labor force, individuals with less than high school education have the highest percentage of unemployment, with 5.8% or 53 of them being unemployed.
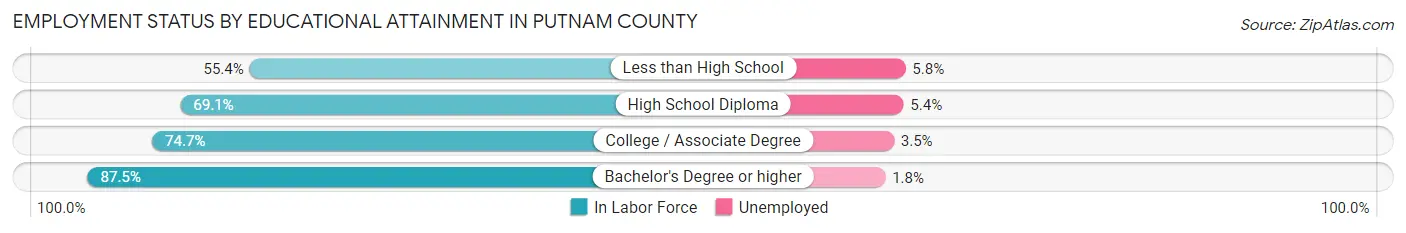
| Educational Attainment | In Labor Force | Unemployed |
| Less than High School | 906 (55.4%) | 95 (5.8%) |
| High School Diploma | 6,262 (69.1%) | 489 (5.4%) |
| College / Associate Degree | 6,515 (74.7%) | 305 (3.5%) |
| Bachelor's Degree or higher | 8,899 (87.5%) | 183 (1.8%) |
| Total | 22,576 (76.3%) | 1,036 (3.5%) |
Employment Occupations by Sex in Putnam County
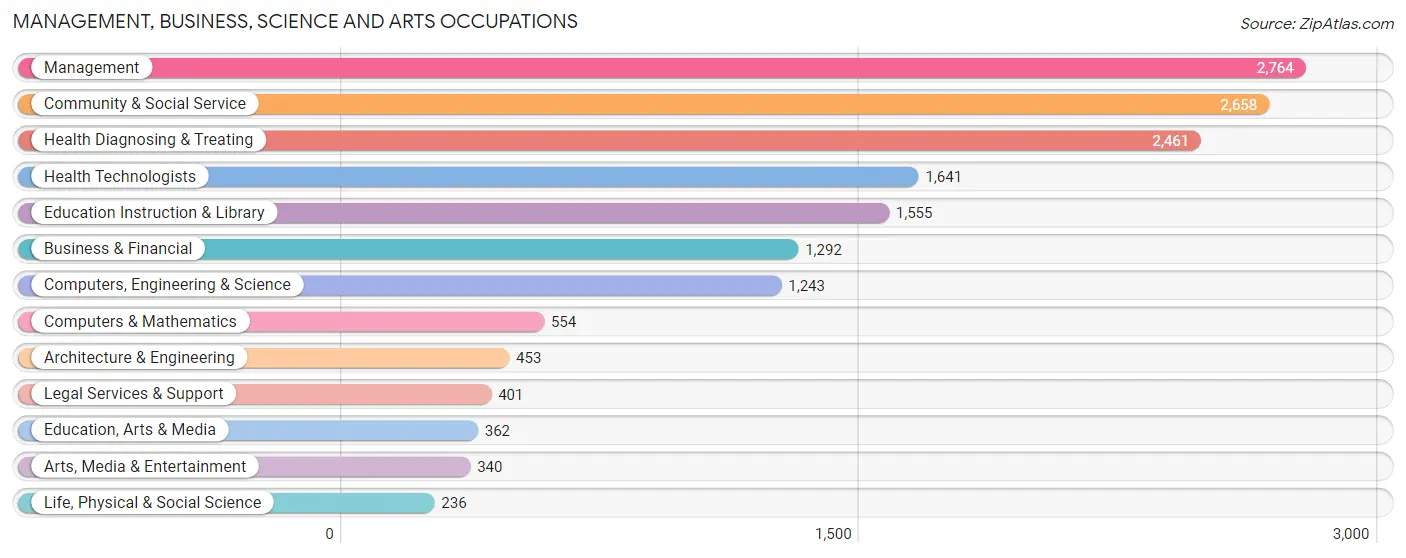
Management, Business, Science and Arts Occupations
The most common Management, Business, Science and Arts occupations in Putnam County are Management (2,764 | 10.7%), Community & Social Service (2,658 | 10.3%), Health Diagnosing & Treating (2,461 | 9.6%), Health Technologists (1,641 | 6.4%), and Education Instruction & Library (1,555 | 6.0%).
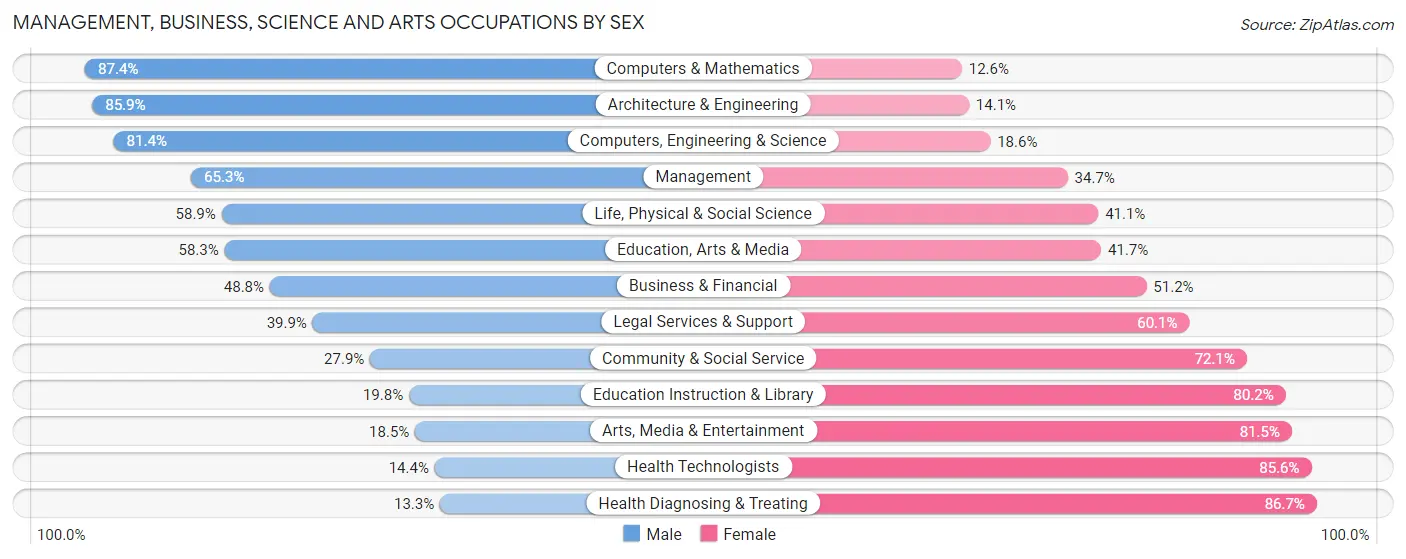
Management, Business, Science and Arts Occupations by Sex
Within the Management, Business, Science and Arts occupations in Putnam County, the most male-oriented occupations are Computers & Mathematics (87.4%), Architecture & Engineering (85.9%), and Computers, Engineering & Science (81.4%), while the most female-oriented occupations are Health Diagnosing & Treating (86.7%), Health Technologists (85.6%), and Arts, Media & Entertainment (81.5%).
| Occupation | Male | Female |
| Management | 1,804 (65.3%) | 960 (34.7%) |
| Business & Financial | 631 (48.8%) | 661 (51.2%) |
| Computers, Engineering & Science | 1,012 (81.4%) | 231 (18.6%) |
| Computers & Mathematics | 484 (87.4%) | 70 (12.6%) |
| Architecture & Engineering | 389 (85.9%) | 64 (14.1%) |
| Life, Physical & Social Science | 139 (58.9%) | 97 (41.1%) |
| Community & Social Service | 742 (27.9%) | 1,916 (72.1%) |
| Education, Arts & Media | 211 (58.3%) | 151 (41.7%) |
| Legal Services & Support | 160 (39.9%) | 241 (60.1%) |
| Education Instruction & Library | 308 (19.8%) | 1,247 (80.2%) |
| Arts, Media & Entertainment | 63 (18.5%) | 277 (81.5%) |
| Health Diagnosing & Treating | 328 (13.3%) | 2,133 (86.7%) |
| Health Technologists | 237 (14.4%) | 1,404 (85.6%) |
| Total (Category) | 4,517 (43.4%) | 5,901 (56.6%) |
| Total (Overall) | 13,873 (53.8%) | 11,892 (46.2%) |
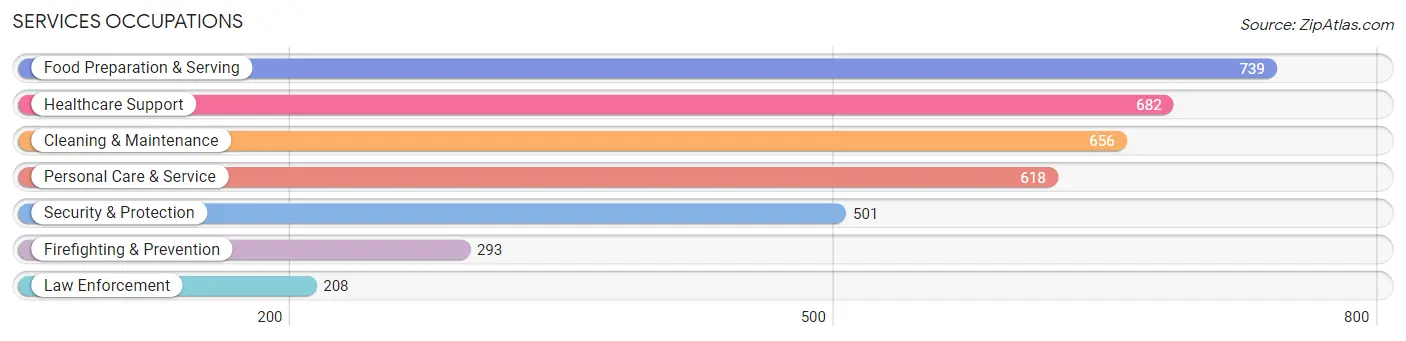
Services Occupations
The most common Services occupations in Putnam County are Food Preparation & Serving (739 | 2.9%), Healthcare Support (682 | 2.6%), Cleaning & Maintenance (656 | 2.5%), Personal Care & Service (618 | 2.4%), and Security & Protection (501 | 1.9%).
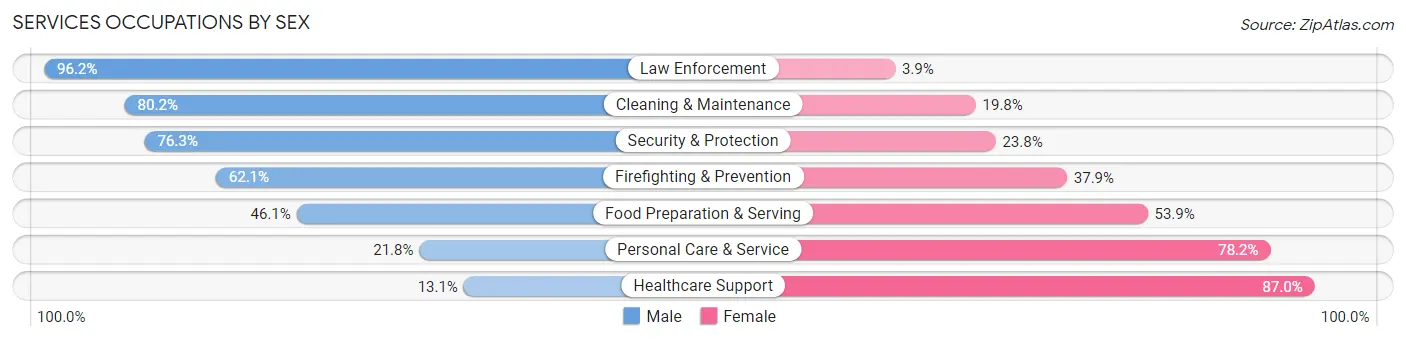
Services Occupations by Sex
Within the Services occupations in Putnam County, the most male-oriented occupations are Law Enforcement (96.2%), Cleaning & Maintenance (80.2%), and Security & Protection (76.2%), while the most female-oriented occupations are Healthcare Support (87.0%), Personal Care & Service (78.2%), and Food Preparation & Serving (53.9%).
| Occupation | Male | Female |
| Healthcare Support | 89 (13.1%) | 593 (87.0%) |
| Security & Protection | 382 (76.2%) | 119 (23.7%) |
| Firefighting & Prevention | 182 (62.1%) | 111 (37.9%) |
| Law Enforcement | 200 (96.2%) | 8 (3.8%) |
| Food Preparation & Serving | 341 (46.1%) | 398 (53.9%) |
| Cleaning & Maintenance | 526 (80.2%) | 130 (19.8%) |
| Personal Care & Service | 135 (21.8%) | 483 (78.2%) |
| Total (Category) | 1,473 (46.1%) | 1,723 (53.9%) |
| Total (Overall) | 13,873 (53.8%) | 11,892 (46.2%) |
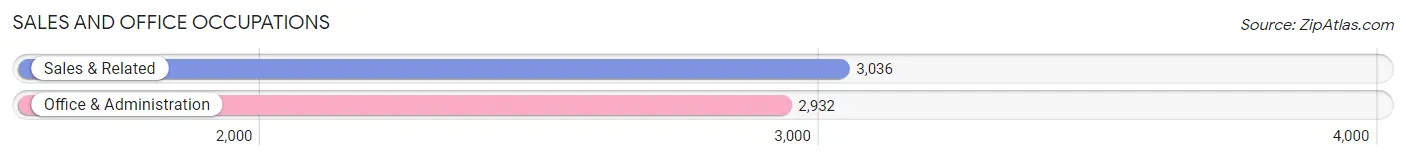
Sales and Office Occupations
The most common Sales and Office occupations in Putnam County are Sales & Related (3,036 | 11.8%), and Office & Administration (2,932 | 11.4%).
Sales and Office Occupations by Sex
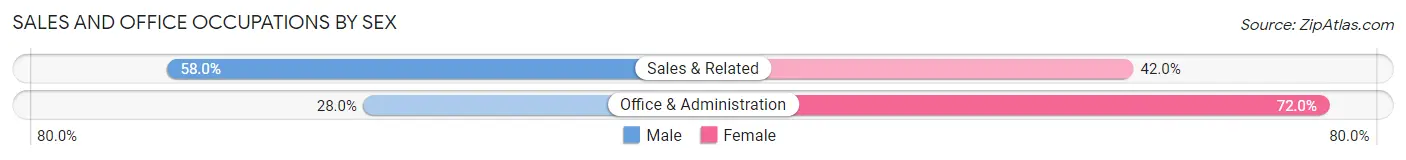
| Occupation | Male | Female |
| Sales & Related | 1,761 (58.0%) | 1,275 (42.0%) |
| Office & Administration | 820 (28.0%) | 2,112 (72.0%) |
| Total (Category) | 2,581 (43.2%) | 3,387 (56.8%) |
| Total (Overall) | 13,873 (53.8%) | 11,892 (46.2%) |
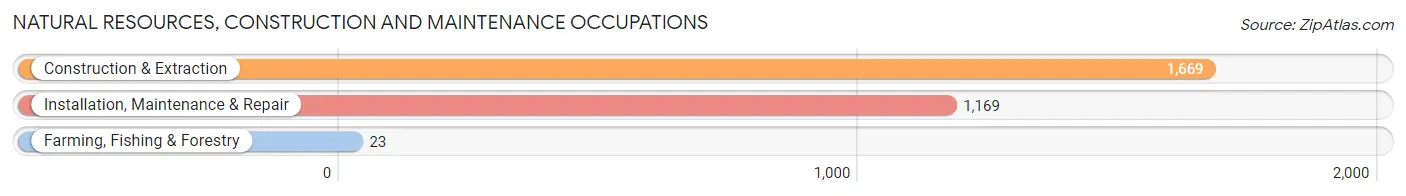
Natural Resources, Construction and Maintenance Occupations
The most common Natural Resources, Construction and Maintenance occupations in Putnam County are Construction & Extraction (1,669 | 6.5%), Installation, Maintenance & Repair (1,169 | 4.5%), and Farming, Fishing & Forestry (23 | 0.1%).
Natural Resources, Construction and Maintenance Occupations by Sex
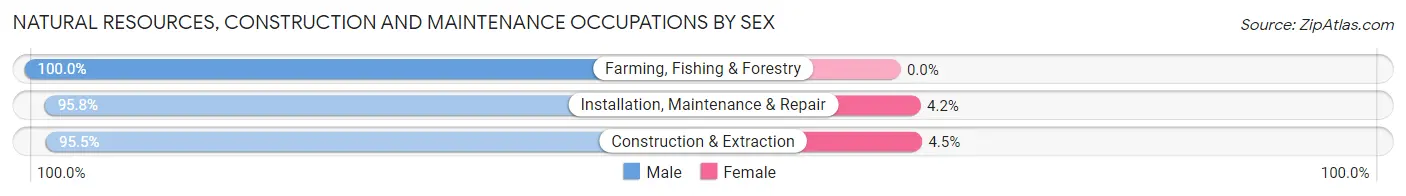
| Occupation | Male | Female |
| Farming, Fishing & Forestry | 23 (100.0%) | 0 (0.0%) |
| Construction & Extraction | 1,594 (95.5%) | 75 (4.5%) |
| Installation, Maintenance & Repair | 1,120 (95.8%) | 49 (4.2%) |
| Total (Category) | 2,737 (95.7%) | 124 (4.3%) |
| Total (Overall) | 13,873 (53.8%) | 11,892 (46.2%) |
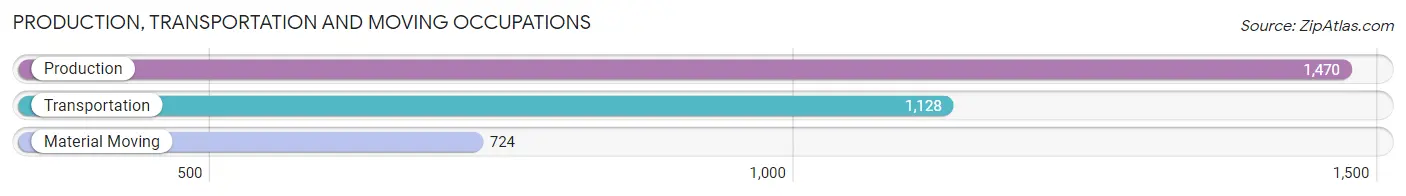
Production, Transportation and Moving Occupations
The most common Production, Transportation and Moving occupations in Putnam County are Production (1,470 | 5.7%), Transportation (1,128 | 4.4%), and Material Moving (724 | 2.8%).
Production, Transportation and Moving Occupations by Sex
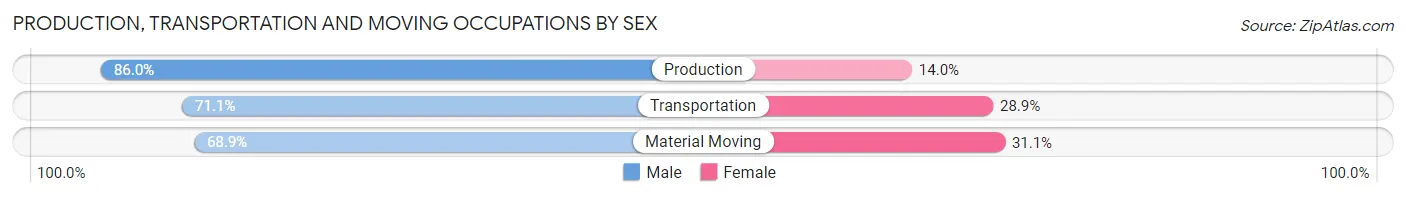
| Occupation | Male | Female |
| Production | 1,264 (86.0%) | 206 (14.0%) |
| Transportation | 802 (71.1%) | 326 (28.9%) |
| Material Moving | 499 (68.9%) | 225 (31.1%) |
| Total (Category) | 2,565 (77.2%) | 757 (22.8%) |
| Total (Overall) | 13,873 (53.8%) | 11,892 (46.2%) |
Employment Industries by Sex in Putnam County
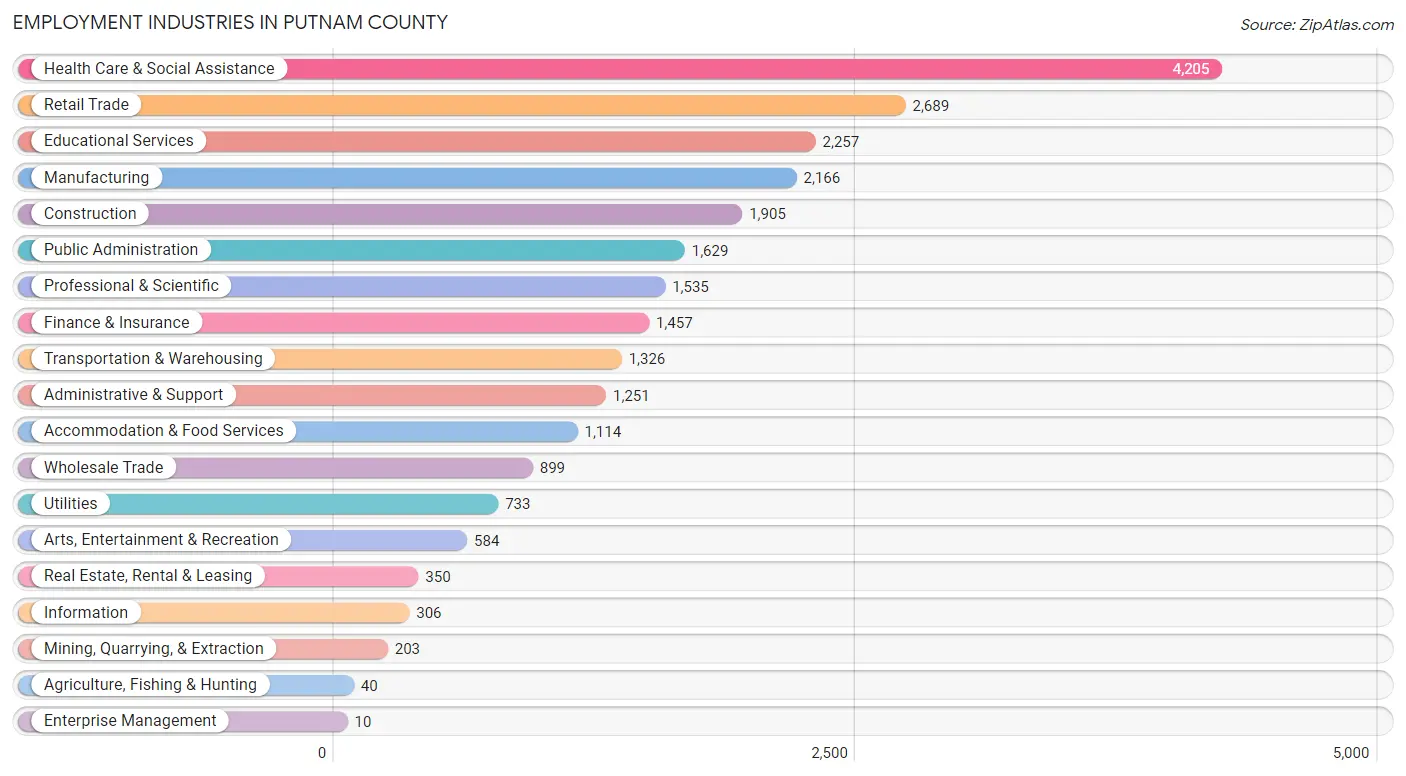
Employment Industries in Putnam County
The major employment industries in Putnam County include Health Care & Social Assistance (4,205 | 16.3%), Retail Trade (2,689 | 10.4%), Educational Services (2,257 | 8.8%), Manufacturing (2,166 | 8.4%), and Construction (1,905 | 7.4%).
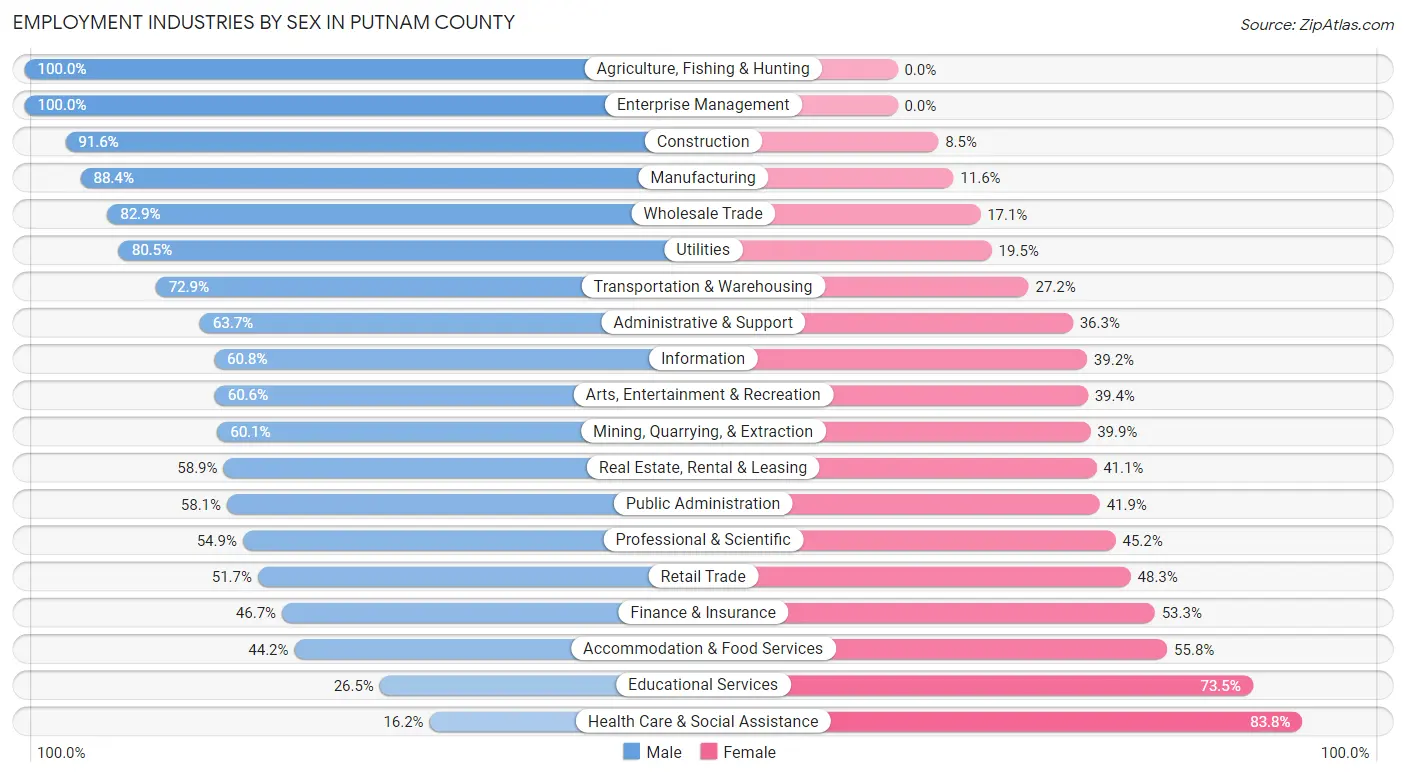
Employment Industries by Sex in Putnam County
The Putnam County industries that see more men than women are Agriculture, Fishing & Hunting (100.0%), Enterprise Management (100.0%), and Construction (91.5%), whereas the industries that tend to have a higher number of women are Health Care & Social Assistance (83.8%), Educational Services (73.5%), and Accommodation & Food Services (55.8%).
| Industry | Male | Female |
| Agriculture, Fishing & Hunting | 40 (100.0%) | 0 (0.0%) |
| Mining, Quarrying, & Extraction | 122 (60.1%) | 81 (39.9%) |
| Construction | 1,744 (91.5%) | 161 (8.5%) |
| Manufacturing | 1,915 (88.4%) | 251 (11.6%) |
| Wholesale Trade | 745 (82.9%) | 154 (17.1%) |
| Retail Trade | 1,391 (51.7%) | 1,298 (48.3%) |
| Transportation & Warehousing | 966 (72.9%) | 360 (27.2%) |
| Utilities | 590 (80.5%) | 143 (19.5%) |
| Information | 186 (60.8%) | 120 (39.2%) |
| Finance & Insurance | 681 (46.7%) | 776 (53.3%) |
| Real Estate, Rental & Leasing | 206 (58.9%) | 144 (41.1%) |
| Professional & Scientific | 842 (54.8%) | 693 (45.2%) |
| Enterprise Management | 10 (100.0%) | 0 (0.0%) |
| Administrative & Support | 797 (63.7%) | 454 (36.3%) |
| Educational Services | 598 (26.5%) | 1,659 (73.5%) |
| Health Care & Social Assistance | 681 (16.2%) | 3,524 (83.8%) |
| Arts, Entertainment & Recreation | 354 (60.6%) | 230 (39.4%) |
| Accommodation & Food Services | 492 (44.2%) | 622 (55.8%) |
| Public Administration | 947 (58.1%) | 682 (41.9%) |
| Total | 13,873 (53.8%) | 11,892 (46.2%) |
Education in Putnam County
School Enrollment in Putnam County
The most common levels of schooling among the 12,612 students in Putnam County are high school (3,096 | 24.5%), elementary school (2,804 | 22.2%), and middle school (2,776 | 22.0%).
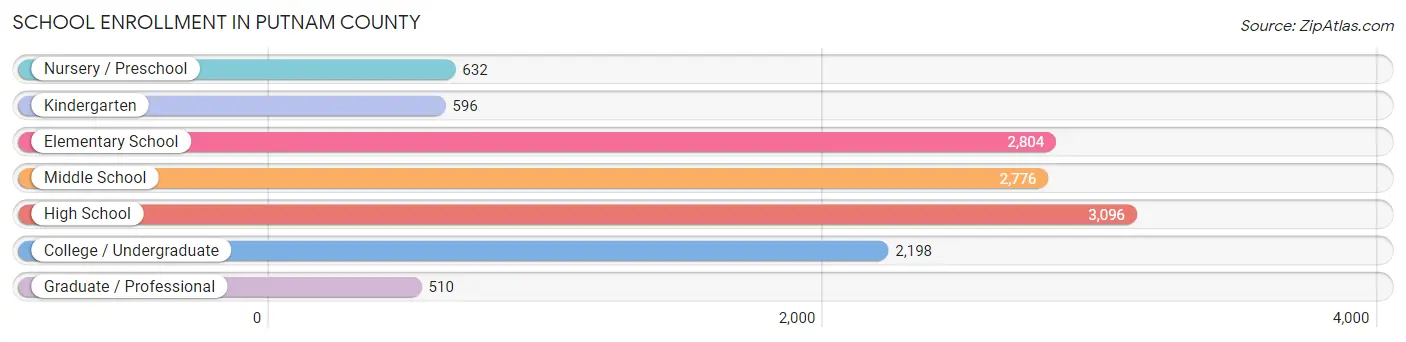
| School Level | # Students | % Students |
| Nursery / Preschool | 632 | 5.0% |
| Kindergarten | 596 | 4.7% |
| Elementary School | 2,804 | 22.2% |
| Middle School | 2,776 | 22.0% |
| High School | 3,096 | 24.5% |
| College / Undergraduate | 2,198 | 17.4% |
| Graduate / Professional | 510 | 4.0% |
| Total | 12,612 | 100.0% |
School Enrollment by Age by Funding Source in Putnam County
Out of a total of 12,612 students who are enrolled in schools in Putnam County, 1,526 (12.1%) attend a private institution, while the remaining 11,086 (87.9%) are enrolled in public schools. The age group of 3 to 4 year olds has the highest likelihood of being enrolled in private schools, with 81 (32.7% in the age bracket) enrolled. Conversely, the age group of 15 to 17 year olds has the lowest likelihood of being enrolled in a private school, with 2,261 (94.9% in the age bracket) attending a public institution.
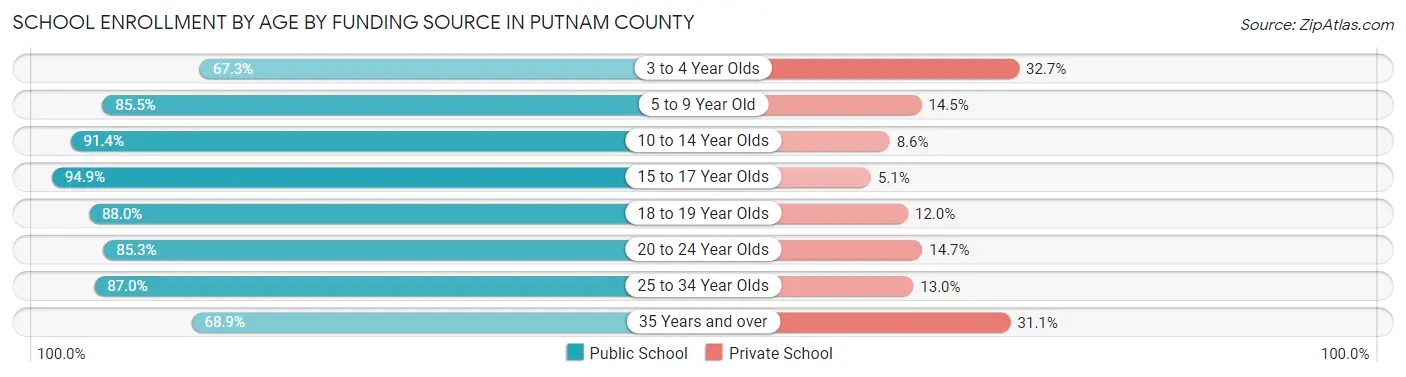
| Age Bracket | Public School | Private School |
| 3 to 4 Year Olds | 167 (67.3%) | 81 (32.7%) |
| 5 to 9 Year Old | 2,837 (85.5%) | 481 (14.5%) |
| 10 to 14 Year Olds | 3,218 (91.4%) | 302 (8.6%) |
| 15 to 17 Year Olds | 2,261 (94.9%) | 121 (5.1%) |
| 18 to 19 Year Olds | 962 (88.0%) | 131 (12.0%) |
| 20 to 24 Year Olds | 652 (85.3%) | 112 (14.7%) |
| 25 to 34 Year Olds | 496 (87.0%) | 74 (13.0%) |
| 35 Years and over | 494 (68.9%) | 223 (31.1%) |
| Total | 11,086 (87.9%) | 1,526 (12.1%) |
Educational Attainment by Field of Study in Putnam County
Business (2,353 | 18.8%), science & technology (2,206 | 17.6%), education (2,031 | 16.2%), arts & humanities (1,084 | 8.7%), and engineering (769 | 6.1%) are the most common fields of study among 12,510 individuals in Putnam County who have obtained a bachelor's degree or higher.
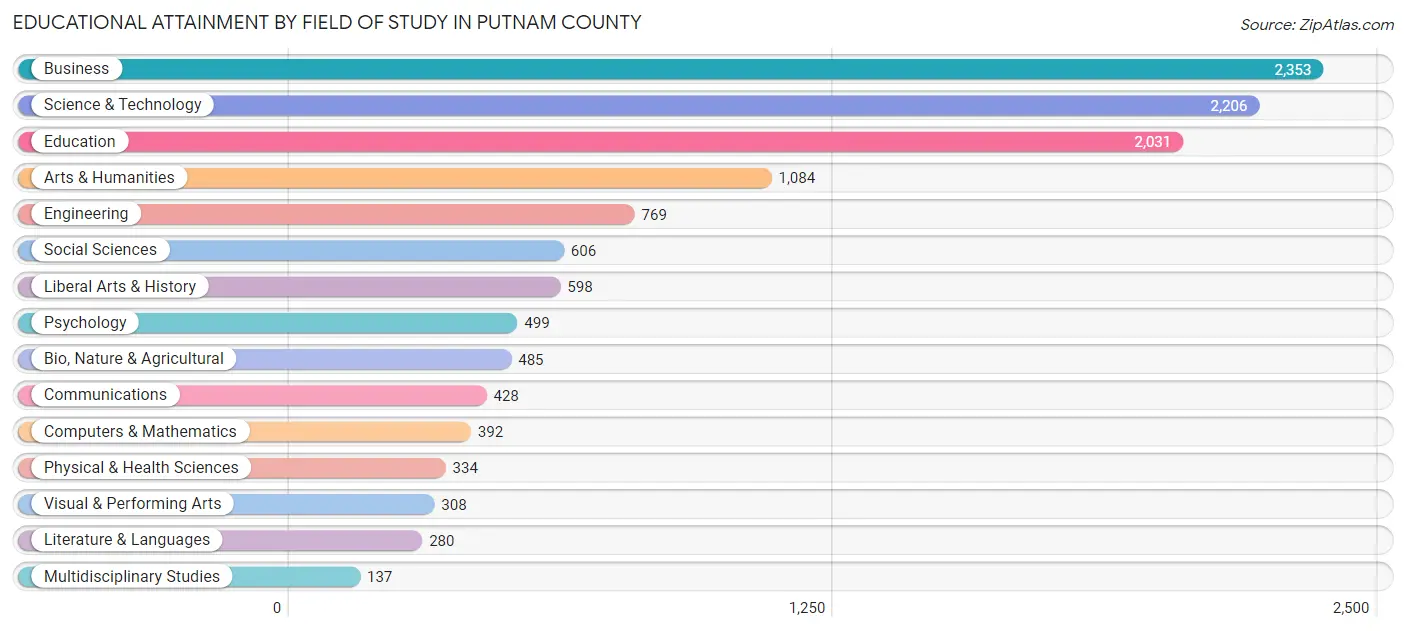
| Field of Study | # Graduates | % Graduates |
| Computers & Mathematics | 392 | 3.1% |
| Bio, Nature & Agricultural | 485 | 3.9% |
| Physical & Health Sciences | 334 | 2.7% |
| Psychology | 499 | 4.0% |
| Social Sciences | 606 | 4.8% |
| Engineering | 769 | 6.1% |
| Multidisciplinary Studies | 137 | 1.1% |
| Science & Technology | 2,206 | 17.6% |
| Business | 2,353 | 18.8% |
| Education | 2,031 | 16.2% |
| Literature & Languages | 280 | 2.2% |
| Liberal Arts & History | 598 | 4.8% |
| Visual & Performing Arts | 308 | 2.5% |
| Communications | 428 | 3.4% |
| Arts & Humanities | 1,084 | 8.7% |
| Total | 12,510 | 100.0% |
Transportation & Commute in Putnam County
Vehicle Availability by Sex in Putnam County
The most prevalent vehicle ownership categories in Putnam County are males with 2 vehicles (6,593, accounting for 46.9%) and females with 2 vehicles (5,626, making up 56.1%).
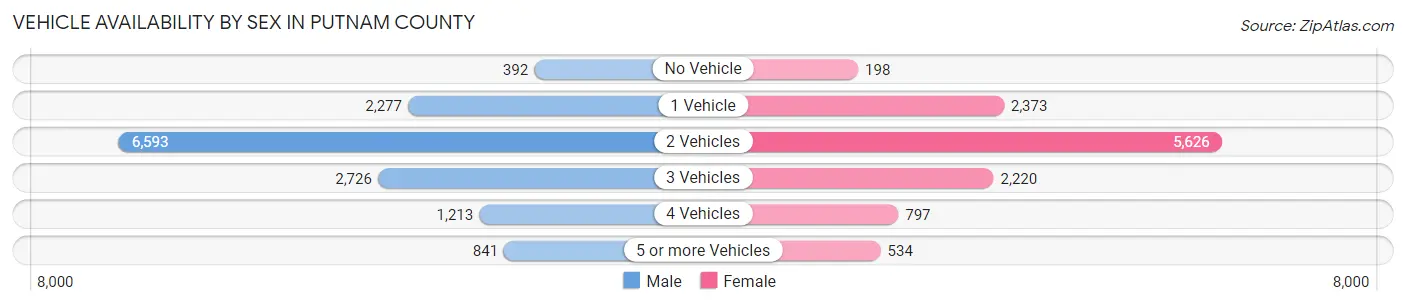
| Vehicles Available | Male | Female |
| No Vehicle | 392 (2.8%) | 198 (1.7%) |
| 1 Vehicle | 2,277 (16.2%) | 2,373 (20.2%) |
| 2 Vehicles | 6,593 (46.9%) | 5,626 (47.9%) |
| 3 Vehicles | 2,726 (19.4%) | 2,220 (18.9%) |
| 4 Vehicles | 1,213 (8.6%) | 797 (6.8%) |
| 5 or more Vehicles | 841 (6.0%) | 534 (4.5%) |
| Total | 14,042 (100.0%) | 11,748 (100.0%) |
Commute Time in Putnam County
The most frequently occuring commute durations in Putnam County are 30 to 34 minutes (4,322 commuters, 18.2%), 20 to 24 minutes (3,694 commuters, 15.5%), and 15 to 19 minutes (2,787 commuters, 11.7%).
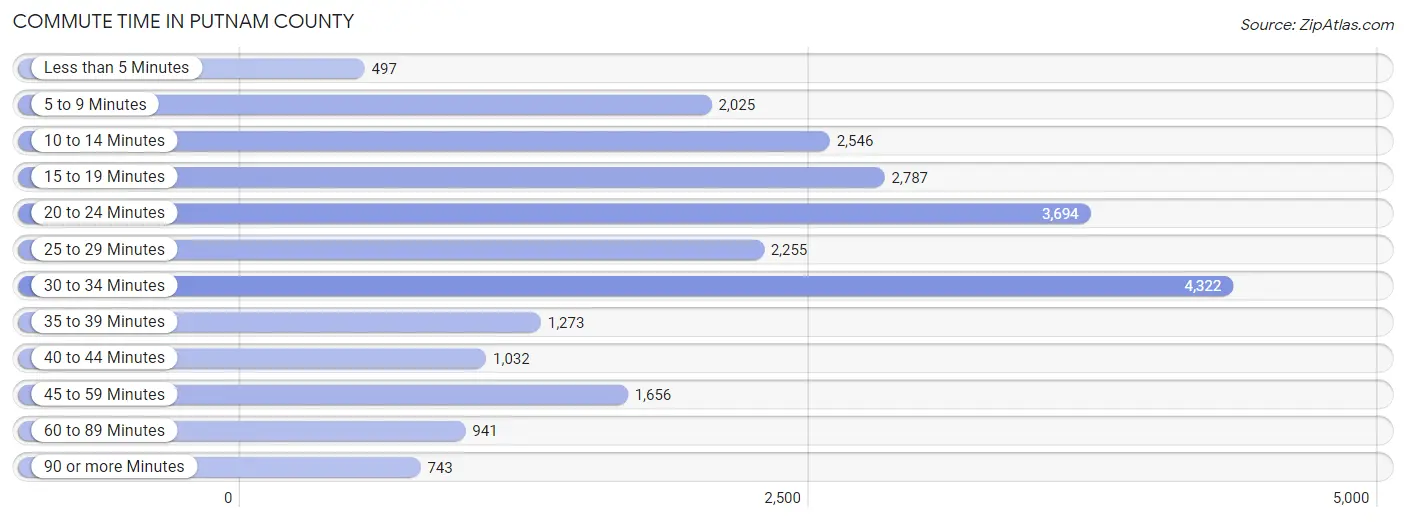
| Commute Time | # Commuters | % Commuters |
| Less than 5 Minutes | 497 | 2.1% |
| 5 to 9 Minutes | 2,025 | 8.5% |
| 10 to 14 Minutes | 2,546 | 10.7% |
| 15 to 19 Minutes | 2,787 | 11.7% |
| 20 to 24 Minutes | 3,694 | 15.5% |
| 25 to 29 Minutes | 2,255 | 9.5% |
| 30 to 34 Minutes | 4,322 | 18.2% |
| 35 to 39 Minutes | 1,273 | 5.4% |
| 40 to 44 Minutes | 1,032 | 4.3% |
| 45 to 59 Minutes | 1,656 | 7.0% |
| 60 to 89 Minutes | 941 | 4.0% |
| 90 or more Minutes | 743 | 3.1% |
Commute Time by Sex in Putnam County
The most common commute times in Putnam County are 30 to 34 minutes (2,610 commuters, 19.7%) for males and 30 to 34 minutes (1,712 commuters, 16.3%) for females.
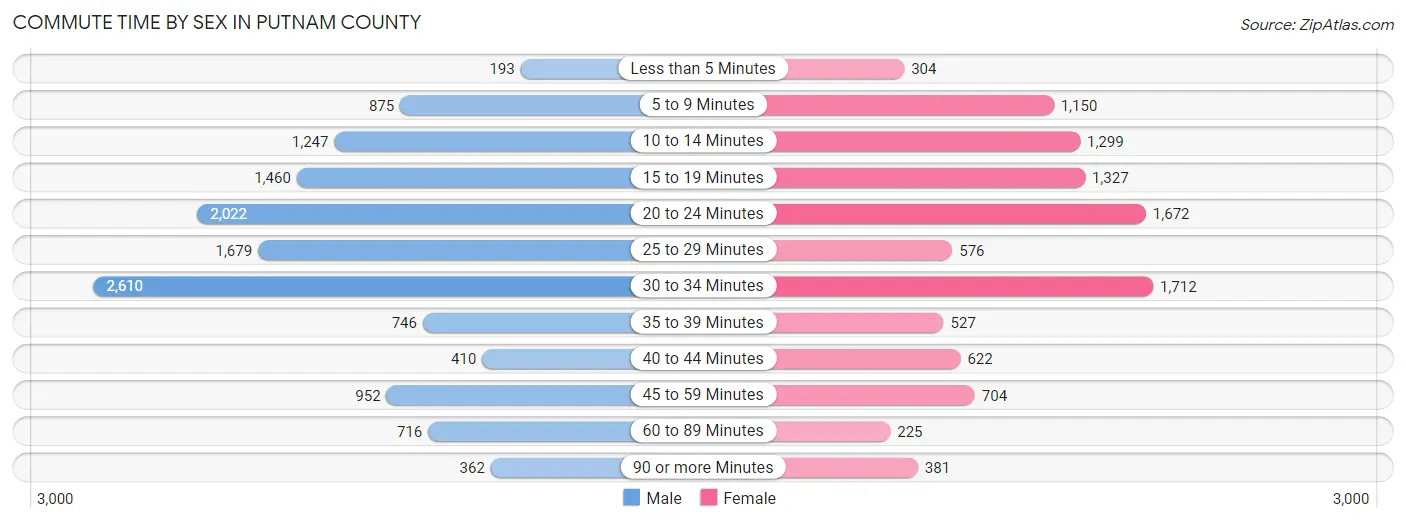
| Commute Time | Male | Female |
| Less than 5 Minutes | 193 (1.5%) | 304 (2.9%) |
| 5 to 9 Minutes | 875 (6.6%) | 1,150 (11.0%) |
| 10 to 14 Minutes | 1,247 (9.4%) | 1,299 (12.4%) |
| 15 to 19 Minutes | 1,460 (11.0%) | 1,327 (12.6%) |
| 20 to 24 Minutes | 2,022 (15.2%) | 1,672 (15.9%) |
| 25 to 29 Minutes | 1,679 (12.7%) | 576 (5.5%) |
| 30 to 34 Minutes | 2,610 (19.7%) | 1,712 (16.3%) |
| 35 to 39 Minutes | 746 (5.6%) | 527 (5.0%) |
| 40 to 44 Minutes | 410 (3.1%) | 622 (5.9%) |
| 45 to 59 Minutes | 952 (7.2%) | 704 (6.7%) |
| 60 to 89 Minutes | 716 (5.4%) | 225 (2.1%) |
| 90 or more Minutes | 362 (2.7%) | 381 (3.6%) |
Time of Departure to Work by Sex in Putnam County
The most frequent times of departure to work in Putnam County are 7:00 AM to 7:29 AM (2,386, 18.0%) for males and 6:30 AM to 6:59 AM (1,779, 16.9%) for females.
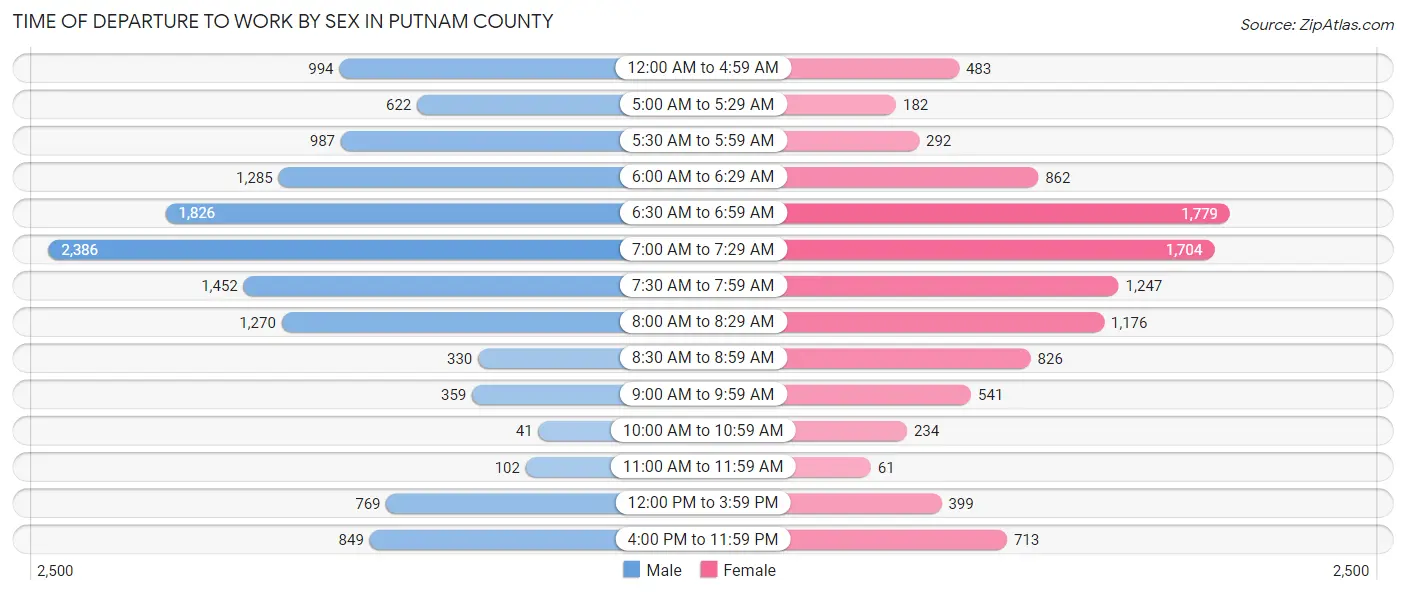
| Time of Departure | Male | Female |
| 12:00 AM to 4:59 AM | 994 (7.5%) | 483 (4.6%) |
| 5:00 AM to 5:29 AM | 622 (4.7%) | 182 (1.7%) |
| 5:30 AM to 5:59 AM | 987 (7.4%) | 292 (2.8%) |
| 6:00 AM to 6:29 AM | 1,285 (9.7%) | 862 (8.2%) |
| 6:30 AM to 6:59 AM | 1,826 (13.8%) | 1,779 (16.9%) |
| 7:00 AM to 7:29 AM | 2,386 (18.0%) | 1,704 (16.2%) |
| 7:30 AM to 7:59 AM | 1,452 (10.9%) | 1,247 (11.9%) |
| 8:00 AM to 8:29 AM | 1,270 (9.6%) | 1,176 (11.2%) |
| 8:30 AM to 8:59 AM | 330 (2.5%) | 826 (7.9%) |
| 9:00 AM to 9:59 AM | 359 (2.7%) | 541 (5.1%) |
| 10:00 AM to 10:59 AM | 41 (0.3%) | 234 (2.2%) |
| 11:00 AM to 11:59 AM | 102 (0.8%) | 61 (0.6%) |
| 12:00 PM to 3:59 PM | 769 (5.8%) | 399 (3.8%) |
| 4:00 PM to 11:59 PM | 849 (6.4%) | 713 (6.8%) |
| Total | 13,272 (100.0%) | 10,499 (100.0%) |
Housing Occupancy in Putnam County
Occupancy by Ownership in Putnam County
Of the total 22,402 dwellings in Putnam County, owner-occupied units account for 18,398 (82.1%), while renter-occupied units make up 4,004 (17.9%).
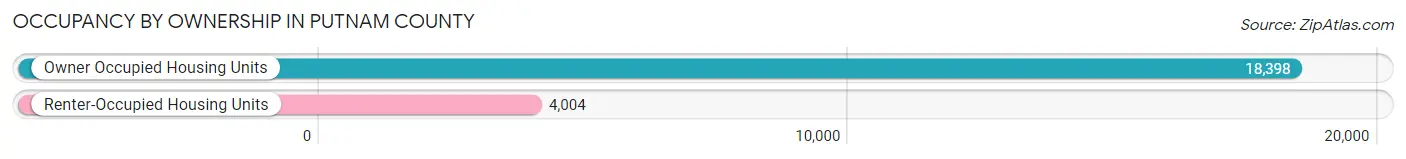
| Occupancy | # Housing Units | % Housing Units |
| Owner Occupied Housing Units | 18,398 | 82.1% |
| Renter-Occupied Housing Units | 4,004 | 17.9% |
| Total Occupied Housing Units | 22,402 | 100.0% |
Occupancy by Household Size in Putnam County
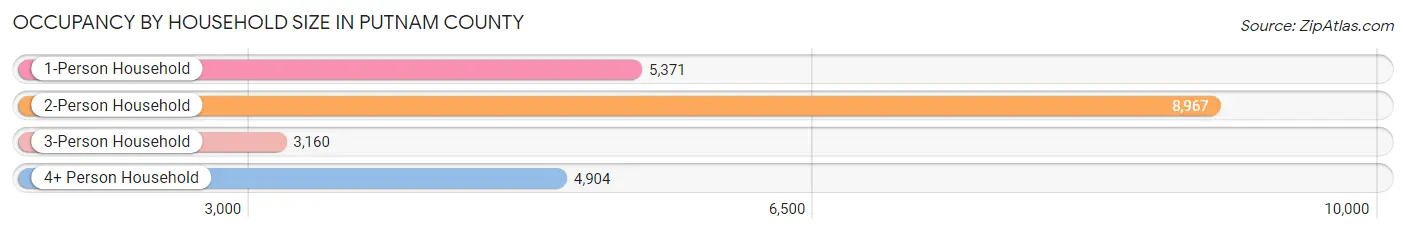
| Household Size | # Housing Units | % Housing Units |
| 1-Person Household | 5,371 | 24.0% |
| 2-Person Household | 8,967 | 40.0% |
| 3-Person Household | 3,160 | 14.1% |
| 4+ Person Household | 4,904 | 21.9% |
| Total Housing Units | 22,402 | 100.0% |
Occupancy by Ownership by Household Size in Putnam County
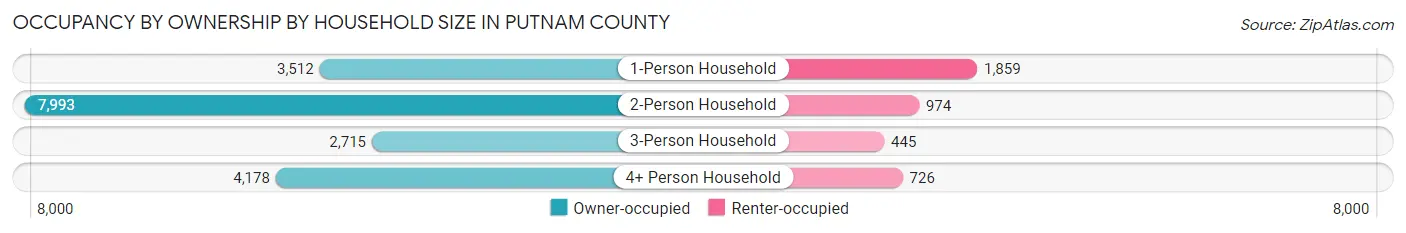
| Household Size | Owner-occupied | Renter-occupied |
| 1-Person Household | 3,512 (65.4%) | 1,859 (34.6%) |
| 2-Person Household | 7,993 (89.1%) | 974 (10.9%) |
| 3-Person Household | 2,715 (85.9%) | 445 (14.1%) |
| 4+ Person Household | 4,178 (85.2%) | 726 (14.8%) |
| Total Housing Units | 18,398 (82.1%) | 4,004 (17.9%) |
Occupancy by Educational Attainment in Putnam County
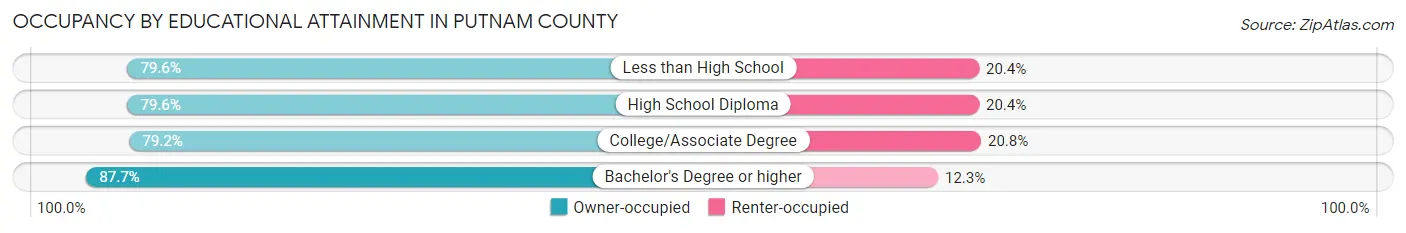
| Household Size | Owner-occupied | Renter-occupied |
| Less than High School | 1,120 (79.6%) | 287 (20.4%) |
| High School Diploma | 5,493 (79.6%) | 1,408 (20.4%) |
| College/Associate Degree | 5,399 (79.2%) | 1,417 (20.8%) |
| Bachelor's Degree or higher | 6,386 (87.7%) | 892 (12.3%) |
Occupancy by Age of Householder in Putnam County
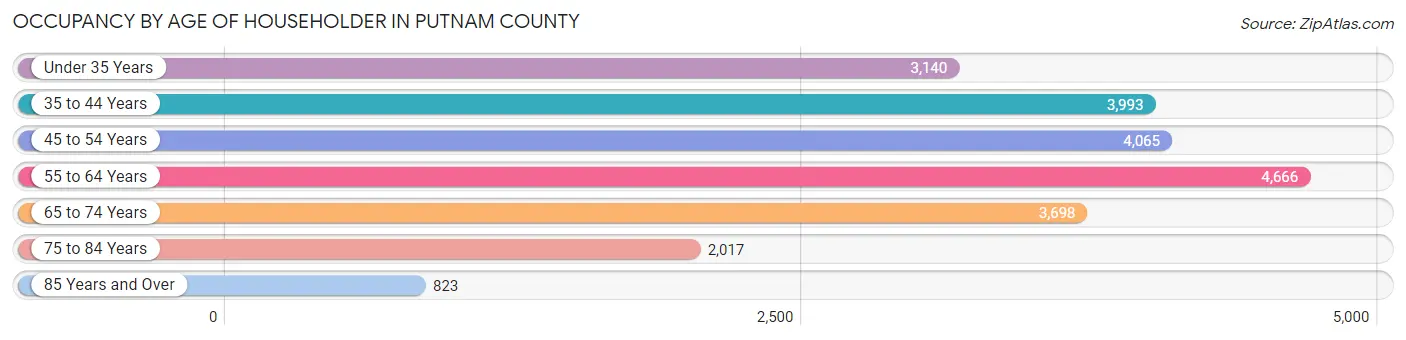
| Age Bracket | # Households | % Households |
| Under 35 Years | 3,140 | 14.0% |
| 35 to 44 Years | 3,993 | 17.8% |
| 45 to 54 Years | 4,065 | 18.1% |
| 55 to 64 Years | 4,666 | 20.8% |
| 65 to 74 Years | 3,698 | 16.5% |
| 75 to 84 Years | 2,017 | 9.0% |
| 85 Years and Over | 823 | 3.7% |
| Total | 22,402 | 100.0% |
Housing Finances in Putnam County
Median Income by Occupancy in Putnam County
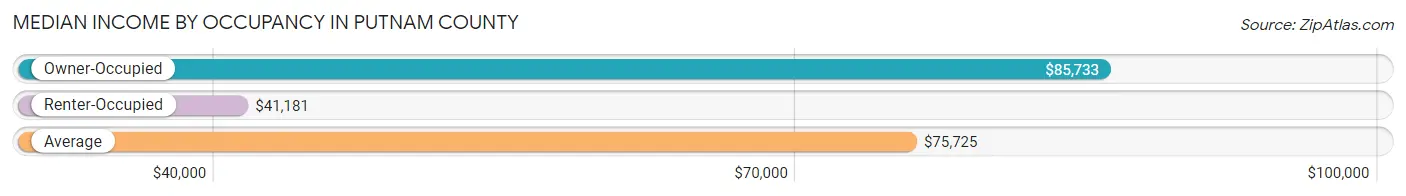
| Occupancy Type | # Households | Median Income |
| Owner-Occupied | 18,398 (82.1%) | $85,733 |
| Renter-Occupied | 4,004 (17.9%) | $41,181 |
| Average | 22,402 (100.0%) | $75,725 |
Occupancy by Householder Income Bracket in Putnam County
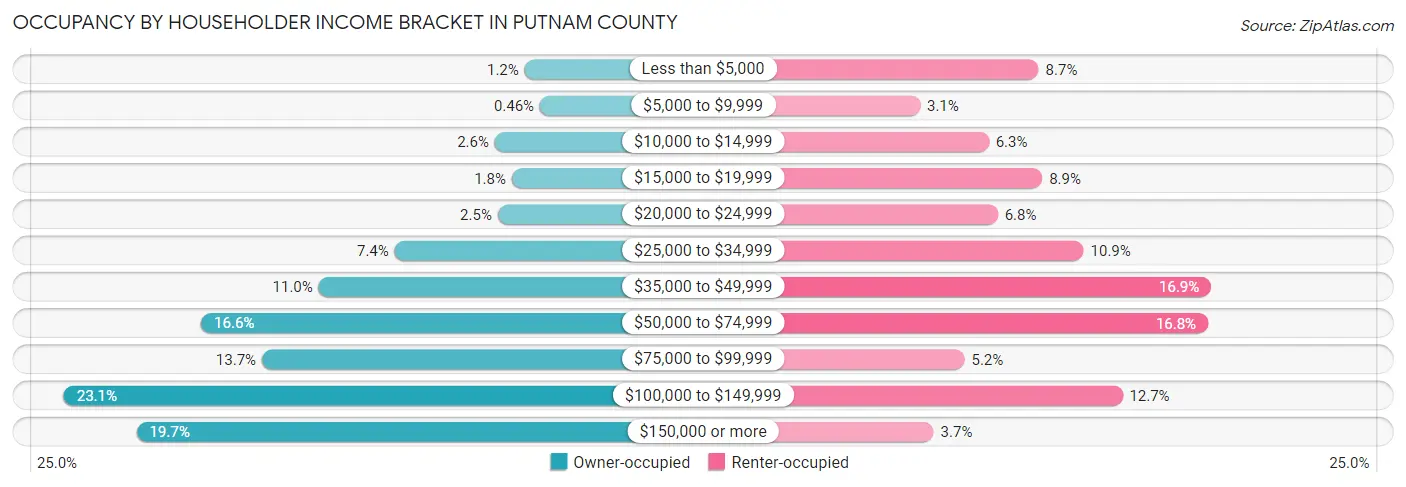
| Income Bracket | Owner-occupied | Renter-occupied |
| Less than $5,000 | 219 (1.2%) | 349 (8.7%) |
| $5,000 to $9,999 | 85 (0.5%) | 123 (3.1%) |
| $10,000 to $14,999 | 480 (2.6%) | 254 (6.3%) |
| $15,000 to $19,999 | 331 (1.8%) | 356 (8.9%) |
| $20,000 to $24,999 | 455 (2.5%) | 271 (6.8%) |
| $25,000 to $34,999 | 1,357 (7.4%) | 435 (10.9%) |
| $35,000 to $49,999 | 2,023 (11.0%) | 678 (16.9%) |
| $50,000 to $74,999 | 3,053 (16.6%) | 672 (16.8%) |
| $75,000 to $99,999 | 2,521 (13.7%) | 208 (5.2%) |
| $100,000 to $149,999 | 4,256 (23.1%) | 509 (12.7%) |
| $150,000 or more | 3,618 (19.7%) | 149 (3.7%) |
| Total | 18,398 (100.0%) | 4,004 (100.0%) |
Monthly Housing Cost Tiers in Putnam County
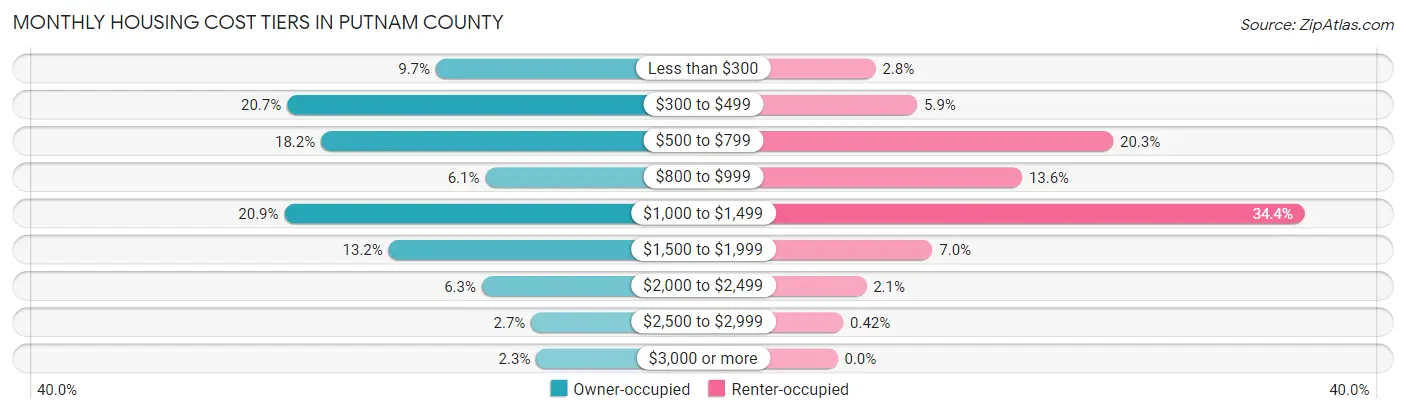
| Monthly Cost | Owner-occupied | Renter-occupied |
| Less than $300 | 1,786 (9.7%) | 112 (2.8%) |
| $300 to $499 | 3,802 (20.7%) | 235 (5.9%) |
| $500 to $799 | 3,342 (18.2%) | 813 (20.3%) |
| $800 to $999 | 1,116 (6.1%) | 544 (13.6%) |
| $1,000 to $1,499 | 3,840 (20.9%) | 1,378 (34.4%) |
| $1,500 to $1,999 | 2,427 (13.2%) | 280 (7.0%) |
| $2,000 to $2,499 | 1,165 (6.3%) | 85 (2.1%) |
| $2,500 to $2,999 | 494 (2.7%) | 17 (0.4%) |
| $3,000 or more | 426 (2.3%) | 0 (0.0%) |
| Total | 18,398 (100.0%) | 4,004 (100.0%) |
Physical Housing Characteristics in Putnam County
Housing Structures in Putnam County
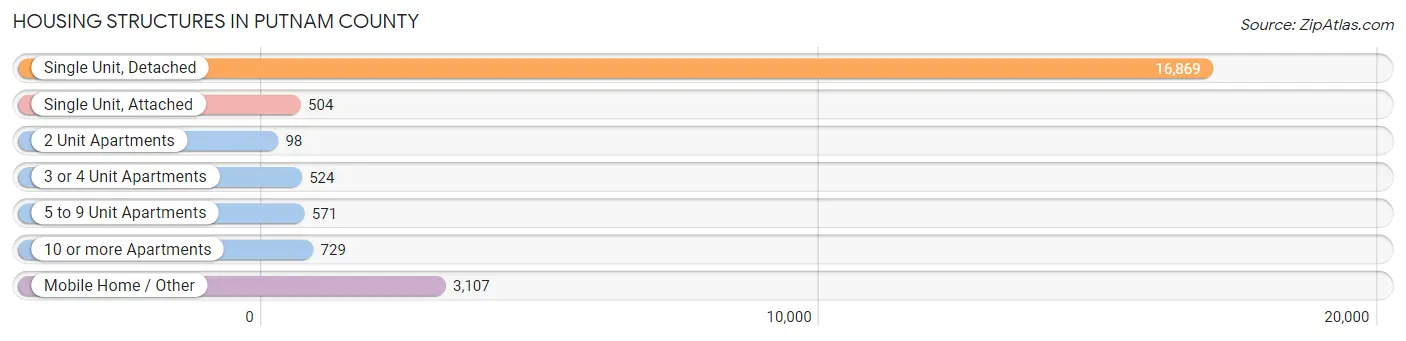
| Structure Type | # Housing Units | % Housing Units |
| Single Unit, Detached | 16,869 | 75.3% |
| Single Unit, Attached | 504 | 2.2% |
| 2 Unit Apartments | 98 | 0.4% |
| 3 or 4 Unit Apartments | 524 | 2.3% |
| 5 to 9 Unit Apartments | 571 | 2.5% |
| 10 or more Apartments | 729 | 3.3% |
| Mobile Home / Other | 3,107 | 13.9% |
| Total | 22,402 | 100.0% |
Housing Structures by Occupancy in Putnam County
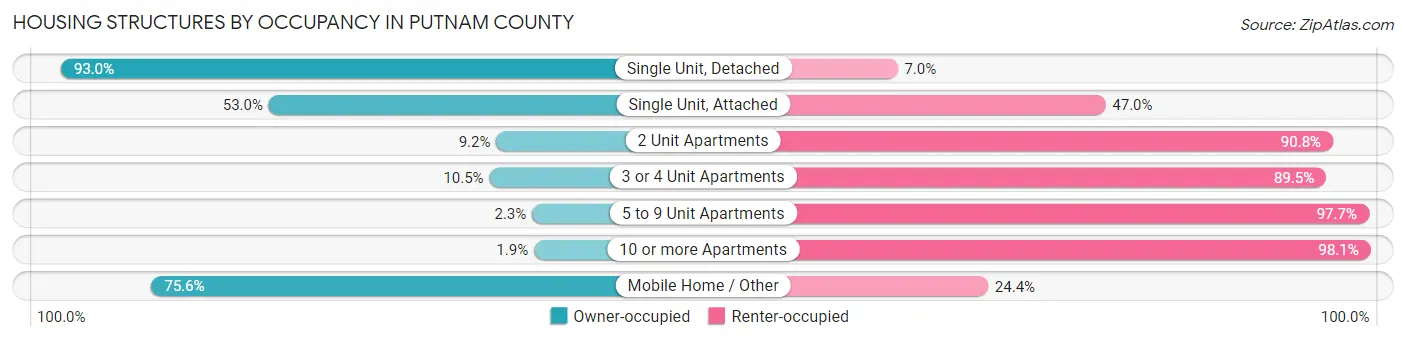
| Structure Type | Owner-occupied | Renter-occupied |
| Single Unit, Detached | 15,691 (93.0%) | 1,178 (7.0%) |
| Single Unit, Attached | 267 (53.0%) | 237 (47.0%) |
| 2 Unit Apartments | 9 (9.2%) | 89 (90.8%) |
| 3 or 4 Unit Apartments | 55 (10.5%) | 469 (89.5%) |
| 5 to 9 Unit Apartments | 13 (2.3%) | 558 (97.7%) |
| 10 or more Apartments | 14 (1.9%) | 715 (98.1%) |
| Mobile Home / Other | 2,349 (75.6%) | 758 (24.4%) |
| Total | 18,398 (82.1%) | 4,004 (17.9%) |
Housing Structures by Number of Rooms in Putnam County
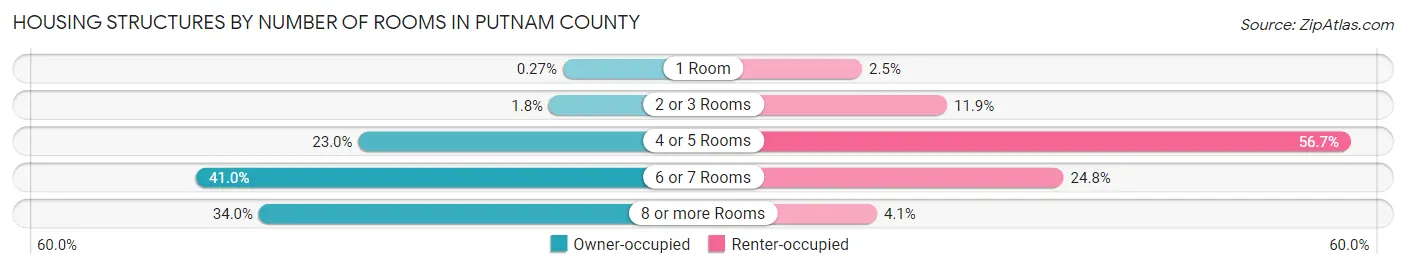
| Number of Rooms | Owner-occupied | Renter-occupied |
| 1 Room | 50 (0.3%) | 99 (2.5%) |
| 2 or 3 Rooms | 333 (1.8%) | 476 (11.9%) |
| 4 or 5 Rooms | 4,224 (23.0%) | 2,270 (56.7%) |
| 6 or 7 Rooms | 7,536 (41.0%) | 994 (24.8%) |
| 8 or more Rooms | 6,255 (34.0%) | 165 (4.1%) |
| Total | 18,398 (100.0%) | 4,004 (100.0%) |
Housing Structure by Heating Type in Putnam County
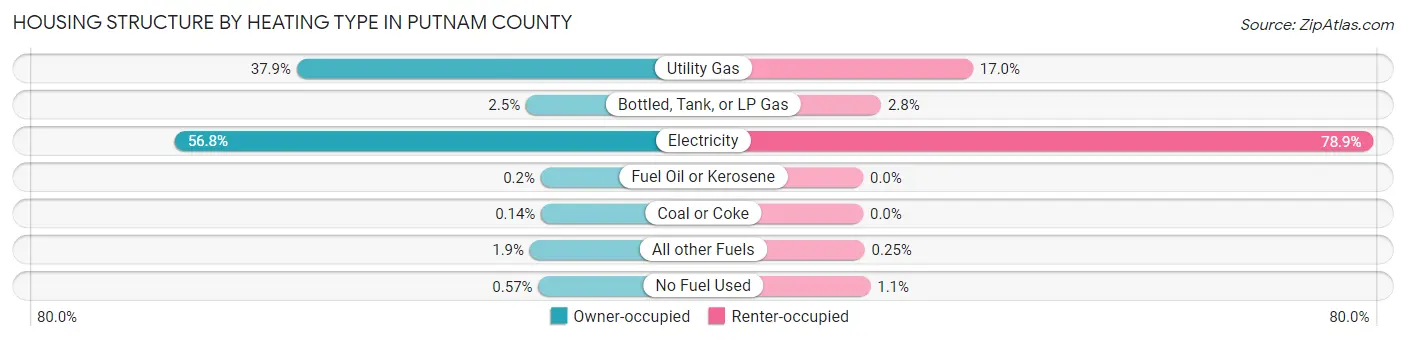
| Heating Type | Owner-occupied | Renter-occupied |
| Utility Gas | 6,977 (37.9%) | 680 (17.0%) |
| Bottled, Tank, or LP Gas | 458 (2.5%) | 111 (2.8%) |
| Electricity | 10,448 (56.8%) | 3,158 (78.9%) |
| Fuel Oil or Kerosene | 37 (0.2%) | 0 (0.0%) |
| Coal or Coke | 25 (0.1%) | 0 (0.0%) |
| All other Fuels | 348 (1.9%) | 10 (0.3%) |
| No Fuel Used | 105 (0.6%) | 45 (1.1%) |
| Total | 18,398 (100.0%) | 4,004 (100.0%) |
Household Vehicle Usage in Putnam County
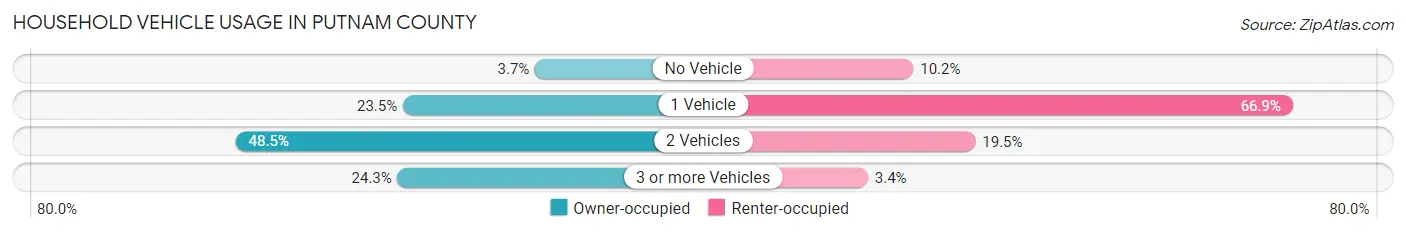
| Vehicles per Household | Owner-occupied | Renter-occupied |
| No Vehicle | 689 (3.7%) | 409 (10.2%) |
| 1 Vehicle | 4,320 (23.5%) | 2,678 (66.9%) |
| 2 Vehicles | 8,920 (48.5%) | 780 (19.5%) |
| 3 or more Vehicles | 4,469 (24.3%) | 137 (3.4%) |
| Total | 18,398 (100.0%) | 4,004 (100.0%) |
Real Estate & Mortgages in Putnam County
Real Estate and Mortgage Overview in Putnam County
| Characteristic | Without Mortgage | With Mortgage |
| Housing Units | 8,719 | 9,679 |
| Median Property Value | $161,700 | $230,200 |
| Median Household Income | $61,577 | $2,549 |
| Monthly Housing Costs | $431 | $420 |
| Real Estate Taxes | $944 | $169 |
Property Value by Mortgage Status in Putnam County
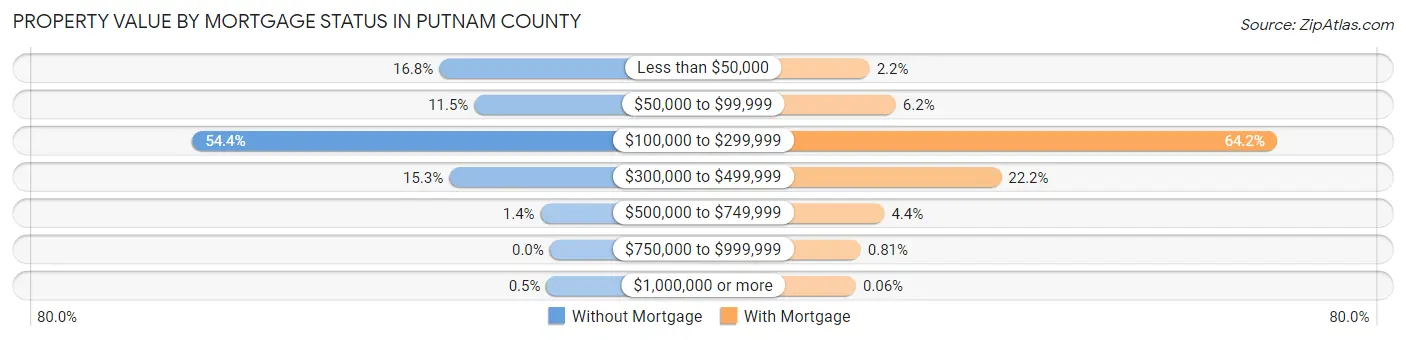
| Property Value | Without Mortgage | With Mortgage |
| Less than $50,000 | 1,468 (16.8%) | 209 (2.2%) |
| $50,000 to $99,999 | 1,002 (11.5%) | 595 (6.1%) |
| $100,000 to $299,999 | 4,747 (54.4%) | 6,213 (64.2%) |
| $300,000 to $499,999 | 1,336 (15.3%) | 2,151 (22.2%) |
| $500,000 to $749,999 | 122 (1.4%) | 427 (4.4%) |
| $750,000 to $999,999 | 0 (0.0%) | 78 (0.8%) |
| $1,000,000 or more | 44 (0.5%) | 6 (0.1%) |
| Total | 8,719 (100.0%) | 9,679 (100.0%) |
Household Income by Mortgage Status in Putnam County
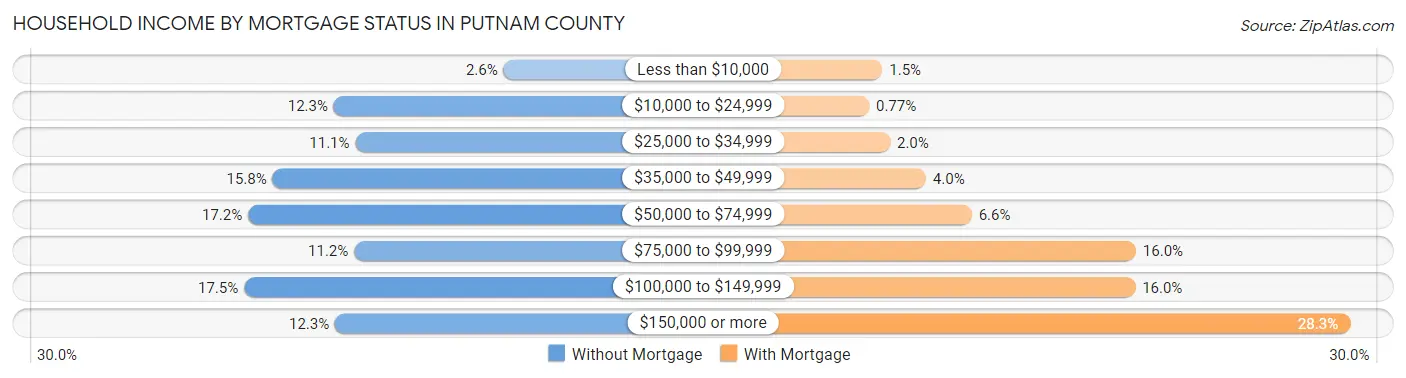
| Household Income | Without Mortgage | With Mortgage |
| Less than $10,000 | 229 (2.6%) | 148 (1.5%) |
| $10,000 to $24,999 | 1,075 (12.3%) | 75 (0.8%) |
| $25,000 to $34,999 | 968 (11.1%) | 191 (2.0%) |
| $35,000 to $49,999 | 1,380 (15.8%) | 389 (4.0%) |
| $50,000 to $74,999 | 1,502 (17.2%) | 643 (6.6%) |
| $75,000 to $99,999 | 974 (11.2%) | 1,551 (16.0%) |
| $100,000 to $149,999 | 1,522 (17.5%) | 1,547 (16.0%) |
| $150,000 or more | 1,069 (12.3%) | 2,734 (28.2%) |
| Total | 8,719 (100.0%) | 9,679 (100.0%) |
Property Value to Household Income Ratio in Putnam County
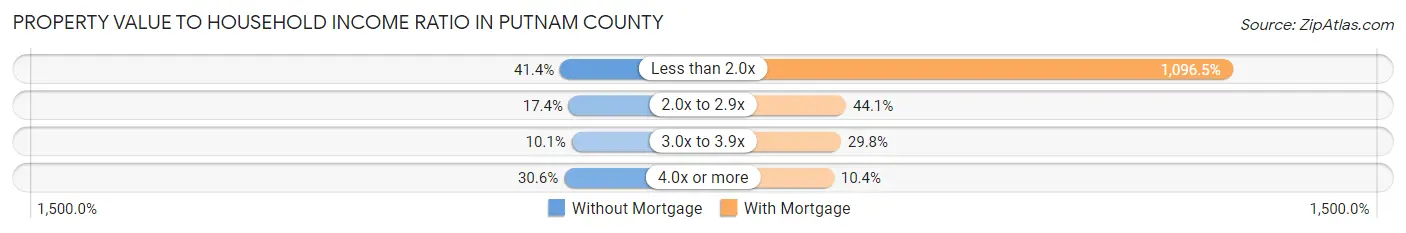
| Value-to-Income Ratio | Without Mortgage | With Mortgage |
| Less than 2.0x | 3,613 (41.4%) | 106,133 (1,096.5%) |
| 2.0x to 2.9x | 1,520 (17.4%) | 4,271 (44.1%) |
| 3.0x to 3.9x | 879 (10.1%) | 2,881 (29.8%) |
| 4.0x or more | 2,668 (30.6%) | 1,010 (10.4%) |
| Total | 8,719 (100.0%) | 9,679 (100.0%) |
Real Estate Taxes by Mortgage Status in Putnam County
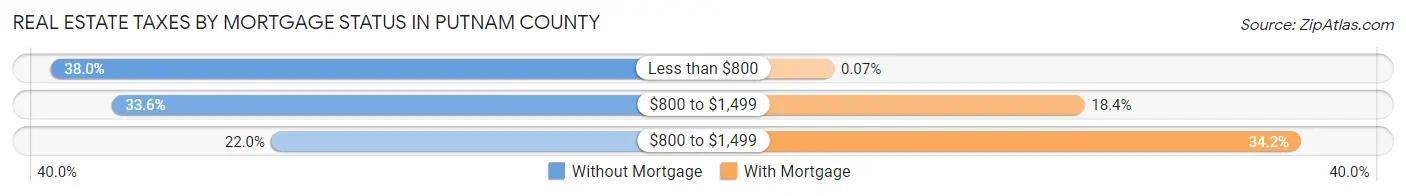
| Property Taxes | Without Mortgage | With Mortgage |
| Less than $800 | 3,317 (38.0%) | 7 (0.1%) |
| $800 to $1,499 | 2,929 (33.6%) | 1,777 (18.4%) |
| $800 to $1,499 | 1,919 (22.0%) | 3,308 (34.2%) |
| Total | 8,719 (100.0%) | 9,679 (100.0%) |
Health & Disability in Putnam County
Health Insurance Coverage by Age in Putnam County
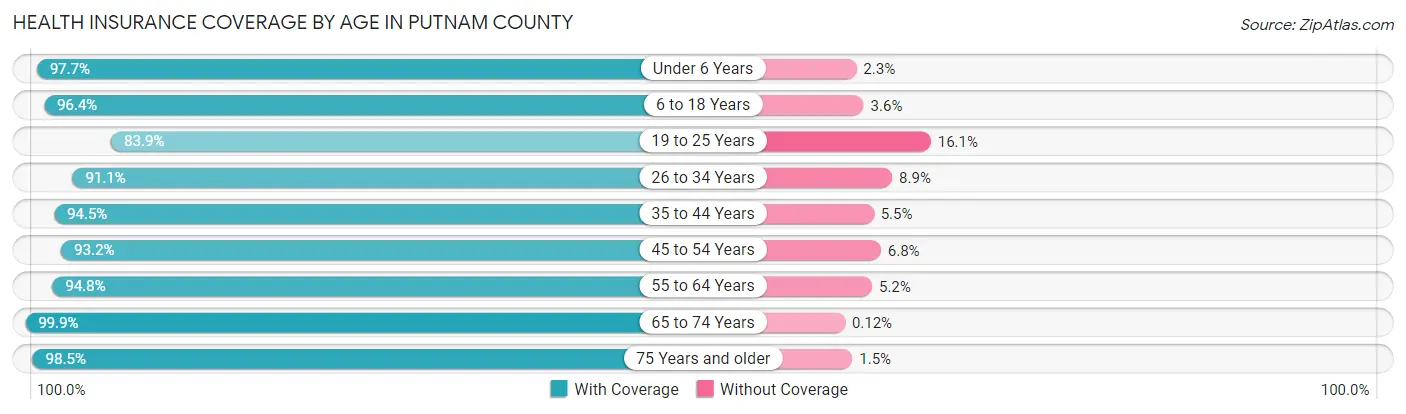
| Age Bracket | With Coverage | Without Coverage |
| Under 6 Years | 3,409 (97.7%) | 79 (2.3%) |
| 6 to 18 Years | 9,325 (96.4%) | 349 (3.6%) |
| 19 to 25 Years | 3,557 (83.9%) | 684 (16.1%) |
| 26 to 34 Years | 4,908 (91.1%) | 481 (8.9%) |
| 35 to 44 Years | 7,040 (94.5%) | 408 (5.5%) |
| 45 to 54 Years | 7,256 (93.2%) | 531 (6.8%) |
| 55 to 64 Years | 7,484 (94.8%) | 408 (5.2%) |
| 65 to 74 Years | 6,462 (99.9%) | 8 (0.1%) |
| 75 Years and older | 4,202 (98.5%) | 64 (1.5%) |
| Total | 53,643 (94.7%) | 3,012 (5.3%) |
Health Insurance Coverage by Citizenship Status in Putnam County
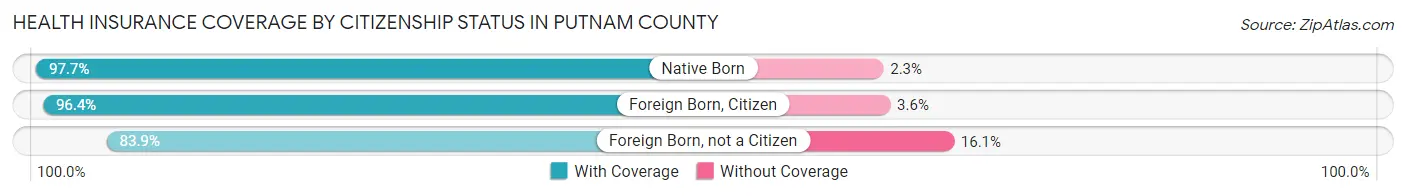
| Citizenship Status | With Coverage | Without Coverage |
| Native Born | 3,409 (97.7%) | 79 (2.3%) |
| Foreign Born, Citizen | 9,325 (96.4%) | 349 (3.6%) |
| Foreign Born, not a Citizen | 3,557 (83.9%) | 684 (16.1%) |
Health Insurance Coverage by Household Income in Putnam County
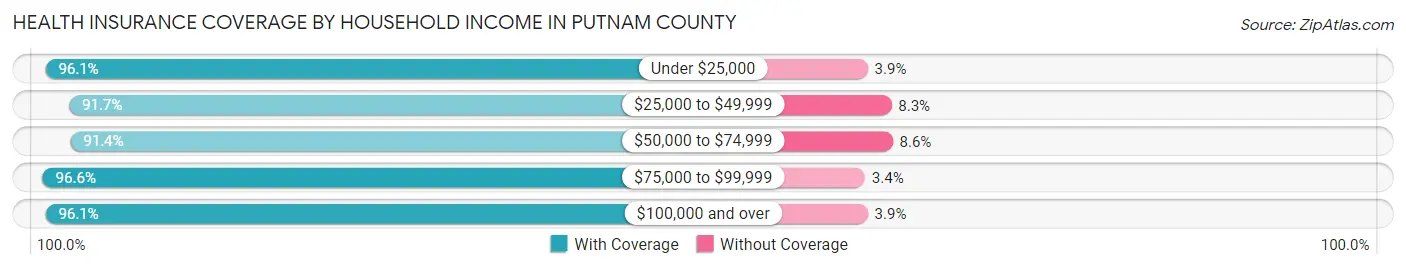
| Household Income | With Coverage | Without Coverage |
| Under $25,000 | 5,328 (96.1%) | 217 (3.9%) |
| $25,000 to $49,999 | 8,197 (91.7%) | 746 (8.3%) |
| $50,000 to $74,999 | 8,575 (91.4%) | 805 (8.6%) |
| $75,000 to $99,999 | 6,963 (96.6%) | 244 (3.4%) |
| $100,000 and over | 24,572 (96.1%) | 1,000 (3.9%) |
Public vs Private Health Insurance Coverage by Age in Putnam County
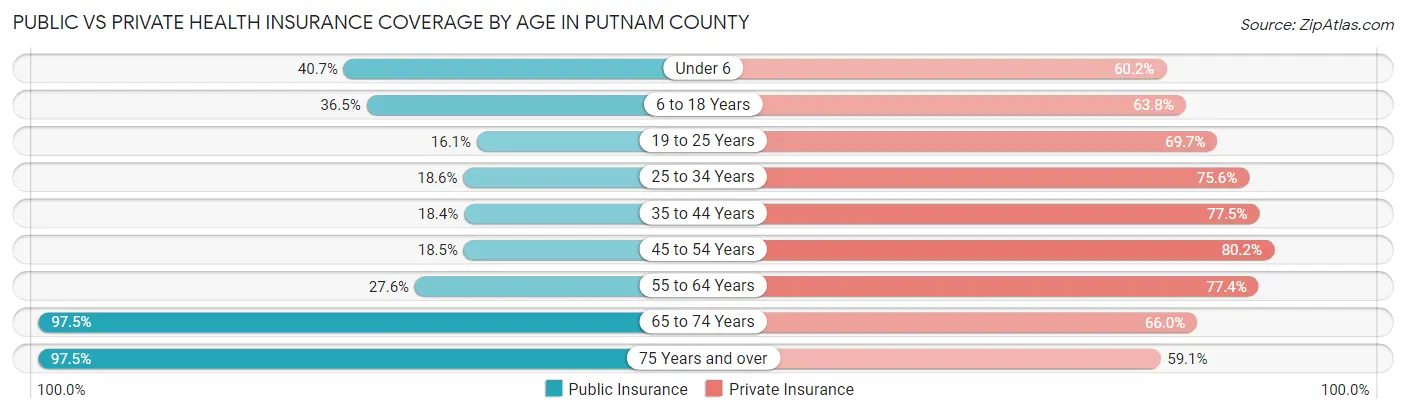
| Age Bracket | Public Insurance | Private Insurance |
| Under 6 | 1,421 (40.7%) | 2,100 (60.2%) |
| 6 to 18 Years | 3,535 (36.5%) | 6,171 (63.8%) |
| 19 to 25 Years | 681 (16.1%) | 2,956 (69.7%) |
| 25 to 34 Years | 1,001 (18.6%) | 4,073 (75.6%) |
| 35 to 44 Years | 1,373 (18.4%) | 5,772 (77.5%) |
| 45 to 54 Years | 1,439 (18.5%) | 6,243 (80.2%) |
| 55 to 64 Years | 2,174 (27.6%) | 6,105 (77.4%) |
| 65 to 74 Years | 6,306 (97.5%) | 4,267 (65.9%) |
| 75 Years and over | 4,161 (97.5%) | 2,522 (59.1%) |
| Total | 22,091 (39.0%) | 40,209 (71.0%) |
Disability Status by Sex by Age in Putnam County
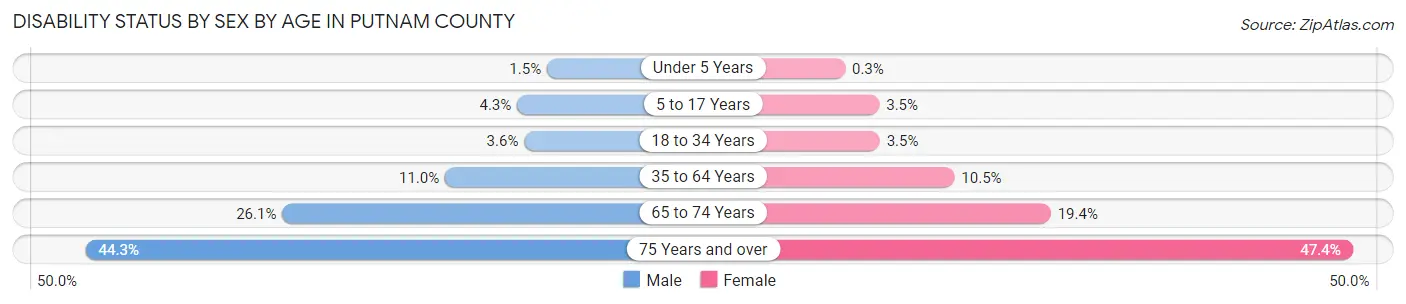
| Age Bracket | Male | Female |
| Under 5 Years | 21 (1.5%) | 4 (0.3%) |
| 5 to 17 Years | 224 (4.3%) | 159 (3.5%) |
| 18 to 34 Years | 188 (3.6%) | 180 (3.5%) |
| 35 to 64 Years | 1,267 (11.0%) | 1,211 (10.4%) |
| 65 to 74 Years | 793 (26.1%) | 665 (19.4%) |
| 75 Years and over | 809 (44.3%) | 1,157 (47.4%) |
Disability Class by Sex by Age in Putnam County
Disability Class: Hearing Difficulty
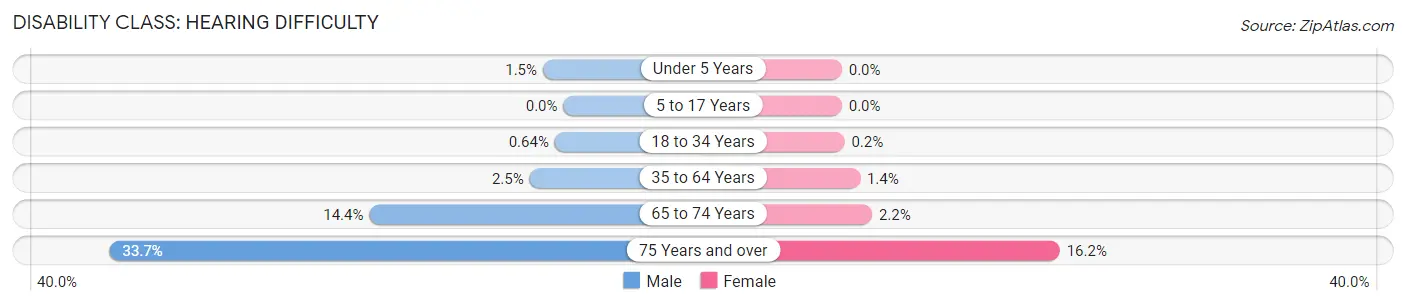
| Age Bracket | Male | Female |
| Under 5 Years | 21 (1.5%) | 0 (0.0%) |
| 5 to 17 Years | 0 (0.0%) | 0 (0.0%) |
| 18 to 34 Years | 33 (0.6%) | 10 (0.2%) |
| 35 to 64 Years | 290 (2.5%) | 156 (1.3%) |
| 65 to 74 Years | 438 (14.4%) | 77 (2.2%) |
| 75 Years and over | 615 (33.7%) | 395 (16.2%) |
Disability Class: Vision Difficulty
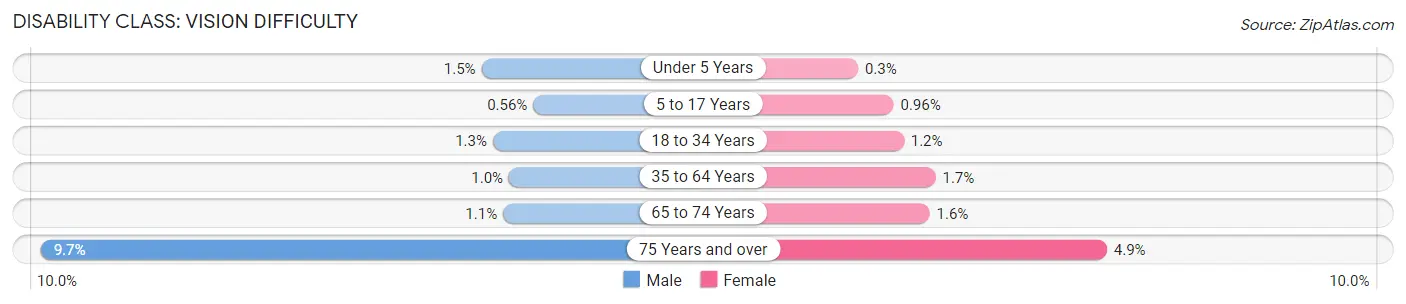
| Age Bracket | Male | Female |
| Under 5 Years | 21 (1.5%) | 4 (0.3%) |
| 5 to 17 Years | 29 (0.6%) | 44 (1.0%) |
| 18 to 34 Years | 68 (1.3%) | 59 (1.1%) |
| 35 to 64 Years | 117 (1.0%) | 202 (1.7%) |
| 65 to 74 Years | 34 (1.1%) | 56 (1.6%) |
| 75 Years and over | 177 (9.7%) | 120 (4.9%) |
Disability Class: Cognitive Difficulty

| Age Bracket | Male | Female |
| 5 to 17 Years | 190 (3.6%) | 144 (3.2%) |
| 18 to 34 Years | 130 (2.5%) | 108 (2.1%) |
| 35 to 64 Years | 723 (6.3%) | 585 (5.1%) |
| 65 to 74 Years | 142 (4.7%) | 41 (1.2%) |
| 75 Years and over | 294 (16.1%) | 334 (13.7%) |
Disability Class: Ambulatory Difficulty
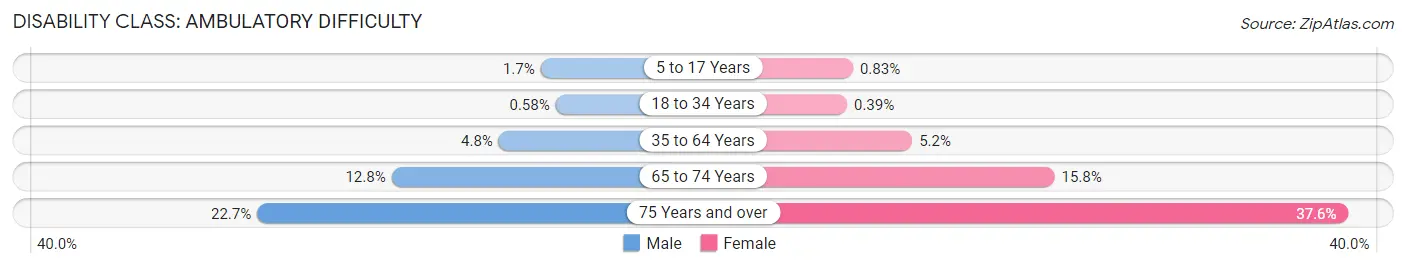
| Age Bracket | Male | Female |
| 5 to 17 Years | 88 (1.7%) | 38 (0.8%) |
| 18 to 34 Years | 30 (0.6%) | 20 (0.4%) |
| 35 to 64 Years | 554 (4.8%) | 606 (5.2%) |
| 65 to 74 Years | 388 (12.8%) | 542 (15.8%) |
| 75 Years and over | 415 (22.7%) | 918 (37.6%) |
Disability Class: Self-Care Difficulty
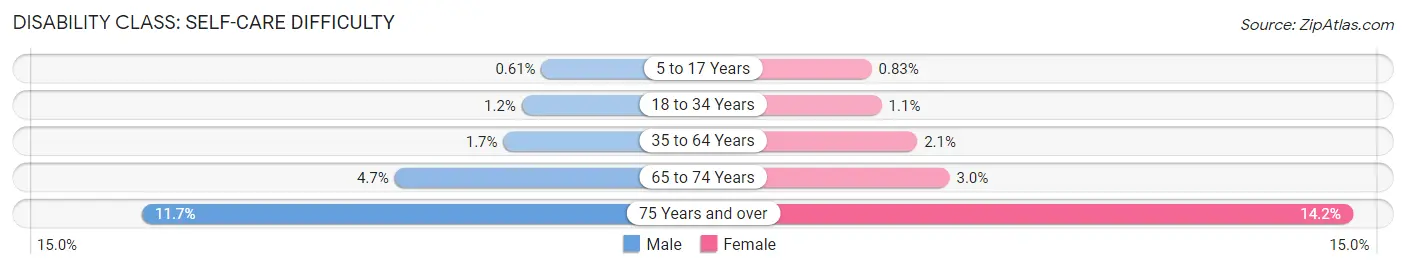
| Age Bracket | Male | Female |
| 5 to 17 Years | 32 (0.6%) | 38 (0.8%) |
| 18 to 34 Years | 60 (1.2%) | 57 (1.1%) |
| 35 to 64 Years | 193 (1.7%) | 243 (2.1%) |
| 65 to 74 Years | 143 (4.7%) | 103 (3.0%) |
| 75 Years and over | 214 (11.7%) | 347 (14.2%) |
Technology Access in Putnam County
Computing Device Access in Putnam County
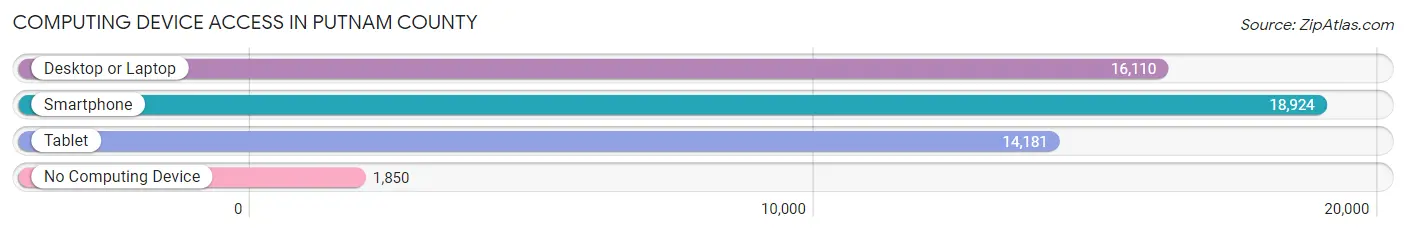
| Device Type | # Households | % Households |
| Desktop or Laptop | 16,110 | 71.9% |
| Smartphone | 18,924 | 84.5% |
| Tablet | 14,181 | 63.3% |
| No Computing Device | 1,850 | 8.3% |
| Total | 22,402 | 100.0% |
Internet Access in Putnam County
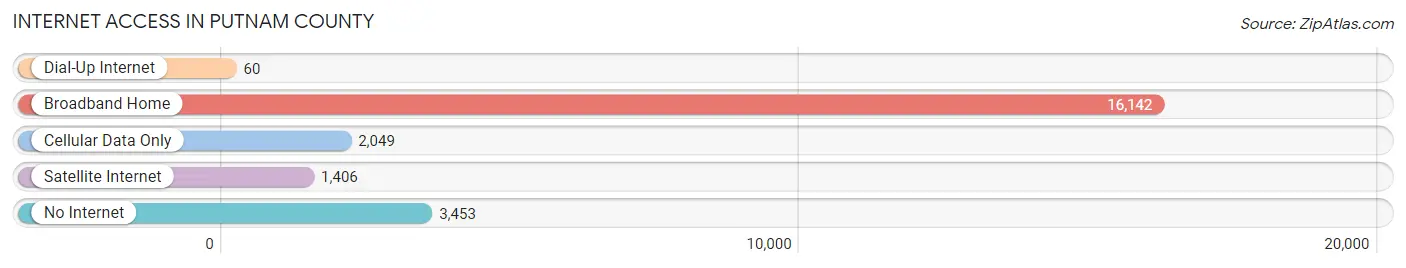
| Internet Type | # Households | % Households |
| Dial-Up Internet | 60 | 0.3% |
| Broadband Home | 16,142 | 72.1% |
| Cellular Data Only | 2,049 | 9.1% |
| Satellite Internet | 1,406 | 6.3% |
| No Internet | 3,453 | 15.4% |
| Total | 22,402 | 100.0% |
Putnam County Summary
Putnam County, West Virginia is located in the central part of the state, and is bordered by Kanawha County to the north, Mason County to the east, Cabell County to the south, and Lincoln County to the west. The county seat is Winfield, and the county was created in 1848 from parts of Kanawha and Cabell counties. The county has a total area of 441 square miles, and a population of 55,486 as of the 2010 census.
History
Putnam County was formed in 1848 from parts of Kanawha and Cabell counties. The county was named for Israel Putnam, a Revolutionary War hero. The county was originally part of the Kanawha County land grant, and was first settled in the late 1700s. The first county seat was located in Buffalo, but was moved to Winfield in 1871.
The county was home to several Civil War battles, including the Battle of Scary Creek in 1861, and the Battle of Buffington Island in 1863. The county was also home to several Native American tribes, including the Shawnee, Mingo, and Cherokee.
Geography
Putnam County is located in the central part of West Virginia, and is bordered by Kanawha County to the north, Mason County to the east, Cabell County to the south, and Lincoln County to the west. The county has a total area of 441 square miles, and is mostly rural. The county is located in the Appalachian Mountains, and is home to several rivers, including the Kanawha, Big Sandy, and Guyandotte.
The county is home to several state parks, including Chief Logan State Park, Beech Fork State Park, and Twin Falls State Park. The county is also home to several wildlife management areas, including the Buffalo Mountain Wildlife Management Area, and the Little Coal River Wildlife Management Area.
Economy
Putnam County has a diverse economy, with a mix of manufacturing, agriculture, and tourism. The county is home to several large employers, including the West Virginia American Water Company, the Putnam County Board of Education, and the Putnam County Health Department.
The county is also home to several small businesses, including restaurants, retail stores, and service providers. The county is also home to several wineries, including the Putnam County Winery, and the Putnam County Vineyard.
The county is also home to several tourist attractions, including the Chief Logan State Park, the Beech Fork State Park, and the Twin Falls State Park. The county is also home to several golf courses, including the Putnam County Golf Course, and the Winfield Country Club.
Demographics
As of the 2010 census, Putnam County had a population of 55,486. The racial makeup of the county was 95.3% White, 2.2% African American, 0.3% Native American, 0.5% Asian, 0.1% Pacific Islander, 0.4% from other races, and 1.2% from two or more races. Hispanic or Latino of any race were 1.3% of the population.
The median income for a household in the county was $41,945, and the median income for a family was $50,945. The per capita income for the county was $20,945. About 10.3% of families and 13.2% of the population were below the poverty line, including 17.2% of those under age 18 and 8.7% of those age 65 or over.
Common Questions
What is the Total Population of Putnam County?
Total Population of Putnam County is 57,347.
What is the Total Male Population of Putnam County?
Total Male Population of Putnam County is 28,611.
What is the Total Female Population of Putnam County?
Total Female Population of Putnam County is 28,736.
What is the Ratio of Males per 100 Females in Putnam County?
There are 99.57 Males per 100 Females in Putnam County.
What is the Ratio of Females per 100 Males in Putnam County?
There are 100.44 Females per 100 Males in Putnam County.
What is the Median Population Age in Putnam County?
Median Population Age in Putnam County is 42.2 Years.
What is the Average Family Size in Putnam County
Average Family Size in Putnam County is 3.0 People.
What is the Average Household Size in Putnam County
Average Household Size in Putnam County is 2.5 People.
What is Per Capita Income in Putnam County?
Per Capita income in Putnam County is $38,589.
What is the Median Family Income in Putnam County?
Median Family Income in Putnam County is $90,102.
What is the Median Household income in Putnam County?
Median Household Income in Putnam County is $75,725.
What is Income or Wage Gap in Putnam County?
Income or Wage Gap in Putnam County is 35.5%.
Women in Putnam County earn 64.5 cents for every dollar earned by a man.
What is Family Income Deficit in Putnam County?
Family Income Deficit in Putnam County is $11,806.
Families that are below poverty line in Putnam County earn $11,806 less on average than the poverty threshold level.
What is Inequality or Gini Index in Putnam County?
Inequality or Gini Index in Putnam County is 0.42.
How Large is the Labor Force in Putnam County?
There are 27,179 People in the Labor Forcein in Putnam County.
What is the Percentage of People in the Labor Force in Putnam County?
58.6% of People are in the Labor Force in Putnam County.
What is the Unemployment Rate in Putnam County?
Unemployment Rate in Putnam County is 3.8%.