Preston County, WV
Preston County Map
Preston County Overview
34,206
TOTAL POPULATION
18,139
MALE POPULATION
16,067
FEMALE POPULATION
112.90
MALES / 100 FEMALES
88.58
FEMALES / 100 MALES
42.5
MEDIAN AGE
2.9
AVG FAMILY SIZE
2.4
AVG HOUSEHOLD SIZE
$27,848
PER CAPITA INCOME
$73,144
AVG FAMILY INCOME
$60,136
AVG HOUSEHOLD INCOME
34.1%
WAGE / INCOME GAP [ % ]
65.9¢/ $1
WAGE / INCOME GAP [ $ ]
$13,376
FAMILY INCOME DEFICIT
0.42
INEQUALITY / GINI INDEX
14,436
LABOR FORCE [ PEOPLE ]
50.3%
PERCENT IN LABOR FORCE
7.2%
UNEMPLOYMENT RATE
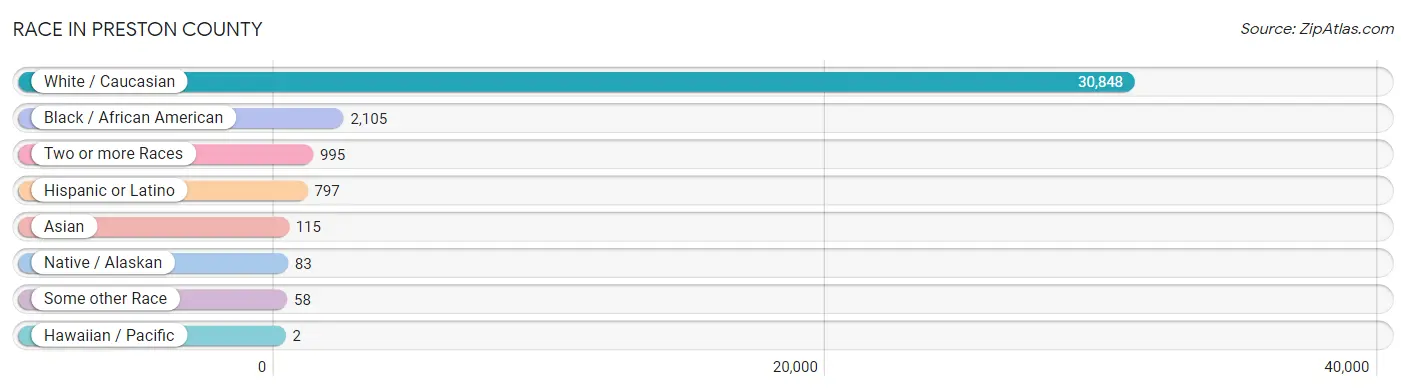
Race in Preston County
The most populous races in Preston County are White / Caucasian (30,848 | 90.2%), Black / African American (2,105 | 6.1%), and Two or more Races (995 | 2.9%).
| Race | # Population | % Population |
| Asian | 115 | 0.3% |
| Black / African American | 2,105 | 6.1% |
| Hawaiian / Pacific | 2 | 0.0% |
| Hispanic or Latino | 797 | 2.3% |
| Native / Alaskan | 83 | 0.2% |
| White / Caucasian | 30,848 | 90.2% |
| Two or more Races | 995 | 2.9% |
| Some other Race | 58 | 0.2% |
| Total | 34,206 | 100.0% |
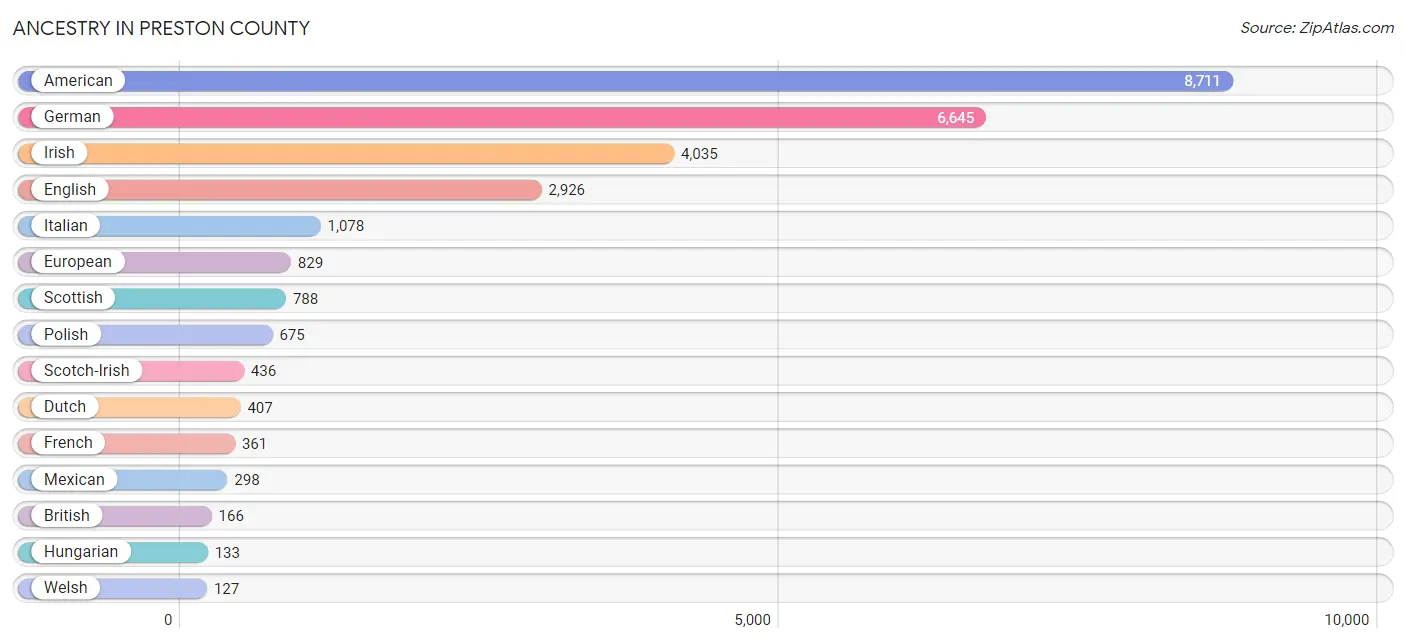
Ancestry in Preston County
The most populous ancestries reported in Preston County are American (8,711 | 25.5%), German (6,645 | 19.4%), Irish (4,035 | 11.8%), English (2,926 | 8.6%), and Italian (1,078 | 3.2%), together accounting for 68.4% of all Preston County residents.
| Ancestry | # Population | % Population |
| African | 81 | 0.2% |
| Albanian | 6 | 0.0% |
| Aleut | 45 | 0.1% |
| American | 8,711 | 25.5% |
| Arab | 17 | 0.1% |
| Armenian | 4 | 0.0% |
| Austrian | 12 | 0.0% |
| Blackfeet | 12 | 0.0% |
| British | 166 | 0.5% |
| Cherokee | 53 | 0.2% |
| Choctaw | 1 | 0.0% |
| Croatian | 58 | 0.2% |
| Czech | 2 | 0.0% |
| Czechoslovakian | 26 | 0.1% |
| Danish | 15 | 0.0% |
| Dominican | 9 | 0.0% |
| Dutch | 407 | 1.2% |
| Eastern European | 26 | 0.1% |
| English | 2,926 | 8.6% |
| European | 829 | 2.4% |
| French | 361 | 1.1% |
| French Canadian | 3 | 0.0% |
| German | 6,645 | 19.4% |
| Greek | 52 | 0.2% |
| Hungarian | 133 | 0.4% |
| Indian (Asian) | 58 | 0.2% |
| Inupiat | 45 | 0.1% |
| Irish | 4,035 | 11.8% |
| Italian | 1,078 | 3.2% |
| Korean | 35 | 0.1% |
| Lithuanian | 49 | 0.1% |
| Mexican | 298 | 0.9% |
| Nigerian | 3 | 0.0% |
| Norwegian | 40 | 0.1% |
| Peruvian | 8 | 0.0% |
| Polish | 675 | 2.0% |
| Portuguese | 9 | 0.0% |
| Puerto Rican | 50 | 0.2% |
| Romanian | 1 | 0.0% |
| Russian | 82 | 0.2% |
| Samoan | 2 | 0.0% |
| Scandinavian | 104 | 0.3% |
| Scotch-Irish | 436 | 1.3% |
| Scottish | 788 | 2.3% |
| Sioux | 26 | 0.1% |
| Slavic | 62 | 0.2% |
| Slovak | 44 | 0.1% |
| Slovene | 13 | 0.0% |
| South American | 15 | 0.0% |
| Spanish | 16 | 0.1% |
| Sri Lankan | 13 | 0.0% |
| Subsaharan African | 84 | 0.3% |
| Swedish | 96 | 0.3% |
| Swiss | 46 | 0.1% |
| Syrian | 17 | 0.1% |
| Ukrainian | 11 | 0.0% |
| Venezuelan | 7 | 0.0% |
| Welsh | 127 | 0.4% |
| West Indian | 10 | 0.0% | View All 59 Rows |
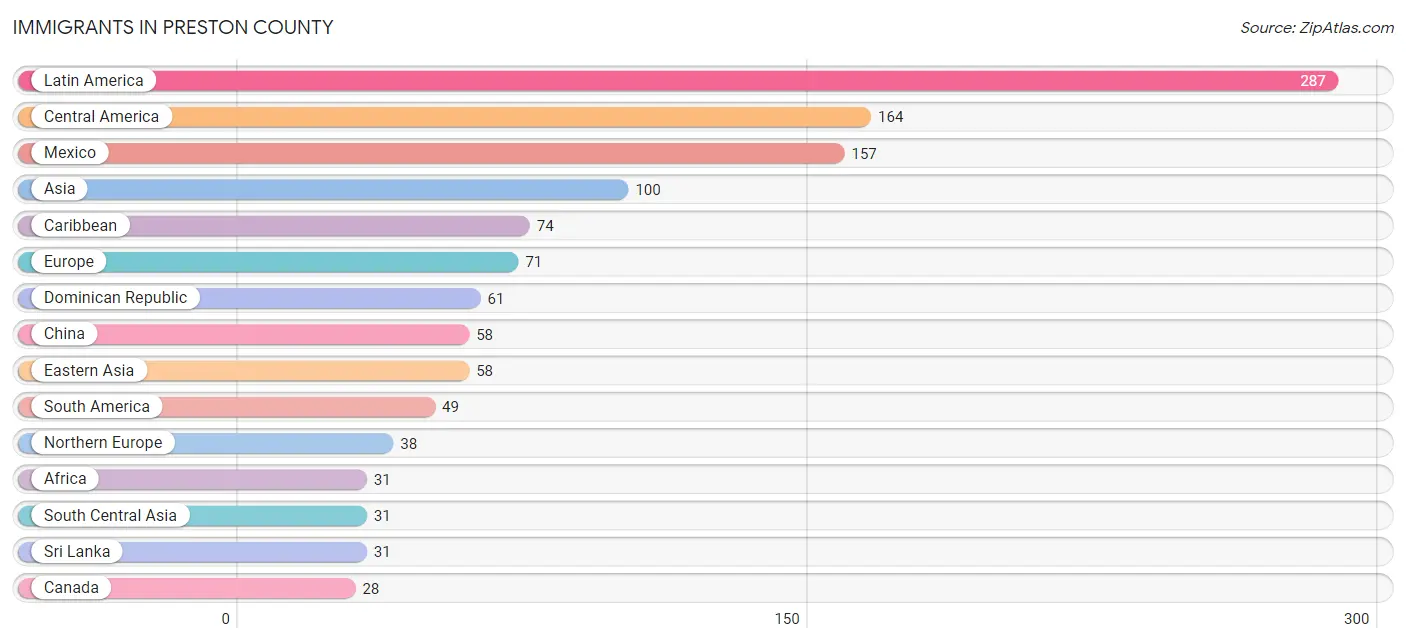
Immigrants in Preston County
The most numerous immigrant groups reported in Preston County came from Latin America (287 | 0.8%), Central America (164 | 0.5%), Mexico (157 | 0.5%), Asia (100 | 0.3%), and Caribbean (74 | 0.2%), together accounting for 2.3% of all Preston County residents.
| Immigration Origin | # Population | % Population |
| Africa | 31 | 0.1% |
| Asia | 100 | 0.3% |
| Canada | 28 | 0.1% |
| Caribbean | 74 | 0.2% |
| Central America | 164 | 0.5% |
| China | 58 | 0.2% |
| Colombia | 26 | 0.1% |
| Dominican Republic | 61 | 0.2% |
| Eastern Africa | 9 | 0.0% |
| Eastern Asia | 58 | 0.2% |
| Eastern Europe | 9 | 0.0% |
| England | 16 | 0.1% |
| Europe | 71 | 0.2% |
| Germany | 17 | 0.1% |
| Ghana | 8 | 0.0% |
| Honduras | 7 | 0.0% |
| Italy | 7 | 0.0% |
| Jamaica | 13 | 0.0% |
| Latin America | 287 | 0.8% |
| Lithuania | 9 | 0.0% |
| Mexico | 157 | 0.5% |
| Nigeria | 14 | 0.0% |
| Northern Europe | 38 | 0.1% |
| Peru | 23 | 0.1% |
| Philippines | 11 | 0.0% |
| Somalia | 9 | 0.0% |
| South America | 49 | 0.1% |
| South Central Asia | 31 | 0.1% |
| South Eastern Asia | 11 | 0.0% |
| Southern Europe | 7 | 0.0% |
| Sri Lanka | 31 | 0.1% |
| Western Africa | 22 | 0.1% |
| Western Europe | 17 | 0.1% | View All 33 Rows |
Sex and Age in Preston County
Sex and Age in Preston County
The most populous age groups in Preston County are 25 to 29 Years (1,546 | 8.5%) for men and 60 to 64 Years (1,308 | 8.1%) for women.
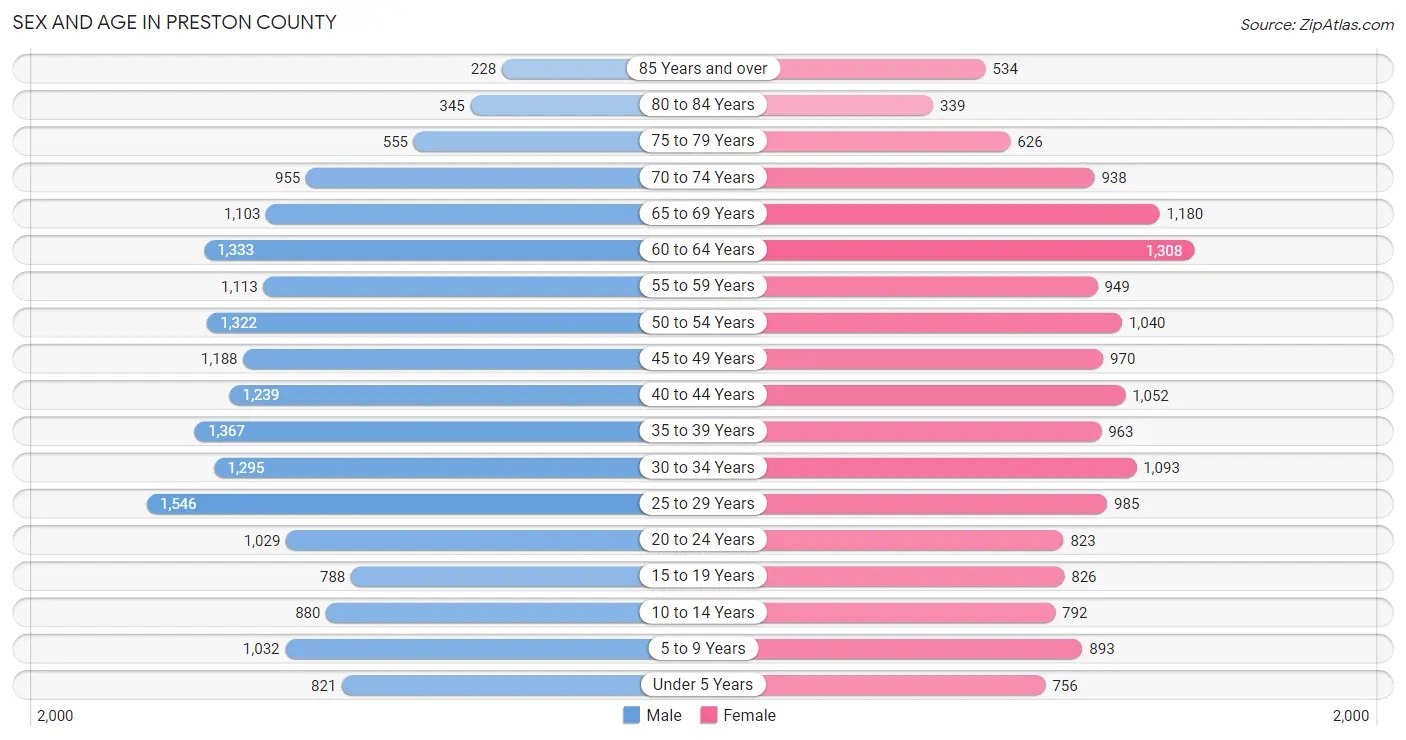
| Age Bracket | Male | Female |
| Under 5 Years | 821 (4.5%) | 756 (4.7%) |
| 5 to 9 Years | 1,032 (5.7%) | 893 (5.6%) |
| 10 to 14 Years | 880 (4.9%) | 792 (4.9%) |
| 15 to 19 Years | 788 (4.3%) | 826 (5.1%) |
| 20 to 24 Years | 1,029 (5.7%) | 823 (5.1%) |
| 25 to 29 Years | 1,546 (8.5%) | 985 (6.1%) |
| 30 to 34 Years | 1,295 (7.1%) | 1,093 (6.8%) |
| 35 to 39 Years | 1,367 (7.5%) | 963 (6.0%) |
| 40 to 44 Years | 1,239 (6.8%) | 1,052 (6.6%) |
| 45 to 49 Years | 1,188 (6.6%) | 970 (6.0%) |
| 50 to 54 Years | 1,322 (7.3%) | 1,040 (6.5%) |
| 55 to 59 Years | 1,113 (6.1%) | 949 (5.9%) |
| 60 to 64 Years | 1,333 (7.3%) | 1,308 (8.1%) |
| 65 to 69 Years | 1,103 (6.1%) | 1,180 (7.3%) |
| 70 to 74 Years | 955 (5.3%) | 938 (5.8%) |
| 75 to 79 Years | 555 (3.1%) | 626 (3.9%) |
| 80 to 84 Years | 345 (1.9%) | 339 (2.1%) |
| 85 Years and over | 228 (1.3%) | 534 (3.3%) |
| Total | 18,139 (100.0%) | 16,067 (100.0%) |
Families and Households in Preston County
Median Family Size in Preston County
The median family size in Preston County is 2.89 persons per family, with single female/mother families (1,148 | 13.1%) accounting for the largest median family size of 2.97 persons per family. On the other hand, single male/father families (519 | 5.9%) represent the smallest median family size with 2.72 persons per family.
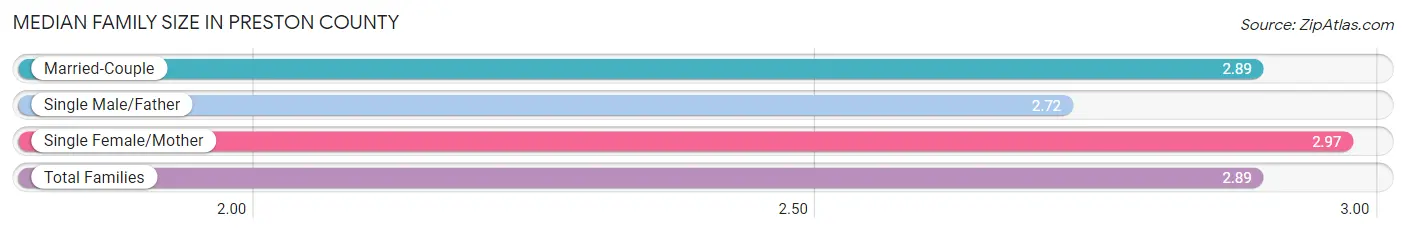
| Family Type | # Families | Family Size |
| Married-Couple | 7,078 (80.9%) | 2.89 |
| Single Male/Father | 519 (5.9%) | 2.72 |
| Single Female/Mother | 1,148 (13.1%) | 2.97 |
| Total Families | 8,745 (100.0%) | 2.89 |
Median Household Size in Preston County
The median household size in Preston County is 2.43 persons per household, with single female/mother households (1,148 | 9.1%) accounting for the largest median household size of 3.21 persons per household. non-family households (3,878 | 30.7%) represent the smallest median household size with 1.27 persons per household.
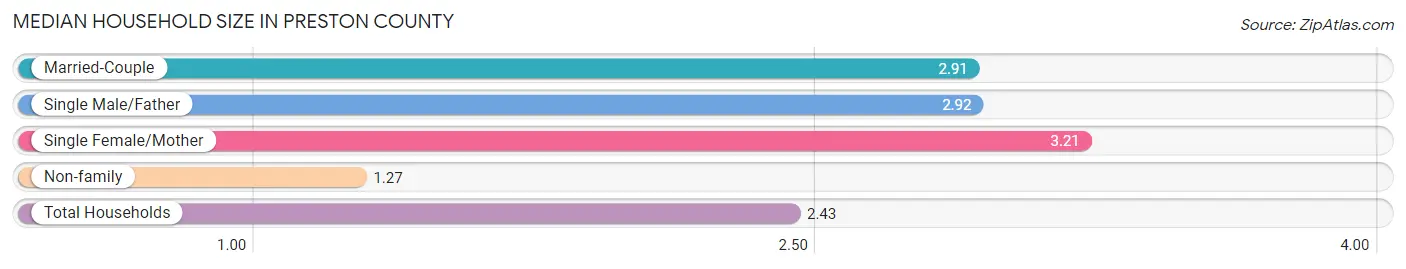
| Household Type | # Households | Household Size |
| Married-Couple | 7,078 (56.1%) | 2.91 |
| Single Male/Father | 519 (4.1%) | 2.92 |
| Single Female/Mother | 1,148 (9.1%) | 3.21 |
| Non-family | 3,878 (30.7%) | 1.27 |
| Total Households | 12,623 (100.0%) | 2.43 |
Household Size by Marriage Status in Preston County
Out of a total of 12,623 households in Preston County, 8,745 (69.3%) are family households, while 3,878 (30.7%) are nonfamily households. The most numerous type of family households are 2-person households, comprising 4,499, and the most common type of nonfamily households are 1-person households, comprising 2,969.
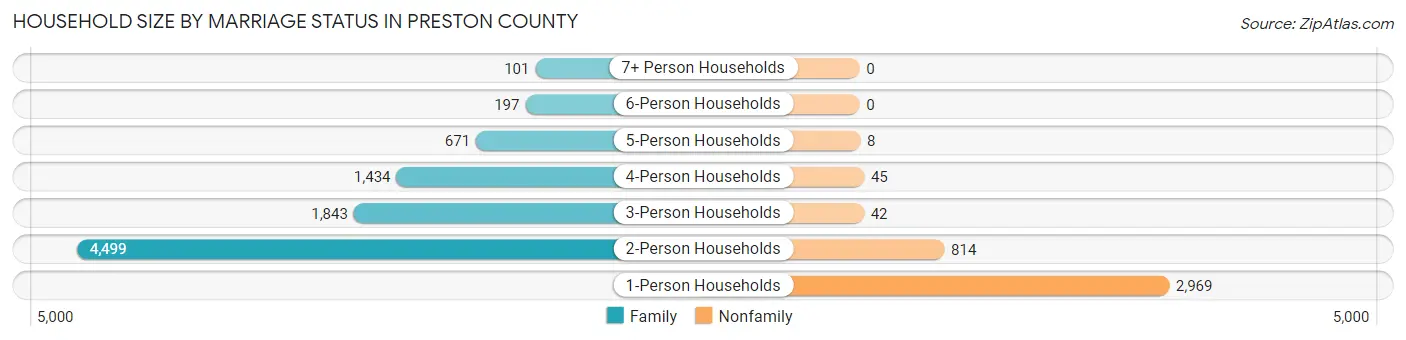
| Household Size | Family Households | Nonfamily Households |
| 1-Person Households | - | 2,969 (23.5%) |
| 2-Person Households | 4,499 (35.6%) | 814 (6.5%) |
| 3-Person Households | 1,843 (14.6%) | 42 (0.3%) |
| 4-Person Households | 1,434 (11.4%) | 45 (0.4%) |
| 5-Person Households | 671 (5.3%) | 8 (0.1%) |
| 6-Person Households | 197 (1.6%) | 0 (0.0%) |
| 7+ Person Households | 101 (0.8%) | 0 (0.0%) |
| Total | 8,745 (69.3%) | 3,878 (30.7%) |
Female Fertility in Preston County
Fertility by Age in Preston County
Average fertility rate in Preston County is 61.0 births per 1,000 women. Women in the age bracket of 20 to 34 years have the highest fertility rate with 125.0 births per 1,000 women. Women in the age bracket of 20 to 34 years acount for 85.4% of all women with births.
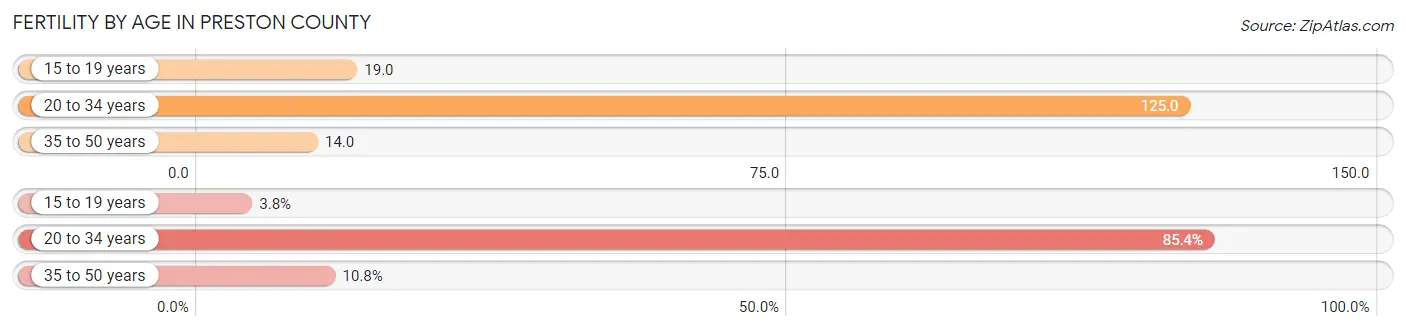
| Age Bracket | Women with Births | Births / 1,000 Women |
| 15 to 19 years | 16 (3.8%) | 19.0 |
| 20 to 34 years | 363 (85.4%) | 125.0 |
| 35 to 50 years | 46 (10.8%) | 14.0 |
| Total | 425 (100.0%) | 61.0 |
Fertility by Age by Marriage Status in Preston County
63.8% of women with births (425) in Preston County are married. The highest percentage of unmarried women with births falls into 15 to 19 years age bracket with 100.0% of them unmarried at the time of birth, while the lowest percentage of unmarried women with births belong to 35 to 50 years age bracket with 28.3% of them unmarried.
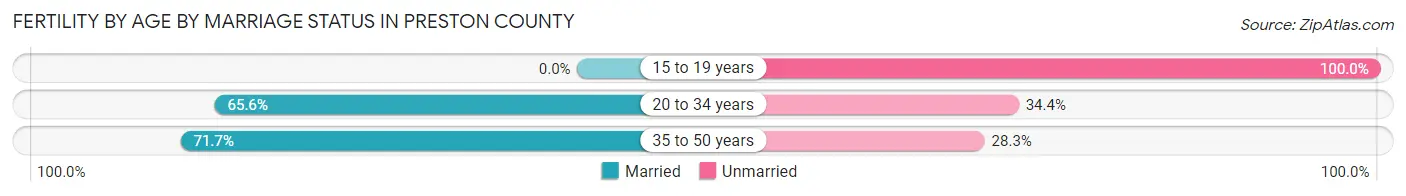
| Age Bracket | Married | Unmarried |
| 15 to 19 years | 0 (0.0%) | 16 (100.0%) |
| 20 to 34 years | 238 (65.6%) | 125 (34.4%) |
| 35 to 50 years | 33 (71.7%) | 13 (28.3%) |
| Total | 271 (63.8%) | 154 (36.2%) |
Fertility by Education in Preston County
Average fertility rate in Preston County is 61.0 births per 1,000 women. Women with the education attainment of bachelor's degree have the highest fertility rate of 179.0 births per 1,000 women, while women with the education attainment of less than high school have the lowest fertility at 3.0 births per 1,000 women. Women with the education attainment of bachelor's degree represent 43.1% of all women with births.
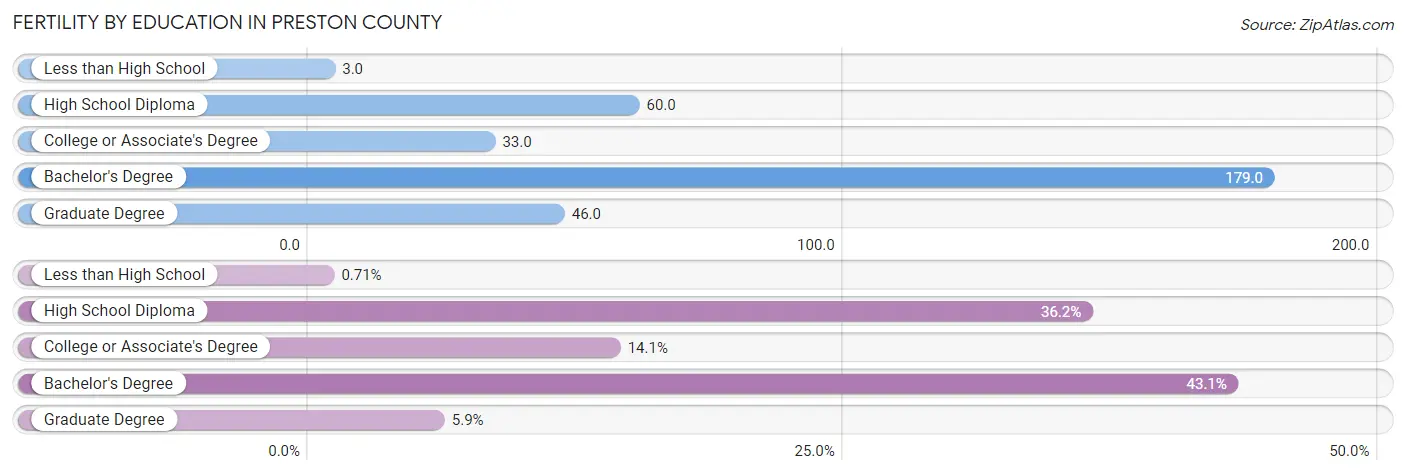
| Educational Attainment | Women with Births | Births / 1,000 Women |
| Less than High School | 3 (0.7%) | 3.0 |
| High School Diploma | 154 (36.2%) | 60.0 |
| College or Associate's Degree | 60 (14.1%) | 33.0 |
| Bachelor's Degree | 183 (43.1%) | 179.0 |
| Graduate Degree | 25 (5.9%) | 46.0 |
| Total | 425 (100.0%) | 61.0 |
Fertility by Education by Marriage Status in Preston County
36.2% of women with births in Preston County are unmarried. Women with the educational attainment of less than high school are most likely to be married with 100.0% of them married at childbirth, while women with the educational attainment of high school diploma are least likely to be married with 80.5% of them unmarried at childbirth.
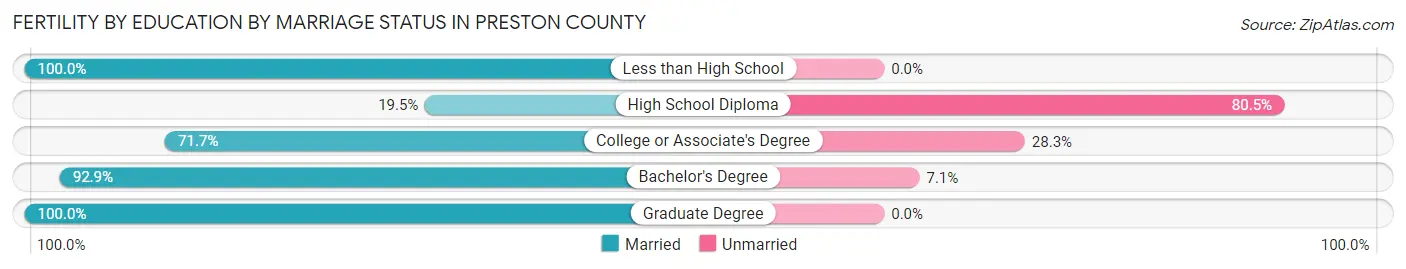
| Educational Attainment | Married | Unmarried |
| Less than High School | 3 (100.0%) | 0 (0.0%) |
| High School Diploma | 30 (19.5%) | 124 (80.5%) |
| College or Associate's Degree | 43 (71.7%) | 17 (28.3%) |
| Bachelor's Degree | 170 (92.9%) | 13 (7.1%) |
| Graduate Degree | 25 (100.0%) | 0 (0.0%) |
| Total | 271 (63.8%) | 154 (36.2%) |
Income in Preston County
Income Overview in Preston County
Per Capita Income in Preston County is $27,848, while median incomes of families and households are $73,144 and $60,136 respectively.
| Characteristic | Number | Measure |
| Per Capita Income | 34,206 | $27,848 |
| Median Family Income | 8,745 | $73,144 |
| Mean Family Income | 8,745 | $86,811 |
| Median Household Income | 12,623 | $60,136 |
| Mean Household Income | 12,623 | $74,118 |
| Income Deficit | 8,745 | $13,376 |
| Wage / Income Gap (%) | 34,206 | 34.07% |
| Wage / Income Gap ($) | 34,206 | 65.93¢ per $1 |
| Gini / Inequality Index | 34,206 | 0.42 |
Earnings by Sex in Preston County
Average Earnings in Preston County are $35,003, $43,293 for men and $28,544 for women, a difference of 34.1%.
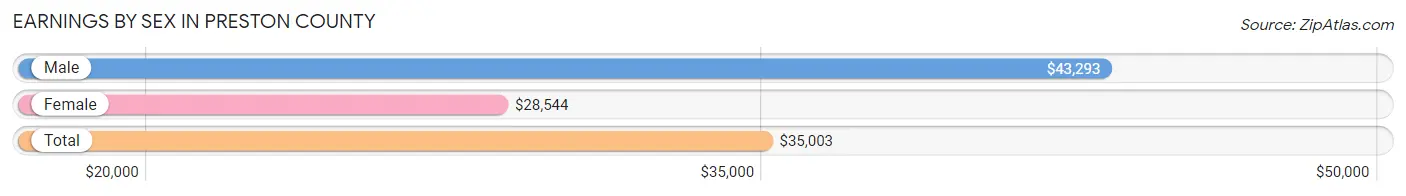
| Sex | Number | Average Earnings |
| Male | 8,075 (53.2%) | $43,293 |
| Female | 7,100 (46.8%) | $28,544 |
| Total | 15,175 (100.0%) | $35,003 |
Earnings by Sex by Income Bracket in Preston County
The most common earnings brackets in Preston County are $75,000 to $99,999 for men (972 | 12.0%) and $25,000 to $29,999 for women (605 | 8.5%).
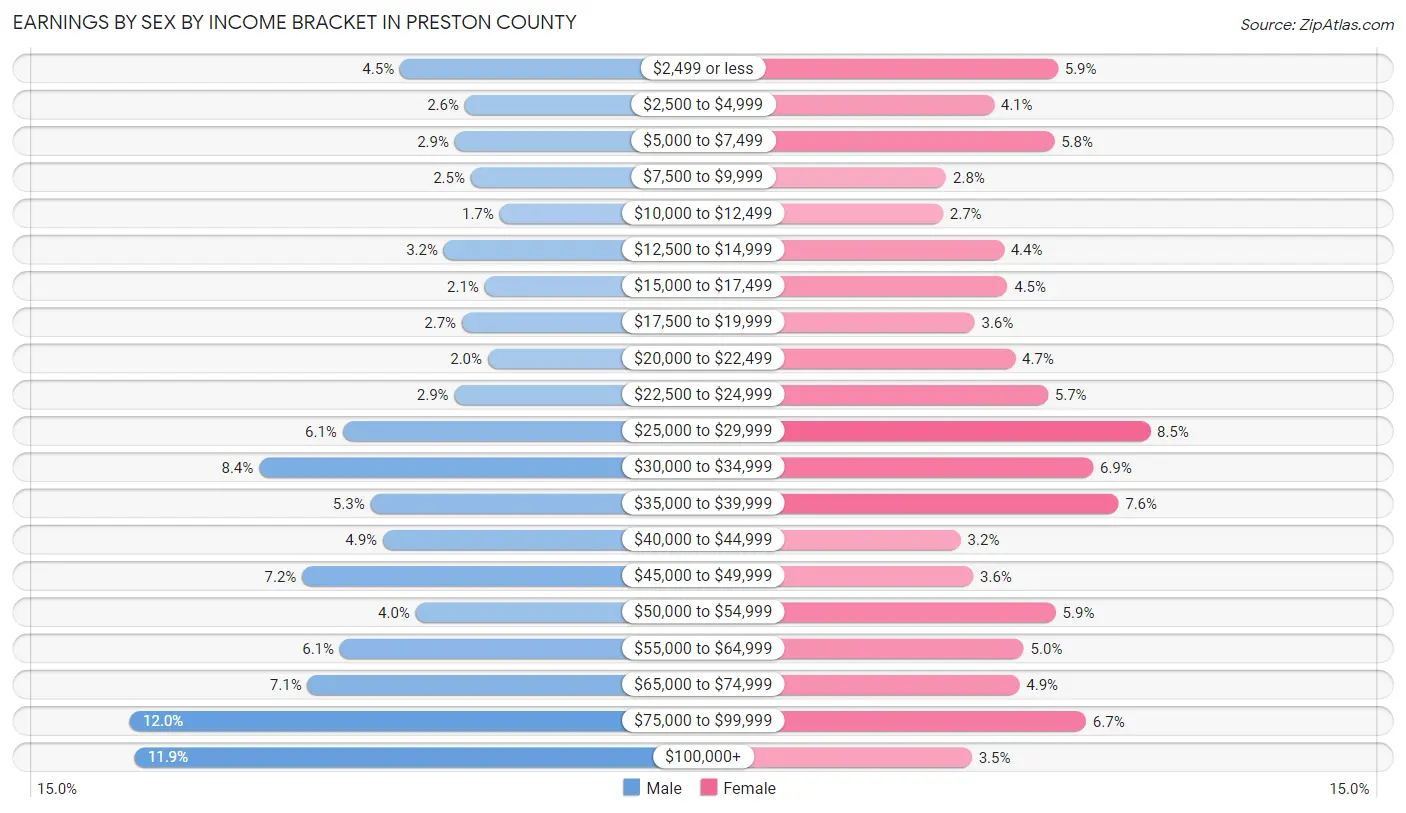
| Income | Male | Female |
| $2,499 or less | 359 (4.4%) | 421 (5.9%) |
| $2,500 to $4,999 | 212 (2.6%) | 293 (4.1%) |
| $5,000 to $7,499 | 235 (2.9%) | 414 (5.8%) |
| $7,500 to $9,999 | 199 (2.5%) | 198 (2.8%) |
| $10,000 to $12,499 | 133 (1.7%) | 192 (2.7%) |
| $12,500 to $14,999 | 260 (3.2%) | 313 (4.4%) |
| $15,000 to $17,499 | 167 (2.1%) | 320 (4.5%) |
| $17,500 to $19,999 | 219 (2.7%) | 255 (3.6%) |
| $20,000 to $22,499 | 160 (2.0%) | 336 (4.7%) |
| $22,500 to $24,999 | 236 (2.9%) | 401 (5.7%) |
| $25,000 to $29,999 | 489 (6.1%) | 605 (8.5%) |
| $30,000 to $34,999 | 679 (8.4%) | 491 (6.9%) |
| $35,000 to $39,999 | 426 (5.3%) | 542 (7.6%) |
| $40,000 to $44,999 | 398 (4.9%) | 227 (3.2%) |
| $45,000 to $49,999 | 581 (7.2%) | 252 (3.5%) |
| $50,000 to $54,999 | 324 (4.0%) | 417 (5.9%) |
| $55,000 to $64,999 | 496 (6.1%) | 353 (5.0%) |
| $65,000 to $74,999 | 569 (7.0%) | 344 (4.9%) |
| $75,000 to $99,999 | 972 (12.0%) | 477 (6.7%) |
| $100,000+ | 961 (11.9%) | 249 (3.5%) |
| Total | 8,075 (100.0%) | 7,100 (100.0%) |
Earnings by Sex by Educational Attainment in Preston County
Average earnings in Preston County are $46,988 for men and $31,606 for women, a difference of 32.7%. Men with an educational attainment of bachelor's degree enjoy the highest average annual earnings of $65,625, while those with less than high school education earn the least with $34,333. Women with an educational attainment of graduate degree earn the most with the average annual earnings of $53,232, while those with less than high school education have the smallest earnings of $14,038.
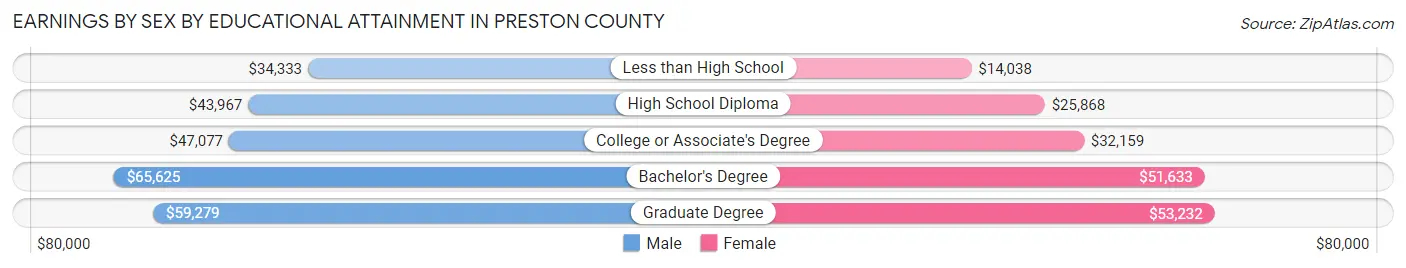
| Educational Attainment | Male Income | Female Income |
| Less than High School | $34,333 | $14,038 |
| High School Diploma | $43,967 | $25,868 |
| College or Associate's Degree | $47,077 | $32,159 |
| Bachelor's Degree | $65,625 | $51,633 |
| Graduate Degree | $59,279 | $53,232 |
| Total | $46,988 | $31,606 |
Family Income in Preston County
Family Income Brackets in Preston County
According to the Preston County family income data, there are 1,950 families falling into the $50,000 to $74,999 income range, which is the most common income bracket and makes up 22.3% of all families. Conversely, the $10,000 to $14,999 income bracket is the least frequent group with only 192 families (2.2%) belonging to this category.
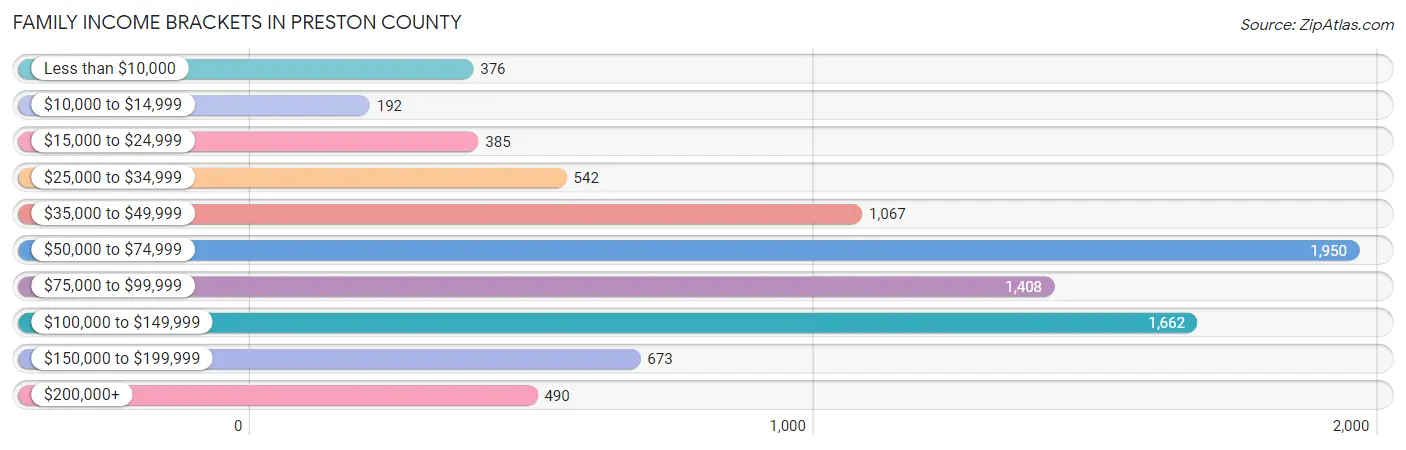
| Income Bracket | # Families | % Families |
| Less than $10,000 | 376 | 4.3% |
| $10,000 to $14,999 | 192 | 2.2% |
| $15,000 to $24,999 | 385 | 4.4% |
| $25,000 to $34,999 | 542 | 6.2% |
| $35,000 to $49,999 | 1,067 | 12.2% |
| $50,000 to $74,999 | 1,950 | 22.3% |
| $75,000 to $99,999 | 1,408 | 16.1% |
| $100,000 to $149,999 | 1,662 | 19.0% |
| $150,000 to $199,999 | 673 | 7.7% |
| $200,000+ | 490 | 5.6% |
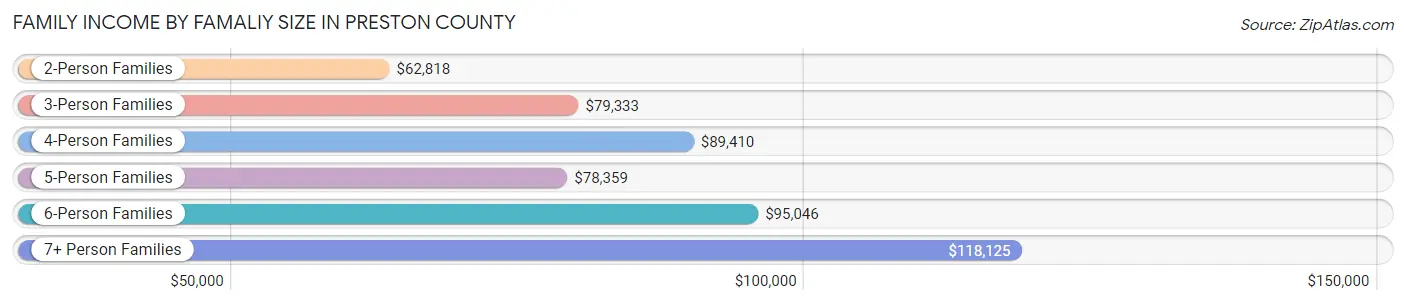
Family Income by Famaliy Size in Preston County
7+ person families (94 | 1.1%) account for the highest median family income in Preston County with $118,125 per family, while 2-person families (4,716 | 53.9%) have the highest median income of $31,409 per family member.
| Income Bracket | # Families | Median Income |
| 2-Person Families | 4,716 (53.9%) | $62,818 |
| 3-Person Families | 1,758 (20.1%) | $79,333 |
| 4-Person Families | 1,385 (15.8%) | $89,410 |
| 5-Person Families | 619 (7.1%) | $78,359 |
| 6-Person Families | 173 (2.0%) | $95,046 |
| 7+ Person Families | 94 (1.1%) | $118,125 |
| Total | 8,745 (100.0%) | $73,144 |
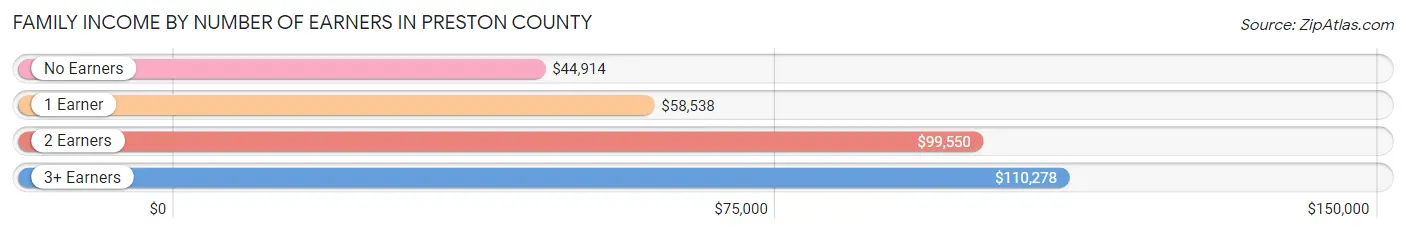
Family Income by Number of Earners in Preston County
The median family income in Preston County is $73,144, with families comprising 3+ earners (834) having the highest median family income of $110,278, while families with no earners (2,056) have the lowest median family income of $44,914, accounting for 9.5% and 23.5% of families, respectively.
| Number of Earners | # Families | Median Income |
| No Earners | 2,056 (23.5%) | $44,914 |
| 1 Earner | 2,582 (29.5%) | $58,538 |
| 2 Earners | 3,273 (37.4%) | $99,550 |
| 3+ Earners | 834 (9.5%) | $110,278 |
| Total | 8,745 (100.0%) | $73,144 |
Household Income in Preston County
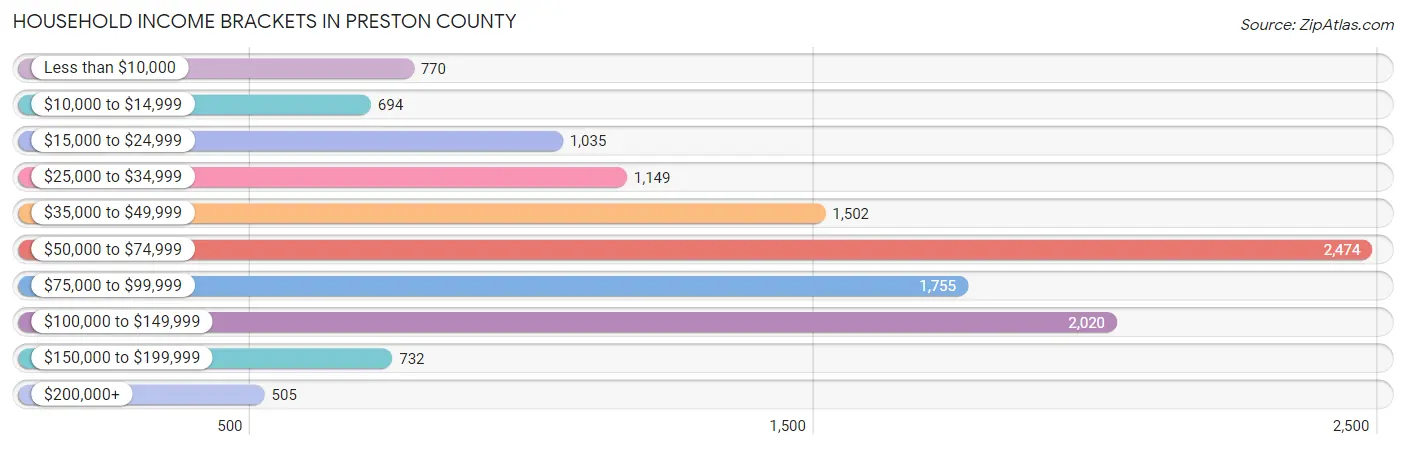
Household Income Brackets in Preston County
With 2,474 households falling in the category, the $50,000 to $74,999 income range is the most frequent in Preston County, accounting for 19.6% of all households. In contrast, only 505 households (4.0%) fall into the $200,000+ income bracket, making it the least populous group.
| Income Bracket | # Households | % Households |
| Less than $10,000 | 770 | 6.1% |
| $10,000 to $14,999 | 694 | 5.5% |
| $15,000 to $24,999 | 1,035 | 8.2% |
| $25,000 to $34,999 | 1,149 | 9.1% |
| $35,000 to $49,999 | 1,502 | 11.9% |
| $50,000 to $74,999 | 2,474 | 19.6% |
| $75,000 to $99,999 | 1,755 | 13.9% |
| $100,000 to $149,999 | 2,020 | 16.0% |
| $150,000 to $199,999 | 732 | 5.8% |
| $200,000+ | 505 | 4.0% |
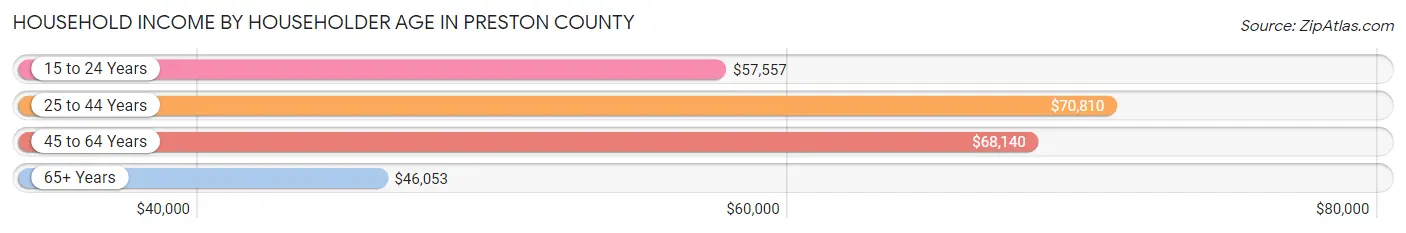
Household Income by Householder Age in Preston County
The median household income in Preston County is $60,136, with the highest median household income of $70,810 found in the 25 to 44 years age bracket for the primary householder. A total of 3,327 households (26.4%) fall into this category. Meanwhile, the 65+ years age bracket for the primary householder has the lowest median household income of $46,053, with 4,238 households (33.6%) in this group.
| Income Bracket | # Households | Median Income |
| 15 to 24 Years | 415 (3.3%) | $57,557 |
| 25 to 44 Years | 3,327 (26.4%) | $70,810 |
| 45 to 64 Years | 4,643 (36.8%) | $68,140 |
| 65+ Years | 4,238 (33.6%) | $46,053 |
| Total | 12,623 (100.0%) | $60,136 |
Poverty in Preston County
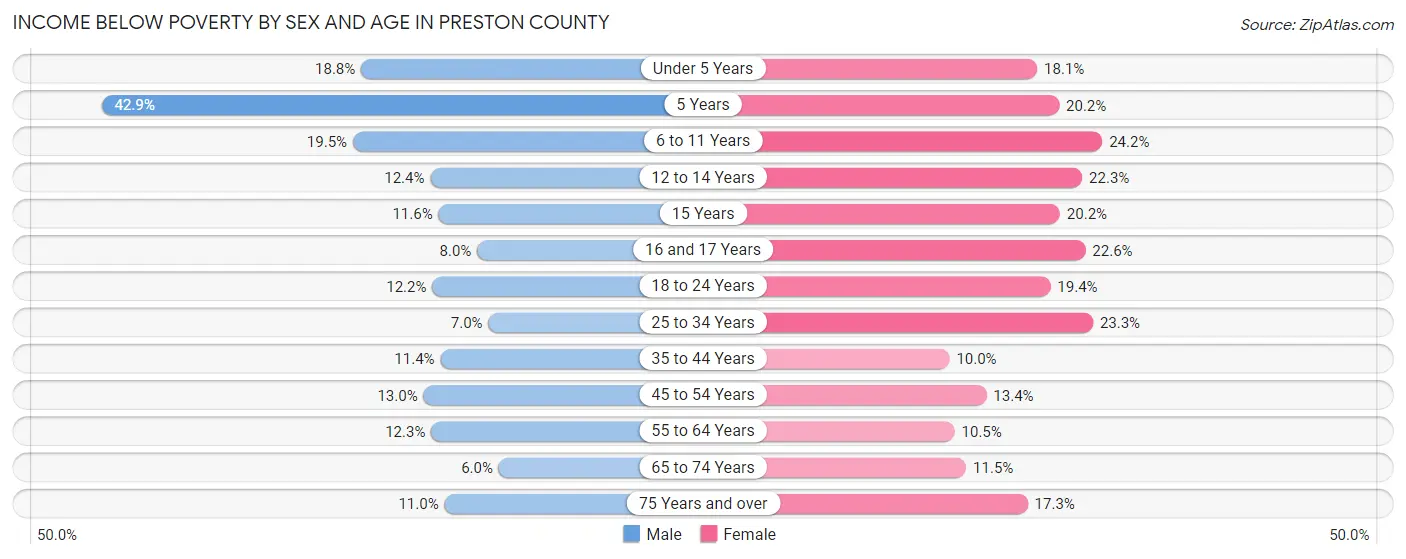
Income Below Poverty by Sex and Age in Preston County
With 11.7% poverty level for males and 15.9% for females among the residents of Preston County, 5 year old males and 6 to 11 year old females are the most vulnerable to poverty, with 48 males (42.9%) and 262 females (24.2%) in their respective age groups living below the poverty level.
| Age Bracket | Male | Female |
| Under 5 Years | 153 (18.8%) | 132 (18.1%) |
| 5 Years | 48 (42.9%) | 24 (20.2%) |
| 6 to 11 Years | 218 (19.5%) | 262 (24.2%) |
| 12 to 14 Years | 70 (12.3%) | 87 (22.3%) |
| 15 Years | 19 (11.6%) | 34 (20.2%) |
| 16 and 17 Years | 28 (8.0%) | 85 (22.6%) |
| 18 to 24 Years | 145 (12.2%) | 212 (19.4%) |
| 25 to 34 Years | 132 (7.0%) | 435 (23.3%) |
| 35 to 44 Years | 182 (11.4%) | 185 (10.0%) |
| 45 to 54 Years | 265 (13.0%) | 260 (13.4%) |
| 55 to 64 Years | 276 (12.3%) | 233 (10.5%) |
| 65 to 74 Years | 119 (6.0%) | 240 (11.5%) |
| 75 Years and over | 119 (11.0%) | 242 (17.2%) |
| Total | 1,774 (11.7%) | 2,431 (15.9%) |
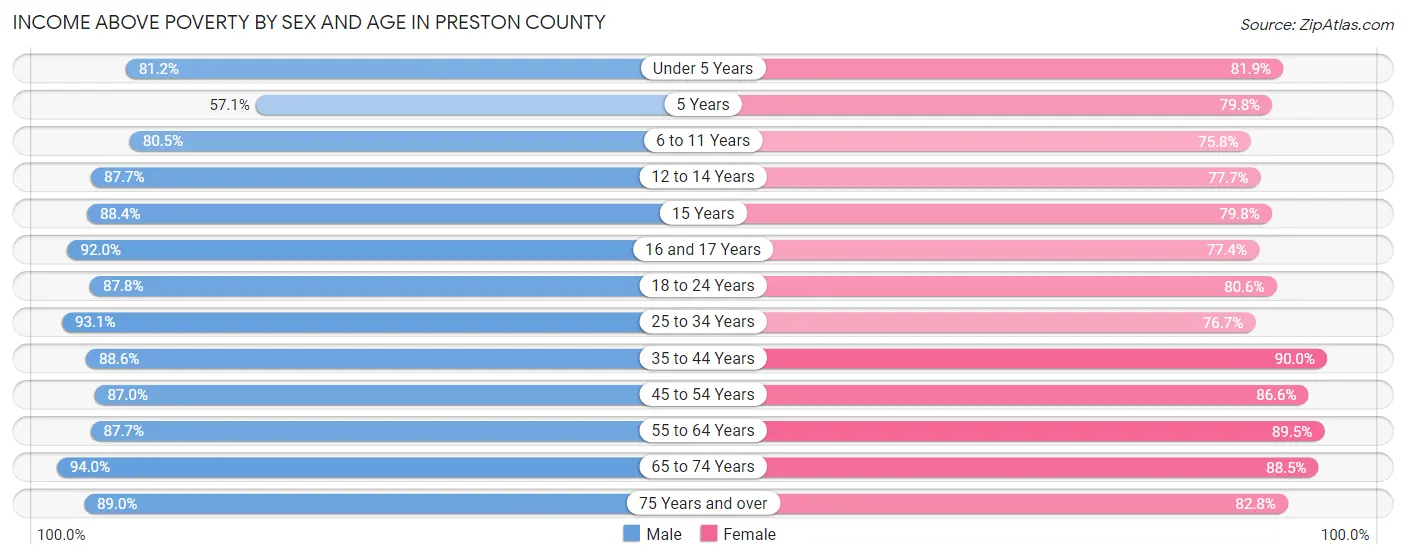
Income Above Poverty by Sex and Age in Preston County
According to the poverty statistics in Preston County, males aged 65 to 74 years and females aged 35 to 44 years are the age groups that are most secure financially, with 94.0% of males and 90.0% of females in these age groups living above the poverty line.
| Age Bracket | Male | Female |
| Under 5 Years | 662 (81.2%) | 596 (81.9%) |
| 5 Years | 64 (57.1%) | 95 (79.8%) |
| 6 to 11 Years | 898 (80.5%) | 822 (75.8%) |
| 12 to 14 Years | 497 (87.6%) | 303 (77.7%) |
| 15 Years | 145 (88.4%) | 134 (79.8%) |
| 16 and 17 Years | 322 (92.0%) | 291 (77.4%) |
| 18 to 24 Years | 1,047 (87.8%) | 883 (80.6%) |
| 25 to 34 Years | 1,766 (93.0%) | 1,431 (76.7%) |
| 35 to 44 Years | 1,413 (88.6%) | 1,667 (90.0%) |
| 45 to 54 Years | 1,776 (87.0%) | 1,677 (86.6%) |
| 55 to 64 Years | 1,976 (87.7%) | 1,993 (89.5%) |
| 65 to 74 Years | 1,867 (94.0%) | 1,839 (88.5%) |
| 75 Years and over | 960 (89.0%) | 1,161 (82.8%) |
| Total | 13,393 (88.3%) | 12,892 (84.1%) |
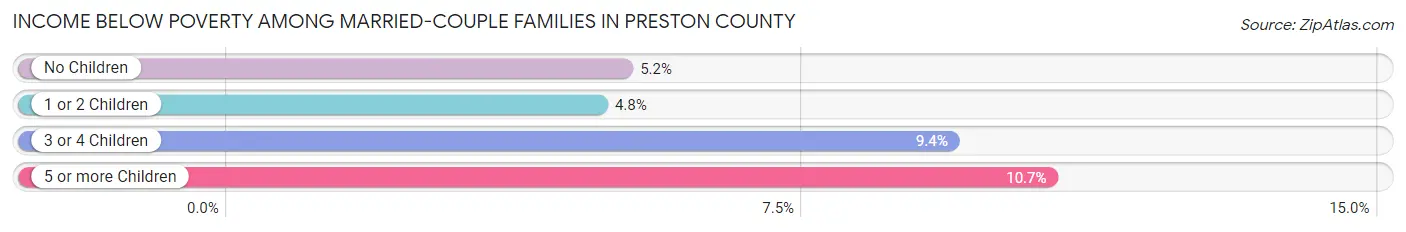
Income Below Poverty Among Married-Couple Families in Preston County
The poverty statistics for married-couple families in Preston County show that 5.3% or 379 of the total 7,078 families live below the poverty line. Families with 5 or more children have the highest poverty rate of 10.7%, comprising of 3 families. On the other hand, families with 1 or 2 children have the lowest poverty rate of 4.8%, which includes 100 families.
| Children | Above Poverty | Below Poverty |
| No Children | 4,299 (94.8%) | 234 (5.2%) |
| 1 or 2 Children | 1,971 (95.2%) | 100 (4.8%) |
| 3 or 4 Children | 404 (90.6%) | 42 (9.4%) |
| 5 or more Children | 25 (89.3%) | 3 (10.7%) |
| Total | 6,699 (94.7%) | 379 (5.3%) |
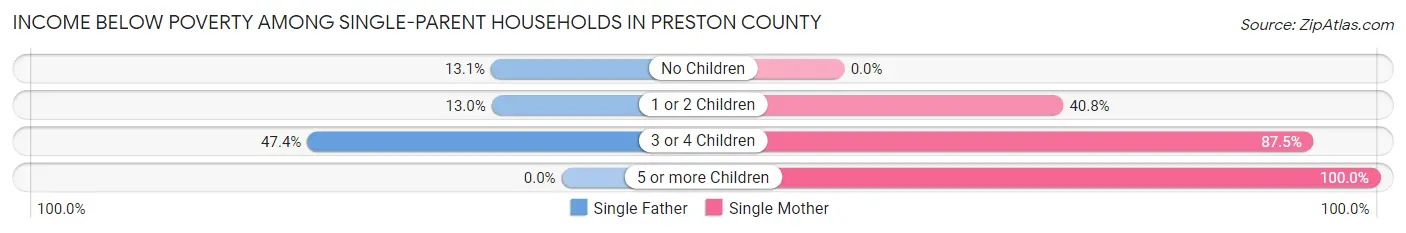
Income Below Poverty Among Single-Parent Households in Preston County
According to the poverty data in Preston County, 15.6% or 81 single-father households and 29.4% or 337 single-mother households are living below the poverty line. Among single-father households, those with 3 or 4 children have the highest poverty rate, with 18 households (47.4%) experiencing poverty. Likewise, among single-mother households, those with 5 or more children have the highest poverty rate, with 23 households (100.0%) falling below the poverty line.
| Children | Single Father | Single Mother |
| No Children | 41 (13.1%) | 0 (0.0%) |
| 1 or 2 Children | 22 (13.0%) | 174 (40.7%) |
| 3 or 4 Children | 18 (47.4%) | 140 (87.5%) |
| 5 or more Children | 0 (0.0%) | 23 (100.0%) |
| Total | 81 (15.6%) | 337 (29.4%) |
Income Below Poverty Among Married-Couple vs Single-Parent Households in Preston County
The poverty data for Preston County shows that 379 of the married-couple family households (5.3%) and 418 of the single-parent households (25.1%) are living below the poverty level. Within the married-couple family households, those with 5 or more children have the highest poverty rate, with 3 households (10.7%) falling below the poverty line. Among the single-parent households, those with 5 or more children have the highest poverty rate, with 23 household (100.0%) living below poverty.
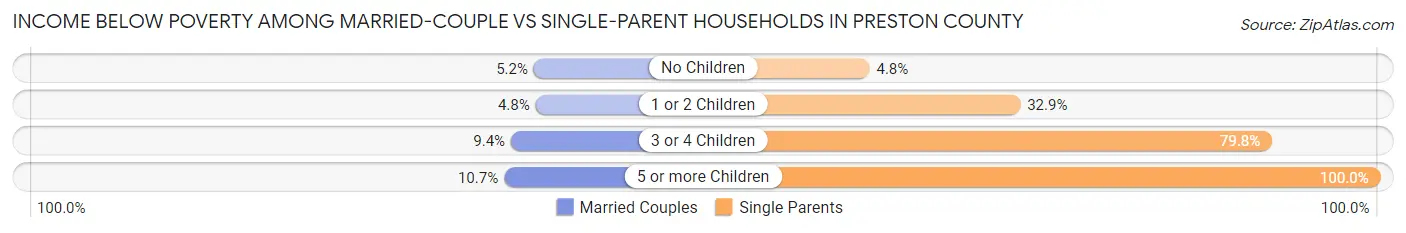
| Children | Married-Couple Families | Single-Parent Households |
| No Children | 234 (5.2%) | 41 (4.8%) |
| 1 or 2 Children | 100 (4.8%) | 196 (32.9%) |
| 3 or 4 Children | 42 (9.4%) | 158 (79.8%) |
| 5 or more Children | 3 (10.7%) | 23 (100.0%) |
| Total | 379 (5.3%) | 418 (25.1%) |
Employment Characteristics in Preston County
Employment by Class of Employer in Preston County
Among the 13,272 employed individuals in Preston County, private company employees (8,840 | 66.6%), local government employees (1,099 | 8.3%), and state government employees (896 | 6.8%) make up the most common classes of employment.
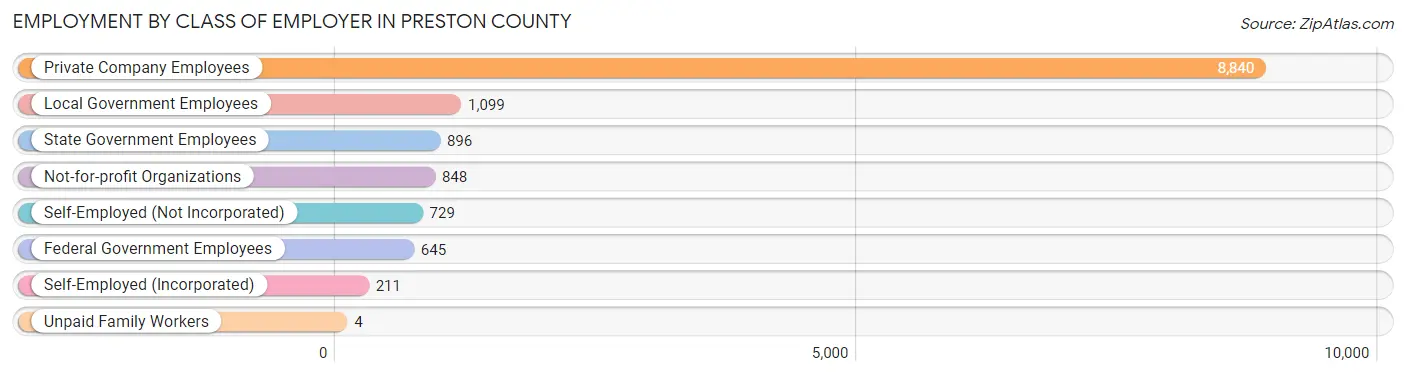
| Employer Class | # Employees | % Employees |
| Private Company Employees | 8,840 | 66.6% |
| Self-Employed (Incorporated) | 211 | 1.6% |
| Self-Employed (Not Incorporated) | 729 | 5.5% |
| Not-for-profit Organizations | 848 | 6.4% |
| Local Government Employees | 1,099 | 8.3% |
| State Government Employees | 896 | 6.8% |
| Federal Government Employees | 645 | 4.9% |
| Unpaid Family Workers | 4 | 0.0% |
| Total | 13,272 | 100.0% |
Employment Status by Age in Preston County
According to the labor force statistics for Preston County, out of the total population over 16 years of age (28,700), 50.3% or 14,436 individuals are in the labor force, with 7.2% or 1,039 of them unemployed. The age group with the highest labor force participation rate is 20 to 24 years, with 81.4% or 1,508 individuals in the labor force. Within the labor force, the 16 to 19 years age range has the highest percentage of unemployed individuals, with 16.2% or 78 of them being unemployed.
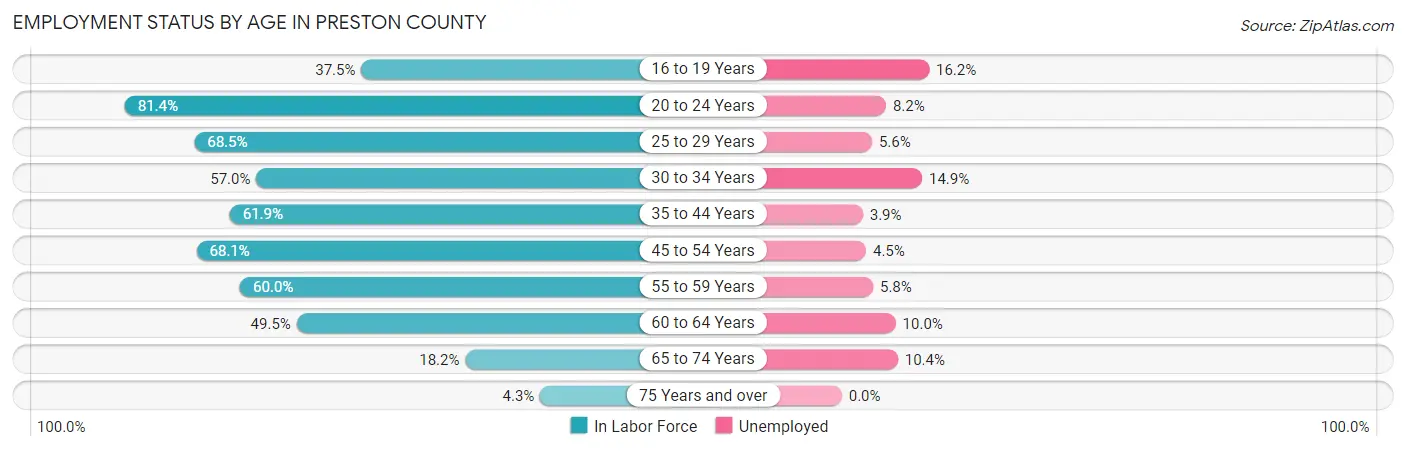
| Age Bracket | In Labor Force | Unemployed |
| 16 to 19 Years | 481 (37.5%) | 78 (16.2%) |
| 20 to 24 Years | 1,508 (81.4%) | 124 (8.2%) |
| 25 to 29 Years | 1,734 (68.5%) | 97 (5.6%) |
| 30 to 34 Years | 1,361 (57.0%) | 203 (14.9%) |
| 35 to 44 Years | 2,860 (61.9%) | 112 (3.9%) |
| 45 to 54 Years | 3,078 (68.1%) | 139 (4.5%) |
| 55 to 59 Years | 1,237 (60.0%) | 72 (5.8%) |
| 60 to 64 Years | 1,307 (49.5%) | 131 (10.0%) |
| 65 to 74 Years | 760 (18.2%) | 79 (10.4%) |
| 75 Years and over | 113 (4.3%) | 0 (0.0%) |
| Total | 14,436 (50.3%) | 1,039 (7.2%) |
Employment Status by Educational Attainment in Preston County
According to labor force statistics for Preston County, 61.7% of individuals (11,577) out of the total population between 25 and 64 years of age (18,763) are in the labor force, with 6.5% or 753 of them being unemployed. The group with the highest labor force participation rate are those with the educational attainment of bachelor's degree or higher, with 82.0% or 2,724 individuals in the labor force. Within the labor force, individuals with less than high school education have the highest percentage of unemployment, with 13.0% or 99 of them being unemployed.
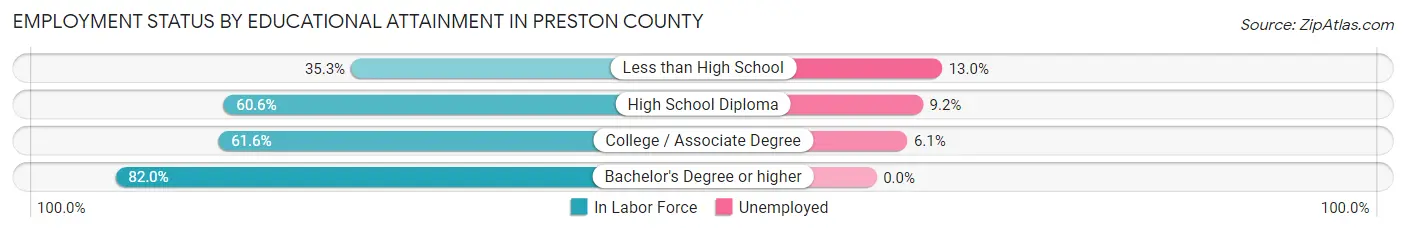
| Educational Attainment | In Labor Force | Unemployed |
| Less than High School | 762 (35.3%) | 281 (13.0%) |
| High School Diploma | 5,221 (60.6%) | 793 (9.2%) |
| College / Associate Degree | 2,875 (61.6%) | 285 (6.1%) |
| Bachelor's Degree or higher | 2,724 (82.0%) | 0 (0.0%) |
| Total | 11,577 (61.7%) | 1,220 (6.5%) |
Employment Occupations by Sex in Preston County
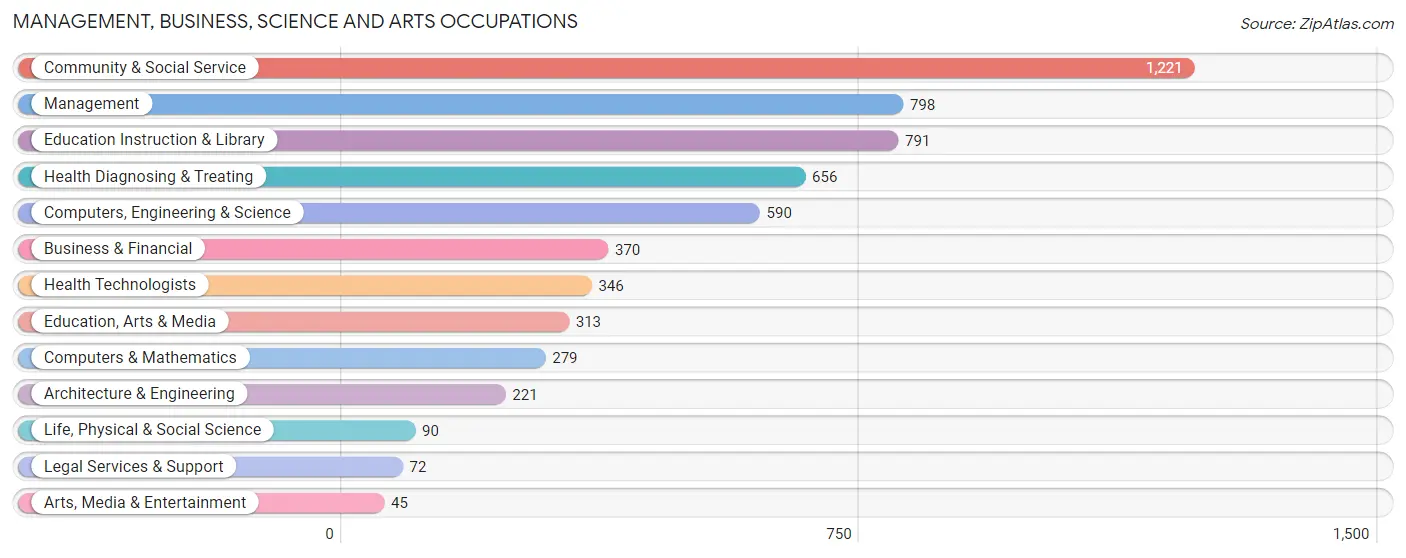
Management, Business, Science and Arts Occupations
The most common Management, Business, Science and Arts occupations in Preston County are Community & Social Service (1,221 | 9.1%), Management (798 | 5.9%), Education Instruction & Library (791 | 5.9%), Health Diagnosing & Treating (656 | 4.9%), and Computers, Engineering & Science (590 | 4.4%).
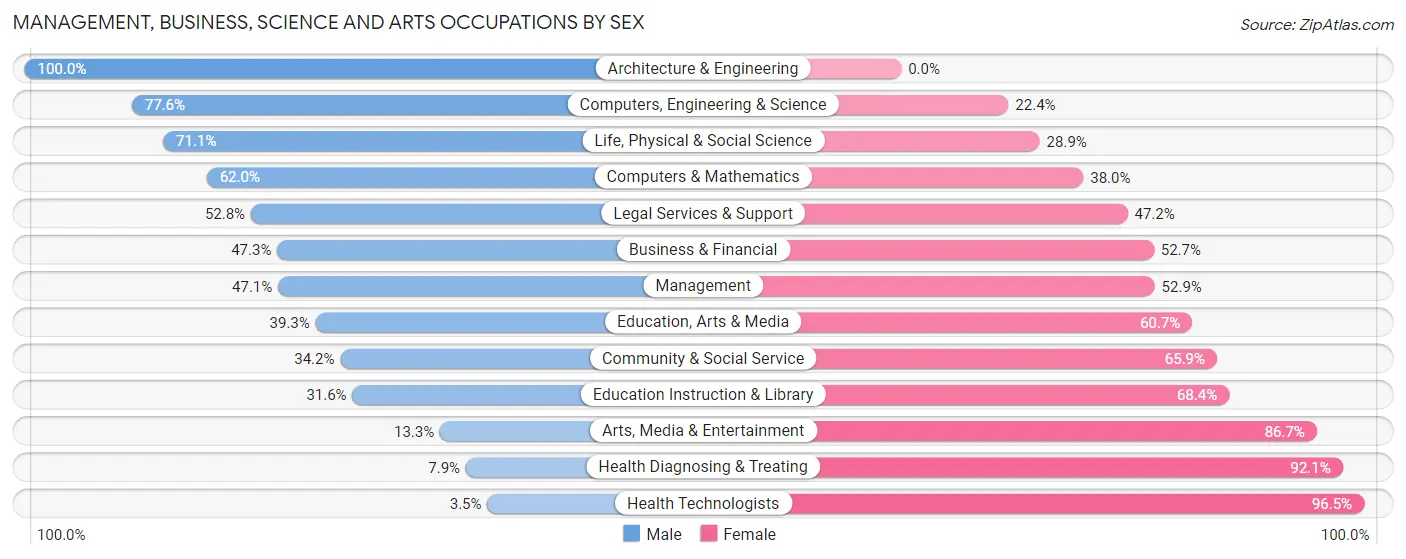
Management, Business, Science and Arts Occupations by Sex
Within the Management, Business, Science and Arts occupations in Preston County, the most male-oriented occupations are Architecture & Engineering (100.0%), Computers, Engineering & Science (77.6%), and Life, Physical & Social Science (71.1%), while the most female-oriented occupations are Health Technologists (96.5%), Health Diagnosing & Treating (92.1%), and Arts, Media & Entertainment (86.7%).
| Occupation | Male | Female |
| Management | 376 (47.1%) | 422 (52.9%) |
| Business & Financial | 175 (47.3%) | 195 (52.7%) |
| Computers, Engineering & Science | 458 (77.6%) | 132 (22.4%) |
| Computers & Mathematics | 173 (62.0%) | 106 (38.0%) |
| Architecture & Engineering | 221 (100.0%) | 0 (0.0%) |
| Life, Physical & Social Science | 64 (71.1%) | 26 (28.9%) |
| Community & Social Service | 417 (34.2%) | 804 (65.8%) |
| Education, Arts & Media | 123 (39.3%) | 190 (60.7%) |
| Legal Services & Support | 38 (52.8%) | 34 (47.2%) |
| Education Instruction & Library | 250 (31.6%) | 541 (68.4%) |
| Arts, Media & Entertainment | 6 (13.3%) | 39 (86.7%) |
| Health Diagnosing & Treating | 52 (7.9%) | 604 (92.1%) |
| Health Technologists | 12 (3.5%) | 334 (96.5%) |
| Total (Category) | 1,478 (40.7%) | 2,157 (59.3%) |
| Total (Overall) | 7,126 (53.1%) | 6,282 (46.9%) |
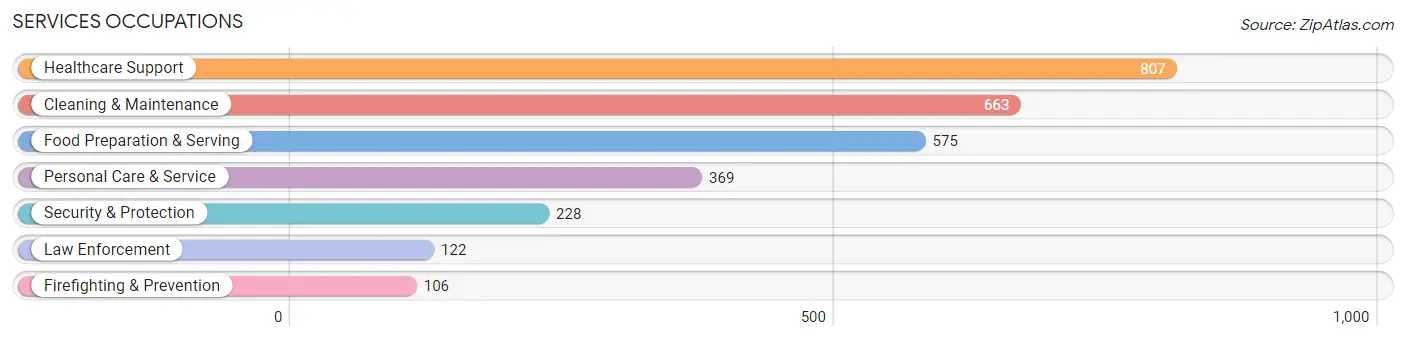
Services Occupations
The most common Services occupations in Preston County are Healthcare Support (807 | 6.0%), Cleaning & Maintenance (663 | 4.9%), Food Preparation & Serving (575 | 4.3%), Personal Care & Service (369 | 2.8%), and Security & Protection (228 | 1.7%).
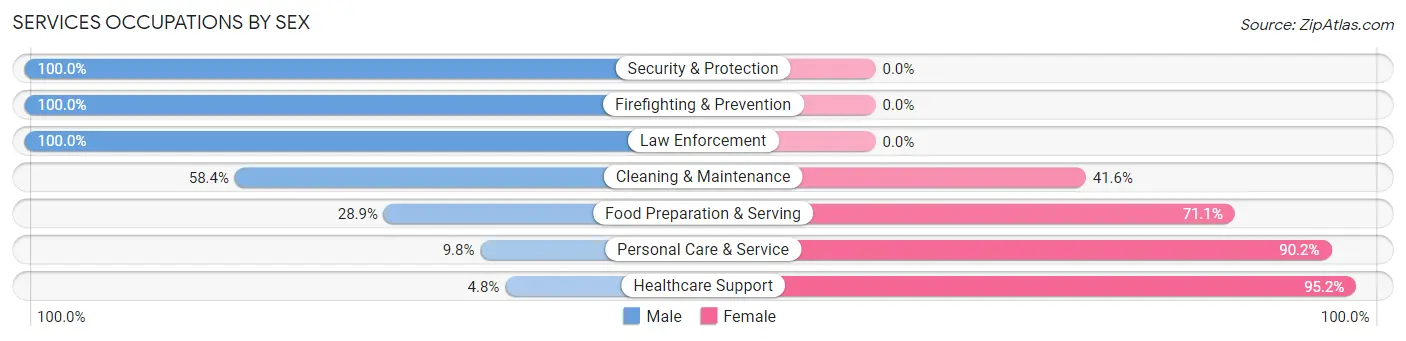
Services Occupations by Sex
Within the Services occupations in Preston County, the most male-oriented occupations are Security & Protection (100.0%), Firefighting & Prevention (100.0%), and Law Enforcement (100.0%), while the most female-oriented occupations are Healthcare Support (95.2%), Personal Care & Service (90.2%), and Food Preparation & Serving (71.1%).
| Occupation | Male | Female |
| Healthcare Support | 39 (4.8%) | 768 (95.2%) |
| Security & Protection | 228 (100.0%) | 0 (0.0%) |
| Firefighting & Prevention | 106 (100.0%) | 0 (0.0%) |
| Law Enforcement | 122 (100.0%) | 0 (0.0%) |
| Food Preparation & Serving | 166 (28.9%) | 409 (71.1%) |
| Cleaning & Maintenance | 387 (58.4%) | 276 (41.6%) |
| Personal Care & Service | 36 (9.8%) | 333 (90.2%) |
| Total (Category) | 856 (32.4%) | 1,786 (67.6%) |
| Total (Overall) | 7,126 (53.1%) | 6,282 (46.9%) |
Sales and Office Occupations
The most common Sales and Office occupations in Preston County are Office & Administration (1,565 | 11.7%), and Sales & Related (1,159 | 8.6%).
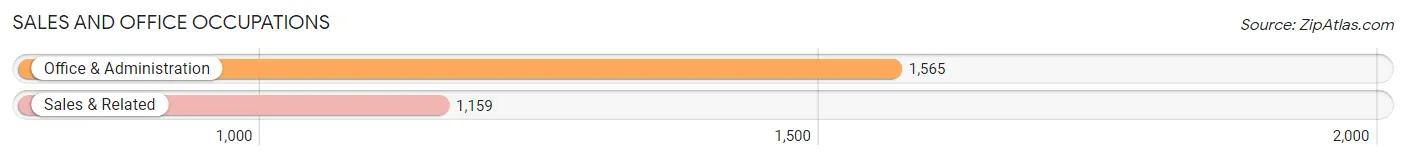
Sales and Office Occupations by Sex
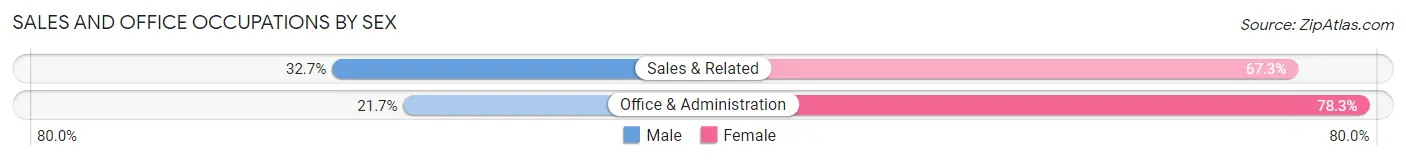
| Occupation | Male | Female |
| Sales & Related | 379 (32.7%) | 780 (67.3%) |
| Office & Administration | 340 (21.7%) | 1,225 (78.3%) |
| Total (Category) | 719 (26.4%) | 2,005 (73.6%) |
| Total (Overall) | 7,126 (53.1%) | 6,282 (46.9%) |
Natural Resources, Construction and Maintenance Occupations
The most common Natural Resources, Construction and Maintenance occupations in Preston County are Construction & Extraction (1,268 | 9.5%), Installation, Maintenance & Repair (674 | 5.0%), and Farming, Fishing & Forestry (167 | 1.3%).
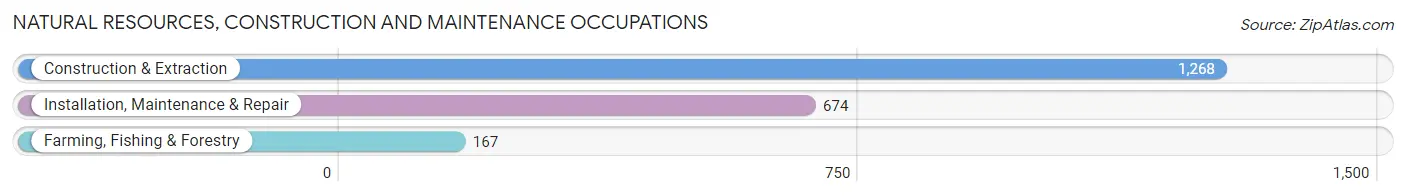
Natural Resources, Construction and Maintenance Occupations by Sex
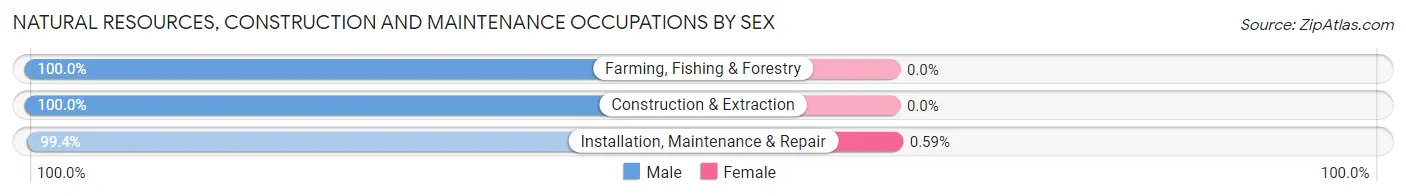
| Occupation | Male | Female |
| Farming, Fishing & Forestry | 167 (100.0%) | 0 (0.0%) |
| Construction & Extraction | 1,268 (100.0%) | 0 (0.0%) |
| Installation, Maintenance & Repair | 670 (99.4%) | 4 (0.6%) |
| Total (Category) | 2,105 (99.8%) | 4 (0.2%) |
| Total (Overall) | 7,126 (53.1%) | 6,282 (46.9%) |
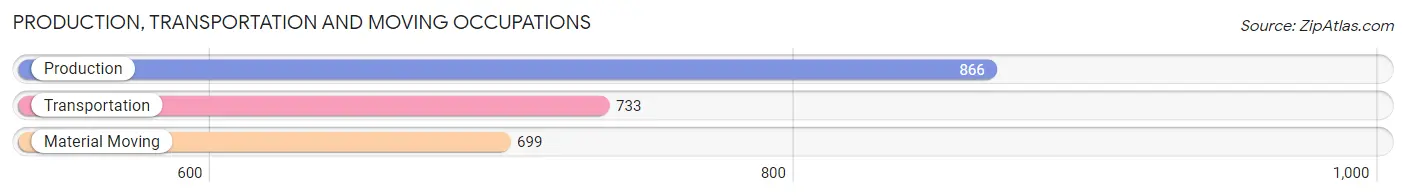
Production, Transportation and Moving Occupations
The most common Production, Transportation and Moving occupations in Preston County are Production (866 | 6.5%), Transportation (733 | 5.5%), and Material Moving (699 | 5.2%).
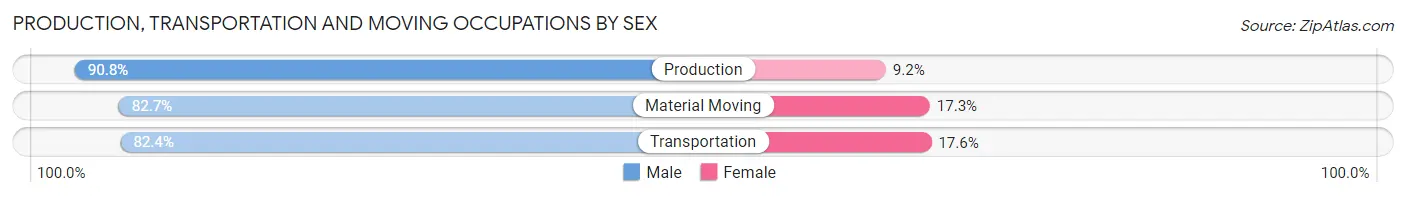
Production, Transportation and Moving Occupations by Sex
| Occupation | Male | Female |
| Production | 786 (90.8%) | 80 (9.2%) |
| Transportation | 604 (82.4%) | 129 (17.6%) |
| Material Moving | 578 (82.7%) | 121 (17.3%) |
| Total (Category) | 1,968 (85.6%) | 330 (14.4%) |
| Total (Overall) | 7,126 (53.1%) | 6,282 (46.9%) |
Employment Industries by Sex in Preston County
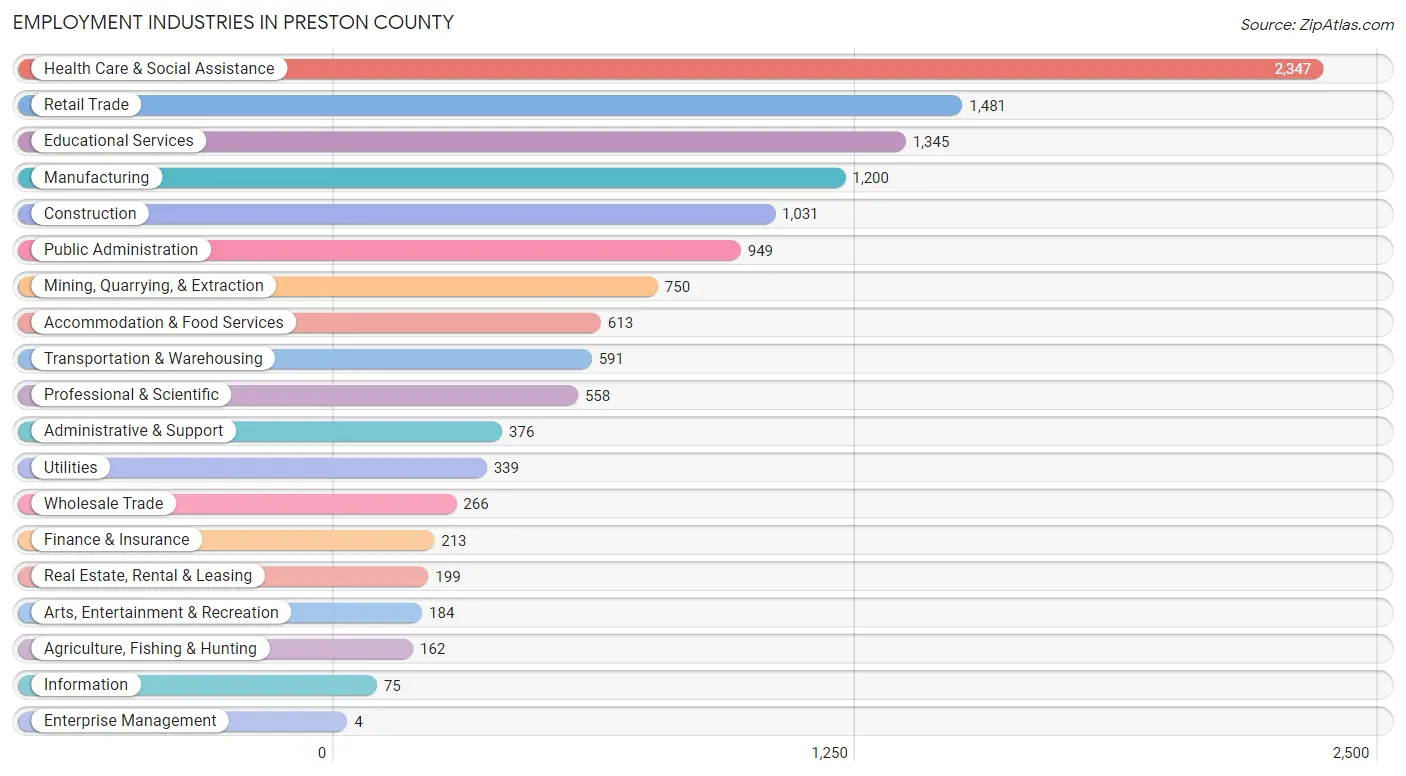
Employment Industries in Preston County
The major employment industries in Preston County include Health Care & Social Assistance (2,347 | 17.5%), Retail Trade (1,481 | 11.1%), Educational Services (1,345 | 10.0%), Manufacturing (1,200 | 8.9%), and Construction (1,031 | 7.7%).
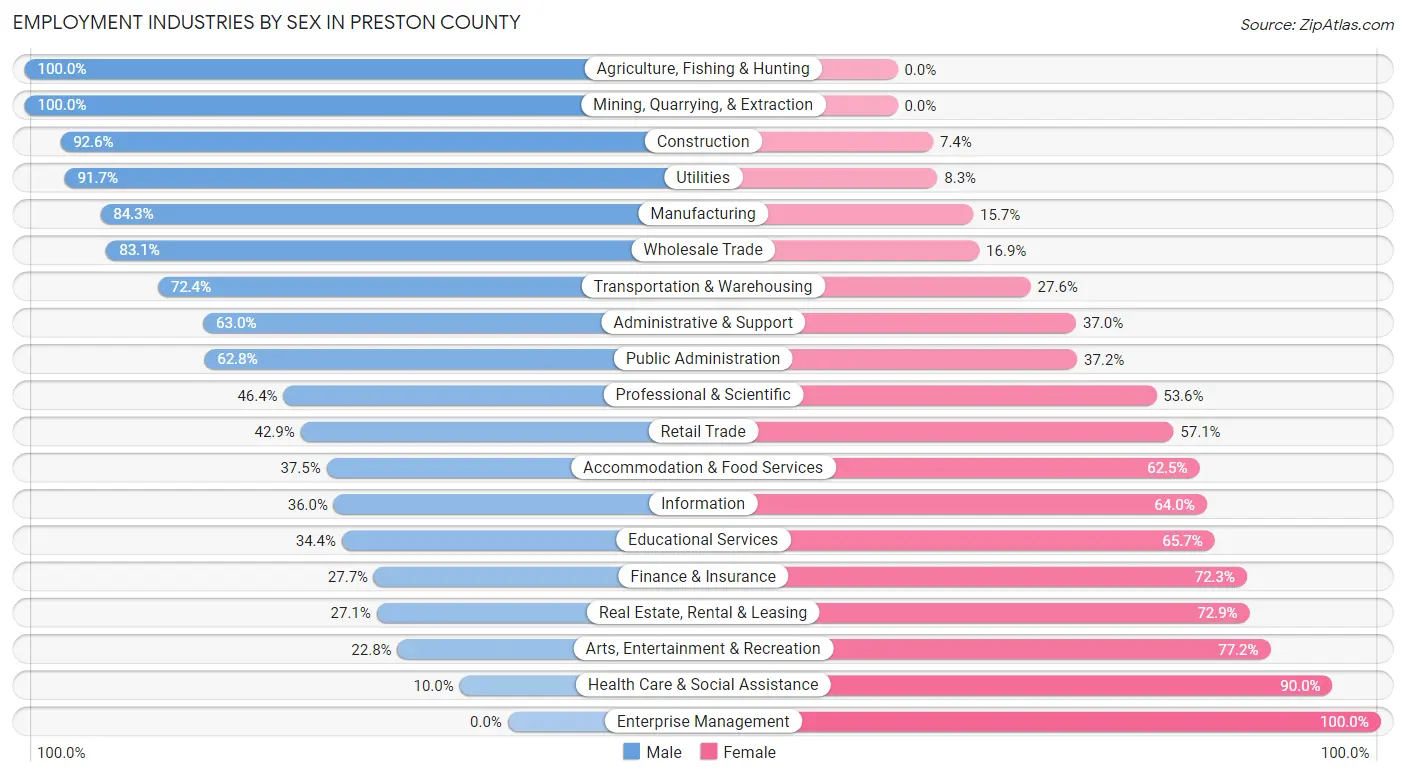
Employment Industries by Sex in Preston County
The Preston County industries that see more men than women are Agriculture, Fishing & Hunting (100.0%), Mining, Quarrying, & Extraction (100.0%), and Construction (92.6%), whereas the industries that tend to have a higher number of women are Enterprise Management (100.0%), Health Care & Social Assistance (90.0%), and Arts, Entertainment & Recreation (77.2%).
| Industry | Male | Female |
| Agriculture, Fishing & Hunting | 162 (100.0%) | 0 (0.0%) |
| Mining, Quarrying, & Extraction | 750 (100.0%) | 0 (0.0%) |
| Construction | 955 (92.6%) | 76 (7.4%) |
| Manufacturing | 1,012 (84.3%) | 188 (15.7%) |
| Wholesale Trade | 221 (83.1%) | 45 (16.9%) |
| Retail Trade | 635 (42.9%) | 846 (57.1%) |
| Transportation & Warehousing | 428 (72.4%) | 163 (27.6%) |
| Utilities | 311 (91.7%) | 28 (8.3%) |
| Information | 27 (36.0%) | 48 (64.0%) |
| Finance & Insurance | 59 (27.7%) | 154 (72.3%) |
| Real Estate, Rental & Leasing | 54 (27.1%) | 145 (72.9%) |
| Professional & Scientific | 259 (46.4%) | 299 (53.6%) |
| Enterprise Management | 0 (0.0%) | 4 (100.0%) |
| Administrative & Support | 237 (63.0%) | 139 (37.0%) |
| Educational Services | 462 (34.4%) | 883 (65.6%) |
| Health Care & Social Assistance | 234 (10.0%) | 2,113 (90.0%) |
| Arts, Entertainment & Recreation | 42 (22.8%) | 142 (77.2%) |
| Accommodation & Food Services | 230 (37.5%) | 383 (62.5%) |
| Public Administration | 596 (62.8%) | 353 (37.2%) |
| Total | 7,126 (53.1%) | 6,282 (46.9%) |
Education in Preston County
School Enrollment in Preston County
The most common levels of schooling among the 5,831 students in Preston County are elementary school (1,592 | 27.3%), high school (1,441 | 24.7%), and middle school (1,266 | 21.7%).
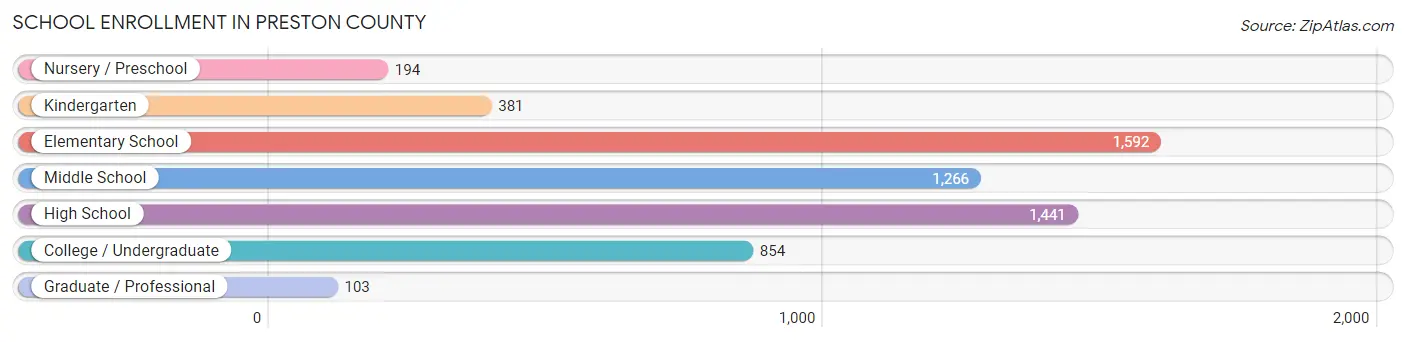
| School Level | # Students | % Students |
| Nursery / Preschool | 194 | 3.3% |
| Kindergarten | 381 | 6.5% |
| Elementary School | 1,592 | 27.3% |
| Middle School | 1,266 | 21.7% |
| High School | 1,441 | 24.7% |
| College / Undergraduate | 854 | 14.6% |
| Graduate / Professional | 103 | 1.8% |
| Total | 5,831 | 100.0% |
School Enrollment by Age by Funding Source in Preston County
Out of a total of 5,831 students who are enrolled in schools in Preston County, 362 (6.2%) attend a private institution, while the remaining 5,469 (93.8%) are enrolled in public schools. The age group of 3 to 4 year olds has the highest likelihood of being enrolled in private schools, with 20 (26.7% in the age bracket) enrolled. Conversely, the age group of 15 to 17 year olds has the lowest likelihood of being enrolled in a private school, with 1,040 (98.8% in the age bracket) attending a public institution.
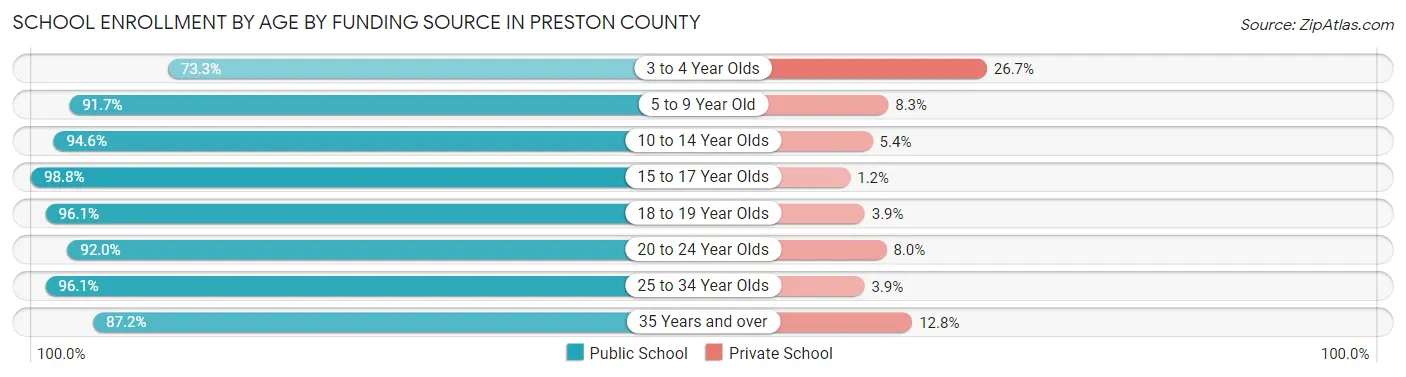
| Age Bracket | Public School | Private School |
| 3 to 4 Year Olds | 55 (73.3%) | 20 (26.7%) |
| 5 to 9 Year Old | 1,711 (91.7%) | 155 (8.3%) |
| 10 to 14 Year Olds | 1,558 (94.6%) | 89 (5.4%) |
| 15 to 17 Year Olds | 1,040 (98.8%) | 13 (1.2%) |
| 18 to 19 Year Olds | 293 (96.1%) | 12 (3.9%) |
| 20 to 24 Year Olds | 254 (92.0%) | 22 (8.0%) |
| 25 to 34 Year Olds | 322 (96.1%) | 13 (3.9%) |
| 35 Years and over | 239 (87.2%) | 35 (12.8%) |
| Total | 5,469 (93.8%) | 362 (6.2%) |
Educational Attainment by Field of Study in Preston County
Education (1,039 | 22.0%), business (757 | 16.0%), science & technology (574 | 12.1%), bio, nature & agricultural (547 | 11.6%), and arts & humanities (388 | 8.2%) are the most common fields of study among 4,729 individuals in Preston County who have obtained a bachelor's degree or higher.
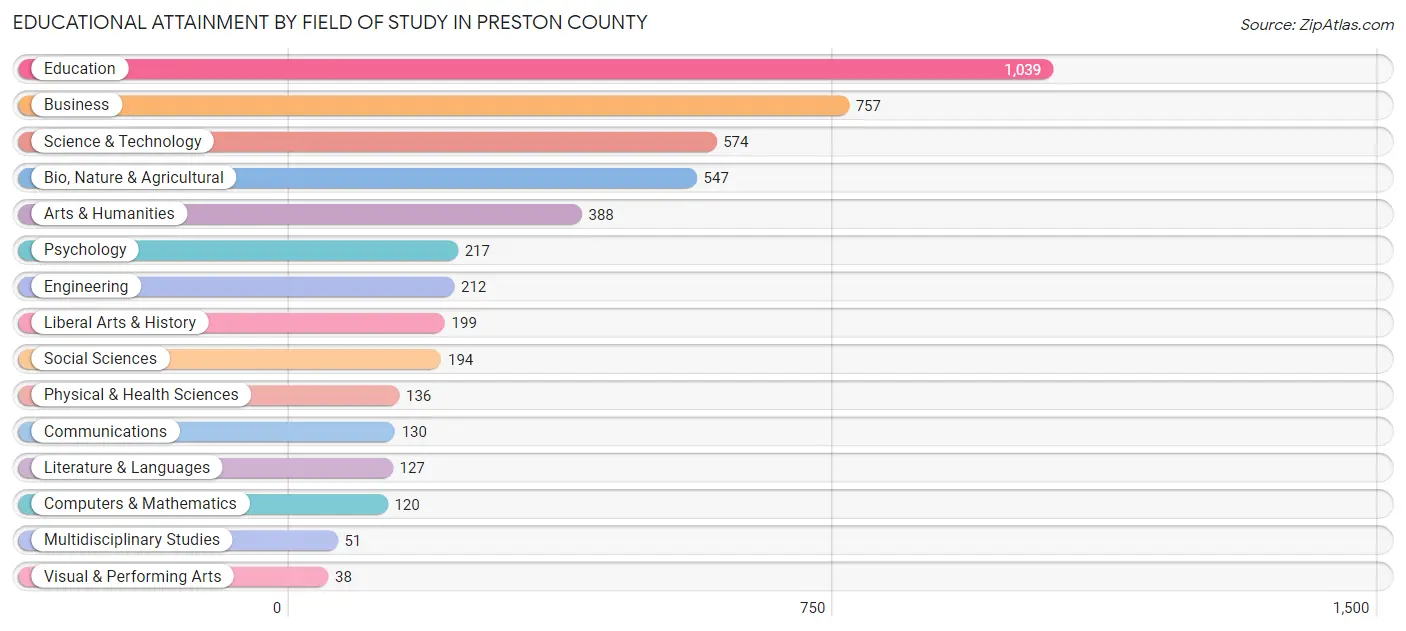
| Field of Study | # Graduates | % Graduates |
| Computers & Mathematics | 120 | 2.5% |
| Bio, Nature & Agricultural | 547 | 11.6% |
| Physical & Health Sciences | 136 | 2.9% |
| Psychology | 217 | 4.6% |
| Social Sciences | 194 | 4.1% |
| Engineering | 212 | 4.5% |
| Multidisciplinary Studies | 51 | 1.1% |
| Science & Technology | 574 | 12.1% |
| Business | 757 | 16.0% |
| Education | 1,039 | 22.0% |
| Literature & Languages | 127 | 2.7% |
| Liberal Arts & History | 199 | 4.2% |
| Visual & Performing Arts | 38 | 0.8% |
| Communications | 130 | 2.8% |
| Arts & Humanities | 388 | 8.2% |
| Total | 4,729 | 100.0% |
Transportation & Commute in Preston County
Vehicle Availability by Sex in Preston County
The most prevalent vehicle ownership categories in Preston County are males with 2 vehicles (3,099, accounting for 43.8%) and females with 2 vehicles (2,799, making up 50.0%).
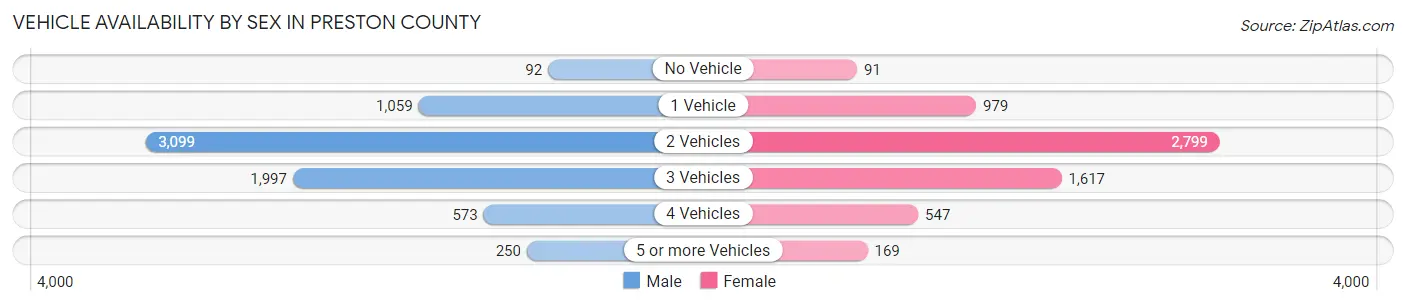
| Vehicles Available | Male | Female |
| No Vehicle | 92 (1.3%) | 91 (1.5%) |
| 1 Vehicle | 1,059 (15.0%) | 979 (15.8%) |
| 2 Vehicles | 3,099 (43.8%) | 2,799 (45.1%) |
| 3 Vehicles | 1,997 (28.2%) | 1,617 (26.1%) |
| 4 Vehicles | 573 (8.1%) | 547 (8.8%) |
| 5 or more Vehicles | 250 (3.5%) | 169 (2.7%) |
| Total | 7,070 (100.0%) | 6,202 (100.0%) |
Commute Time in Preston County
The most frequently occuring commute durations in Preston County are 30 to 34 minutes (1,791 commuters, 14.4%), 20 to 24 minutes (1,449 commuters, 11.6%), and 60 to 89 minutes (1,422 commuters, 11.4%).
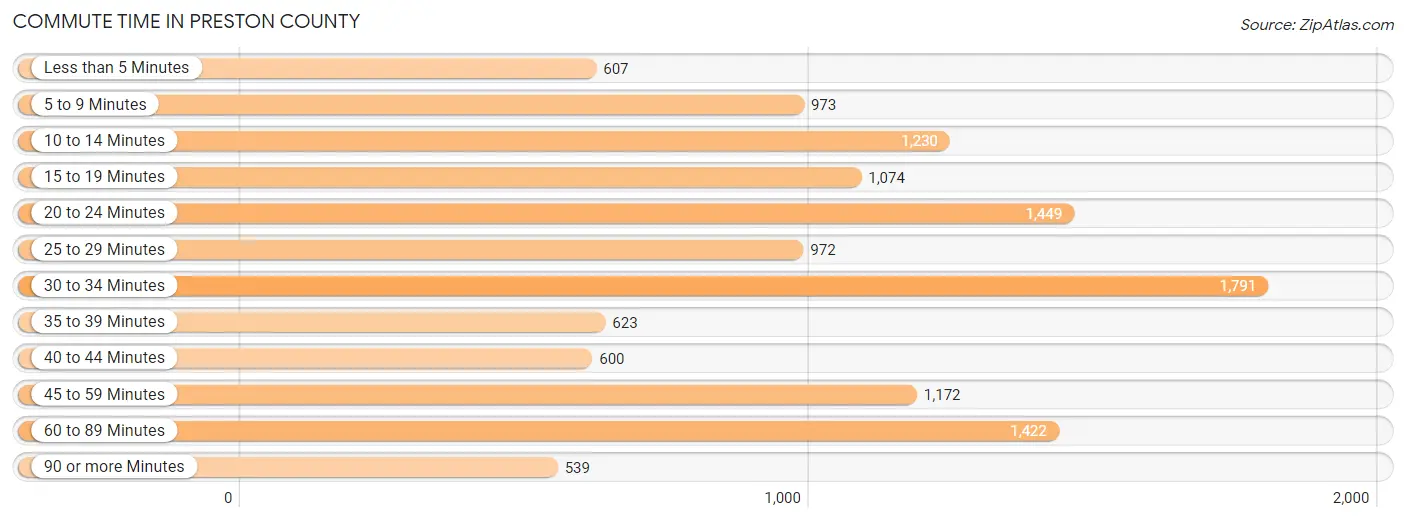
| Commute Time | # Commuters | % Commuters |
| Less than 5 Minutes | 607 | 4.9% |
| 5 to 9 Minutes | 973 | 7.8% |
| 10 to 14 Minutes | 1,230 | 9.9% |
| 15 to 19 Minutes | 1,074 | 8.6% |
| 20 to 24 Minutes | 1,449 | 11.6% |
| 25 to 29 Minutes | 972 | 7.8% |
| 30 to 34 Minutes | 1,791 | 14.4% |
| 35 to 39 Minutes | 623 | 5.0% |
| 40 to 44 Minutes | 600 | 4.8% |
| 45 to 59 Minutes | 1,172 | 9.4% |
| 60 to 89 Minutes | 1,422 | 11.4% |
| 90 or more Minutes | 539 | 4.3% |
Commute Time by Sex in Preston County
The most common commute times in Preston County are 60 to 89 minutes (943 commuters, 13.8%) for males and 30 to 34 minutes (954 commuters, 16.9%) for females.
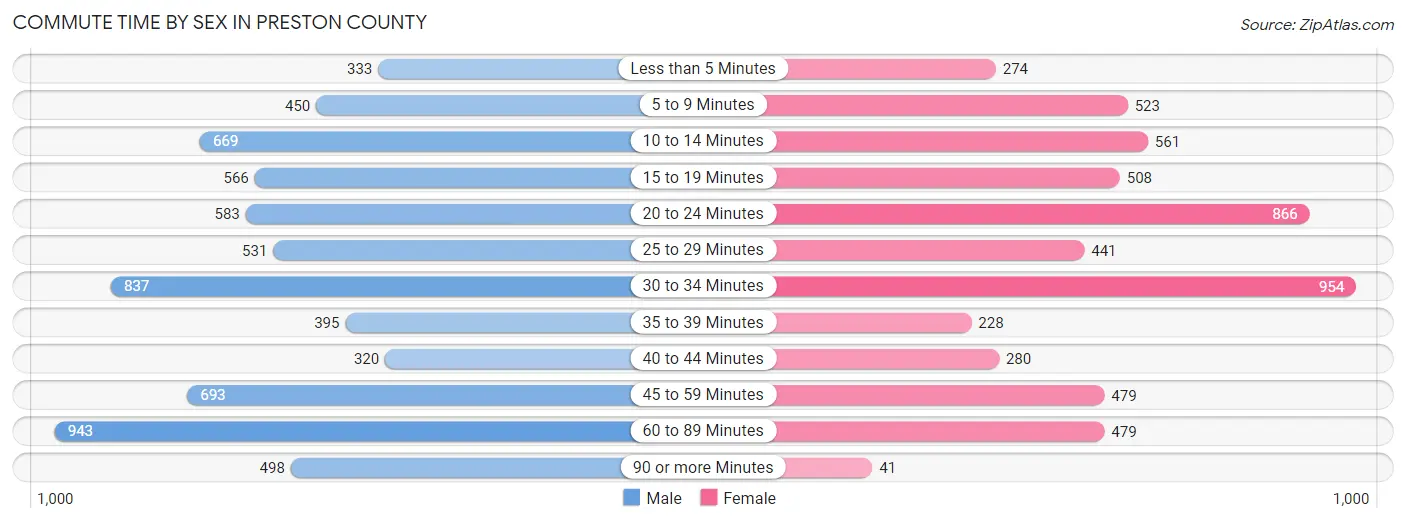
| Commute Time | Male | Female |
| Less than 5 Minutes | 333 (4.9%) | 274 (4.9%) |
| 5 to 9 Minutes | 450 (6.6%) | 523 (9.3%) |
| 10 to 14 Minutes | 669 (9.8%) | 561 (10.0%) |
| 15 to 19 Minutes | 566 (8.3%) | 508 (9.0%) |
| 20 to 24 Minutes | 583 (8.6%) | 866 (15.4%) |
| 25 to 29 Minutes | 531 (7.8%) | 441 (7.8%) |
| 30 to 34 Minutes | 837 (12.3%) | 954 (16.9%) |
| 35 to 39 Minutes | 395 (5.8%) | 228 (4.1%) |
| 40 to 44 Minutes | 320 (4.7%) | 280 (5.0%) |
| 45 to 59 Minutes | 693 (10.2%) | 479 (8.5%) |
| 60 to 89 Minutes | 943 (13.8%) | 479 (8.5%) |
| 90 or more Minutes | 498 (7.3%) | 41 (0.7%) |
Time of Departure to Work by Sex in Preston County
The most frequent times of departure to work in Preston County are 5:30 AM to 5:59 AM (966, 14.2%) for males and 6:30 AM to 6:59 AM (806, 14.3%) for females.
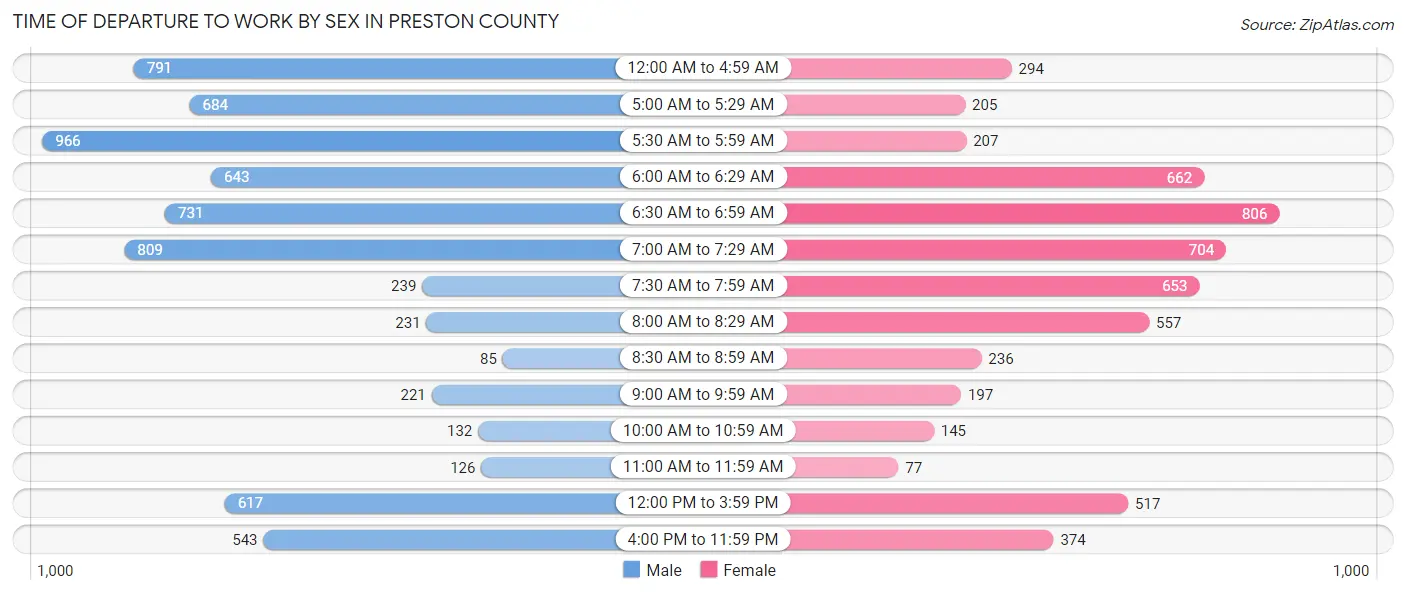
| Time of Departure | Male | Female |
| 12:00 AM to 4:59 AM | 791 (11.6%) | 294 (5.2%) |
| 5:00 AM to 5:29 AM | 684 (10.0%) | 205 (3.6%) |
| 5:30 AM to 5:59 AM | 966 (14.2%) | 207 (3.7%) |
| 6:00 AM to 6:29 AM | 643 (9.4%) | 662 (11.7%) |
| 6:30 AM to 6:59 AM | 731 (10.7%) | 806 (14.3%) |
| 7:00 AM to 7:29 AM | 809 (11.9%) | 704 (12.5%) |
| 7:30 AM to 7:59 AM | 239 (3.5%) | 653 (11.6%) |
| 8:00 AM to 8:29 AM | 231 (3.4%) | 557 (9.9%) |
| 8:30 AM to 8:59 AM | 85 (1.3%) | 236 (4.2%) |
| 9:00 AM to 9:59 AM | 221 (3.2%) | 197 (3.5%) |
| 10:00 AM to 10:59 AM | 132 (1.9%) | 145 (2.6%) |
| 11:00 AM to 11:59 AM | 126 (1.8%) | 77 (1.4%) |
| 12:00 PM to 3:59 PM | 617 (9.0%) | 517 (9.2%) |
| 4:00 PM to 11:59 PM | 543 (8.0%) | 374 (6.6%) |
| Total | 6,818 (100.0%) | 5,634 (100.0%) |
Housing Occupancy in Preston County
Occupancy by Ownership in Preston County
Of the total 12,623 dwellings in Preston County, owner-occupied units account for 10,190 (80.7%), while renter-occupied units make up 2,433 (19.3%).
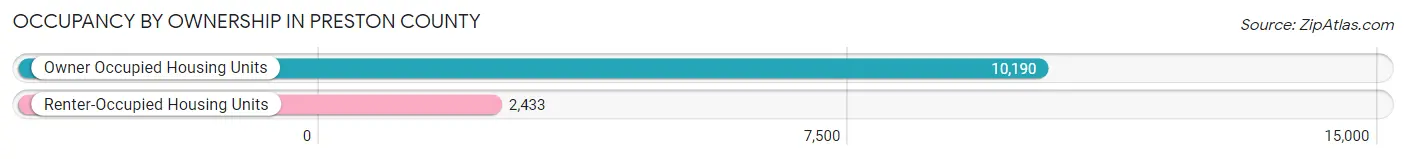
| Occupancy | # Housing Units | % Housing Units |
| Owner Occupied Housing Units | 10,190 | 80.7% |
| Renter-Occupied Housing Units | 2,433 | 19.3% |
| Total Occupied Housing Units | 12,623 | 100.0% |
Occupancy by Household Size in Preston County
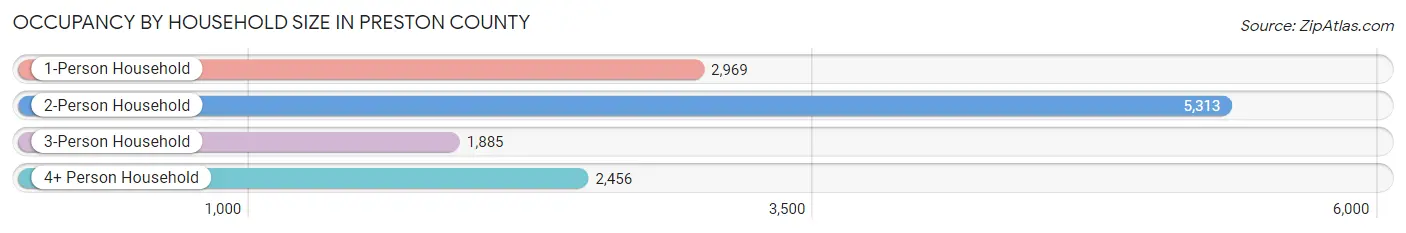
| Household Size | # Housing Units | % Housing Units |
| 1-Person Household | 2,969 | 23.5% |
| 2-Person Household | 5,313 | 42.1% |
| 3-Person Household | 1,885 | 14.9% |
| 4+ Person Household | 2,456 | 19.5% |
| Total Housing Units | 12,623 | 100.0% |
Occupancy by Ownership by Household Size in Preston County
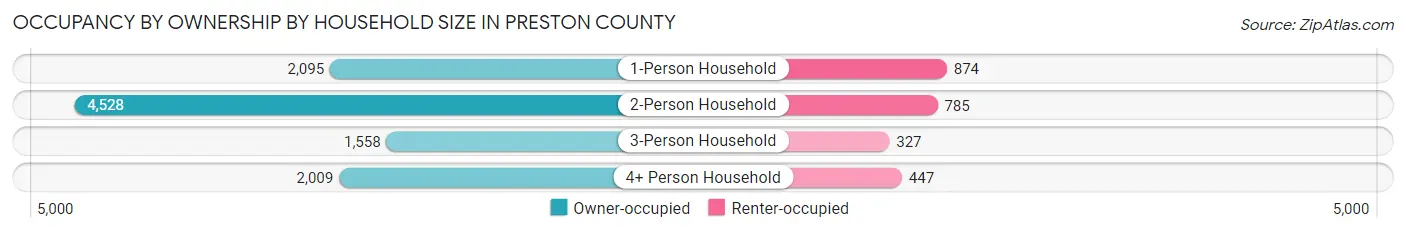
| Household Size | Owner-occupied | Renter-occupied |
| 1-Person Household | 2,095 (70.6%) | 874 (29.4%) |
| 2-Person Household | 4,528 (85.2%) | 785 (14.8%) |
| 3-Person Household | 1,558 (82.7%) | 327 (17.3%) |
| 4+ Person Household | 2,009 (81.8%) | 447 (18.2%) |
| Total Housing Units | 10,190 (80.7%) | 2,433 (19.3%) |
Occupancy by Educational Attainment in Preston County
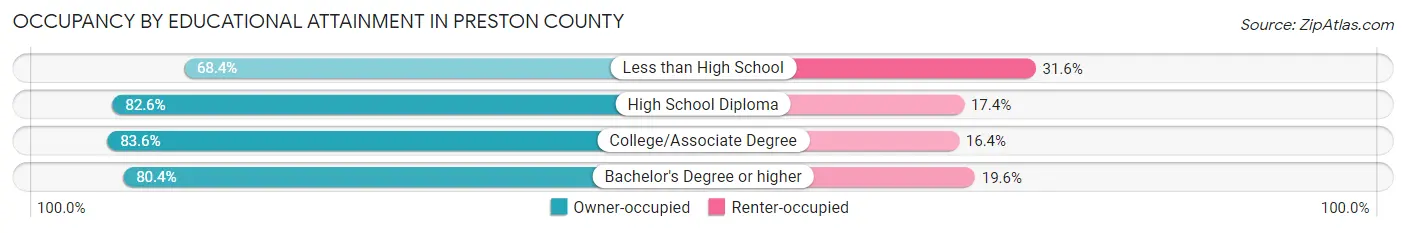
| Household Size | Owner-occupied | Renter-occupied |
| Less than High School | 998 (68.4%) | 461 (31.6%) |
| High School Diploma | 4,672 (82.6%) | 985 (17.4%) |
| College/Associate Degree | 2,382 (83.6%) | 467 (16.4%) |
| Bachelor's Degree or higher | 2,138 (80.4%) | 520 (19.6%) |
Occupancy by Age of Householder in Preston County
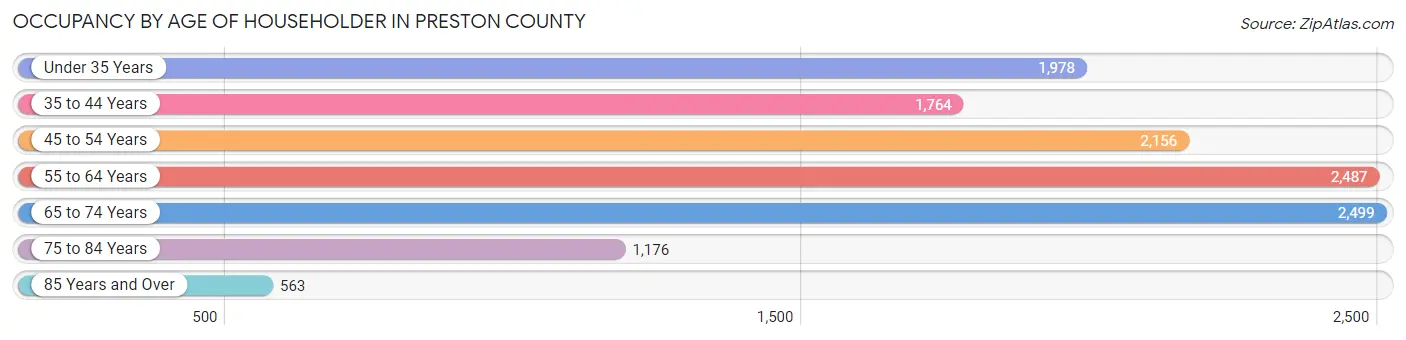
| Age Bracket | # Households | % Households |
| Under 35 Years | 1,978 | 15.7% |
| 35 to 44 Years | 1,764 | 14.0% |
| 45 to 54 Years | 2,156 | 17.1% |
| 55 to 64 Years | 2,487 | 19.7% |
| 65 to 74 Years | 2,499 | 19.8% |
| 75 to 84 Years | 1,176 | 9.3% |
| 85 Years and Over | 563 | 4.5% |
| Total | 12,623 | 100.0% |
Housing Finances in Preston County
Median Income by Occupancy in Preston County
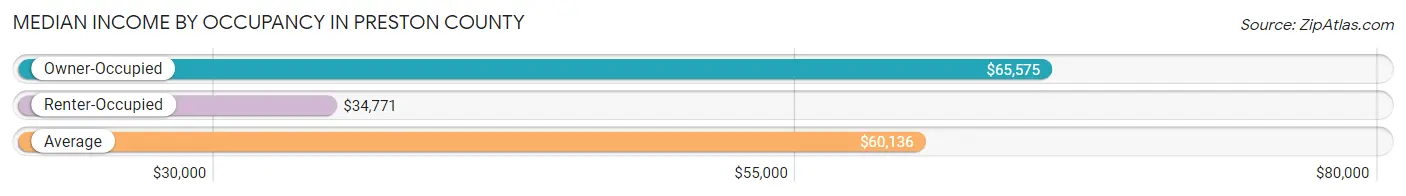
| Occupancy Type | # Households | Median Income |
| Owner-Occupied | 10,190 (80.7%) | $65,575 |
| Renter-Occupied | 2,433 (19.3%) | $34,771 |
| Average | 12,623 (100.0%) | $60,136 |
Occupancy by Householder Income Bracket in Preston County
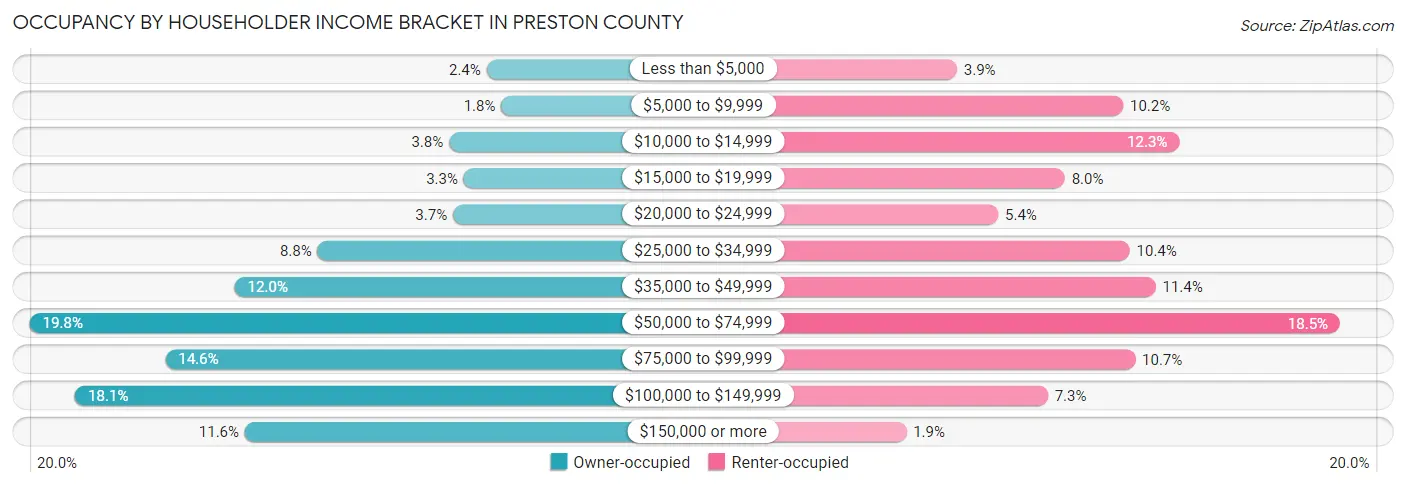
| Income Bracket | Owner-occupied | Renter-occupied |
| Less than $5,000 | 245 (2.4%) | 94 (3.9%) |
| $5,000 to $9,999 | 187 (1.8%) | 248 (10.2%) |
| $10,000 to $14,999 | 390 (3.8%) | 300 (12.3%) |
| $15,000 to $19,999 | 333 (3.3%) | 194 (8.0%) |
| $20,000 to $24,999 | 375 (3.7%) | 132 (5.4%) |
| $25,000 to $34,999 | 901 (8.8%) | 254 (10.4%) |
| $35,000 to $49,999 | 1,223 (12.0%) | 278 (11.4%) |
| $50,000 to $74,999 | 2,019 (19.8%) | 449 (18.4%) |
| $75,000 to $99,999 | 1,492 (14.6%) | 259 (10.6%) |
| $100,000 to $149,999 | 1,842 (18.1%) | 178 (7.3%) |
| $150,000 or more | 1,183 (11.6%) | 47 (1.9%) |
| Total | 10,190 (100.0%) | 2,433 (100.0%) |
Monthly Housing Cost Tiers in Preston County
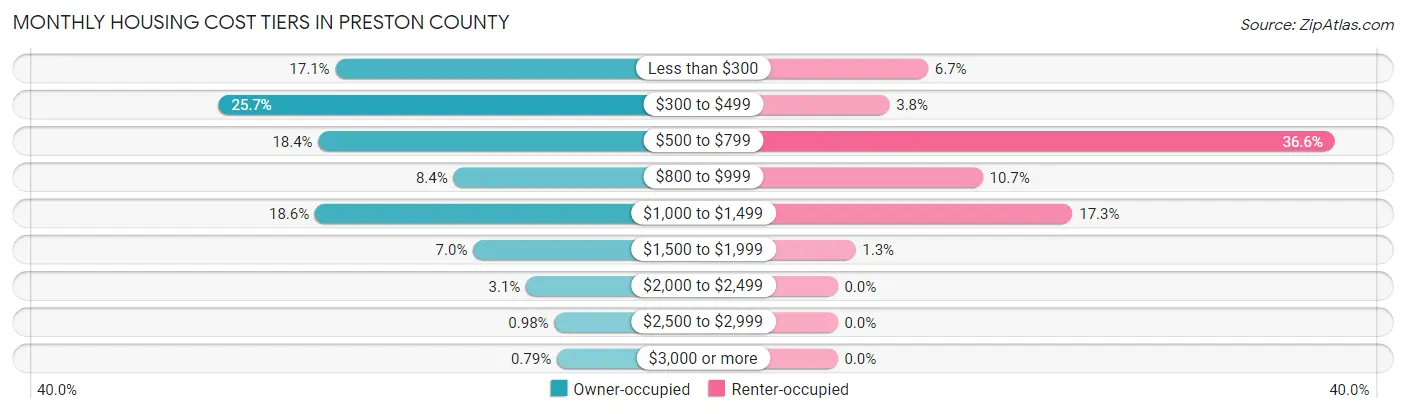
| Monthly Cost | Owner-occupied | Renter-occupied |
| Less than $300 | 1,743 (17.1%) | 162 (6.7%) |
| $300 to $499 | 2,621 (25.7%) | 93 (3.8%) |
| $500 to $799 | 1,871 (18.4%) | 891 (36.6%) |
| $800 to $999 | 857 (8.4%) | 260 (10.7%) |
| $1,000 to $1,499 | 1,896 (18.6%) | 421 (17.3%) |
| $1,500 to $1,999 | 709 (7.0%) | 32 (1.3%) |
| $2,000 to $2,499 | 312 (3.1%) | 0 (0.0%) |
| $2,500 to $2,999 | 100 (1.0%) | 0 (0.0%) |
| $3,000 or more | 81 (0.8%) | 0 (0.0%) |
| Total | 10,190 (100.0%) | 2,433 (100.0%) |
Physical Housing Characteristics in Preston County
Housing Structures in Preston County
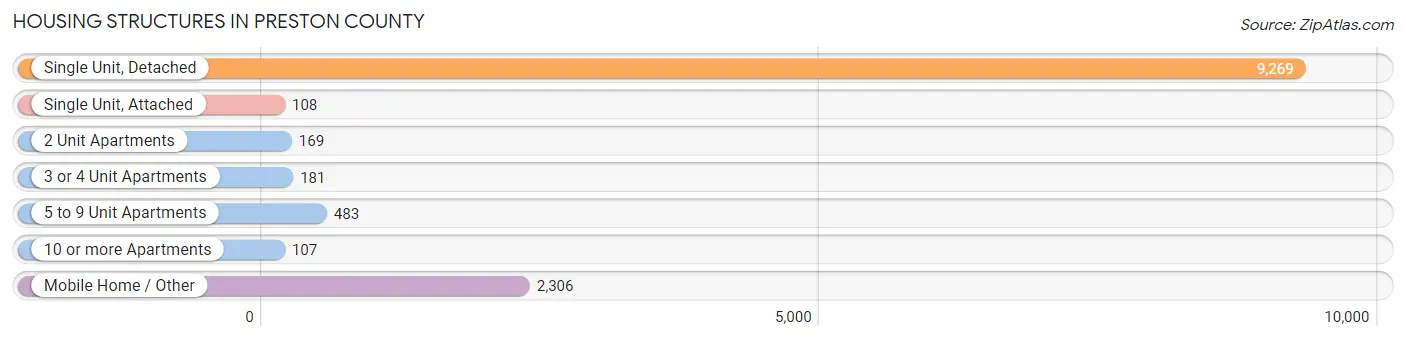
| Structure Type | # Housing Units | % Housing Units |
| Single Unit, Detached | 9,269 | 73.4% |
| Single Unit, Attached | 108 | 0.9% |
| 2 Unit Apartments | 169 | 1.3% |
| 3 or 4 Unit Apartments | 181 | 1.4% |
| 5 to 9 Unit Apartments | 483 | 3.8% |
| 10 or more Apartments | 107 | 0.9% |
| Mobile Home / Other | 2,306 | 18.3% |
| Total | 12,623 | 100.0% |
Housing Structures by Occupancy in Preston County
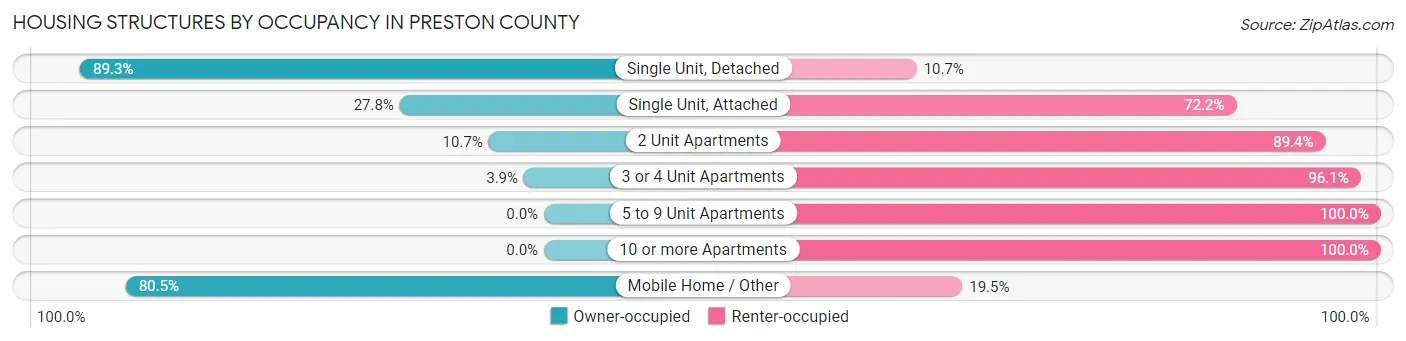
| Structure Type | Owner-occupied | Renter-occupied |
| Single Unit, Detached | 8,278 (89.3%) | 991 (10.7%) |
| Single Unit, Attached | 30 (27.8%) | 78 (72.2%) |
| 2 Unit Apartments | 18 (10.6%) | 151 (89.3%) |
| 3 or 4 Unit Apartments | 7 (3.9%) | 174 (96.1%) |
| 5 to 9 Unit Apartments | 0 (0.0%) | 483 (100.0%) |
| 10 or more Apartments | 0 (0.0%) | 107 (100.0%) |
| Mobile Home / Other | 1,857 (80.5%) | 449 (19.5%) |
| Total | 10,190 (80.7%) | 2,433 (19.3%) |
Housing Structures by Number of Rooms in Preston County
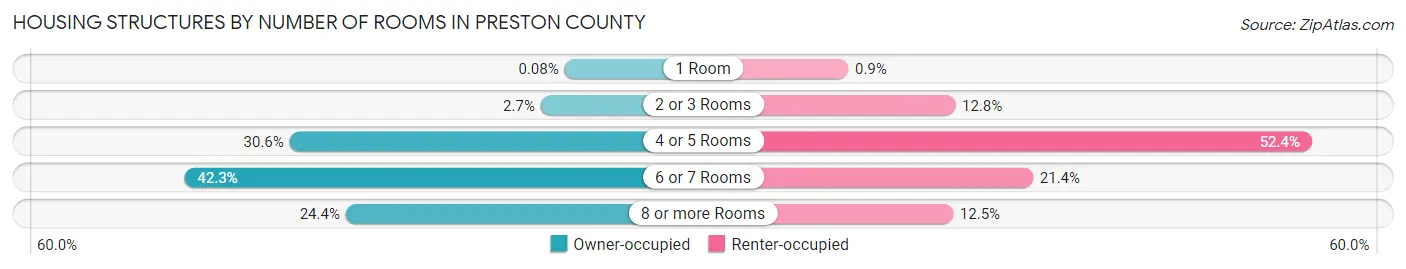
| Number of Rooms | Owner-occupied | Renter-occupied |
| 1 Room | 8 (0.1%) | 22 (0.9%) |
| 2 or 3 Rooms | 277 (2.7%) | 311 (12.8%) |
| 4 or 5 Rooms | 3,117 (30.6%) | 1,274 (52.4%) |
| 6 or 7 Rooms | 4,306 (42.3%) | 521 (21.4%) |
| 8 or more Rooms | 2,482 (24.4%) | 305 (12.5%) |
| Total | 10,190 (100.0%) | 2,433 (100.0%) |
Housing Structure by Heating Type in Preston County
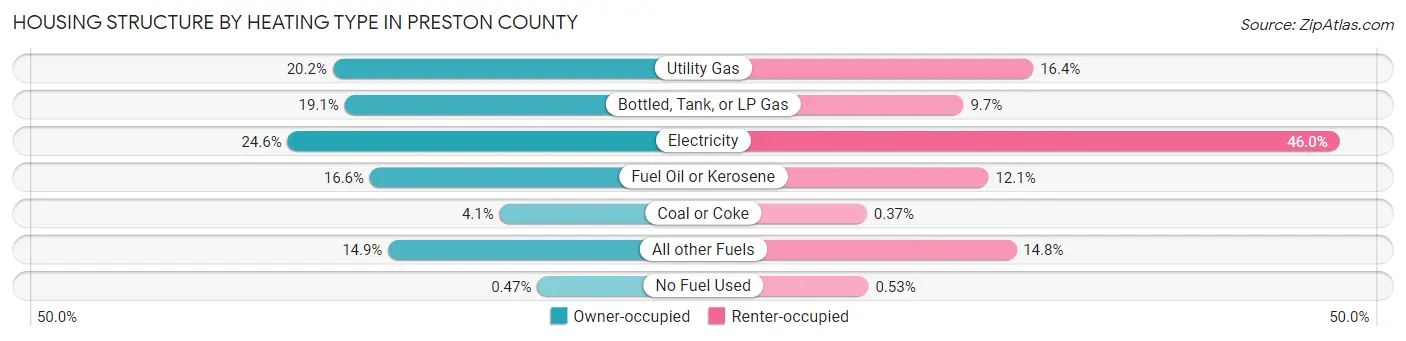
| Heating Type | Owner-occupied | Renter-occupied |
| Utility Gas | 2,061 (20.2%) | 400 (16.4%) |
| Bottled, Tank, or LP Gas | 1,944 (19.1%) | 236 (9.7%) |
| Electricity | 2,507 (24.6%) | 1,120 (46.0%) |
| Fuel Oil or Kerosene | 1,696 (16.6%) | 295 (12.1%) |
| Coal or Coke | 419 (4.1%) | 9 (0.4%) |
| All other Fuels | 1,515 (14.9%) | 360 (14.8%) |
| No Fuel Used | 48 (0.5%) | 13 (0.5%) |
| Total | 10,190 (100.0%) | 2,433 (100.0%) |
Household Vehicle Usage in Preston County
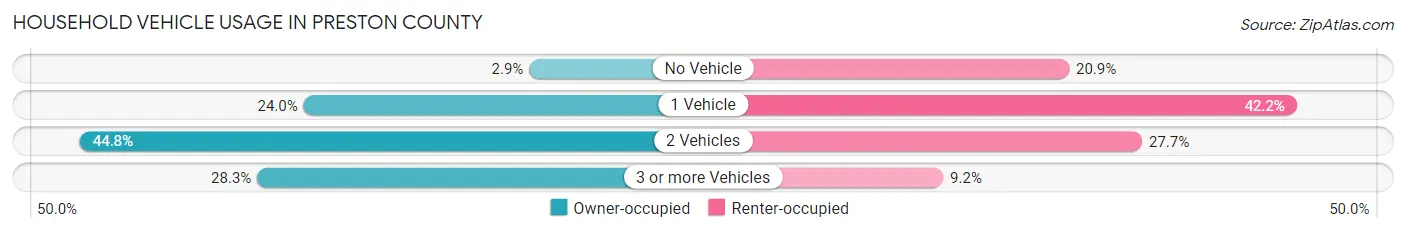
| Vehicles per Household | Owner-occupied | Renter-occupied |
| No Vehicle | 296 (2.9%) | 509 (20.9%) |
| 1 Vehicle | 2,442 (24.0%) | 1,026 (42.2%) |
| 2 Vehicles | 4,569 (44.8%) | 675 (27.7%) |
| 3 or more Vehicles | 2,883 (28.3%) | 223 (9.2%) |
| Total | 10,190 (100.0%) | 2,433 (100.0%) |
Real Estate & Mortgages in Preston County
Real Estate and Mortgage Overview in Preston County
| Characteristic | Without Mortgage | With Mortgage |
| Housing Units | 5,633 | 4,557 |
| Median Property Value | $110,500 | $170,400 |
| Median Household Income | $52,158 | $862 |
| Monthly Housing Costs | $373 | $72 |
| Real Estate Taxes | $562 | $68 |
Property Value by Mortgage Status in Preston County
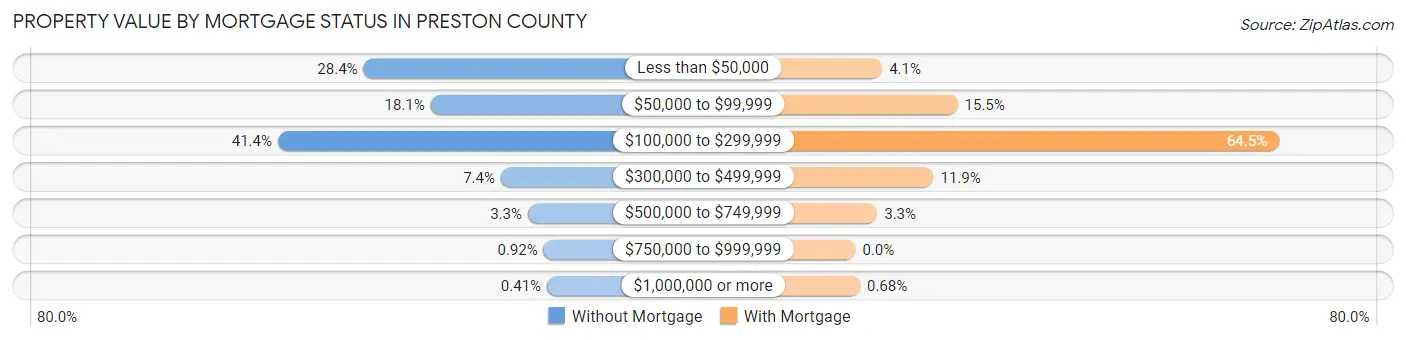
| Property Value | Without Mortgage | With Mortgage |
| Less than $50,000 | 1,598 (28.4%) | 185 (4.1%) |
| $50,000 to $99,999 | 1,021 (18.1%) | 708 (15.5%) |
| $100,000 to $299,999 | 2,333 (41.4%) | 2,940 (64.5%) |
| $300,000 to $499,999 | 419 (7.4%) | 542 (11.9%) |
| $500,000 to $749,999 | 187 (3.3%) | 151 (3.3%) |
| $750,000 to $999,999 | 52 (0.9%) | 0 (0.0%) |
| $1,000,000 or more | 23 (0.4%) | 31 (0.7%) |
| Total | 5,633 (100.0%) | 4,557 (100.0%) |
Household Income by Mortgage Status in Preston County
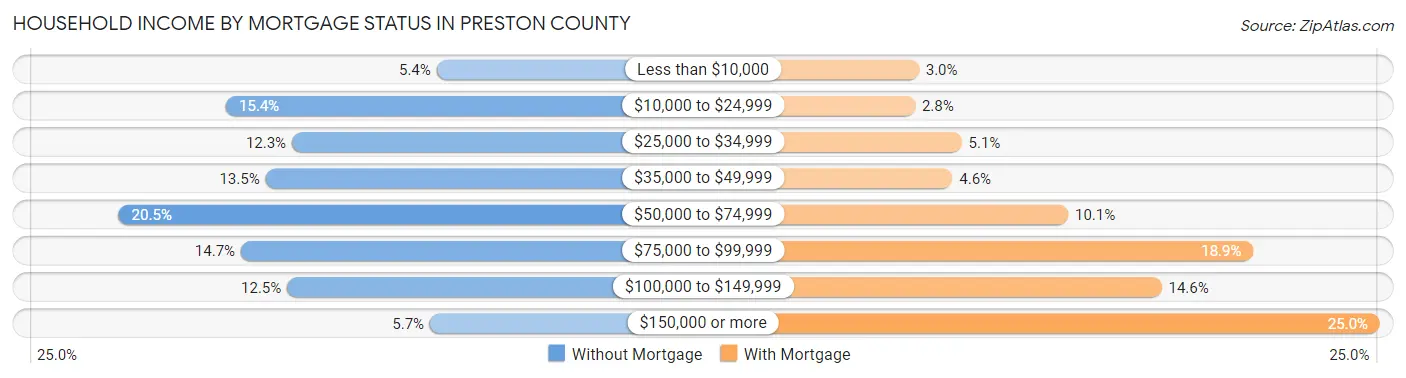
| Household Income | Without Mortgage | With Mortgage |
| Less than $10,000 | 303 (5.4%) | 137 (3.0%) |
| $10,000 to $24,999 | 868 (15.4%) | 129 (2.8%) |
| $25,000 to $34,999 | 691 (12.3%) | 230 (5.1%) |
| $35,000 to $49,999 | 762 (13.5%) | 210 (4.6%) |
| $50,000 to $74,999 | 1,156 (20.5%) | 461 (10.1%) |
| $75,000 to $99,999 | 828 (14.7%) | 863 (18.9%) |
| $100,000 to $149,999 | 704 (12.5%) | 664 (14.6%) |
| $150,000 or more | 321 (5.7%) | 1,138 (25.0%) |
| Total | 5,633 (100.0%) | 4,557 (100.0%) |
Property Value to Household Income Ratio in Preston County
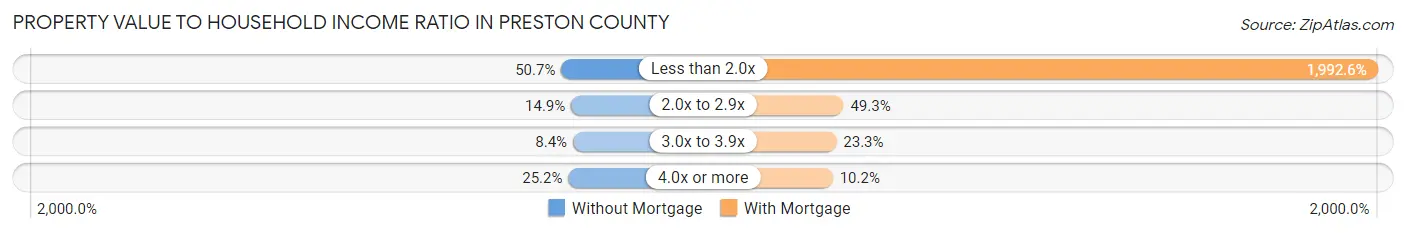
| Value-to-Income Ratio | Without Mortgage | With Mortgage |
| Less than 2.0x | 2,858 (50.7%) | 90,804 (1,992.6%) |
| 2.0x to 2.9x | 841 (14.9%) | 2,246 (49.3%) |
| 3.0x to 3.9x | 474 (8.4%) | 1,061 (23.3%) |
| 4.0x or more | 1,422 (25.2%) | 465 (10.2%) |
| Total | 5,633 (100.0%) | 4,557 (100.0%) |
Real Estate Taxes by Mortgage Status in Preston County
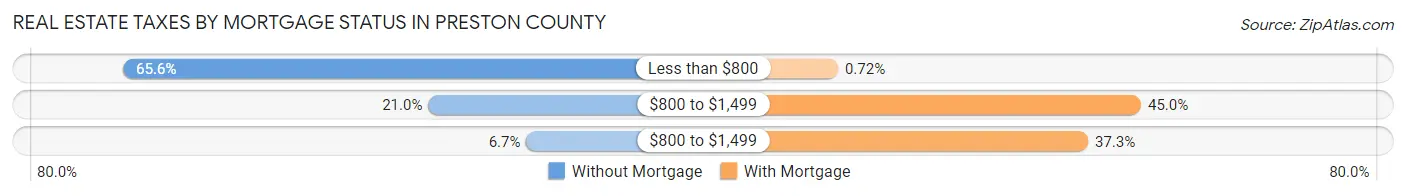
| Property Taxes | Without Mortgage | With Mortgage |
| Less than $800 | 3,696 (65.6%) | 33 (0.7%) |
| $800 to $1,499 | 1,184 (21.0%) | 2,051 (45.0%) |
| $800 to $1,499 | 377 (6.7%) | 1,698 (37.3%) |
| Total | 5,633 (100.0%) | 4,557 (100.0%) |
Health & Disability in Preston County
Health Insurance Coverage by Age in Preston County
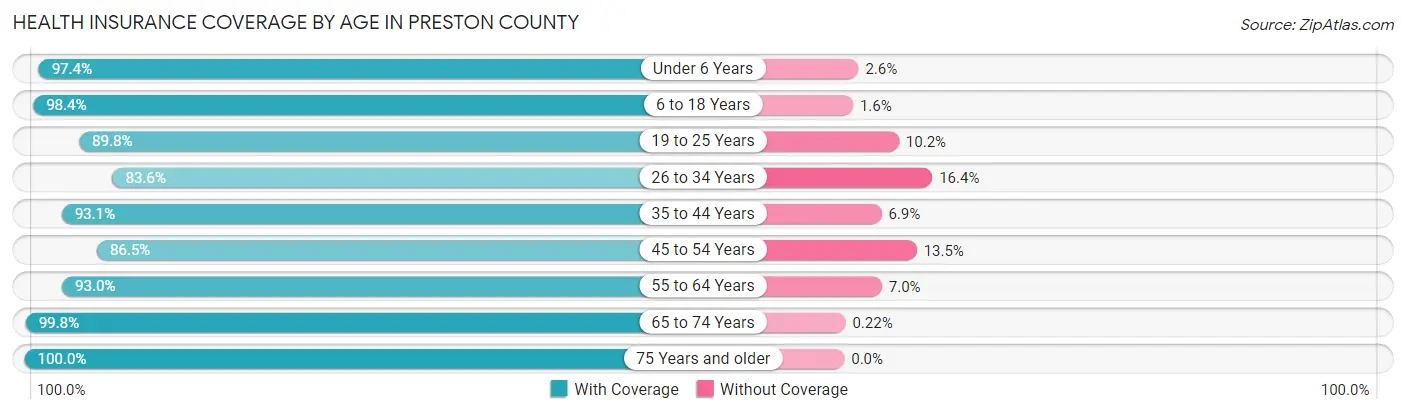
| Age Bracket | With Coverage | Without Coverage |
| Under 6 Years | 1,773 (97.4%) | 48 (2.6%) |
| 6 to 18 Years | 4,553 (98.4%) | 75 (1.6%) |
| 19 to 25 Years | 2,188 (89.8%) | 248 (10.2%) |
| 26 to 34 Years | 2,840 (83.6%) | 557 (16.4%) |
| 35 to 44 Years | 3,208 (93.1%) | 239 (6.9%) |
| 45 to 54 Years | 3,441 (86.5%) | 537 (13.5%) |
| 55 to 64 Years | 4,164 (93.0%) | 314 (7.0%) |
| 65 to 74 Years | 4,056 (99.8%) | 9 (0.2%) |
| 75 Years and older | 2,482 (100.0%) | 0 (0.0%) |
| Total | 28,705 (93.4%) | 2,027 (6.6%) |
Health Insurance Coverage by Citizenship Status in Preston County
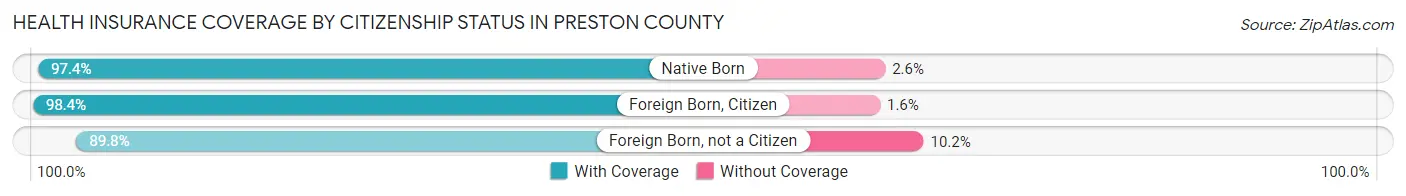
| Citizenship Status | With Coverage | Without Coverage |
| Native Born | 1,773 (97.4%) | 48 (2.6%) |
| Foreign Born, Citizen | 4,553 (98.4%) | 75 (1.6%) |
| Foreign Born, not a Citizen | 2,188 (89.8%) | 248 (10.2%) |
Health Insurance Coverage by Household Income in Preston County
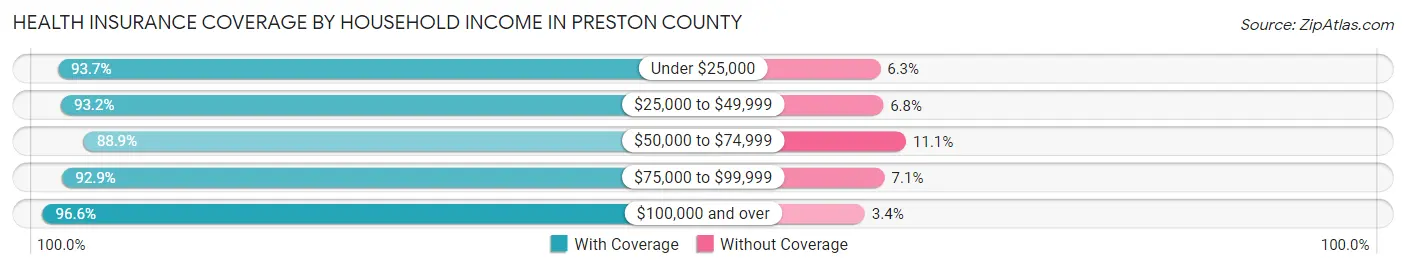
| Household Income | With Coverage | Without Coverage |
| Under $25,000 | 4,279 (93.7%) | 286 (6.3%) |
| $25,000 to $49,999 | 4,937 (93.2%) | 362 (6.8%) |
| $50,000 to $74,999 | 5,600 (88.9%) | 700 (11.1%) |
| $75,000 to $99,999 | 4,667 (92.9%) | 356 (7.1%) |
| $100,000 and over | 9,213 (96.6%) | 323 (3.4%) |
Public vs Private Health Insurance Coverage by Age in Preston County
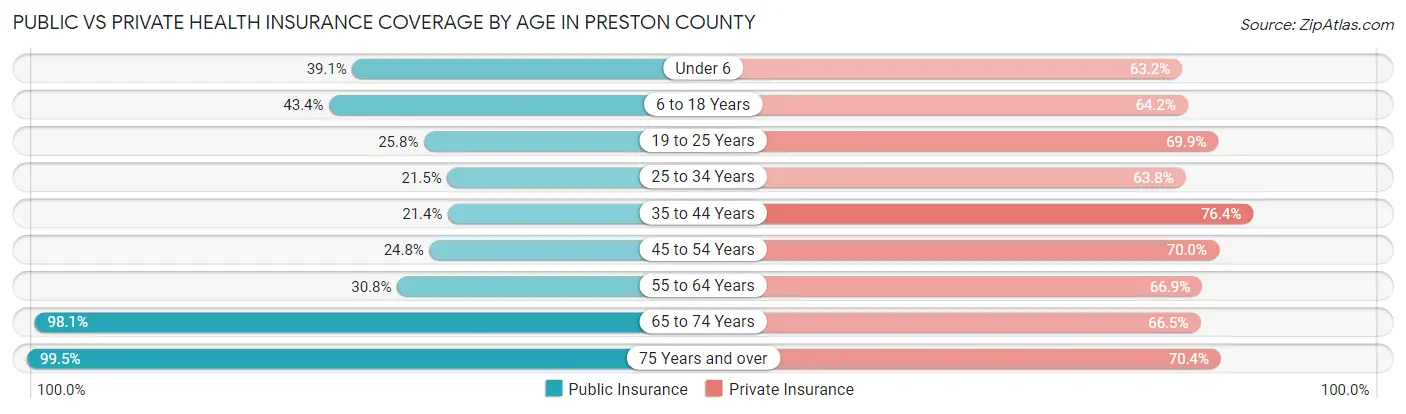
| Age Bracket | Public Insurance | Private Insurance |
| Under 6 | 712 (39.1%) | 1,150 (63.1%) |
| 6 to 18 Years | 2,010 (43.4%) | 2,971 (64.2%) |
| 19 to 25 Years | 629 (25.8%) | 1,702 (69.9%) |
| 25 to 34 Years | 730 (21.5%) | 2,167 (63.8%) |
| 35 to 44 Years | 736 (21.3%) | 2,632 (76.4%) |
| 45 to 54 Years | 987 (24.8%) | 2,784 (70.0%) |
| 55 to 64 Years | 1,380 (30.8%) | 2,994 (66.9%) |
| 65 to 74 Years | 3,989 (98.1%) | 2,705 (66.5%) |
| 75 Years and over | 2,470 (99.5%) | 1,746 (70.4%) |
| Total | 13,643 (44.4%) | 20,851 (67.8%) |
Disability Status by Sex by Age in Preston County
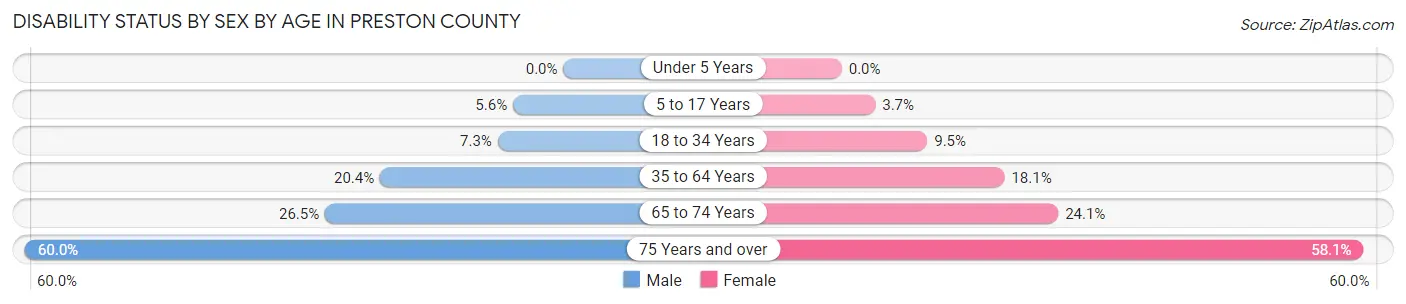
| Age Bracket | Male | Female |
| Under 5 Years | 0 (0.0%) | 0 (0.0%) |
| 5 to 17 Years | 136 (5.6%) | 83 (3.7%) |
| 18 to 34 Years | 226 (7.3%) | 282 (9.5%) |
| 35 to 64 Years | 1,202 (20.4%) | 1,090 (18.1%) |
| 65 to 74 Years | 527 (26.5%) | 501 (24.1%) |
| 75 Years and over | 647 (60.0%) | 815 (58.1%) |
Disability Class by Sex by Age in Preston County
Disability Class: Hearing Difficulty
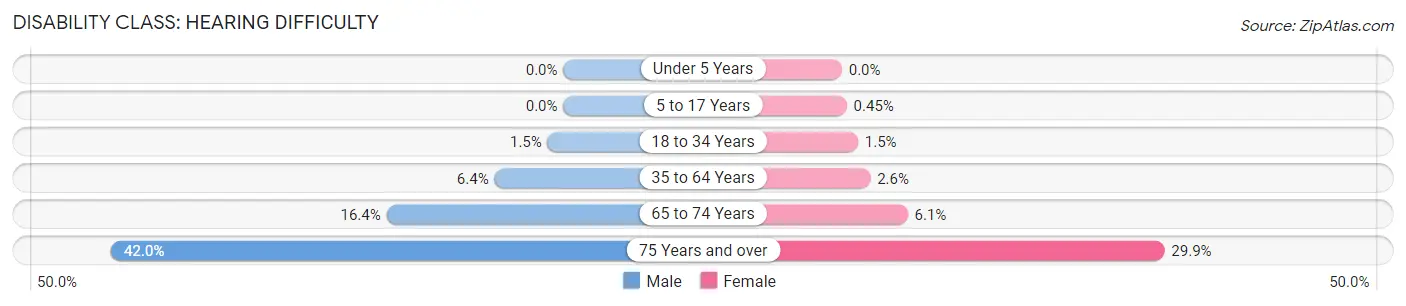
| Age Bracket | Male | Female |
| Under 5 Years | 0 (0.0%) | 0 (0.0%) |
| 5 to 17 Years | 0 (0.0%) | 10 (0.4%) |
| 18 to 34 Years | 45 (1.5%) | 44 (1.5%) |
| 35 to 64 Years | 376 (6.4%) | 159 (2.6%) |
| 65 to 74 Years | 326 (16.4%) | 127 (6.1%) |
| 75 Years and over | 453 (42.0%) | 420 (29.9%) |
Disability Class: Vision Difficulty
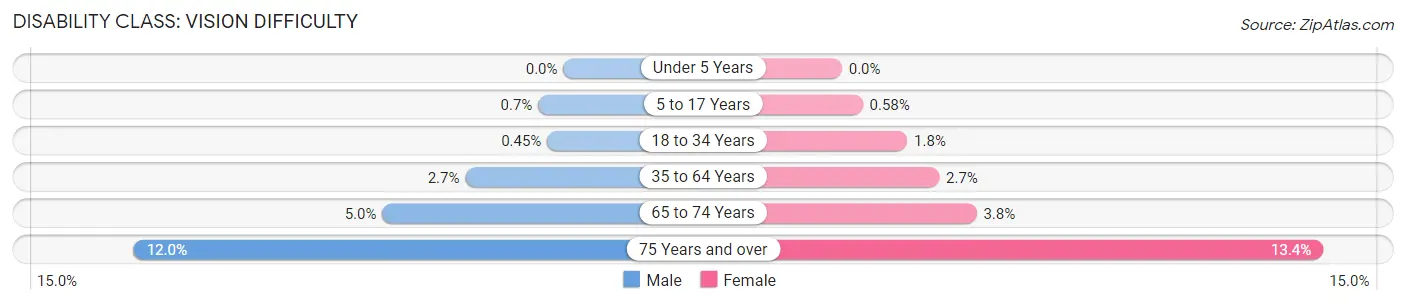
| Age Bracket | Male | Female |
| Under 5 Years | 0 (0.0%) | 0 (0.0%) |
| 5 to 17 Years | 17 (0.7%) | 13 (0.6%) |
| 18 to 34 Years | 14 (0.4%) | 54 (1.8%) |
| 35 to 64 Years | 161 (2.7%) | 163 (2.7%) |
| 65 to 74 Years | 100 (5.0%) | 78 (3.7%) |
| 75 Years and over | 129 (12.0%) | 188 (13.4%) |
Disability Class: Cognitive Difficulty
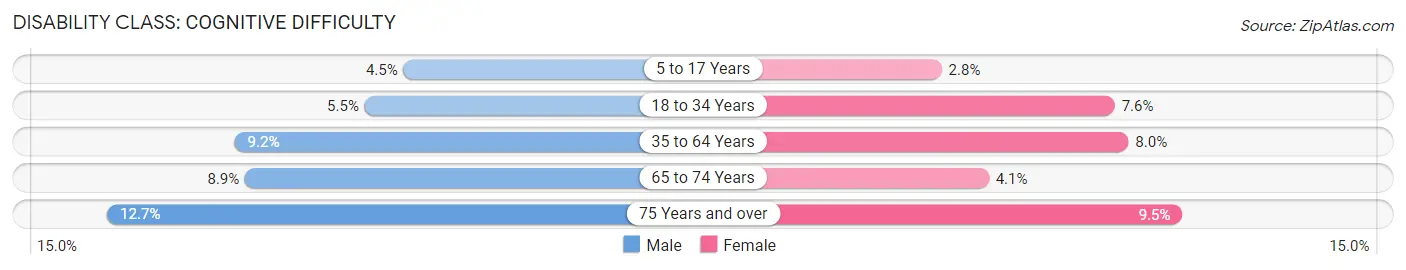
| Age Bracket | Male | Female |
| 5 to 17 Years | 108 (4.4%) | 62 (2.8%) |
| 18 to 34 Years | 171 (5.5%) | 225 (7.6%) |
| 35 to 64 Years | 539 (9.1%) | 480 (8.0%) |
| 65 to 74 Years | 176 (8.9%) | 85 (4.1%) |
| 75 Years and over | 137 (12.7%) | 133 (9.5%) |
Disability Class: Ambulatory Difficulty
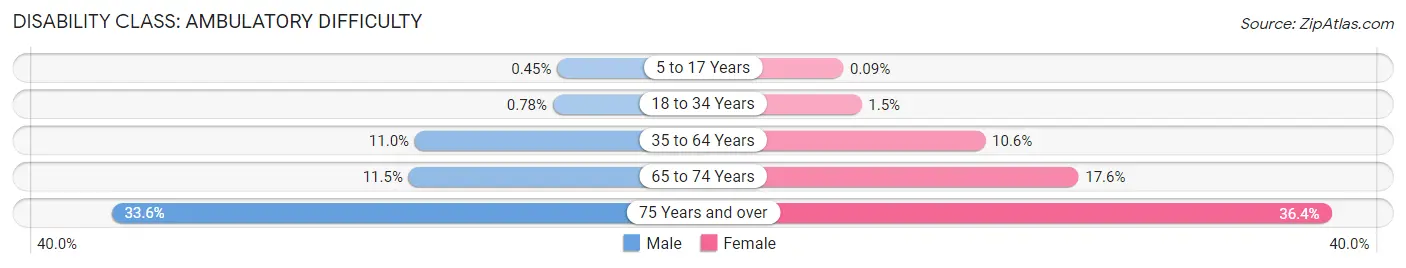
| Age Bracket | Male | Female |
| 5 to 17 Years | 11 (0.4%) | 2 (0.1%) |
| 18 to 34 Years | 24 (0.8%) | 43 (1.5%) |
| 35 to 64 Years | 649 (11.0%) | 640 (10.6%) |
| 65 to 74 Years | 228 (11.5%) | 365 (17.6%) |
| 75 Years and over | 362 (33.6%) | 510 (36.3%) |
Disability Class: Self-Care Difficulty
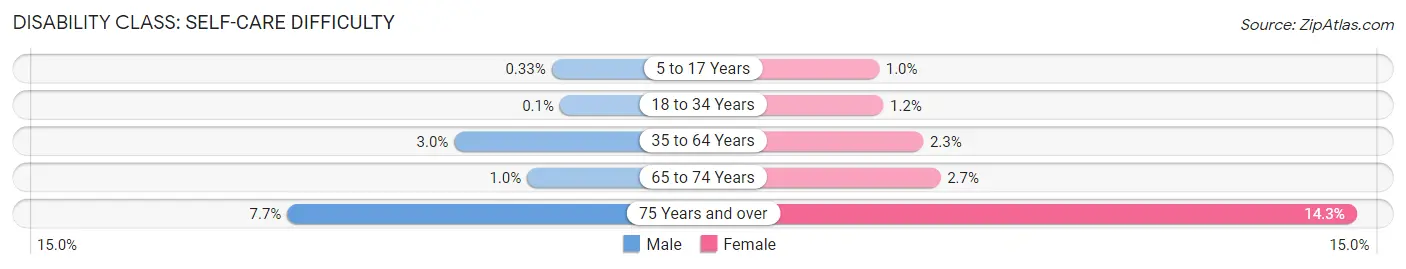
| Age Bracket | Male | Female |
| 5 to 17 Years | 8 (0.3%) | 23 (1.0%) |
| 18 to 34 Years | 3 (0.1%) | 34 (1.1%) |
| 35 to 64 Years | 179 (3.0%) | 136 (2.3%) |
| 65 to 74 Years | 20 (1.0%) | 57 (2.7%) |
| 75 Years and over | 83 (7.7%) | 201 (14.3%) |
Technology Access in Preston County
Computing Device Access in Preston County
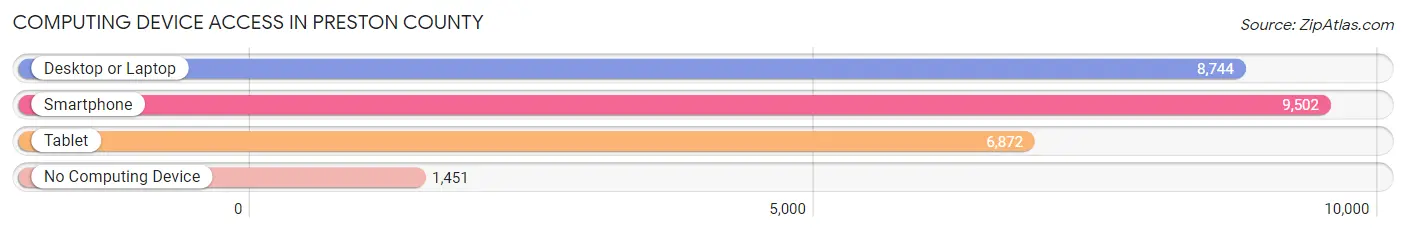
| Device Type | # Households | % Households |
| Desktop or Laptop | 8,744 | 69.3% |
| Smartphone | 9,502 | 75.3% |
| Tablet | 6,872 | 54.4% |
| No Computing Device | 1,451 | 11.5% |
| Total | 12,623 | 100.0% |
Internet Access in Preston County
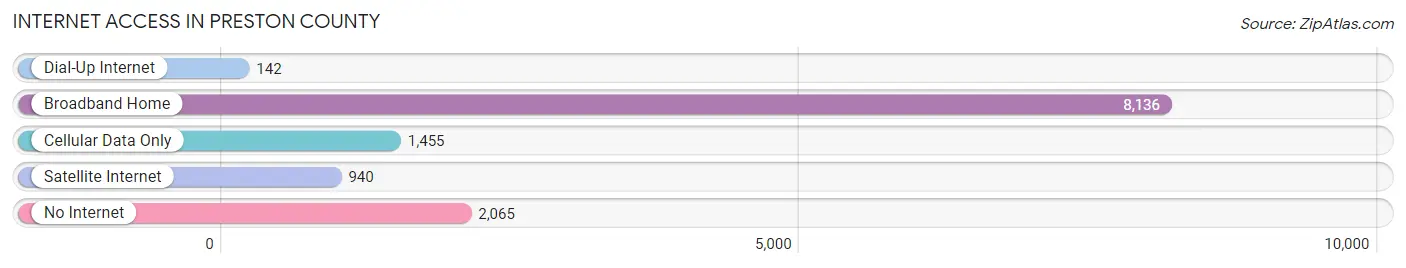
| Internet Type | # Households | % Households |
| Dial-Up Internet | 142 | 1.1% |
| Broadband Home | 8,136 | 64.4% |
| Cellular Data Only | 1,455 | 11.5% |
| Satellite Internet | 940 | 7.4% |
| No Internet | 2,065 | 16.4% |
| Total | 12,623 | 100.0% |
Preston County Summary
Preston County is located in the northern part of West Virginia, and is bordered by Garrett County, Maryland to the north, Tucker County to the east, Randolph County to the south, and Monongalia County to the west. The county seat is Kingwood, and the county was created in 1818 from parts of Monongalia and Randolph counties. The county has a total area of 517 square miles, and a population of 33,520 as of the 2010 census.
Geography
Preston County is located in the Appalachian Mountains, and is part of the Allegheny Plateau. The county is mostly mountainous, with the highest point being Cheat Mountain at 4,848 feet. The Cheat River runs through the county, and is a popular destination for whitewater rafting and kayaking. The county is also home to several state parks, including Blackwater Falls State Park, Canaan Valley State Park, and Cooper’s Rock State Forest.
Economy
The economy of Preston County is largely based on agriculture and tourism. The county is home to several large farms, and is a major producer of apples, peaches, and other fruits and vegetables. The county is also home to several wineries, and is a popular destination for wine tours. Tourism is also a major industry in the county, with visitors coming to enjoy the area’s natural beauty and outdoor activities.
Demographics
As of the 2010 census, Preston County had a population of 33,520. The racial makeup of the county was 95.3% White, 2.2% African American, 0.3% Native American, 0.4% Asian, 0.1% Pacific Islander, 0.4% from other races, and 1.3% from two or more races. Hispanic or Latino of any race were 1.2% of the population.
The median income for a household in the county was $37,845, and the median income for a family was $45,945. The per capita income for the county was $19,945. About 11.2% of families and 14.7% of the population were below the poverty line, including 19.2% of those under age 18 and 10.2% of those age 65 or over.
Education
Preston County is served by the Preston County Schools system, which consists of seven elementary schools, two middle schools, and two high schools. The county is also home to several private schools, including the Preston County Christian School and the Preston County Day School. The county is also home to several higher education institutions, including West Virginia University at Morgantown, Fairmont State University, and West Virginia University Institute of Technology.
Common Questions
What is the Total Population of Preston County?
Total Population of Preston County is 34,206.
What is the Total Male Population of Preston County?
Total Male Population of Preston County is 18,139.
What is the Total Female Population of Preston County?
Total Female Population of Preston County is 16,067.
What is the Ratio of Males per 100 Females in Preston County?
There are 112.90 Males per 100 Females in Preston County.
What is the Ratio of Females per 100 Males in Preston County?
There are 88.58 Females per 100 Males in Preston County.
What is the Median Population Age in Preston County?
Median Population Age in Preston County is 42.5 Years.
What is the Average Family Size in Preston County
Average Family Size in Preston County is 2.9 People.
What is the Average Household Size in Preston County
Average Household Size in Preston County is 2.4 People.
What is Per Capita Income in Preston County?
Per Capita income in Preston County is $27,848.
What is the Median Family Income in Preston County?
Median Family Income in Preston County is $73,144.
What is the Median Household income in Preston County?
Median Household Income in Preston County is $60,136.
What is Income or Wage Gap in Preston County?
Income or Wage Gap in Preston County is 34.1%.
Women in Preston County earn 65.9 cents for every dollar earned by a man.
What is Family Income Deficit in Preston County?
Family Income Deficit in Preston County is $13,376.
Families that are below poverty line in Preston County earn $13,376 less on average than the poverty threshold level.
What is Inequality or Gini Index in Preston County?
Inequality or Gini Index in Preston County is 0.42.
How Large is the Labor Force in Preston County?
There are 14,436 People in the Labor Forcein in Preston County.
What is the Percentage of People in the Labor Force in Preston County?
50.3% of People are in the Labor Force in Preston County.
What is the Unemployment Rate in Preston County?
Unemployment Rate in Preston County is 7.2%.