Pleasants County, WV
Pleasants County Map

Pleasants County Overview
7,622
TOTAL POPULATION
4,269
MALE POPULATION
3,353
FEMALE POPULATION
127.32
MALES / 100 FEMALES
78.54
FEMALES / 100 MALES
43.6
MEDIAN AGE
3.0
AVG FAMILY SIZE
2.6
AVG HOUSEHOLD SIZE
$39,138
PER CAPITA INCOME
$76,622
AVG FAMILY INCOME
$59,666
AVG HOUSEHOLD INCOME
40.2%
WAGE / INCOME GAP [ % ]
59.8¢/ $1
WAGE / INCOME GAP [ $ ]
$5,802
FAMILY INCOME DEFICIT
0.56
INEQUALITY / GINI INDEX
3,316
LABOR FORCE [ PEOPLE ]
52.0%
PERCENT IN LABOR FORCE
7.2%
UNEMPLOYMENT RATE
Race in Pleasants County
The most populous races in Pleasants County are White / Caucasian (7,273 | 95.4%), Hispanic or Latino (200 | 2.6%), and Two or more Races (153 | 2.0%).

| Race | # Population | % Population |
| Asian | 0 | 0.0% |
| Black / African American | 54 | 0.7% |
| Hawaiian / Pacific | 0 | 0.0% |
| Hispanic or Latino | 200 | 2.6% |
| Native / Alaskan | 22 | 0.3% |
| White / Caucasian | 7,273 | 95.4% |
| Two or more Races | 153 | 2.0% |
| Some other Race | 120 | 1.6% |
| Total | 7,622 | 100.0% |
Ancestry in Pleasants County
The most populous ancestries reported in Pleasants County are English (1,147 | 15.0%), German (993 | 13.0%), Irish (955 | 12.5%), American (920 | 12.1%), and Italian (200 | 2.6%), together accounting for 55.3% of all Pleasants County residents.

| Ancestry | # Population | % Population |
| Alaska Native | 6 | 0.1% |
| American | 920 | 12.1% |
| Austrian | 2 | 0.0% |
| British | 20 | 0.3% |
| Bulgarian | 5 | 0.1% |
| Central American Indian | 64 | 0.8% |
| Cherokee | 112 | 1.5% |
| Czech | 13 | 0.2% |
| Danish | 24 | 0.3% |
| Dutch | 56 | 0.7% |
| English | 1,147 | 15.0% |
| European | 30 | 0.4% |
| Finnish | 14 | 0.2% |
| French | 113 | 1.5% |
| French Canadian | 5 | 0.1% |
| German | 993 | 13.0% |
| Greek | 32 | 0.4% |
| Hungarian | 2 | 0.0% |
| Irish | 955 | 12.5% |
| Italian | 200 | 2.6% |
| Mexican | 136 | 1.8% |
| Norwegian | 31 | 0.4% |
| Peruvian | 64 | 0.8% |
| Polish | 89 | 1.2% |
| Romanian | 1 | 0.0% |
| Russian | 23 | 0.3% |
| Scandinavian | 9 | 0.1% |
| Scotch-Irish | 27 | 0.4% |
| Scottish | 176 | 2.3% |
| Sioux | 19 | 0.3% |
| Slavic | 21 | 0.3% |
| Slovak | 16 | 0.2% |
| South American | 64 | 0.8% |
| Swedish | 6 | 0.1% |
| Swiss | 6 | 0.1% |
| Welsh | 19 | 0.3% | View All 36 Rows |
Immigrants in Pleasants County
The most numerous immigrant groups reported in Pleasants County came from Europe (31 | 0.4%), Germany (31 | 0.4%), and Western Europe (31 | 0.4%), together accounting for 1.2% of all Pleasants County residents.

| Immigration Origin | # Population | % Population |
| Europe | 31 | 0.4% |
| Germany | 31 | 0.4% |
| Western Europe | 31 | 0.4% | View All 3 Rows |
Sex and Age in Pleasants County
Sex and Age in Pleasants County
The most populous age groups in Pleasants County are 40 to 44 Years (390 | 9.1%) for men and 60 to 64 Years (306 | 9.1%) for women.

| Age Bracket | Male | Female |
| Under 5 Years | 263 (6.2%) | 101 (3.0%) |
| 5 to 9 Years | 171 (4.0%) | 88 (2.6%) |
| 10 to 14 Years | 244 (5.7%) | 254 (7.6%) |
| 15 to 19 Years | 299 (7.0%) | 242 (7.2%) |
| 20 to 24 Years | 256 (6.0%) | 274 (8.2%) |
| 25 to 29 Years | 316 (7.4%) | 65 (1.9%) |
| 30 to 34 Years | 266 (6.2%) | 163 (4.9%) |
| 35 to 39 Years | 170 (4.0%) | 164 (4.9%) |
| 40 to 44 Years | 390 (9.1%) | 240 (7.2%) |
| 45 to 49 Years | 301 (7.0%) | 244 (7.3%) |
| 50 to 54 Years | 326 (7.6%) | 235 (7.0%) |
| 55 to 59 Years | 358 (8.4%) | 241 (7.2%) |
| 60 to 64 Years | 240 (5.6%) | 306 (9.1%) |
| 65 to 69 Years | 235 (5.5%) | 181 (5.4%) |
| 70 to 74 Years | 182 (4.3%) | 232 (6.9%) |
| 75 to 79 Years | 79 (1.8%) | 108 (3.2%) |
| 80 to 84 Years | 89 (2.1%) | 84 (2.5%) |
| 85 Years and over | 84 (2.0%) | 131 (3.9%) |
| Total | 4,269 (100.0%) | 3,353 (100.0%) |
Families and Households in Pleasants County
Median Family Size in Pleasants County
The median family size in Pleasants County is 3.03 persons per family, with single male/father families (122 | 6.3%) accounting for the largest median family size of 3.6 persons per family. On the other hand, married-couple families (1,483 | 76.4%) represent the smallest median family size with 2.98 persons per family.

| Family Type | # Families | Family Size |
| Married-Couple | 1,483 (76.4%) | 2.98 |
| Single Male/Father | 122 (6.3%) | 3.60 |
| Single Female/Mother | 337 (17.3%) | 3.04 |
| Total Families | 1,942 (100.0%) | 3.03 |
Median Household Size in Pleasants County
The median household size in Pleasants County is 2.57 persons per household, with single male/father households (122 | 4.5%) accounting for the largest median household size of 3.68 persons per household. non-family households (795 | 29.0%) represent the smallest median household size with 1.22 persons per household.

| Household Type | # Households | Household Size |
| Married-Couple | 1,483 (54.2%) | 3.04 |
| Single Male/Father | 122 (4.5%) | 3.68 |
| Single Female/Mother | 337 (12.3%) | 3.27 |
| Non-family | 795 (29.0%) | 1.22 |
| Total Households | 2,737 (100.0%) | 2.57 |
Household Size by Marriage Status in Pleasants County
Out of a total of 2,737 households in Pleasants County, 1,942 (71.0%) are family households, while 795 (29.0%) are nonfamily households. The most numerous type of family households are 2-person households, comprising 1,058, and the most common type of nonfamily households are 1-person households, comprising 645.

| Household Size | Family Households | Nonfamily Households |
| 1-Person Households | - | 645 (23.6%) |
| 2-Person Households | 1,058 (38.7%) | 147 (5.4%) |
| 3-Person Households | 487 (17.8%) | 3 (0.1%) |
| 4-Person Households | 220 (8.0%) | 0 (0.0%) |
| 5-Person Households | 100 (3.6%) | 0 (0.0%) |
| 6-Person Households | 25 (0.9%) | 0 (0.0%) |
| 7+ Person Households | 52 (1.9%) | 0 (0.0%) |
| Total | 1,942 (71.0%) | 795 (29.0%) |
Female Fertility in Pleasants County
Fertility by Age in Pleasants County
Average fertility rate in Pleasants County is 75.0 births per 1,000 women. Women in the age bracket of 20 to 34 years have the highest fertility rate with 217.0 births per 1,000 women. Women in the age bracket of 20 to 34 years acount for 100.0% of all women with births.

| Age Bracket | Women with Births | Births / 1,000 Women |
| 15 to 19 years | 0 (0.0%) | 0.0 |
| 20 to 34 years | 109 (100.0%) | 217.0 |
| 35 to 50 years | 0 (0.0%) | 0.0 |
| Total | 109 (100.0%) | 75.0 |
Fertility by Age by Marriage Status in Pleasants County
35.8% of women with births (109) in Pleasants County are married. The highest percentage of unmarried women with births falls into 20 to 34 years age bracket with 64.2% of them unmarried at the time of birth, while the lowest percentage of unmarried women with births belong to 20 to 34 years age bracket with 64.2% of them unmarried.

| Age Bracket | Married | Unmarried |
| 15 to 19 years | 0 (0.0%) | 0 (0.0%) |
| 20 to 34 years | 39 (35.8%) | 70 (64.2%) |
| 35 to 50 years | 0 (0.0%) | 0 (0.0%) |
| Total | 39 (35.8%) | 70 (64.2%) |
Fertility by Education in Pleasants County

| Educational Attainment | Women with Births | Births / 1,000 Women |
| Less than High School | 0 (0.0%) | 0.0 |
| High School Diploma | 76 (69.7%) | 147.0 |
| College or Associate's Degree | 33 (30.3%) | 69.0 |
| Bachelor's Degree | 0 (0.0%) | 0.0 |
| Graduate Degree | 0 (0.0%) | 0.0 |
| Total | 109 (100.0%) | 75.0 |
Fertility by Education by Marriage Status in Pleasants County
64.2% of women with births in Pleasants County are unmarried. Women with the educational attainment of college or associate's degree are most likely to be married with 63.6% of them married at childbirth, while women with the educational attainment of high school diploma are least likely to be married with 76.3% of them unmarried at childbirth.
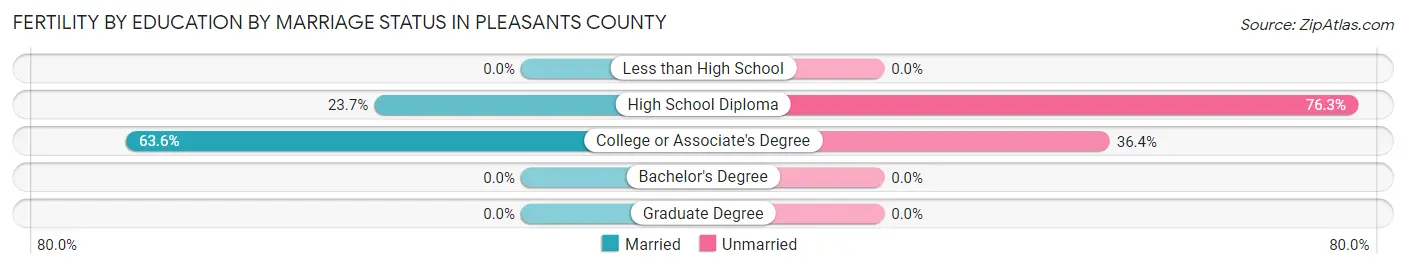
| Educational Attainment | Married | Unmarried |
| Less than High School | 0 (0.0%) | 0 (0.0%) |
| High School Diploma | 18 (23.7%) | 58 (76.3%) |
| College or Associate's Degree | 21 (63.6%) | 12 (36.4%) |
| Bachelor's Degree | 0 (0.0%) | 0 (0.0%) |
| Graduate Degree | 0 (0.0%) | 0 (0.0%) |
| Total | 39 (35.8%) | 70 (64.2%) |
Income in Pleasants County
Income Overview in Pleasants County
Per Capita Income in Pleasants County is $39,138, while median incomes of families and households are $76,622 and $59,666 respectively.
| Characteristic | Number | Measure |
| Per Capita Income | 7,622 | $39,138 |
| Median Family Income | 1,942 | $76,622 |
| Mean Family Income | 1,942 | $122,059 |
| Median Household Income | 2,737 | $59,666 |
| Mean Household Income | 2,737 | $103,290 |
| Income Deficit | 1,942 | $5,802 |
| Wage / Income Gap (%) | 7,622 | 40.19% |
| Wage / Income Gap ($) | 7,622 | 59.81¢ per $1 |
| Gini / Inequality Index | 7,622 | 0.56 |
Earnings by Sex in Pleasants County
Average Earnings in Pleasants County are $34,438, $44,392 for men and $26,553 for women, a difference of 40.2%.

| Sex | Number | Average Earnings |
| Male | 2,023 (56.5%) | $44,392 |
| Female | 1,561 (43.5%) | $26,553 |
| Total | 3,584 (100.0%) | $34,438 |
Earnings by Sex by Income Bracket in Pleasants County
The most common earnings brackets in Pleasants County are $100,000+ for men (311 | 15.4%) and $25,000 to $29,999 for women (235 | 15.0%).

| Income | Male | Female |
| $2,499 or less | 112 (5.5%) | 177 (11.3%) |
| $2,500 to $4,999 | 48 (2.4%) | 62 (4.0%) |
| $5,000 to $7,499 | 35 (1.7%) | 64 (4.1%) |
| $7,500 to $9,999 | 12 (0.6%) | 48 (3.1%) |
| $10,000 to $12,499 | 31 (1.5%) | 58 (3.7%) |
| $12,500 to $14,999 | 43 (2.1%) | 60 (3.8%) |
| $15,000 to $17,499 | 43 (2.1%) | 31 (2.0%) |
| $17,500 to $19,999 | 34 (1.7%) | 40 (2.6%) |
| $20,000 to $22,499 | 73 (3.6%) | 89 (5.7%) |
| $22,500 to $24,999 | 0 (0.0%) | 72 (4.6%) |
| $25,000 to $29,999 | 121 (6.0%) | 235 (15.0%) |
| $30,000 to $34,999 | 205 (10.1%) | 130 (8.3%) |
| $35,000 to $39,999 | 142 (7.0%) | 30 (1.9%) |
| $40,000 to $44,999 | 139 (6.9%) | 75 (4.8%) |
| $45,000 to $49,999 | 162 (8.0%) | 83 (5.3%) |
| $50,000 to $54,999 | 39 (1.9%) | 81 (5.2%) |
| $55,000 to $64,999 | 123 (6.1%) | 59 (3.8%) |
| $65,000 to $74,999 | 102 (5.0%) | 68 (4.4%) |
| $75,000 to $99,999 | 248 (12.3%) | 64 (4.1%) |
| $100,000+ | 311 (15.4%) | 35 (2.2%) |
| Total | 2,023 (100.0%) | 1,561 (100.0%) |
Earnings by Sex by Educational Attainment in Pleasants County
Average earnings in Pleasants County are $46,231 for men and $27,937 for women, a difference of 39.6%. Men with an educational attainment of graduate degree enjoy the highest average annual earnings of $92,955, while those with less than high school education earn the least with $35,326. Women with an educational attainment of graduate degree earn the most with the average annual earnings of $52,303, while those with less than high school education have the smallest earnings of $25,875.

| Educational Attainment | Male Income | Female Income |
| Less than High School | $35,326 | $25,875 |
| High School Diploma | $45,957 | $26,514 |
| College or Associate's Degree | $55,000 | $26,356 |
| Bachelor's Degree | $63,375 | $45,125 |
| Graduate Degree | $92,955 | $52,303 |
| Total | $46,231 | $27,937 |
Family Income in Pleasants County
Family Income Brackets in Pleasants County
According to the Pleasants County family income data, there are 433 families falling into the $100,000 to $149,999 income range, which is the most common income bracket and makes up 22.3% of all families. Conversely, the less than $10,000 income bracket is the least frequent group with only 21 families (1.1%) belonging to this category.

| Income Bracket | # Families | % Families |
| Less than $10,000 | 21 | 1.1% |
| $10,000 to $14,999 | 47 | 2.4% |
| $15,000 to $24,999 | 161 | 8.3% |
| $25,000 to $34,999 | 153 | 7.9% |
| $35,000 to $49,999 | 202 | 10.4% |
| $50,000 to $74,999 | 363 | 18.7% |
| $75,000 to $99,999 | 278 | 14.3% |
| $100,000 to $149,999 | 433 | 22.3% |
| $150,000 to $199,999 | 177 | 9.1% |
| $200,000+ | 109 | 5.6% |
Family Income by Famaliy Size in Pleasants County
4-person families (213 | 11.0%) account for the highest median family income in Pleasants County with $117,375 per family, while 2-person families (1,104 | 56.9%) have the highest median income of $35,625 per family member.

| Income Bracket | # Families | Median Income |
| 2-Person Families | 1,104 (56.9%) | $71,250 |
| 3-Person Families | 456 (23.5%) | $61,250 |
| 4-Person Families | 213 (11.0%) | $117,375 |
| 5-Person Families | 97 (5.0%) | $78,958 |
| 6-Person Families | 34 (1.8%) | $89,286 |
| 7+ Person Families | 38 (2.0%) | $89,028 |
| Total | 1,942 (100.0%) | $76,622 |
Family Income by Number of Earners in Pleasants County
The median family income in Pleasants County is $76,622, with families comprising 3+ earners (92) having the highest median family income of $121,786, while families with 1 earner (637) have the lowest median family income of $49,219, accounting for 4.7% and 32.8% of families, respectively.

| Number of Earners | # Families | Median Income |
| No Earners | 400 (20.6%) | $49,457 |
| 1 Earner | 637 (32.8%) | $49,219 |
| 2 Earners | 813 (41.9%) | $108,576 |
| 3+ Earners | 92 (4.7%) | $121,786 |
| Total | 1,942 (100.0%) | $76,622 |
Household Income in Pleasants County
Household Income Brackets in Pleasants County
With 517 households falling in the category, the $100,000 to $149,999 income range is the most frequent in Pleasants County, accounting for 18.9% of all households. In contrast, only 112 households (4.1%) fall into the less than $10,000 income bracket, making it the least populous group.

| Income Bracket | # Households | % Households |
| Less than $10,000 | 112 | 4.1% |
| $10,000 to $14,999 | 120 | 4.4% |
| $15,000 to $24,999 | 274 | 10.0% |
| $25,000 to $34,999 | 350 | 12.8% |
| $35,000 to $49,999 | 263 | 9.6% |
| $50,000 to $74,999 | 501 | 18.3% |
| $75,000 to $99,999 | 293 | 10.7% |
| $100,000 to $149,999 | 517 | 18.9% |
| $150,000 to $199,999 | 181 | 6.6% |
| $200,000+ | 126 | 4.6% |
Household Income by Householder Age in Pleasants County
The median household income in Pleasants County is $59,666, with the highest median household income of $74,228 found in the 45 to 64 years age bracket for the primary householder. A total of 1,129 households (41.2%) fall into this category. Meanwhile, the 65+ years age bracket for the primary householder has the lowest median household income of $45,703, with 783 households (28.6%) in this group.

| Income Bracket | # Households | Median Income |
| 15 to 24 Years | 153 (5.6%) | $59,010 |
| 25 to 44 Years | 672 (24.5%) | $63,644 |
| 45 to 64 Years | 1,129 (41.2%) | $74,228 |
| 65+ Years | 783 (28.6%) | $45,703 |
| Total | 2,737 (100.0%) | $59,666 |
Poverty in Pleasants County
Income Below Poverty by Sex and Age in Pleasants County
With 7.7% poverty level for males and 7.7% for females among the residents of Pleasants County, 15 year old males and 5 year old females are the most vulnerable to poverty, with 33 males (46.5%) and 7 females (53.8%) in their respective age groups living below the poverty level.

| Age Bracket | Male | Female |
| Under 5 Years | 7 (2.7%) | 0 (0.0%) |
| 5 Years | 0 (0.0%) | 7 (53.8%) |
| 6 to 11 Years | 0 (0.0%) | 0 (0.0%) |
| 12 to 14 Years | 9 (4.5%) | 0 (0.0%) |
| 15 Years | 33 (46.5%) | 1 (1.8%) |
| 16 and 17 Years | 12 (9.3%) | 0 (0.0%) |
| 18 to 24 Years | 33 (10.8%) | 11 (2.9%) |
| 25 to 34 Years | 4 (0.9%) | 5 (2.2%) |
| 35 to 44 Years | 0 (0.0%) | 31 (7.7%) |
| 45 to 54 Years | 61 (12.4%) | 75 (15.7%) |
| 55 to 64 Years | 71 (13.6%) | 62 (11.3%) |
| 65 to 74 Years | 16 (4.0%) | 29 (7.5%) |
| 75 Years and over | 39 (18.3%) | 36 (11.5%) |
| Total | 285 (7.7%) | 257 (7.7%) |
Income Above Poverty by Sex and Age in Pleasants County
According to the poverty statistics in Pleasants County, males aged 5 years and females aged under 5 years are the age groups that are most secure financially, with 100.0% of males and 100.0% of females in these age groups living above the poverty line.

| Age Bracket | Male | Female |
| Under 5 Years | 250 (97.3%) | 101 (100.0%) |
| 5 Years | 18 (100.0%) | 6 (46.2%) |
| 6 to 11 Years | 199 (100.0%) | 117 (100.0%) |
| 12 to 14 Years | 189 (95.5%) | 212 (100.0%) |
| 15 Years | 38 (53.5%) | 53 (98.2%) |
| 16 and 17 Years | 117 (90.7%) | 88 (100.0%) |
| 18 to 24 Years | 272 (89.2%) | 363 (97.1%) |
| 25 to 34 Years | 461 (99.1%) | 223 (97.8%) |
| 35 to 44 Years | 435 (100.0%) | 373 (92.3%) |
| 45 to 54 Years | 431 (87.6%) | 404 (84.3%) |
| 55 to 64 Years | 451 (86.4%) | 485 (88.7%) |
| 65 to 74 Years | 388 (96.0%) | 356 (92.5%) |
| 75 Years and over | 174 (81.7%) | 276 (88.5%) |
| Total | 3,423 (92.3%) | 3,057 (92.2%) |
Income Below Poverty Among Married-Couple Families in Pleasants County
The poverty statistics for married-couple families in Pleasants County show that 3.4% or 50 of the total 1,483 families live below the poverty line. Families with no children have the highest poverty rate of 4.9%, comprising of 50 families. On the other hand, families with 1 or 2 children have the lowest poverty rate of 0.0%, which includes 0 families.

| Children | Above Poverty | Below Poverty |
| No Children | 964 (95.1%) | 50 (4.9%) |
| 1 or 2 Children | 391 (100.0%) | 0 (0.0%) |
| 3 or 4 Children | 78 (100.0%) | 0 (0.0%) |
| 5 or more Children | 0 (0.0%) | 0 (0.0%) |
| Total | 1,433 (96.6%) | 50 (3.4%) |
Income Below Poverty Among Single-Parent Households in Pleasants County

| Children | Single Father | Single Mother |
| No Children | 0 (0.0%) | 10 (8.6%) |
| 1 or 2 Children | 0 (0.0%) | 66 (31.0%) |
| 3 or 4 Children | 0 (0.0%) | 0 (0.0%) |
| 5 or more Children | 0 (0.0%) | 0 (0.0%) |
| Total | 0 (0.0%) | 76 (22.6%) |
Income Below Poverty Among Married-Couple vs Single-Parent Households in Pleasants County
The poverty data for Pleasants County shows that 50 of the married-couple family households (3.4%) and 76 of the single-parent households (16.6%) are living below the poverty level. Within the married-couple family households, those with no children have the highest poverty rate, with 50 households (4.9%) falling below the poverty line. Among the single-parent households, those with 1 or 2 children have the highest poverty rate, with 66 household (22.8%) living below poverty.

| Children | Married-Couple Families | Single-Parent Households |
| No Children | 50 (4.9%) | 10 (6.9%) |
| 1 or 2 Children | 0 (0.0%) | 66 (22.8%) |
| 3 or 4 Children | 0 (0.0%) | 0 (0.0%) |
| 5 or more Children | 0 (0.0%) | 0 (0.0%) |
| Total | 50 (3.4%) | 76 (16.6%) |
Employment Characteristics in Pleasants County
Employment by Class of Employer in Pleasants County
Among the 2,989 employed individuals in Pleasants County, private company employees (1,935 | 64.7%), not-for-profit organizations (232 | 7.8%), and self-employed (not incorporated) (223 | 7.5%) make up the most common classes of employment.

| Employer Class | # Employees | % Employees |
| Private Company Employees | 1,935 | 64.7% |
| Self-Employed (Incorporated) | 76 | 2.5% |
| Self-Employed (Not Incorporated) | 223 | 7.5% |
| Not-for-profit Organizations | 232 | 7.8% |
| Local Government Employees | 200 | 6.7% |
| State Government Employees | 214 | 7.2% |
| Federal Government Employees | 91 | 3.0% |
| Unpaid Family Workers | 18 | 0.6% |
| Total | 2,989 | 100.0% |
Employment Status by Age in Pleasants County
According to the labor force statistics for Pleasants County, out of the total population over 16 years of age (6,376), 52.0% or 3,316 individuals are in the labor force, with 7.2% or 239 of them unemployed. The age group with the highest labor force participation rate is 30 to 34 years, with 83.0% or 356 individuals in the labor force. Within the labor force, the 20 to 24 years age range has the highest percentage of unemployed individuals, with 22.5% or 71 of them being unemployed.

| Age Bracket | In Labor Force | Unemployed |
| 16 to 19 Years | 153 (36.8%) | 13 (8.5%) |
| 20 to 24 Years | 315 (59.4%) | 71 (22.5%) |
| 25 to 29 Years | 289 (75.9%) | 0 (0.0%) |
| 30 to 34 Years | 356 (83.0%) | 14 (3.9%) |
| 35 to 44 Years | 635 (65.9%) | 35 (5.5%) |
| 45 to 54 Years | 773 (69.9%) | 65 (8.4%) |
| 55 to 59 Years | 431 (72.0%) | 27 (6.3%) |
| 60 to 64 Years | 236 (43.2%) | 15 (6.4%) |
| 65 to 74 Years | 122 (14.7%) | 0 (0.0%) |
| 75 Years and over | 4 (0.7%) | 0 (0.0%) |
| Total | 3,316 (52.0%) | 239 (7.2%) |
Employment Status by Educational Attainment in Pleasants County
According to labor force statistics for Pleasants County, 67.6% of individuals (2,721) out of the total population between 25 and 64 years of age (4,025) are in the labor force, with 5.7% or 155 of them being unemployed. The group with the highest labor force participation rate are those with the educational attainment of bachelor's degree or higher, with 85.3% or 400 individuals in the labor force. Within the labor force, individuals with less than high school education have the highest percentage of unemployment, with 14.5% or 36 of them being unemployed.

| Educational Attainment | In Labor Force | Unemployed |
| Less than High School | 248 (52.3%) | 69 (14.5%) |
| High School Diploma | 1,136 (60.4%) | 11 (0.6%) |
| College / Associate Degree | 936 (77.9%) | 145 (12.1%) |
| Bachelor's Degree or higher | 400 (85.3%) | 0 (0.0%) |
| Total | 2,721 (67.6%) | 229 (5.7%) |
Employment Occupations by Sex in Pleasants County
Management, Business, Science and Arts Occupations
The most common Management, Business, Science and Arts occupations in Pleasants County are Community & Social Service (269 | 8.7%), Management (205 | 6.7%), Education Instruction & Library (161 | 5.2%), Computers, Engineering & Science (141 | 4.6%), and Health Diagnosing & Treating (110 | 3.6%).

Management, Business, Science and Arts Occupations by Sex
Within the Management, Business, Science and Arts occupations in Pleasants County, the most male-oriented occupations are Computers & Mathematics (100.0%), Architecture & Engineering (93.6%), and Computers, Engineering & Science (89.4%), while the most female-oriented occupations are Business & Financial (90.5%), Health Diagnosing & Treating (88.2%), and Education, Arts & Media (87.5%).

| Occupation | Male | Female |
| Management | 125 (61.0%) | 80 (39.0%) |
| Business & Financial | 8 (9.5%) | 76 (90.5%) |
| Computers, Engineering & Science | 126 (89.4%) | 15 (10.6%) |
| Computers & Mathematics | 34 (100.0%) | 0 (0.0%) |
| Architecture & Engineering | 44 (93.6%) | 3 (6.4%) |
| Life, Physical & Social Science | 48 (80.0%) | 12 (20.0%) |
| Community & Social Service | 68 (25.3%) | 201 (74.7%) |
| Education, Arts & Media | 3 (12.5%) | 21 (87.5%) |
| Legal Services & Support | 6 (27.3%) | 16 (72.7%) |
| Education Instruction & Library | 22 (13.7%) | 139 (86.3%) |
| Arts, Media & Entertainment | 37 (59.7%) | 25 (40.3%) |
| Health Diagnosing & Treating | 13 (11.8%) | 97 (88.2%) |
| Health Technologists | 13 (18.1%) | 59 (81.9%) |
| Total (Category) | 340 (42.0%) | 469 (58.0%) |
| Total (Overall) | 1,703 (55.4%) | 1,371 (44.6%) |
Services Occupations
The most common Services occupations in Pleasants County are Healthcare Support (239 | 7.8%), Cleaning & Maintenance (123 | 4.0%), Food Preparation & Serving (120 | 3.9%), Personal Care & Service (103 | 3.4%), and Security & Protection (76 | 2.5%).

Services Occupations by Sex
Within the Services occupations in Pleasants County, the most male-oriented occupations are Firefighting & Prevention (100.0%), Cleaning & Maintenance (63.4%), and Security & Protection (38.2%), while the most female-oriented occupations are Healthcare Support (94.6%), Personal Care & Service (89.3%), and Law Enforcement (69.1%).

| Occupation | Male | Female |
| Healthcare Support | 13 (5.4%) | 226 (94.6%) |
| Security & Protection | 29 (38.2%) | 47 (61.8%) |
| Firefighting & Prevention | 8 (100.0%) | 0 (0.0%) |
| Law Enforcement | 21 (30.9%) | 47 (69.1%) |
| Food Preparation & Serving | 39 (32.5%) | 81 (67.5%) |
| Cleaning & Maintenance | 78 (63.4%) | 45 (36.6%) |
| Personal Care & Service | 11 (10.7%) | 92 (89.3%) |
| Total (Category) | 170 (25.7%) | 491 (74.3%) |
| Total (Overall) | 1,703 (55.4%) | 1,371 (44.6%) |
Sales and Office Occupations
The most common Sales and Office occupations in Pleasants County are Office & Administration (333 | 10.8%), and Sales & Related (171 | 5.6%).

Sales and Office Occupations by Sex

| Occupation | Male | Female |
| Sales & Related | 52 (30.4%) | 119 (69.6%) |
| Office & Administration | 133 (39.9%) | 200 (60.1%) |
| Total (Category) | 185 (36.7%) | 319 (63.3%) |
| Total (Overall) | 1,703 (55.4%) | 1,371 (44.6%) |
Natural Resources, Construction and Maintenance Occupations
The most common Natural Resources, Construction and Maintenance occupations in Pleasants County are Construction & Extraction (244 | 7.9%), Installation, Maintenance & Repair (58 | 1.9%), and Farming, Fishing & Forestry (18 | 0.6%).

Natural Resources, Construction and Maintenance Occupations by Sex

| Occupation | Male | Female |
| Farming, Fishing & Forestry | 18 (100.0%) | 0 (0.0%) |
| Construction & Extraction | 244 (100.0%) | 0 (0.0%) |
| Installation, Maintenance & Repair | 58 (100.0%) | 0 (0.0%) |
| Total (Category) | 320 (100.0%) | 0 (0.0%) |
| Total (Overall) | 1,703 (55.4%) | 1,371 (44.6%) |
Production, Transportation and Moving Occupations
The most common Production, Transportation and Moving occupations in Pleasants County are Production (337 | 11.0%), Transportation (255 | 8.3%), and Material Moving (188 | 6.1%).

Production, Transportation and Moving Occupations by Sex

| Occupation | Male | Female |
| Production | 300 (89.0%) | 37 (11.0%) |
| Transportation | 228 (89.4%) | 27 (10.6%) |
| Material Moving | 160 (85.1%) | 28 (14.9%) |
| Total (Category) | 688 (88.2%) | 92 (11.8%) |
| Total (Overall) | 1,703 (55.4%) | 1,371 (44.6%) |
Employment Industries by Sex in Pleasants County
Employment Industries in Pleasants County
The major employment industries in Pleasants County include Manufacturing (522 | 17.0%), Health Care & Social Assistance (433 | 14.1%), Transportation & Warehousing (276 | 9.0%), Educational Services (266 | 8.6%), and Retail Trade (238 | 7.7%).

Employment Industries by Sex in Pleasants County
The Pleasants County industries that see more men than women are Agriculture, Fishing & Hunting (100.0%), Wholesale Trade (100.0%), and Transportation & Warehousing (100.0%), whereas the industries that tend to have a higher number of women are Health Care & Social Assistance (91.2%), Finance & Insurance (90.5%), and Arts, Entertainment & Recreation (75.0%).

| Industry | Male | Female |
| Agriculture, Fishing & Hunting | 18 (100.0%) | 0 (0.0%) |
| Mining, Quarrying, & Extraction | 126 (85.1%) | 22 (14.9%) |
| Construction | 186 (96.4%) | 7 (3.6%) |
| Manufacturing | 440 (84.3%) | 82 (15.7%) |
| Wholesale Trade | 36 (100.0%) | 0 (0.0%) |
| Retail Trade | 95 (39.9%) | 143 (60.1%) |
| Transportation & Warehousing | 276 (100.0%) | 0 (0.0%) |
| Utilities | 65 (95.6%) | 3 (4.4%) |
| Information | 37 (51.4%) | 35 (48.6%) |
| Finance & Insurance | 6 (9.5%) | 57 (90.5%) |
| Real Estate, Rental & Leasing | 6 (27.3%) | 16 (72.7%) |
| Professional & Scientific | 69 (51.1%) | 66 (48.9%) |
| Enterprise Management | 0 (0.0%) | 0 (0.0%) |
| Administrative & Support | 102 (68.5%) | 47 (31.5%) |
| Educational Services | 69 (25.9%) | 197 (74.1%) |
| Health Care & Social Assistance | 38 (8.8%) | 395 (91.2%) |
| Arts, Entertainment & Recreation | 4 (25.0%) | 12 (75.0%) |
| Accommodation & Food Services | 39 (32.0%) | 83 (68.0%) |
| Public Administration | 59 (37.8%) | 97 (62.2%) |
| Total | 1,703 (55.4%) | 1,371 (44.6%) |
Education in Pleasants County
School Enrollment in Pleasants County
The most common levels of schooling among the 1,377 students in Pleasants County are high school (455 | 33.0%), middle school (390 | 28.3%), and elementary school (240 | 17.4%).

| School Level | # Students | % Students |
| Nursery / Preschool | 41 | 3.0% |
| Kindergarten | 26 | 1.9% |
| Elementary School | 240 | 17.4% |
| Middle School | 390 | 28.3% |
| High School | 455 | 33.0% |
| College / Undergraduate | 180 | 13.1% |
| Graduate / Professional | 45 | 3.3% |
| Total | 1,377 | 100.0% |
School Enrollment by Age by Funding Source in Pleasants County
Out of a total of 1,377 students who are enrolled in schools in Pleasants County, 92 (6.7%) attend a private institution, while the remaining 1,285 (93.3%) are enrolled in public schools. The age group of 20 to 24 year olds has the highest likelihood of being enrolled in private schools, with 30 (41.1% in the age bracket) enrolled. Conversely, the age group of 3 to 4 year olds has the lowest likelihood of being enrolled in a private school, with 18 (100.0% in the age bracket) attending a public institution.

| Age Bracket | Public School | Private School |
| 3 to 4 Year Olds | 18 (100.0%) | 0 (0.0%) |
| 5 to 9 Year Old | 250 (99.2%) | 2 (0.8%) |
| 10 to 14 Year Olds | 461 (94.1%) | 29 (5.9%) |
| 15 to 17 Year Olds | 325 (97.6%) | 8 (2.4%) |
| 18 to 19 Year Olds | 91 (100.0%) | 0 (0.0%) |
| 20 to 24 Year Olds | 43 (58.9%) | 30 (41.1%) |
| 25 to 34 Year Olds | 0 (0.0%) | 0 (0.0%) |
| 35 Years and over | 97 (80.8%) | 23 (19.2%) |
| Total | 1,285 (93.3%) | 92 (6.7%) |
Educational Attainment by Field of Study in Pleasants County
Education (243 | 36.3%), business (103 | 15.4%), science & technology (95 | 14.2%), communications (71 | 10.6%), and engineering (38 | 5.7%) are the most common fields of study among 669 individuals in Pleasants County who have obtained a bachelor's degree or higher.

| Field of Study | # Graduates | % Graduates |
| Computers & Mathematics | 0 | 0.0% |
| Bio, Nature & Agricultural | 26 | 3.9% |
| Physical & Health Sciences | 9 | 1.3% |
| Psychology | 0 | 0.0% |
| Social Sciences | 25 | 3.7% |
| Engineering | 38 | 5.7% |
| Multidisciplinary Studies | 21 | 3.1% |
| Science & Technology | 95 | 14.2% |
| Business | 103 | 15.4% |
| Education | 243 | 36.3% |
| Literature & Languages | 14 | 2.1% |
| Liberal Arts & History | 4 | 0.6% |
| Visual & Performing Arts | 0 | 0.0% |
| Communications | 71 | 10.6% |
| Arts & Humanities | 20 | 3.0% |
| Total | 669 | 100.0% |
Transportation & Commute in Pleasants County
Vehicle Availability by Sex in Pleasants County
The most prevalent vehicle ownership categories in Pleasants County are males with 2 vehicles (782, accounting for 47.6%) and females with 2 vehicles (757, making up 58.0%).

| Vehicles Available | Male | Female |
| No Vehicle | 8 (0.5%) | 9 (0.7%) |
| 1 Vehicle | 244 (14.9%) | 159 (11.8%) |
| 2 Vehicles | 782 (47.6%) | 757 (56.2%) |
| 3 Vehicles | 445 (27.1%) | 253 (18.8%) |
| 4 Vehicles | 98 (6.0%) | 123 (9.1%) |
| 5 or more Vehicles | 64 (3.9%) | 47 (3.5%) |
| Total | 1,641 (100.0%) | 1,348 (100.0%) |
Commute Time in Pleasants County
The most frequently occuring commute durations in Pleasants County are 30 to 34 minutes (505 commuters, 18.6%), 15 to 19 minutes (353 commuters, 13.0%), and 20 to 24 minutes (299 commuters, 11.0%).

| Commute Time | # Commuters | % Commuters |
| Less than 5 Minutes | 131 | 4.8% |
| 5 to 9 Minutes | 280 | 10.3% |
| 10 to 14 Minutes | 257 | 9.5% |
| 15 to 19 Minutes | 353 | 13.0% |
| 20 to 24 Minutes | 299 | 11.0% |
| 25 to 29 Minutes | 245 | 9.0% |
| 30 to 34 Minutes | 505 | 18.6% |
| 35 to 39 Minutes | 134 | 4.9% |
| 40 to 44 Minutes | 153 | 5.6% |
| 45 to 59 Minutes | 215 | 7.9% |
| 60 to 89 Minutes | 89 | 3.3% |
| 90 or more Minutes | 51 | 1.9% |
Commute Time by Sex in Pleasants County
The most common commute times in Pleasants County are 30 to 34 minutes (344 commuters, 22.1%) for males and 5 to 9 minutes (198 commuters, 17.1%) for females.

| Commute Time | Male | Female |
| Less than 5 Minutes | 46 (2.9%) | 85 (7.4%) |
| 5 to 9 Minutes | 82 (5.3%) | 198 (17.1%) |
| 10 to 14 Minutes | 98 (6.3%) | 159 (13.8%) |
| 15 to 19 Minutes | 272 (17.5%) | 81 (7.0%) |
| 20 to 24 Minutes | 125 (8.0%) | 174 (15.1%) |
| 25 to 29 Minutes | 132 (8.5%) | 113 (9.8%) |
| 30 to 34 Minutes | 344 (22.1%) | 161 (13.9%) |
| 35 to 39 Minutes | 74 (4.8%) | 60 (5.2%) |
| 40 to 44 Minutes | 100 (6.4%) | 53 (4.6%) |
| 45 to 59 Minutes | 171 (11.0%) | 44 (3.8%) |
| 60 to 89 Minutes | 62 (4.0%) | 27 (2.3%) |
| 90 or more Minutes | 51 (3.3%) | 0 (0.0%) |
Time of Departure to Work by Sex in Pleasants County
The most frequent times of departure to work in Pleasants County are 6:00 AM to 6:29 AM (471, 30.2%) for males and 7:00 AM to 7:29 AM (214, 18.5%) for females.

| Time of Departure | Male | Female |
| 12:00 AM to 4:59 AM | 182 (11.7%) | 30 (2.6%) |
| 5:00 AM to 5:29 AM | 145 (9.3%) | 23 (2.0%) |
| 5:30 AM to 5:59 AM | 180 (11.6%) | 26 (2.2%) |
| 6:00 AM to 6:29 AM | 471 (30.2%) | 72 (6.2%) |
| 6:30 AM to 6:59 AM | 74 (4.8%) | 106 (9.2%) |
| 7:00 AM to 7:29 AM | 81 (5.2%) | 214 (18.5%) |
| 7:30 AM to 7:59 AM | 221 (14.2%) | 169 (14.6%) |
| 8:00 AM to 8:29 AM | 17 (1.1%) | 114 (9.9%) |
| 8:30 AM to 8:59 AM | 17 (1.1%) | 29 (2.5%) |
| 9:00 AM to 9:59 AM | 12 (0.8%) | 73 (6.3%) |
| 10:00 AM to 10:59 AM | 17 (1.1%) | 37 (3.2%) |
| 11:00 AM to 11:59 AM | 0 (0.0%) | 0 (0.0%) |
| 12:00 PM to 3:59 PM | 20 (1.3%) | 90 (7.8%) |
| 4:00 PM to 11:59 PM | 120 (7.7%) | 172 (14.9%) |
| Total | 1,557 (100.0%) | 1,155 (100.0%) |
Housing Occupancy in Pleasants County
Occupancy by Ownership in Pleasants County
Of the total 2,737 dwellings in Pleasants County, owner-occupied units account for 2,339 (85.5%), while renter-occupied units make up 398 (14.5%).

| Occupancy | # Housing Units | % Housing Units |
| Owner Occupied Housing Units | 2,339 | 85.5% |
| Renter-Occupied Housing Units | 398 | 14.5% |
| Total Occupied Housing Units | 2,737 | 100.0% |
Occupancy by Household Size in Pleasants County

| Household Size | # Housing Units | % Housing Units |
| 1-Person Household | 645 | 23.6% |
| 2-Person Household | 1,205 | 44.0% |
| 3-Person Household | 490 | 17.9% |
| 4+ Person Household | 397 | 14.5% |
| Total Housing Units | 2,737 | 100.0% |
Occupancy by Ownership by Household Size in Pleasants County

| Household Size | Owner-occupied | Renter-occupied |
| 1-Person Household | 506 (78.4%) | 139 (21.5%) |
| 2-Person Household | 1,080 (89.6%) | 125 (10.4%) |
| 3-Person Household | 382 (78.0%) | 108 (22.0%) |
| 4+ Person Household | 371 (93.4%) | 26 (6.6%) |
| Total Housing Units | 2,339 (85.5%) | 398 (14.5%) |
Occupancy by Educational Attainment in Pleasants County

| Household Size | Owner-occupied | Renter-occupied |
| Less than High School | 81 (62.3%) | 49 (37.7%) |
| High School Diploma | 1,177 (84.3%) | 220 (15.8%) |
| College/Associate Degree | 752 (87.5%) | 107 (12.5%) |
| Bachelor's Degree or higher | 329 (93.7%) | 22 (6.3%) |
Occupancy by Age of Householder in Pleasants County

| Age Bracket | # Households | % Households |
| Under 35 Years | 399 | 14.6% |
| 35 to 44 Years | 426 | 15.6% |
| 45 to 54 Years | 500 | 18.3% |
| 55 to 64 Years | 629 | 23.0% |
| 65 to 74 Years | 419 | 15.3% |
| 75 to 84 Years | 226 | 8.3% |
| 85 Years and Over | 138 | 5.0% |
| Total | 2,737 | 100.0% |
Housing Finances in Pleasants County
Median Income by Occupancy in Pleasants County

| Occupancy Type | # Households | Median Income |
| Owner-Occupied | 2,339 (85.5%) | $68,219 |
| Renter-Occupied | 398 (14.5%) | $23,512 |
| Average | 2,737 (100.0%) | $59,666 |
Occupancy by Householder Income Bracket in Pleasants County

| Income Bracket | Owner-occupied | Renter-occupied |
| Less than $5,000 | 41 (1.8%) | 17 (4.3%) |
| $5,000 to $9,999 | 10 (0.4%) | 43 (10.8%) |
| $10,000 to $14,999 | 76 (3.3%) | 45 (11.3%) |
| $15,000 to $19,999 | 72 (3.1%) | 50 (12.6%) |
| $20,000 to $24,999 | 84 (3.6%) | 69 (17.3%) |
| $25,000 to $34,999 | 303 (13.0%) | 46 (11.6%) |
| $35,000 to $49,999 | 231 (9.9%) | 32 (8.0%) |
| $50,000 to $74,999 | 434 (18.5%) | 67 (16.8%) |
| $75,000 to $99,999 | 287 (12.3%) | 5 (1.3%) |
| $100,000 to $149,999 | 494 (21.1%) | 24 (6.0%) |
| $150,000 or more | 307 (13.1%) | 0 (0.0%) |
| Total | 2,339 (100.0%) | 398 (100.0%) |
Monthly Housing Cost Tiers in Pleasants County

| Monthly Cost | Owner-occupied | Renter-occupied |
| Less than $300 | 502 (21.5%) | 28 (7.0%) |
| $300 to $499 | 549 (23.5%) | 36 (9.0%) |
| $500 to $799 | 427 (18.3%) | 181 (45.5%) |
| $800 to $999 | 244 (10.4%) | 20 (5.0%) |
| $1,000 to $1,499 | 392 (16.8%) | 19 (4.8%) |
| $1,500 to $1,999 | 156 (6.7%) | 0 (0.0%) |
| $2,000 to $2,499 | 30 (1.3%) | 0 (0.0%) |
| $2,500 to $2,999 | 27 (1.1%) | 0 (0.0%) |
| $3,000 or more | 12 (0.5%) | 0 (0.0%) |
| Total | 2,339 (100.0%) | 398 (100.0%) |
Physical Housing Characteristics in Pleasants County
Housing Structures in Pleasants County

| Structure Type | # Housing Units | % Housing Units |
| Single Unit, Detached | 1,895 | 69.2% |
| Single Unit, Attached | 33 | 1.2% |
| 2 Unit Apartments | 12 | 0.4% |
| 3 or 4 Unit Apartments | 56 | 2.1% |
| 5 to 9 Unit Apartments | 79 | 2.9% |
| 10 or more Apartments | 11 | 0.4% |
| Mobile Home / Other | 651 | 23.8% |
| Total | 2,737 | 100.0% |
Housing Structures by Occupancy in Pleasants County

| Structure Type | Owner-occupied | Renter-occupied |
| Single Unit, Detached | 1,754 (92.6%) | 141 (7.4%) |
| Single Unit, Attached | 33 (100.0%) | 0 (0.0%) |
| 2 Unit Apartments | 0 (0.0%) | 12 (100.0%) |
| 3 or 4 Unit Apartments | 34 (60.7%) | 22 (39.3%) |
| 5 to 9 Unit Apartments | 0 (0.0%) | 79 (100.0%) |
| 10 or more Apartments | 0 (0.0%) | 11 (100.0%) |
| Mobile Home / Other | 518 (79.6%) | 133 (20.4%) |
| Total | 2,339 (85.5%) | 398 (14.5%) |
Housing Structures by Number of Rooms in Pleasants County

| Number of Rooms | Owner-occupied | Renter-occupied |
| 1 Room | 9 (0.4%) | 35 (8.8%) |
| 2 or 3 Rooms | 66 (2.8%) | 64 (16.1%) |
| 4 or 5 Rooms | 543 (23.2%) | 175 (44.0%) |
| 6 or 7 Rooms | 945 (40.4%) | 103 (25.9%) |
| 8 or more Rooms | 776 (33.2%) | 21 (5.3%) |
| Total | 2,339 (100.0%) | 398 (100.0%) |
Housing Structure by Heating Type in Pleasants County

| Heating Type | Owner-occupied | Renter-occupied |
| Utility Gas | 1,790 (76.5%) | 224 (56.3%) |
| Bottled, Tank, or LP Gas | 153 (6.5%) | 0 (0.0%) |
| Electricity | 290 (12.4%) | 164 (41.2%) |
| Fuel Oil or Kerosene | 0 (0.0%) | 0 (0.0%) |
| Coal or Coke | 0 (0.0%) | 0 (0.0%) |
| All other Fuels | 106 (4.5%) | 10 (2.5%) |
| No Fuel Used | 0 (0.0%) | 0 (0.0%) |
| Total | 2,339 (100.0%) | 398 (100.0%) |
Household Vehicle Usage in Pleasants County

| Vehicles per Household | Owner-occupied | Renter-occupied |
| No Vehicle | 56 (2.4%) | 64 (16.1%) |
| 1 Vehicle | 539 (23.0%) | 219 (55.0%) |
| 2 Vehicles | 1,088 (46.5%) | 102 (25.6%) |
| 3 or more Vehicles | 656 (28.1%) | 13 (3.3%) |
| Total | 2,339 (100.0%) | 398 (100.0%) |
Real Estate & Mortgages in Pleasants County
Real Estate and Mortgage Overview in Pleasants County
| Characteristic | Without Mortgage | With Mortgage |
| Housing Units | 1,266 | 1,073 |
| Median Property Value | $108,900 | $138,300 |
| Median Household Income | $59,267 | $165 |
| Monthly Housing Costs | $335 | $12 |
| Real Estate Taxes | $671 | $49 |
Property Value by Mortgage Status in Pleasants County

| Property Value | Without Mortgage | With Mortgage |
| Less than $50,000 | 233 (18.4%) | 160 (14.9%) |
| $50,000 to $99,999 | 322 (25.4%) | 180 (16.8%) |
| $100,000 to $299,999 | 617 (48.7%) | 660 (61.5%) |
| $300,000 to $499,999 | 53 (4.2%) | 38 (3.5%) |
| $500,000 to $749,999 | 41 (3.2%) | 35 (3.3%) |
| $750,000 to $999,999 | 0 (0.0%) | 0 (0.0%) |
| $1,000,000 or more | 0 (0.0%) | 0 (0.0%) |
| Total | 1,266 (100.0%) | 1,073 (100.0%) |
Household Income by Mortgage Status in Pleasants County

| Household Income | Without Mortgage | With Mortgage |
| Less than $10,000 | 51 (4.0%) | 7 (0.6%) |
| $10,000 to $24,999 | 158 (12.5%) | 0 (0.0%) |
| $25,000 to $34,999 | 157 (12.4%) | 74 (6.9%) |
| $35,000 to $49,999 | 118 (9.3%) | 146 (13.6%) |
| $50,000 to $74,999 | 265 (20.9%) | 113 (10.5%) |
| $75,000 to $99,999 | 123 (9.7%) | 169 (15.8%) |
| $100,000 to $149,999 | 252 (19.9%) | 164 (15.3%) |
| $150,000 or more | 142 (11.2%) | 242 (22.6%) |
| Total | 1,266 (100.0%) | 1,073 (100.0%) |
Property Value to Household Income Ratio in Pleasants County

| Value-to-Income Ratio | Without Mortgage | With Mortgage |
| Less than 2.0x | 745 (58.9%) | 80,573 (7,509.1%) |
| 2.0x to 2.9x | 142 (11.2%) | 668 (62.3%) |
| 3.0x to 3.9x | 123 (9.7%) | 213 (19.9%) |
| 4.0x or more | 243 (19.2%) | 40 (3.7%) |
| Total | 1,266 (100.0%) | 1,073 (100.0%) |
Real Estate Taxes by Mortgage Status in Pleasants County

| Property Taxes | Without Mortgage | With Mortgage |
| Less than $800 | 661 (52.2%) | 0 (0.0%) |
| $800 to $1,499 | 267 (21.1%) | 590 (55.0%) |
| $800 to $1,499 | 187 (14.8%) | 257 (23.9%) |
| Total | 1,266 (100.0%) | 1,073 (100.0%) |
Health & Disability in Pleasants County
Health Insurance Coverage by Age in Pleasants County

| Age Bracket | With Coverage | Without Coverage |
| Under 6 Years | 395 (100.0%) | 0 (0.0%) |
| 6 to 18 Years | 1,059 (96.6%) | 37 (3.4%) |
| 19 to 25 Years | 571 (69.6%) | 249 (30.4%) |
| 26 to 34 Years | 524 (100.0%) | 0 (0.0%) |
| 35 to 44 Years | 711 (84.7%) | 128 (15.3%) |
| 45 to 54 Years | 864 (89.0%) | 107 (11.0%) |
| 55 to 64 Years | 949 (88.8%) | 120 (11.2%) |
| 65 to 74 Years | 789 (100.0%) | 0 (0.0%) |
| 75 Years and older | 525 (100.0%) | 0 (0.0%) |
| Total | 6,387 (90.9%) | 641 (9.1%) |
Health Insurance Coverage by Citizenship Status in Pleasants County

| Citizenship Status | With Coverage | Without Coverage |
| Native Born | 395 (100.0%) | 0 (0.0%) |
| Foreign Born, Citizen | 1,059 (96.6%) | 37 (3.4%) |
| Foreign Born, not a Citizen | 571 (69.6%) | 249 (30.4%) |
Health Insurance Coverage by Household Income in Pleasants County

| Household Income | With Coverage | Without Coverage |
| Under $25,000 | 736 (92.3%) | 61 (7.6%) |
| $25,000 to $49,999 | 1,100 (88.8%) | 138 (11.2%) |
| $50,000 to $74,999 | 1,123 (85.1%) | 197 (14.9%) |
| $75,000 to $99,999 | 1,010 (95.9%) | 43 (4.1%) |
| $100,000 and over | 2,418 (92.3%) | 202 (7.7%) |
Public vs Private Health Insurance Coverage by Age in Pleasants County

| Age Bracket | Public Insurance | Private Insurance |
| Under 6 | 242 (61.3%) | 153 (38.7%) |
| 6 to 18 Years | 504 (46.0%) | 622 (56.8%) |
| 19 to 25 Years | 203 (24.8%) | 393 (47.9%) |
| 25 to 34 Years | 121 (23.1%) | 440 (84.0%) |
| 35 to 44 Years | 240 (28.6%) | 518 (61.7%) |
| 45 to 54 Years | 189 (19.5%) | 707 (72.8%) |
| 55 to 64 Years | 308 (28.8%) | 700 (65.5%) |
| 65 to 74 Years | 779 (98.7%) | 515 (65.3%) |
| 75 Years and over | 525 (100.0%) | 334 (63.6%) |
| Total | 3,111 (44.3%) | 4,382 (62.4%) |
Disability Status by Sex by Age in Pleasants County

| Age Bracket | Male | Female |
| Under 5 Years | 0 (0.0%) | 0 (0.0%) |
| 5 to 17 Years | 84 (13.7%) | 8 (1.7%) |
| 18 to 34 Years | 38 (4.9%) | 32 (5.3%) |
| 35 to 64 Years | 247 (17.1%) | 291 (20.3%) |
| 65 to 74 Years | 142 (35.1%) | 133 (34.5%) |
| 75 Years and over | 134 (62.9%) | 182 (58.3%) |
Disability Class by Sex by Age in Pleasants County
Disability Class: Hearing Difficulty

| Age Bracket | Male | Female |
| Under 5 Years | 0 (0.0%) | 0 (0.0%) |
| 5 to 17 Years | 0 (0.0%) | 7 (1.5%) |
| 18 to 34 Years | 0 (0.0%) | 0 (0.0%) |
| 35 to 64 Years | 103 (7.1%) | 43 (3.0%) |
| 65 to 74 Years | 87 (21.5%) | 30 (7.8%) |
| 75 Years and over | 82 (38.5%) | 104 (33.3%) |
Disability Class: Vision Difficulty

| Age Bracket | Male | Female |
| Under 5 Years | 0 (0.0%) | 0 (0.0%) |
| 5 to 17 Years | 56 (9.1%) | 7 (1.5%) |
| 18 to 34 Years | 0 (0.0%) | 32 (5.3%) |
| 35 to 64 Years | 48 (3.3%) | 71 (5.0%) |
| 65 to 74 Years | 19 (4.7%) | 21 (5.4%) |
| 75 Years and over | 19 (8.9%) | 73 (23.4%) |
Disability Class: Cognitive Difficulty

| Age Bracket | Male | Female |
| 5 to 17 Years | 82 (13.3%) | 1 (0.2%) |
| 18 to 34 Years | 38 (4.9%) | 0 (0.0%) |
| 35 to 64 Years | 50 (3.5%) | 94 (6.6%) |
| 65 to 74 Years | 35 (8.7%) | 30 (7.8%) |
| 75 Years and over | 25 (11.7%) | 41 (13.1%) |
Disability Class: Ambulatory Difficulty

| Age Bracket | Male | Female |
| 5 to 17 Years | 40 (6.5%) | 0 (0.0%) |
| 18 to 34 Years | 13 (1.7%) | 0 (0.0%) |
| 35 to 64 Years | 113 (7.8%) | 133 (9.3%) |
| 65 to 74 Years | 74 (18.3%) | 118 (30.6%) |
| 75 Years and over | 93 (43.7%) | 115 (36.9%) |
Disability Class: Self-Care Difficulty

| Age Bracket | Male | Female |
| 5 to 17 Years | 58 (9.4%) | 0 (0.0%) |
| 18 to 34 Years | 0 (0.0%) | 0 (0.0%) |
| 35 to 64 Years | 46 (3.2%) | 14 (1.0%) |
| 65 to 74 Years | 0 (0.0%) | 20 (5.2%) |
| 75 Years and over | 38 (17.8%) | 95 (30.4%) |
Technology Access in Pleasants County
Computing Device Access in Pleasants County

| Device Type | # Households | % Households |
| Desktop or Laptop | 1,987 | 72.6% |
| Smartphone | 2,135 | 78.0% |
| Tablet | 1,496 | 54.7% |
| No Computing Device | 264 | 9.7% |
| Total | 2,737 | 100.0% |
Internet Access in Pleasants County

| Internet Type | # Households | % Households |
| Dial-Up Internet | 36 | 1.3% |
| Broadband Home | 1,994 | 72.9% |
| Cellular Data Only | 209 | 7.6% |
| Satellite Internet | 200 | 7.3% |
| No Internet | 366 | 13.4% |
| Total | 2,737 | 100.0% |
Pleasants County Summary
Pleasants County is located in the northern panhandle of West Virginia, and is bordered by Tyler County to the north, Ritchie County to the east, Wood County to the south, and Washington County, Ohio to the west. The county seat is St. Marys, and the county was created in 1851 from portions of Tyler and Wood counties. The county was named for James Pleasants, who served as Governor of Virginia from 1822 to 1825.
Geography
Pleasants County has a total area of 181 square miles, of which 178 square miles is land and 3 square miles (1.7%) is water. The county is located in the Appalachian Plateau region of West Virginia, and is characterized by rolling hills and valleys. The Ohio River forms the western border of the county, and the Little Kanawha River flows through the county from north to south. The highest point in the county is located at the summit of Bald Knob, which has an elevation of 1,717 feet.
Economy
The economy of Pleasants County is largely based on agriculture and natural resources. The county is home to several large farms, and the primary crops grown in the county are corn, soybeans, hay, and wheat. The county also has a large timber industry, and is home to several sawmills and wood-processing plants. The county is also home to several oil and gas wells, and the county's economy is bolstered by the presence of several large industrial plants, including a paper mill and a chemical plant.
Demographics
As of the 2010 United States Census, there were 7,605 people, 3,072 households, and 2,093 families residing in the county. The population density was 42.9 people per square mile. The racial makeup of the county was 97.3% White, 0.7% Black or African American, 0.2% Native American, 0.2% Asian, 0.1% Pacific Islander, 0.2% from other races, and 1.3% from two or more races. 1.3% of the population were Hispanic or Latino of any race.
The median income for a household in the county was $33,906, and the median income for a family was $41,944. The per capita income for the county was $17,845. About 13.2% of families and 16.7% of the population were below the poverty line, including 22.2% of those under age 18 and 11.2% of those age 65 or over.
Conclusion
Pleasants County is a rural county located in the northern panhandle of West Virginia. The county is characterized by rolling hills and valleys, and is home to several large farms, timber operations, and industrial plants. The county's economy is largely based on agriculture and natural resources, and the population is predominantly white. The median income for a household in the county is lower than the national average, and a significant portion of the population is below the poverty line.
Common Questions
What is the Total Population of Pleasants County?
Total Population of Pleasants County is 7,622.
What is the Total Male Population of Pleasants County?
Total Male Population of Pleasants County is 4,269.
What is the Total Female Population of Pleasants County?
Total Female Population of Pleasants County is 3,353.
What is the Ratio of Males per 100 Females in Pleasants County?
There are 127.32 Males per 100 Females in Pleasants County.
What is the Ratio of Females per 100 Males in Pleasants County?
There are 78.54 Females per 100 Males in Pleasants County.
What is the Median Population Age in Pleasants County?
Median Population Age in Pleasants County is 43.6 Years.
What is the Average Family Size in Pleasants County
Average Family Size in Pleasants County is 3.0 People.
What is the Average Household Size in Pleasants County
Average Household Size in Pleasants County is 2.6 People.
What is Per Capita Income in Pleasants County?
Per Capita income in Pleasants County is $39,138.
What is the Median Family Income in Pleasants County?
Median Family Income in Pleasants County is $76,622.
What is the Median Household income in Pleasants County?
Median Household Income in Pleasants County is $59,666.
What is Income or Wage Gap in Pleasants County?
Income or Wage Gap in Pleasants County is 40.2%.
Women in Pleasants County earn 59.8 cents for every dollar earned by a man.
What is Family Income Deficit in Pleasants County?
Family Income Deficit in Pleasants County is $5,802.
Families that are below poverty line in Pleasants County earn $5,802 less on average than the poverty threshold level.
What is Inequality or Gini Index in Pleasants County?
Inequality or Gini Index in Pleasants County is 0.56.
How Large is the Labor Force in Pleasants County?
There are 3,316 People in the Labor Forcein in Pleasants County.
What is the Percentage of People in the Labor Force in Pleasants County?
52.0% of People are in the Labor Force in Pleasants County.
What is the Unemployment Rate in Pleasants County?
Unemployment Rate in Pleasants County is 7.2%.