Ohio County, WV
Ohio County Map
Ohio County Overview
42,224
TOTAL POPULATION
20,497
MALE POPULATION
21,727
FEMALE POPULATION
94.34
MALES / 100 FEMALES
106.00
FEMALES / 100 MALES
43.1
MEDIAN AGE
3.0
AVG FAMILY SIZE
2.3
AVG HOUSEHOLD SIZE
$36,191
PER CAPITA INCOME
$85,875
AVG FAMILY INCOME
$55,521
AVG HOUSEHOLD INCOME
29.8%
WAGE / INCOME GAP [ % ]
70.2¢/ $1
WAGE / INCOME GAP [ $ ]
$9,558
FAMILY INCOME DEFICIT
0.51
INEQUALITY / GINI INDEX
19,878
LABOR FORCE [ PEOPLE ]
56.7%
PERCENT IN LABOR FORCE
5.3%
UNEMPLOYMENT RATE
Ohio County Area Codes
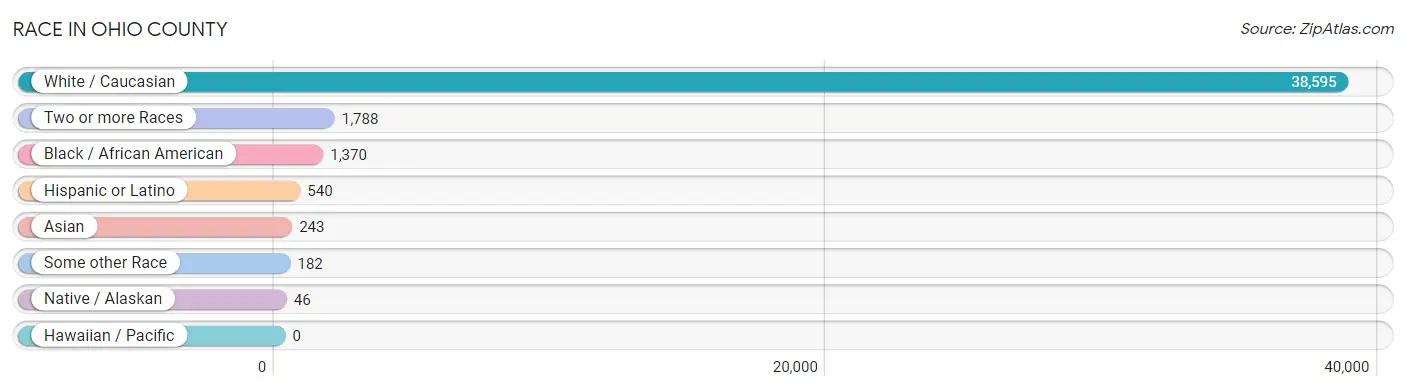
Race in Ohio County
The most populous races in Ohio County are White / Caucasian (38,595 | 91.4%), Two or more Races (1,788 | 4.2%), and Black / African American (1,370 | 3.2%).
| Race | # Population | % Population |
| Asian | 243 | 0.6% |
| Black / African American | 1,370 | 3.2% |
| Hawaiian / Pacific | 0 | 0.0% |
| Hispanic or Latino | 540 | 1.3% |
| Native / Alaskan | 46 | 0.1% |
| White / Caucasian | 38,595 | 91.4% |
| Two or more Races | 1,788 | 4.2% |
| Some other Race | 182 | 0.4% |
| Total | 42,224 | 100.0% |
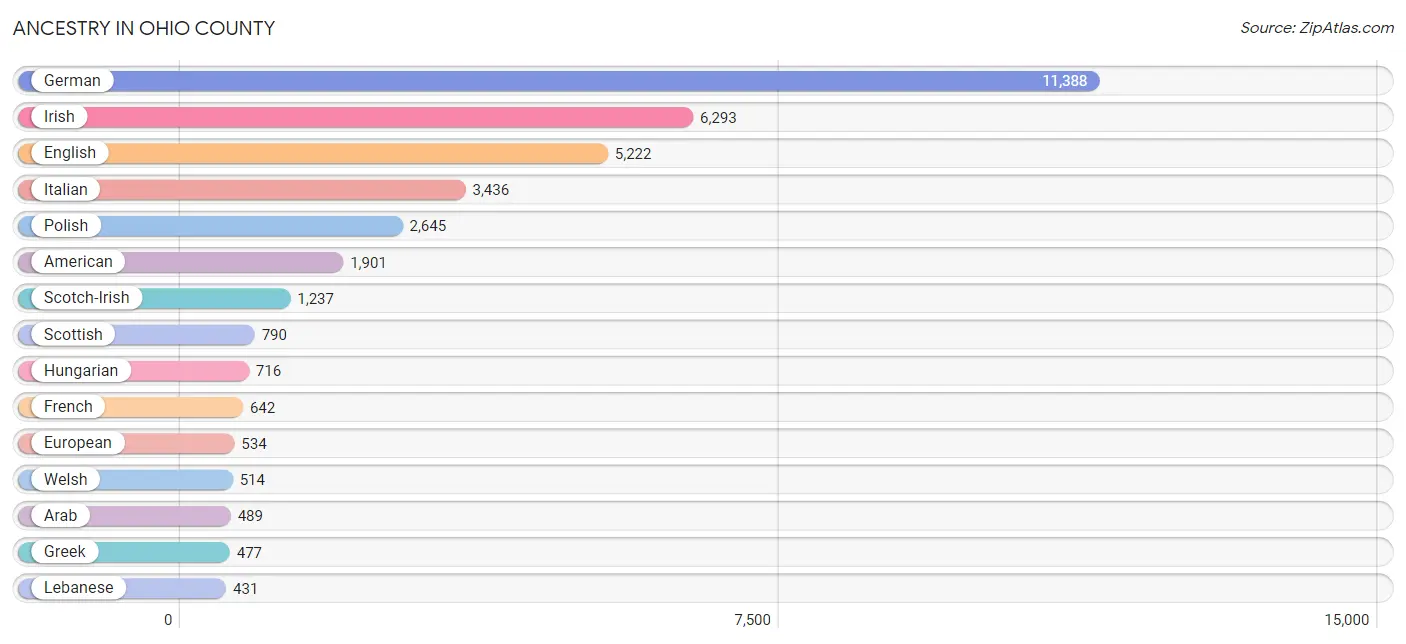
Ancestry in Ohio County
The most populous ancestries reported in Ohio County are German (11,388 | 27.0%), Irish (6,293 | 14.9%), English (5,222 | 12.4%), Italian (3,436 | 8.1%), and Polish (2,645 | 6.3%), together accounting for 68.6% of all Ohio County residents.
| Ancestry | # Population | % Population |
| African | 165 | 0.4% |
| American | 1,901 | 4.5% |
| Apache | 8 | 0.0% |
| Arab | 489 | 1.2% |
| Argentinean | 16 | 0.0% |
| Assyrian / Chaldean / Syriac | 8 | 0.0% |
| Australian | 44 | 0.1% |
| Austrian | 143 | 0.3% |
| Basque | 15 | 0.0% |
| Belgian | 12 | 0.0% |
| Bhutanese | 66 | 0.2% |
| Blackfeet | 7 | 0.0% |
| Brazilian | 120 | 0.3% |
| British | 157 | 0.4% |
| Burmese | 36 | 0.1% |
| Canadian | 30 | 0.1% |
| Central American Indian | 7 | 0.0% |
| Cherokee | 56 | 0.1% |
| Colombian | 32 | 0.1% |
| Creek | 6 | 0.0% |
| Croatian | 224 | 0.5% |
| Cuban | 25 | 0.1% |
| Czech | 202 | 0.5% |
| Czechoslovakian | 82 | 0.2% |
| Danish | 5 | 0.0% |
| Dominican | 34 | 0.1% |
| Dutch | 280 | 0.7% |
| Eastern European | 72 | 0.2% |
| English | 5,222 | 12.4% |
| European | 534 | 1.3% |
| Filipino | 5 | 0.0% |
| Finnish | 27 | 0.1% |
| French | 642 | 1.5% |
| French Canadian | 53 | 0.1% |
| German | 11,388 | 27.0% |
| Greek | 477 | 1.1% |
| Guamanian / Chamorro | 4 | 0.0% |
| Guyanese | 28 | 0.1% |
| Haitian | 86 | 0.2% |
| Hungarian | 716 | 1.7% |
| Indian (Asian) | 79 | 0.2% |
| Iranian | 39 | 0.1% |
| Iraqi | 8 | 0.0% |
| Irish | 6,293 | 14.9% |
| Israeli | 18 | 0.0% |
| Italian | 3,436 | 8.1% |
| Jamaican | 15 | 0.0% |
| Korean | 175 | 0.4% |
| Laotian | 1 | 0.0% |
| Lebanese | 431 | 1.0% |
| Lithuanian | 63 | 0.2% |
| Luxembourger | 8 | 0.0% |
| Mexican | 206 | 0.5% |
| Mexican American Indian | 55 | 0.1% |
| Nigerian | 16 | 0.0% |
| Northern European | 37 | 0.1% |
| Norwegian | 165 | 0.4% |
| Pakistani | 34 | 0.1% |
| Pennsylvania German | 5 | 0.0% |
| Polish | 2,645 | 6.3% |
| Portuguese | 43 | 0.1% |
| Puerto Rican | 24 | 0.1% |
| Romanian | 97 | 0.2% |
| Russian | 237 | 0.6% |
| Scandinavian | 92 | 0.2% |
| Scotch-Irish | 1,237 | 2.9% |
| Scottish | 790 | 1.9% |
| Seminole | 3 | 0.0% |
| Serbian | 13 | 0.0% |
| Shoshone | 2 | 0.0% |
| Slavic | 30 | 0.1% |
| Slovak | 409 | 1.0% |
| Slovene | 17 | 0.0% |
| South American | 63 | 0.2% |
| Spaniard | 44 | 0.1% |
| Spanish | 140 | 0.3% |
| Subsaharan African | 181 | 0.4% |
| Swedish | 211 | 0.5% |
| Swiss | 161 | 0.4% |
| Syrian | 56 | 0.1% |
| Thai | 41 | 0.1% |
| Turkish | 21 | 0.1% |
| Ukrainian | 69 | 0.2% |
| Venezuelan | 15 | 0.0% |
| Vietnamese | 4 | 0.0% |
| Welsh | 514 | 1.2% |
| West Indian | 3 | 0.0% |
| Yugoslavian | 38 | 0.1% | View All 88 Rows |
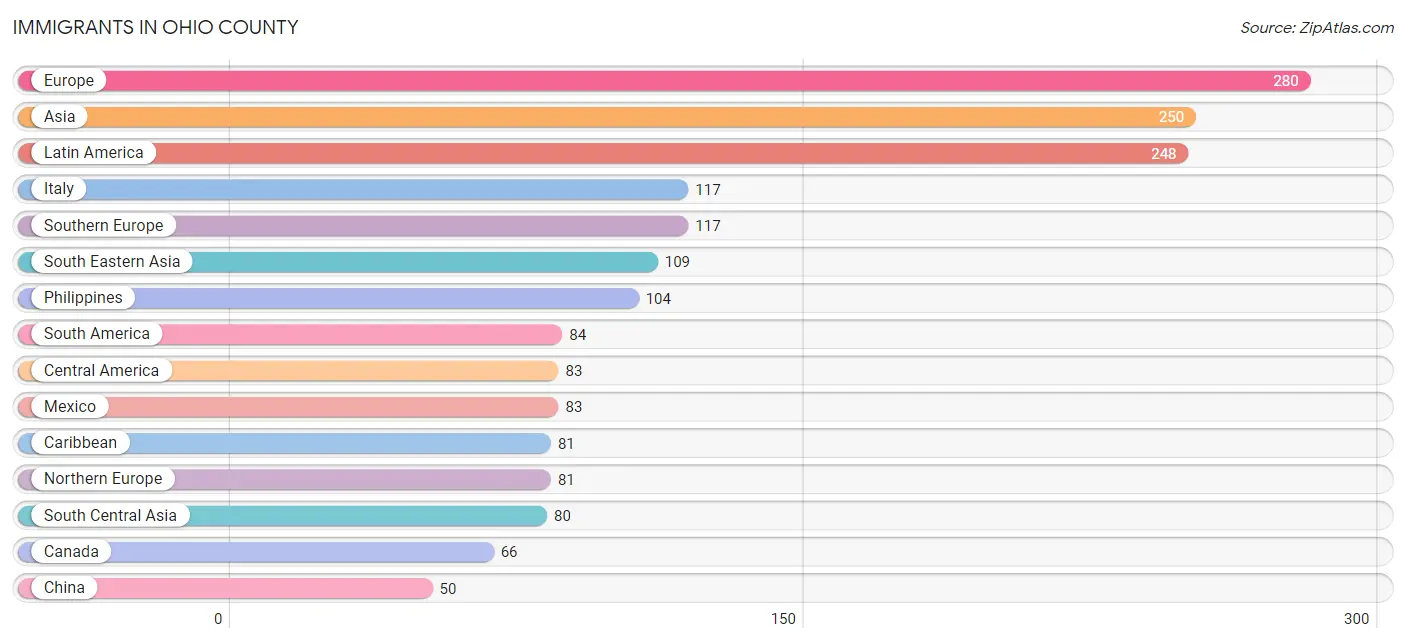
Immigrants in Ohio County
The most numerous immigrant groups reported in Ohio County came from Europe (280 | 0.7%), Asia (250 | 0.6%), Latin America (248 | 0.6%), Italy (117 | 0.3%), and Southern Europe (117 | 0.3%), together accounting for 2.4% of all Ohio County residents.
| Immigration Origin | # Population | % Population |
| Argentina | 16 | 0.0% |
| Asia | 250 | 0.6% |
| Australia | 16 | 0.0% |
| Bangladesh | 4 | 0.0% |
| Brazil | 43 | 0.1% |
| Canada | 66 | 0.2% |
| Caribbean | 81 | 0.2% |
| Central America | 83 | 0.2% |
| China | 50 | 0.1% |
| Colombia | 17 | 0.0% |
| Dominican Republic | 50 | 0.1% |
| Eastern Asia | 50 | 0.1% |
| Eastern Europe | 48 | 0.1% |
| England | 11 | 0.0% |
| Europe | 280 | 0.7% |
| France | 16 | 0.0% |
| Germany | 18 | 0.0% |
| Haiti | 28 | 0.1% |
| Hong Kong | 17 | 0.0% |
| India | 34 | 0.1% |
| Indonesia | 5 | 0.0% |
| Iran | 39 | 0.1% |
| Ireland | 2 | 0.0% |
| Italy | 117 | 0.3% |
| Jamaica | 3 | 0.0% |
| Kazakhstan | 3 | 0.0% |
| Latin America | 248 | 0.6% |
| Lebanon | 11 | 0.0% |
| Mexico | 83 | 0.2% |
| Moldova | 15 | 0.0% |
| Northern Europe | 81 | 0.2% |
| Oceania | 16 | 0.0% |
| Philippines | 104 | 0.3% |
| Russia | 12 | 0.0% |
| South America | 84 | 0.2% |
| South Central Asia | 80 | 0.2% |
| South Eastern Asia | 109 | 0.3% |
| Southern Europe | 117 | 0.3% |
| Taiwan | 5 | 0.0% |
| Venezuela | 8 | 0.0% |
| Western Asia | 11 | 0.0% |
| Western Europe | 34 | 0.1% | View All 42 Rows |
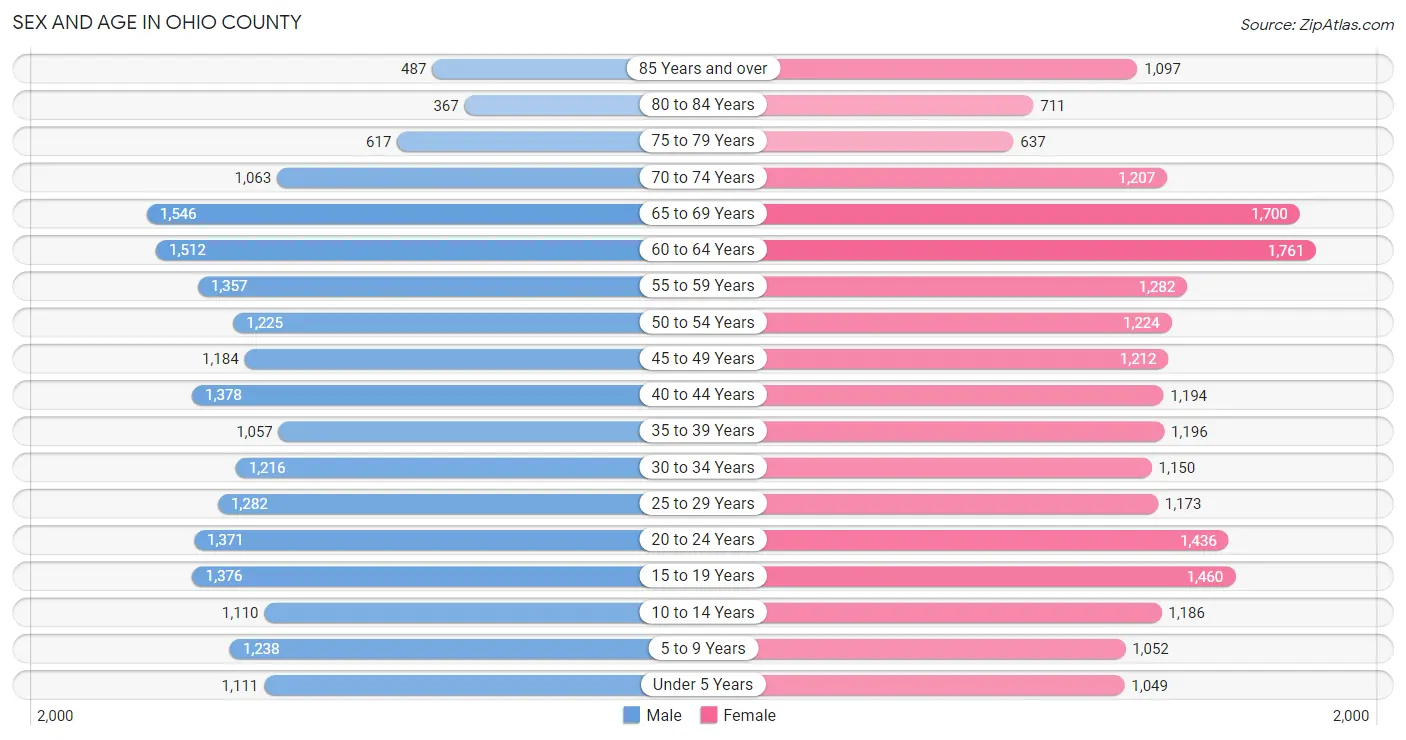
Sex and Age in Ohio County
Sex and Age in Ohio County
The most populous age groups in Ohio County are 65 to 69 Years (1,546 | 7.5%) for men and 60 to 64 Years (1,761 | 8.1%) for women.
| Age Bracket | Male | Female |
| Under 5 Years | 1,111 (5.4%) | 1,049 (4.8%) |
| 5 to 9 Years | 1,238 (6.0%) | 1,052 (4.8%) |
| 10 to 14 Years | 1,110 (5.4%) | 1,186 (5.5%) |
| 15 to 19 Years | 1,376 (6.7%) | 1,460 (6.7%) |
| 20 to 24 Years | 1,371 (6.7%) | 1,436 (6.6%) |
| 25 to 29 Years | 1,282 (6.2%) | 1,173 (5.4%) |
| 30 to 34 Years | 1,216 (5.9%) | 1,150 (5.3%) |
| 35 to 39 Years | 1,057 (5.2%) | 1,196 (5.5%) |
| 40 to 44 Years | 1,378 (6.7%) | 1,194 (5.5%) |
| 45 to 49 Years | 1,184 (5.8%) | 1,212 (5.6%) |
| 50 to 54 Years | 1,225 (6.0%) | 1,224 (5.6%) |
| 55 to 59 Years | 1,357 (6.6%) | 1,282 (5.9%) |
| 60 to 64 Years | 1,512 (7.4%) | 1,761 (8.1%) |
| 65 to 69 Years | 1,546 (7.5%) | 1,700 (7.8%) |
| 70 to 74 Years | 1,063 (5.2%) | 1,207 (5.6%) |
| 75 to 79 Years | 617 (3.0%) | 637 (2.9%) |
| 80 to 84 Years | 367 (1.8%) | 711 (3.3%) |
| 85 Years and over | 487 (2.4%) | 1,097 (5.1%) |
| Total | 20,497 (100.0%) | 21,727 (100.0%) |
Families and Households in Ohio County
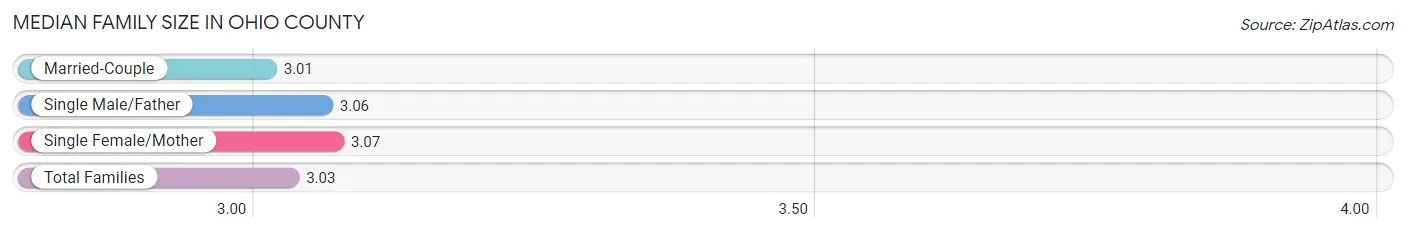
Median Family Size in Ohio County
The median family size in Ohio County is 3.03 persons per family, with single female/mother families (1,871 | 18.7%) accounting for the largest median family size of 3.07 persons per family. On the other hand, married-couple families (7,395 | 74.1%) represent the smallest median family size with 3.01 persons per family.
| Family Type | # Families | Family Size |
| Married-Couple | 7,395 (74.1%) | 3.01 |
| Single Male/Father | 720 (7.2%) | 3.06 |
| Single Female/Mother | 1,871 (18.7%) | 3.07 |
| Total Families | 9,986 (100.0%) | 3.03 |
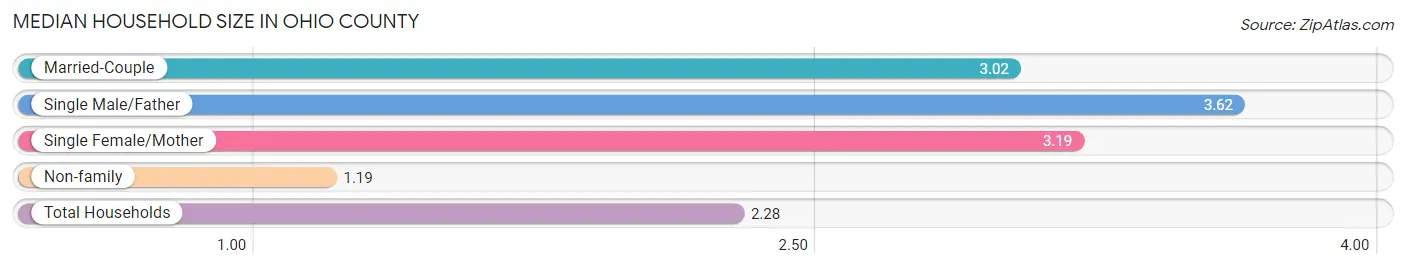
Median Household Size in Ohio County
The median household size in Ohio County is 2.28 persons per household, with single male/father households (720 | 4.1%) accounting for the largest median household size of 3.62 persons per household. non-family households (7,501 | 42.9%) represent the smallest median household size with 1.19 persons per household.
| Household Type | # Households | Household Size |
| Married-Couple | 7,395 (42.3%) | 3.02 |
| Single Male/Father | 720 (4.1%) | 3.62 |
| Single Female/Mother | 1,871 (10.7%) | 3.19 |
| Non-family | 7,501 (42.9%) | 1.19 |
| Total Households | 17,487 (100.0%) | 2.28 |
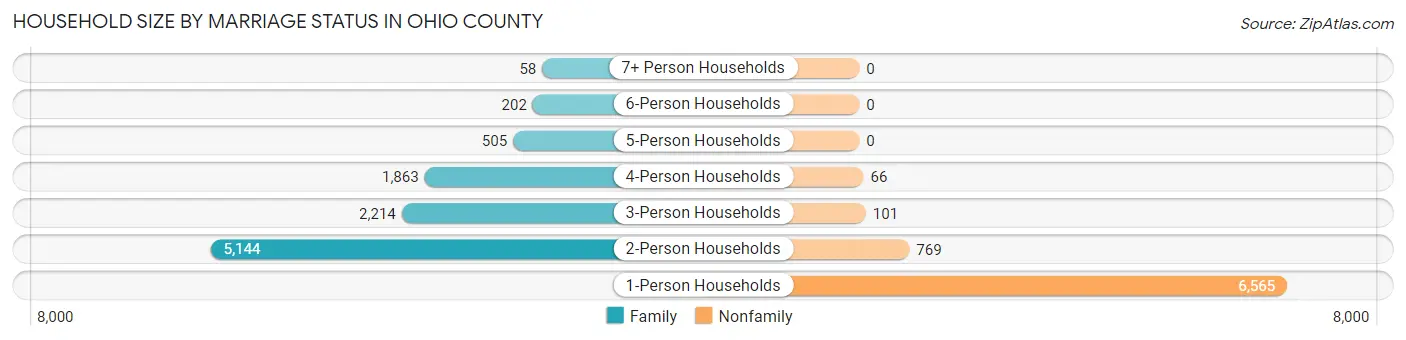
Household Size by Marriage Status in Ohio County
Out of a total of 17,487 households in Ohio County, 9,986 (57.1%) are family households, while 7,501 (42.9%) are nonfamily households. The most numerous type of family households are 2-person households, comprising 5,144, and the most common type of nonfamily households are 1-person households, comprising 6,565.
| Household Size | Family Households | Nonfamily Households |
| 1-Person Households | - | 6,565 (37.5%) |
| 2-Person Households | 5,144 (29.4%) | 769 (4.4%) |
| 3-Person Households | 2,214 (12.7%) | 101 (0.6%) |
| 4-Person Households | 1,863 (10.6%) | 66 (0.4%) |
| 5-Person Households | 505 (2.9%) | 0 (0.0%) |
| 6-Person Households | 202 (1.2%) | 0 (0.0%) |
| 7+ Person Households | 58 (0.3%) | 0 (0.0%) |
| Total | 9,986 (57.1%) | 7,501 (42.9%) |
Female Fertility in Ohio County
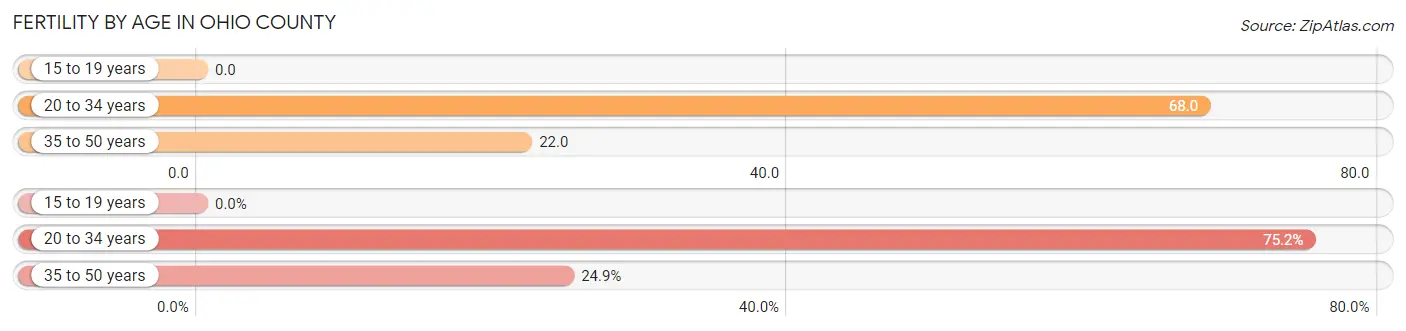
Fertility by Age in Ohio County
Average fertility rate in Ohio County is 38.0 births per 1,000 women. Women in the age bracket of 20 to 34 years have the highest fertility rate with 68.0 births per 1,000 women. Women in the age bracket of 20 to 34 years acount for 75.1% of all women with births.
| Age Bracket | Women with Births | Births / 1,000 Women |
| 15 to 19 years | 0 (0.0%) | 0.0 |
| 20 to 34 years | 257 (75.1%) | 68.0 |
| 35 to 50 years | 85 (24.8%) | 22.0 |
| Total | 342 (100.0%) | 38.0 |
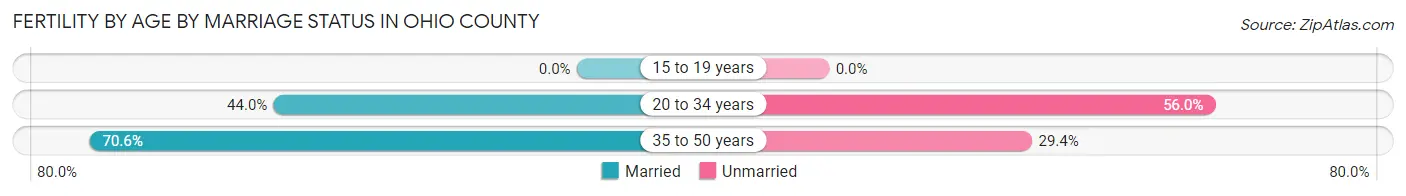
Fertility by Age by Marriage Status in Ohio County
50.6% of women with births (342) in Ohio County are married. The highest percentage of unmarried women with births falls into 20 to 34 years age bracket with 56.0% of them unmarried at the time of birth, while the lowest percentage of unmarried women with births belong to 35 to 50 years age bracket with 29.4% of them unmarried.
| Age Bracket | Married | Unmarried |
| 15 to 19 years | 0 (0.0%) | 0 (0.0%) |
| 20 to 34 years | 113 (44.0%) | 144 (56.0%) |
| 35 to 50 years | 60 (70.6%) | 25 (29.4%) |
| Total | 173 (50.6%) | 169 (49.4%) |
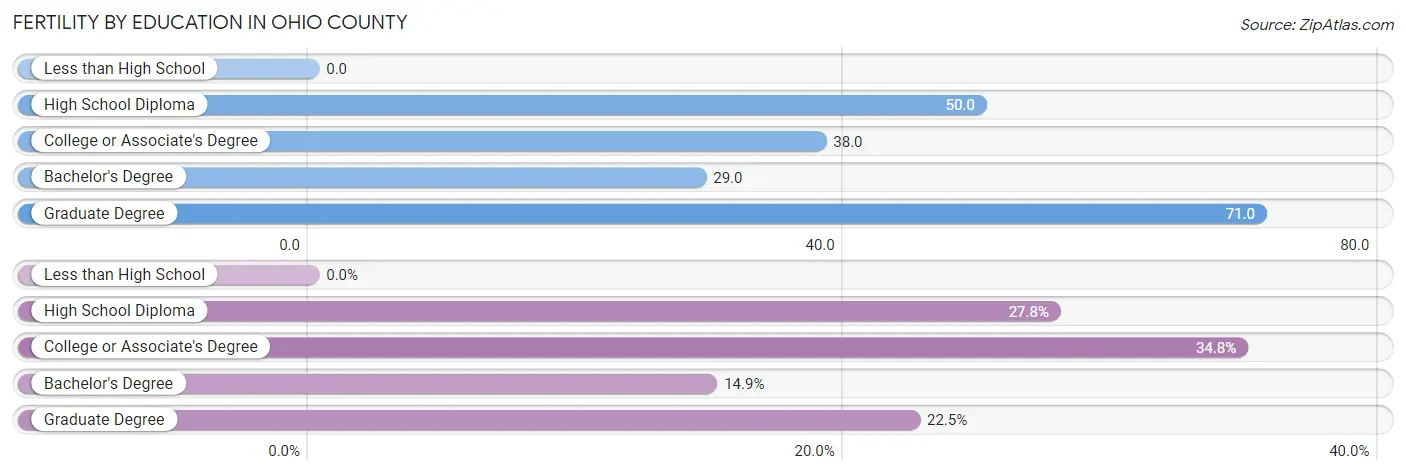
Fertility by Education in Ohio County
| Educational Attainment | Women with Births | Births / 1,000 Women |
| Less than High School | 0 (0.0%) | 0.0 |
| High School Diploma | 95 (27.8%) | 50.0 |
| College or Associate's Degree | 119 (34.8%) | 38.0 |
| Bachelor's Degree | 51 (14.9%) | 29.0 |
| Graduate Degree | 77 (22.5%) | 71.0 |
| Total | 342 (100.0%) | 38.0 |
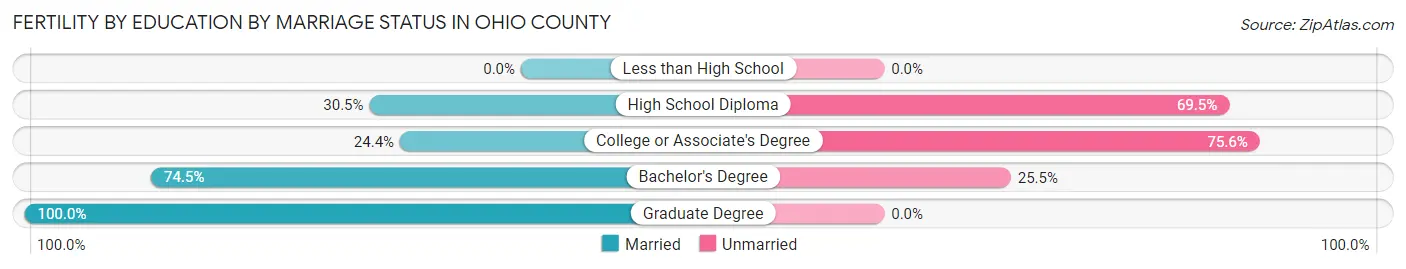
Fertility by Education by Marriage Status in Ohio County
49.4% of women with births in Ohio County are unmarried. Women with the educational attainment of graduate degree are most likely to be married with 100.0% of them married at childbirth, while women with the educational attainment of college or associate's degree are least likely to be married with 75.6% of them unmarried at childbirth.
| Educational Attainment | Married | Unmarried |
| Less than High School | 0 (0.0%) | 0 (0.0%) |
| High School Diploma | 29 (30.5%) | 66 (69.5%) |
| College or Associate's Degree | 29 (24.4%) | 90 (75.6%) |
| Bachelor's Degree | 38 (74.5%) | 13 (25.5%) |
| Graduate Degree | 77 (100.0%) | 0 (0.0%) |
| Total | 173 (50.6%) | 169 (49.4%) |
Income in Ohio County
Income Overview in Ohio County
Per Capita Income in Ohio County is $36,191, while median incomes of families and households are $85,875 and $55,521 respectively.
| Characteristic | Number | Measure |
| Per Capita Income | 42,224 | $36,191 |
| Median Family Income | 9,986 | $85,875 |
| Mean Family Income | 9,986 | $104,564 |
| Median Household Income | 17,487 | $55,521 |
| Mean Household Income | 17,487 | $83,215 |
| Income Deficit | 9,986 | $9,558 |
| Wage / Income Gap (%) | 42,224 | 29.81% |
| Wage / Income Gap ($) | 42,224 | 70.19¢ per $1 |
| Gini / Inequality Index | 42,224 | 0.51 |
Earnings by Sex in Ohio County
Average Earnings in Ohio County are $33,572, $40,046 for men and $28,109 for women, a difference of 29.8%.
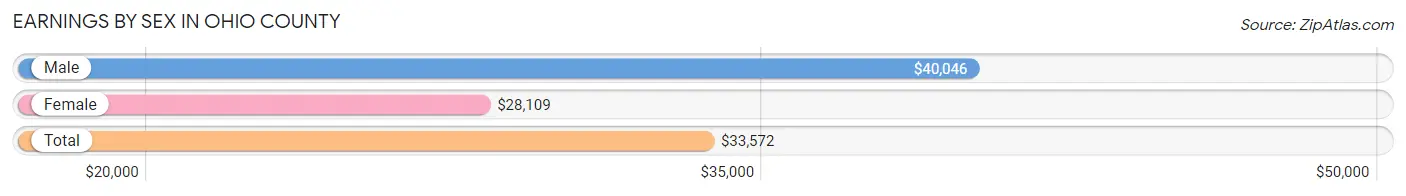
| Sex | Number | Average Earnings |
| Male | 11,406 (52.9%) | $40,046 |
| Female | 10,134 (47.0%) | $28,109 |
| Total | 21,540 (100.0%) | $33,572 |
Earnings by Sex by Income Bracket in Ohio County
The most common earnings brackets in Ohio County are $75,000 to $99,999 for men (1,439 | 12.6%) and $2,499 or less for women (846 | 8.4%).
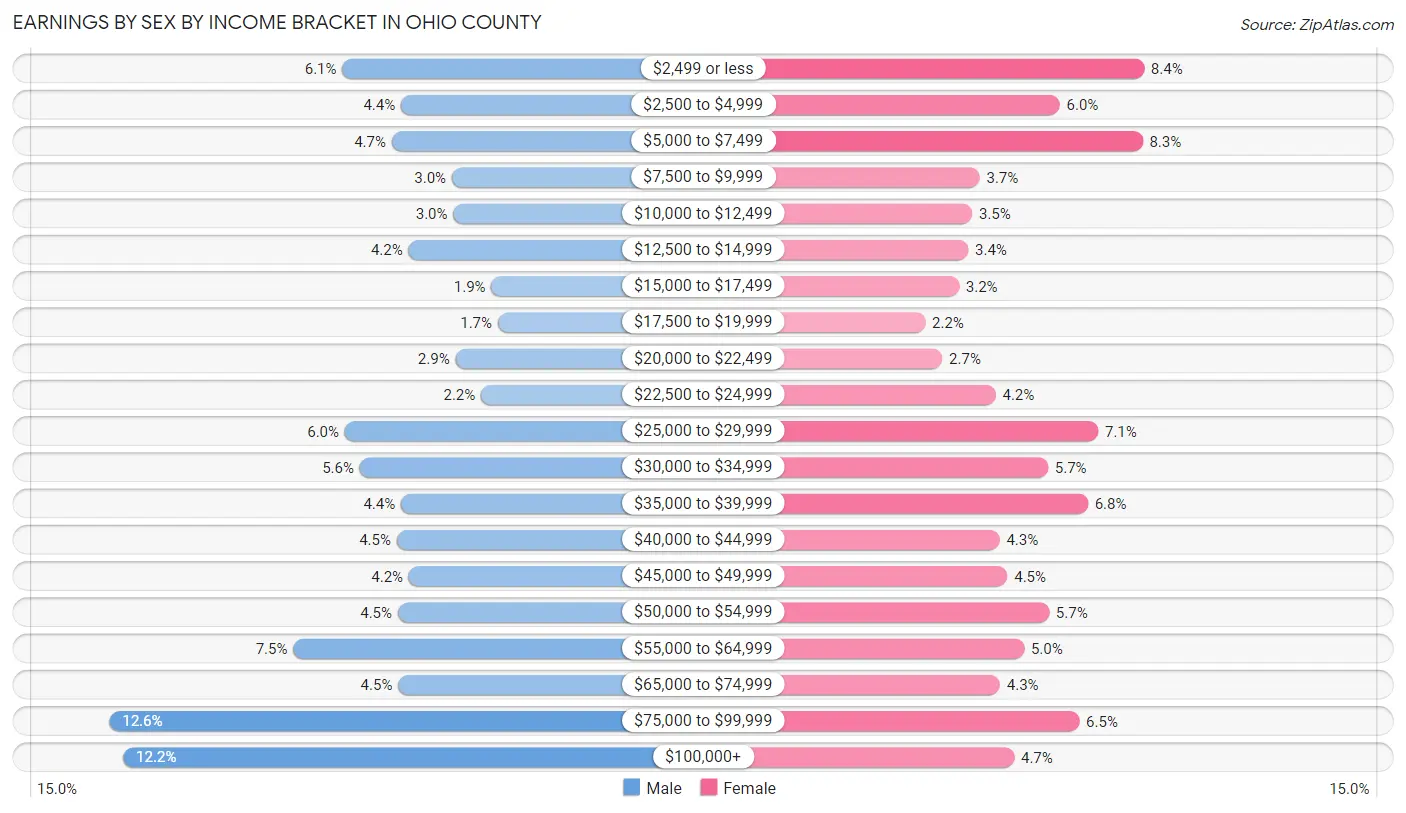
| Income | Male | Female |
| $2,499 or less | 692 (6.1%) | 846 (8.4%) |
| $2,500 to $4,999 | 504 (4.4%) | 606 (6.0%) |
| $5,000 to $7,499 | 534 (4.7%) | 842 (8.3%) |
| $7,500 to $9,999 | 341 (3.0%) | 378 (3.7%) |
| $10,000 to $12,499 | 337 (2.9%) | 357 (3.5%) |
| $12,500 to $14,999 | 480 (4.2%) | 346 (3.4%) |
| $15,000 to $17,499 | 215 (1.9%) | 319 (3.2%) |
| $17,500 to $19,999 | 194 (1.7%) | 223 (2.2%) |
| $20,000 to $22,499 | 330 (2.9%) | 272 (2.7%) |
| $22,500 to $24,999 | 247 (2.2%) | 424 (4.2%) |
| $25,000 to $29,999 | 684 (6.0%) | 715 (7.1%) |
| $30,000 to $34,999 | 636 (5.6%) | 573 (5.7%) |
| $35,000 to $39,999 | 504 (4.4%) | 686 (6.8%) |
| $40,000 to $44,999 | 518 (4.5%) | 435 (4.3%) |
| $45,000 to $49,999 | 479 (4.2%) | 457 (4.5%) |
| $50,000 to $54,999 | 514 (4.5%) | 576 (5.7%) |
| $55,000 to $64,999 | 850 (7.4%) | 505 (5.0%) |
| $65,000 to $74,999 | 513 (4.5%) | 436 (4.3%) |
| $75,000 to $99,999 | 1,439 (12.6%) | 662 (6.5%) |
| $100,000+ | 1,395 (12.2%) | 476 (4.7%) |
| Total | 11,406 (100.0%) | 10,134 (100.0%) |
Earnings by Sex by Educational Attainment in Ohio County
Average earnings in Ohio County are $48,861 for men and $35,782 for women, a difference of 26.8%. Men with an educational attainment of graduate degree enjoy the highest average annual earnings of $76,250, while those with less than high school education earn the least with $24,053. Women with an educational attainment of graduate degree earn the most with the average annual earnings of $64,612, while those with high school diploma education have the smallest earnings of $24,672.
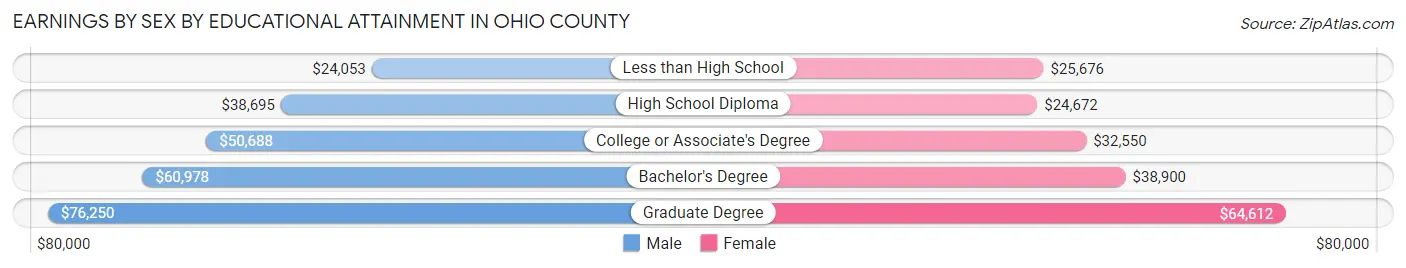
| Educational Attainment | Male Income | Female Income |
| Less than High School | $24,053 | $25,676 |
| High School Diploma | $38,695 | $24,672 |
| College or Associate's Degree | $50,688 | $32,550 |
| Bachelor's Degree | $60,978 | $38,900 |
| Graduate Degree | $76,250 | $64,612 |
| Total | $48,861 | $35,782 |
Family Income in Ohio County
Family Income Brackets in Ohio County
According to the Ohio County family income data, there are 2,087 families falling into the $100,000 to $149,999 income range, which is the most common income bracket and makes up 20.9% of all families. Conversely, the $10,000 to $14,999 income bracket is the least frequent group with only 200 families (2.0%) belonging to this category.
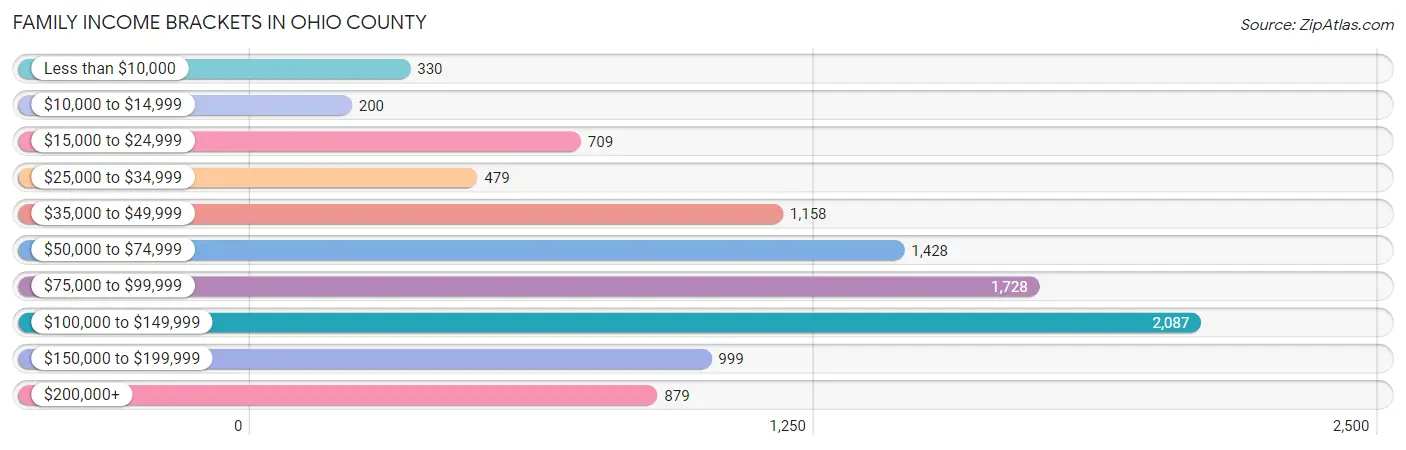
| Income Bracket | # Families | % Families |
| Less than $10,000 | 330 | 3.3% |
| $10,000 to $14,999 | 200 | 2.0% |
| $15,000 to $24,999 | 709 | 7.1% |
| $25,000 to $34,999 | 479 | 4.8% |
| $35,000 to $49,999 | 1,158 | 11.6% |
| $50,000 to $74,999 | 1,428 | 14.3% |
| $75,000 to $99,999 | 1,728 | 17.3% |
| $100,000 to $149,999 | 2,087 | 20.9% |
| $150,000 to $199,999 | 999 | 10.0% |
| $200,000+ | 879 | 8.8% |
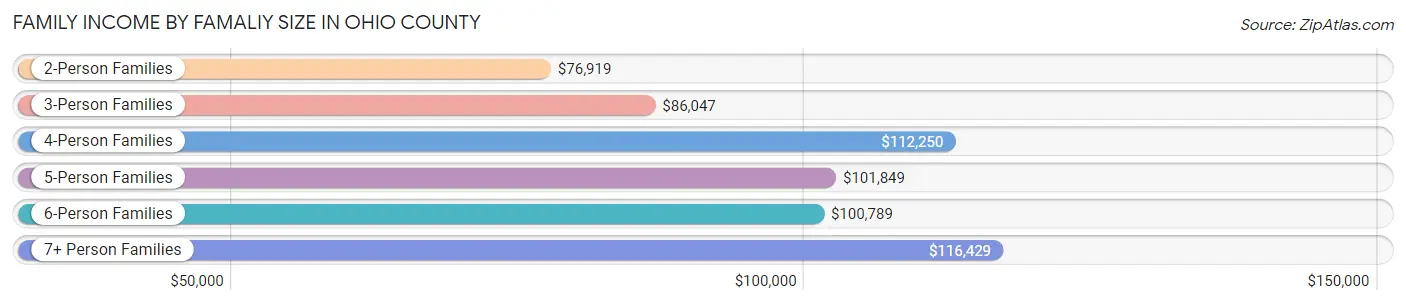
Family Income by Famaliy Size in Ohio County
7+ person families (58 | 0.6%) account for the highest median family income in Ohio County with $116,429 per family, while 2-person families (5,420 | 54.3%) have the highest median income of $38,460 per family member.
| Income Bracket | # Families | Median Income |
| 2-Person Families | 5,420 (54.3%) | $76,919 |
| 3-Person Families | 2,070 (20.7%) | $86,047 |
| 4-Person Families | 1,837 (18.4%) | $112,250 |
| 5-Person Families | 435 (4.4%) | $101,849 |
| 6-Person Families | 166 (1.7%) | $100,789 |
| 7+ Person Families | 58 (0.6%) | $116,429 |
| Total | 9,986 (100.0%) | $85,875 |
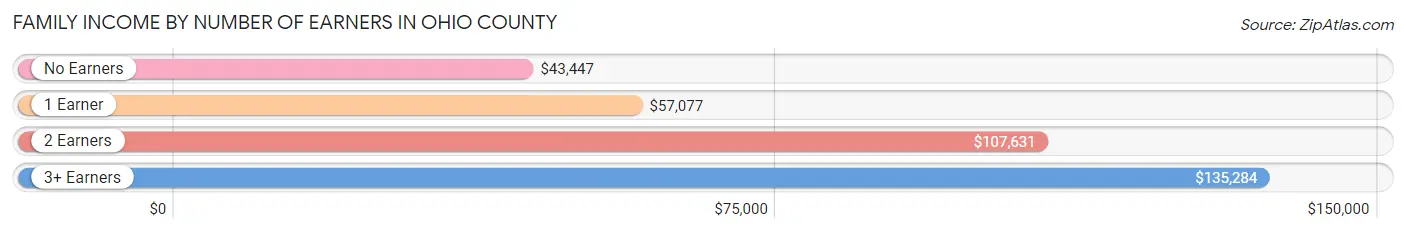
Family Income by Number of Earners in Ohio County
The median family income in Ohio County is $85,875, with families comprising 3+ earners (937) having the highest median family income of $135,284, while families with no earners (1,932) have the lowest median family income of $43,447, accounting for 9.4% and 19.4% of families, respectively.
| Number of Earners | # Families | Median Income |
| No Earners | 1,932 (19.4%) | $43,447 |
| 1 Earner | 3,094 (31.0%) | $57,077 |
| 2 Earners | 4,023 (40.3%) | $107,631 |
| 3+ Earners | 937 (9.4%) | $135,284 |
| Total | 9,986 (100.0%) | $85,875 |
Household Income in Ohio County
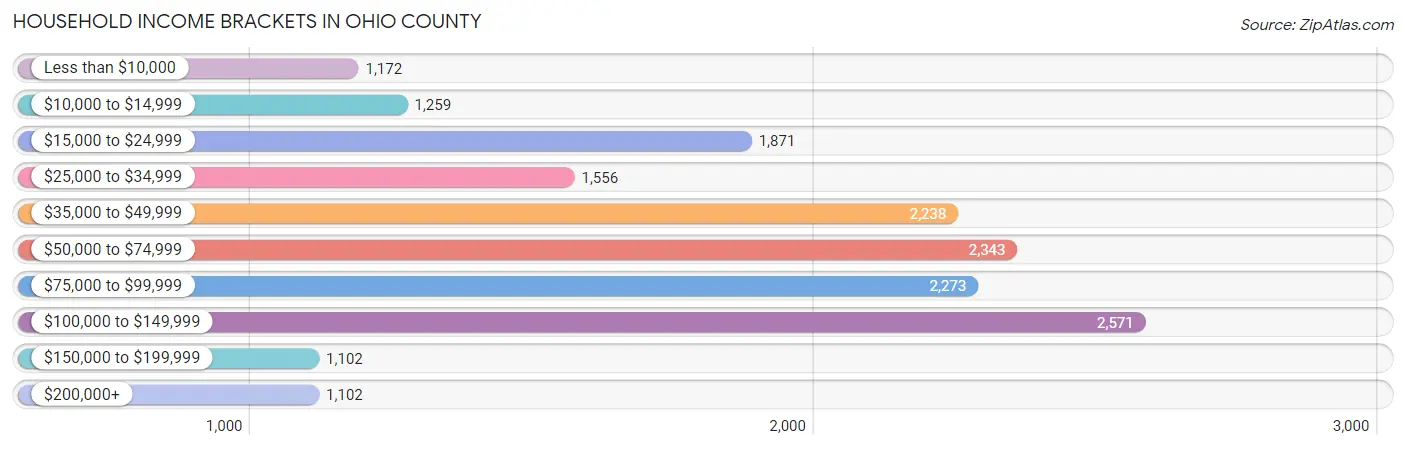
Household Income Brackets in Ohio County
With 2,571 households falling in the category, the $100,000 to $149,999 income range is the most frequent in Ohio County, accounting for 14.7% of all households. In contrast, only 1,102 households (6.3%) fall into the $150,000 to $199,999 income bracket, making it the least populous group.
| Income Bracket | # Households | % Households |
| Less than $10,000 | 1,172 | 6.7% |
| $10,000 to $14,999 | 1,259 | 7.2% |
| $15,000 to $24,999 | 1,871 | 10.7% |
| $25,000 to $34,999 | 1,556 | 8.9% |
| $35,000 to $49,999 | 2,238 | 12.8% |
| $50,000 to $74,999 | 2,343 | 13.4% |
| $75,000 to $99,999 | 2,273 | 13.0% |
| $100,000 to $149,999 | 2,571 | 14.7% |
| $150,000 to $199,999 | 1,102 | 6.3% |
| $200,000+ | 1,102 | 6.3% |
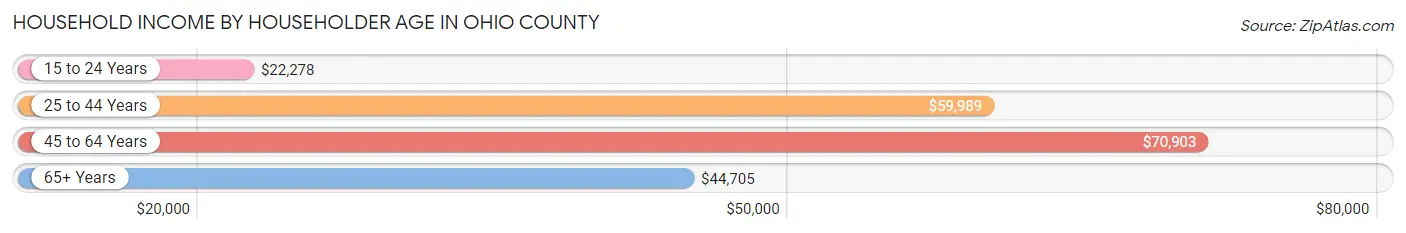
Household Income by Householder Age in Ohio County
The median household income in Ohio County is $55,521, with the highest median household income of $70,903 found in the 45 to 64 years age bracket for the primary householder. A total of 5,917 households (33.8%) fall into this category. Meanwhile, the 15 to 24 years age bracket for the primary householder has the lowest median household income of $22,278, with 461 households (2.6%) in this group.
| Income Bracket | # Households | Median Income |
| 15 to 24 Years | 461 (2.6%) | $22,278 |
| 25 to 44 Years | 4,519 (25.8%) | $59,989 |
| 45 to 64 Years | 5,917 (33.8%) | $70,903 |
| 65+ Years | 6,590 (37.7%) | $44,705 |
| Total | 17,487 (100.0%) | $55,521 |
Poverty in Ohio County
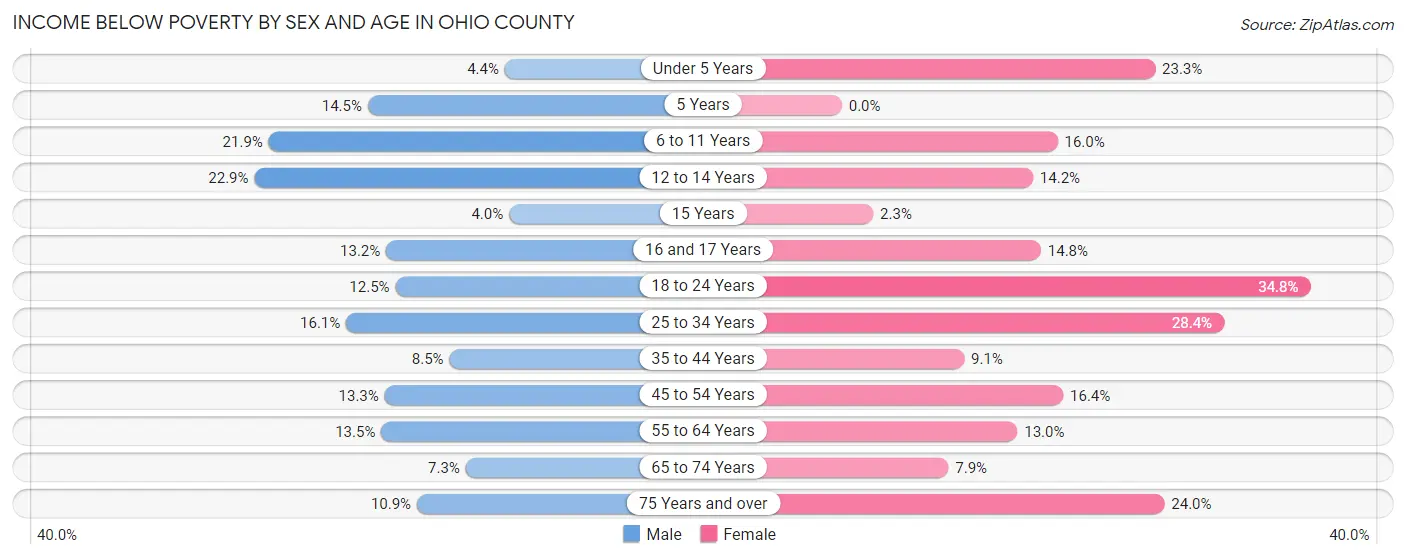
Income Below Poverty by Sex and Age in Ohio County
With 12.5% poverty level for males and 16.9% for females among the residents of Ohio County, 12 to 14 year old males and 18 to 24 year old females are the most vulnerable to poverty, with 153 males (22.9%) and 385 females (34.8%) in their respective age groups living below the poverty level.
| Age Bracket | Male | Female |
| Under 5 Years | 47 (4.3%) | 227 (23.3%) |
| 5 Years | 18 (14.5%) | 0 (0.0%) |
| 6 to 11 Years | 328 (21.9%) | 222 (16.0%) |
| 12 to 14 Years | 153 (22.9%) | 81 (14.2%) |
| 15 Years | 6 (4.0%) | 6 (2.3%) |
| 16 and 17 Years | 70 (13.2%) | 72 (14.8%) |
| 18 to 24 Years | 186 (12.5%) | 385 (34.8%) |
| 25 to 34 Years | 390 (16.1%) | 659 (28.4%) |
| 35 to 44 Years | 205 (8.5%) | 217 (9.1%) |
| 45 to 54 Years | 317 (13.3%) | 400 (16.4%) |
| 55 to 64 Years | 387 (13.5%) | 390 (13.0%) |
| 65 to 74 Years | 185 (7.2%) | 227 (7.9%) |
| 75 Years and over | 152 (10.9%) | 545 (23.9%) |
| Total | 2,444 (12.5%) | 3,431 (16.9%) |
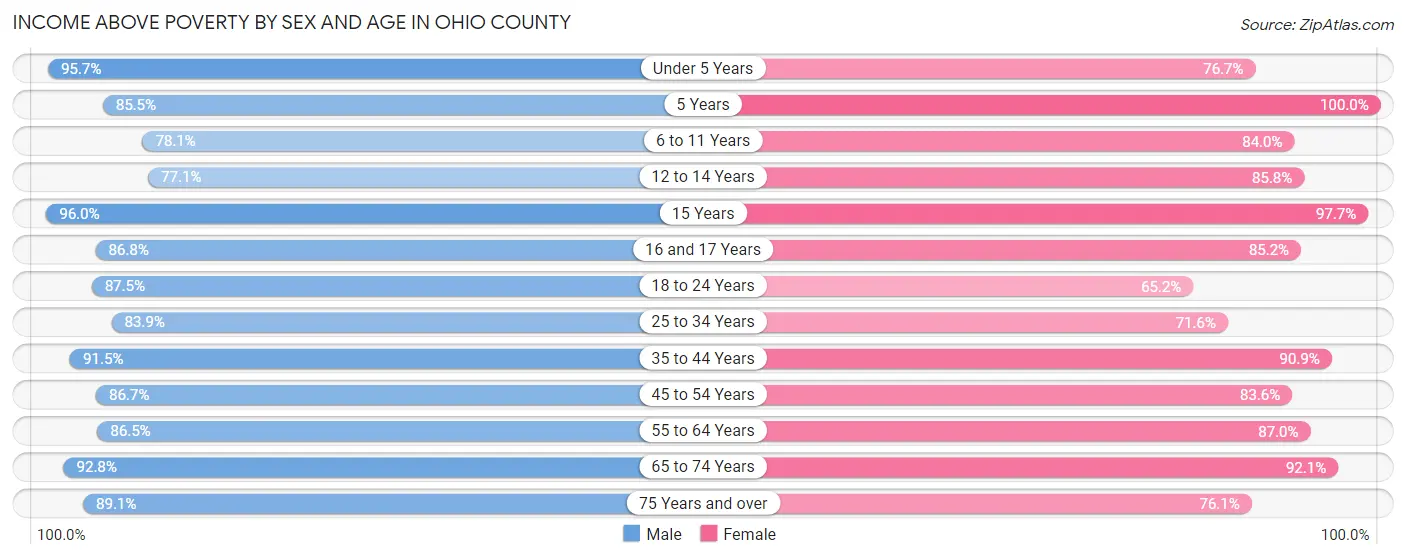
Income Above Poverty by Sex and Age in Ohio County
According to the poverty statistics in Ohio County, males aged 15 years and females aged 5 years are the age groups that are most secure financially, with 96.0% of males and 100.0% of females in these age groups living above the poverty line.
| Age Bracket | Male | Female |
| Under 5 Years | 1,033 (95.7%) | 749 (76.7%) |
| 5 Years | 106 (85.5%) | 231 (100.0%) |
| 6 to 11 Years | 1,171 (78.1%) | 1,164 (84.0%) |
| 12 to 14 Years | 514 (77.1%) | 490 (85.8%) |
| 15 Years | 143 (96.0%) | 251 (97.7%) |
| 16 and 17 Years | 462 (86.8%) | 415 (85.2%) |
| 18 to 24 Years | 1,305 (87.5%) | 722 (65.2%) |
| 25 to 34 Years | 2,028 (83.9%) | 1,664 (71.6%) |
| 35 to 44 Years | 2,217 (91.5%) | 2,173 (90.9%) |
| 45 to 54 Years | 2,071 (86.7%) | 2,035 (83.6%) |
| 55 to 64 Years | 2,475 (86.5%) | 2,604 (87.0%) |
| 65 to 74 Years | 2,368 (92.7%) | 2,642 (92.1%) |
| 75 Years and over | 1,246 (89.1%) | 1,731 (76.0%) |
| Total | 17,139 (87.5%) | 16,871 (83.1%) |
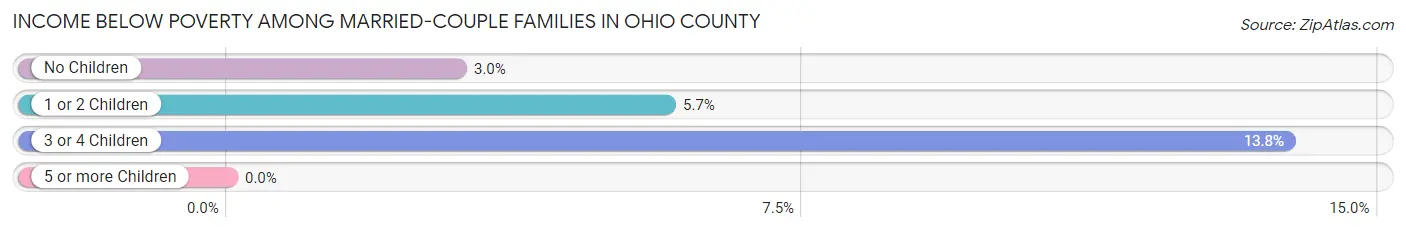
Income Below Poverty Among Married-Couple Families in Ohio County
The poverty statistics for married-couple families in Ohio County show that 4.4% or 327 of the total 7,395 families live below the poverty line. Families with 3 or 4 children have the highest poverty rate of 13.8%, comprising of 54 families. On the other hand, families with 5 or more children have the lowest poverty rate of 0.0%, which includes 0 families.
| Children | Above Poverty | Below Poverty |
| No Children | 4,506 (97.0%) | 139 (3.0%) |
| 1 or 2 Children | 2,207 (94.3%) | 134 (5.7%) |
| 3 or 4 Children | 337 (86.2%) | 54 (13.8%) |
| 5 or more Children | 18 (100.0%) | 0 (0.0%) |
| Total | 7,068 (95.6%) | 327 (4.4%) |
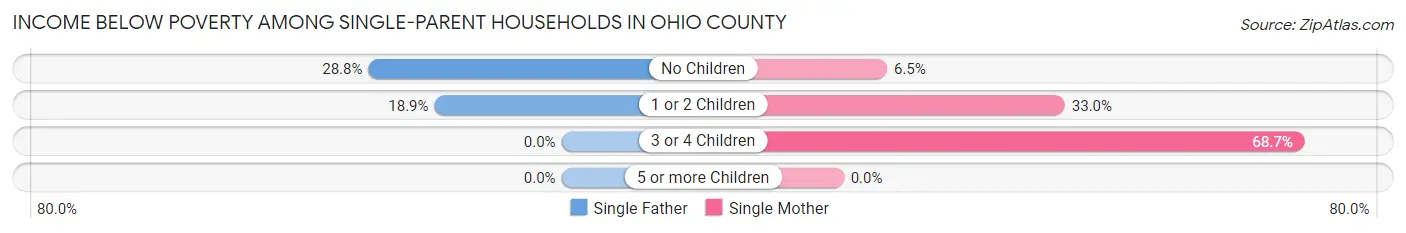
Income Below Poverty Among Single-Parent Households in Ohio County
According to the poverty data in Ohio County, 20.7% or 149 single-father households and 23.7% or 443 single-mother households are living below the poverty line. Among single-father households, those with no children have the highest poverty rate, with 74 households (28.8%) experiencing poverty. Likewise, among single-mother households, those with 3 or 4 children have the highest poverty rate, with 68 households (68.7%) falling below the poverty line.
| Children | Single Father | Single Mother |
| No Children | 74 (28.8%) | 51 (6.5%) |
| 1 or 2 Children | 75 (18.9%) | 324 (33.0%) |
| 3 or 4 Children | 0 (0.0%) | 68 (68.7%) |
| 5 or more Children | 0 (0.0%) | 0 (0.0%) |
| Total | 149 (20.7%) | 443 (23.7%) |
Income Below Poverty Among Married-Couple vs Single-Parent Households in Ohio County
The poverty data for Ohio County shows that 327 of the married-couple family households (4.4%) and 592 of the single-parent households (22.9%) are living below the poverty level. Within the married-couple family households, those with 3 or 4 children have the highest poverty rate, with 54 households (13.8%) falling below the poverty line. Among the single-parent households, those with 3 or 4 children have the highest poverty rate, with 68 household (41.0%) living below poverty.
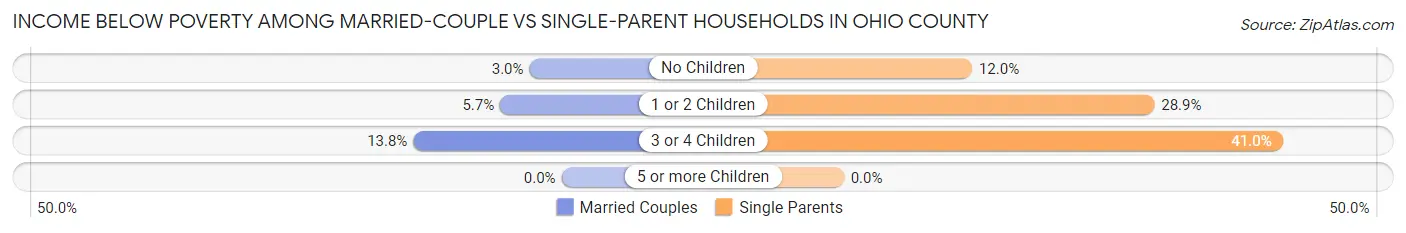
| Children | Married-Couple Families | Single-Parent Households |
| No Children | 139 (3.0%) | 125 (11.9%) |
| 1 or 2 Children | 134 (5.7%) | 399 (28.9%) |
| 3 or 4 Children | 54 (13.8%) | 68 (41.0%) |
| 5 or more Children | 0 (0.0%) | 0 (0.0%) |
| Total | 327 (4.4%) | 592 (22.9%) |
Employment Characteristics in Ohio County
Employment by Class of Employer in Ohio County
Among the 18,314 employed individuals in Ohio County, private company employees (12,094 | 66.0%), not-for-profit organizations (2,307 | 12.6%), and local government employees (1,435 | 7.8%) make up the most common classes of employment.
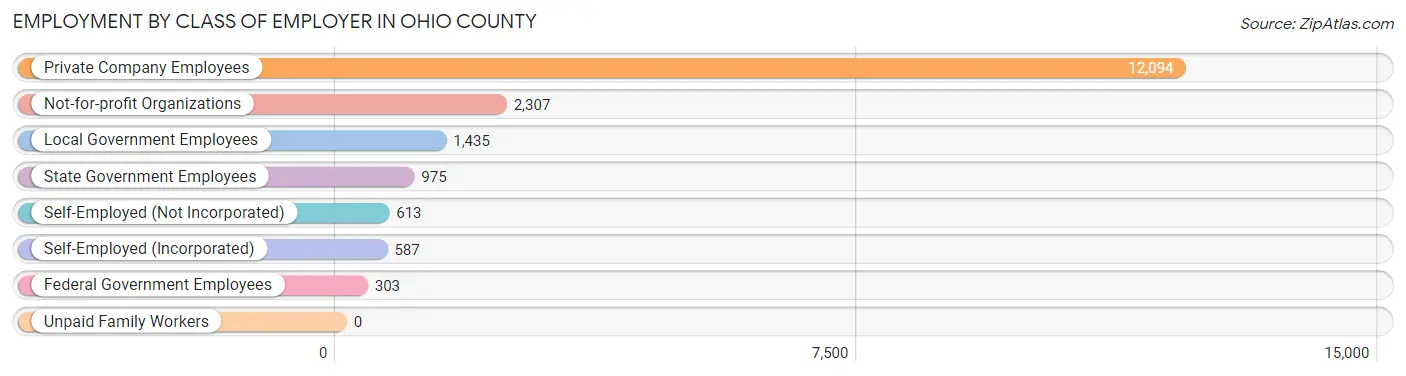
| Employer Class | # Employees | % Employees |
| Private Company Employees | 12,094 | 66.0% |
| Self-Employed (Incorporated) | 587 | 3.2% |
| Self-Employed (Not Incorporated) | 613 | 3.4% |
| Not-for-profit Organizations | 2,307 | 12.6% |
| Local Government Employees | 1,435 | 7.8% |
| State Government Employees | 975 | 5.3% |
| Federal Government Employees | 303 | 1.7% |
| Unpaid Family Workers | 0 | 0.0% |
| Total | 18,314 | 100.0% |
Employment Status by Age in Ohio County
According to the labor force statistics for Ohio County, out of the total population over 16 years of age (35,059), 56.7% or 19,878 individuals are in the labor force, with 5.3% or 1,054 of them unemployed. The age group with the highest labor force participation rate is 25 to 29 years, with 84.2% or 2,067 individuals in the labor force. Within the labor force, the 16 to 19 years age range has the highest percentage of unemployed individuals, with 13.3% or 120 of them being unemployed.
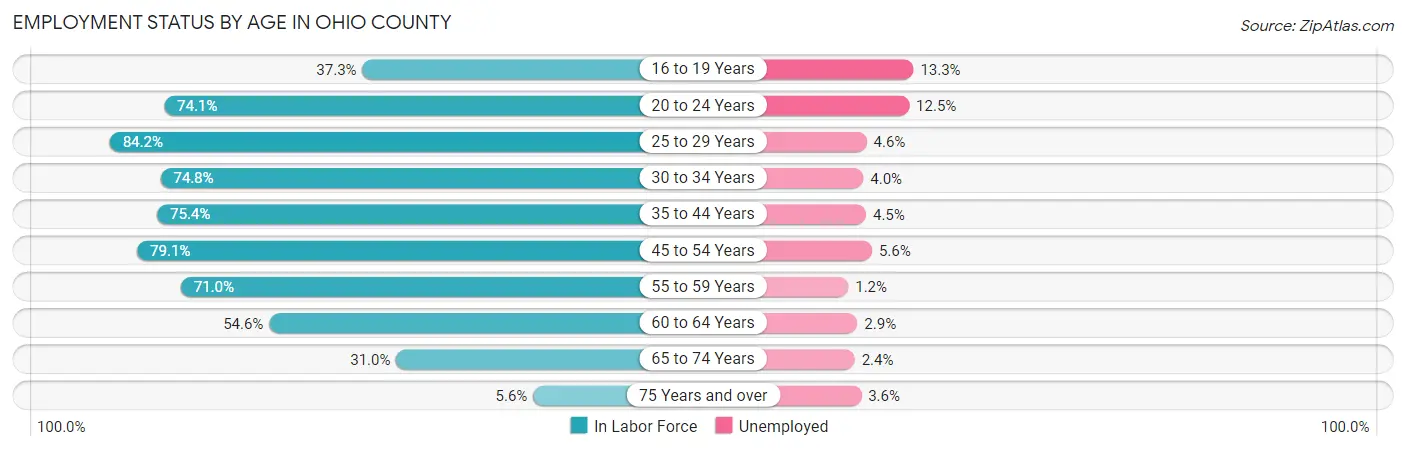
| Age Bracket | In Labor Force | Unemployed |
| 16 to 19 Years | 902 (37.3%) | 120 (13.3%) |
| 20 to 24 Years | 2,080 (74.1%) | 260 (12.5%) |
| 25 to 29 Years | 2,067 (84.2%) | 95 (4.6%) |
| 30 to 34 Years | 1,770 (74.8%) | 71 (4.0%) |
| 35 to 44 Years | 3,638 (75.4%) | 164 (4.5%) |
| 45 to 54 Years | 3,832 (79.1%) | 215 (5.6%) |
| 55 to 59 Years | 1,874 (71.0%) | 22 (1.2%) |
| 60 to 64 Years | 1,787 (54.6%) | 52 (2.9%) |
| 65 to 74 Years | 1,710 (31.0%) | 41 (2.4%) |
| 75 Years and over | 219 (5.6%) | 8 (3.6%) |
| Total | 19,878 (56.7%) | 1,054 (5.3%) |
Employment Status by Educational Attainment in Ohio County
According to labor force statistics for Ohio County, 73.4% of individuals (14,976) out of the total population between 25 and 64 years of age (20,403) are in the labor force, with 4.1% or 614 of them being unemployed. The group with the highest labor force participation rate are those with the educational attainment of bachelor's degree or higher, with 88.3% or 6,240 individuals in the labor force. Within the labor force, individuals with college / associate degree education have the highest percentage of unemployment, with 5.9% or 264 of them being unemployed.
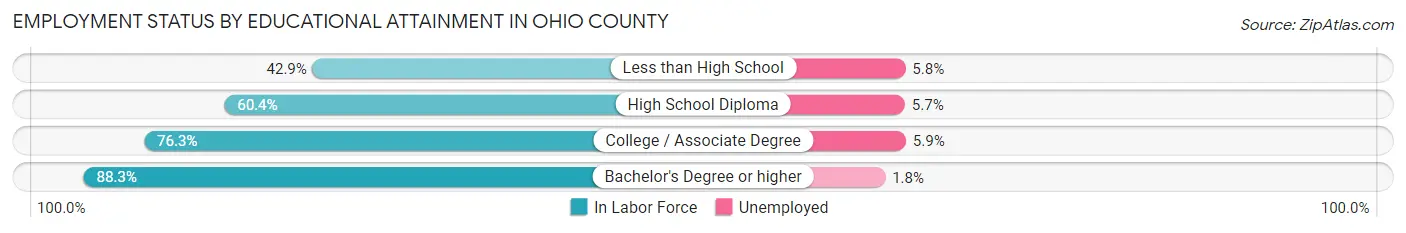
| Educational Attainment | In Labor Force | Unemployed |
| Less than High School | 641 (42.9%) | 87 (5.8%) |
| High School Diploma | 3,607 (60.4%) | 340 (5.7%) |
| College / Associate Degree | 4,478 (76.3%) | 346 (5.9%) |
| Bachelor's Degree or higher | 6,240 (88.3%) | 127 (1.8%) |
| Total | 14,976 (73.4%) | 837 (4.1%) |
Employment Occupations by Sex in Ohio County
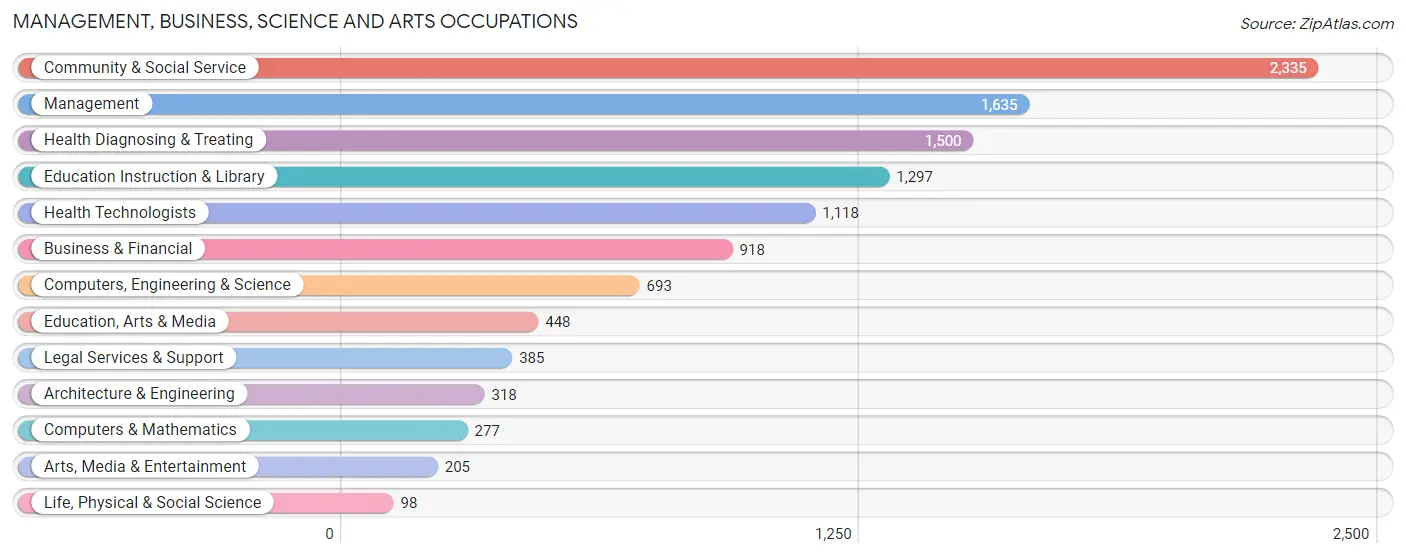
Management, Business, Science and Arts Occupations
The most common Management, Business, Science and Arts occupations in Ohio County are Community & Social Service (2,335 | 12.4%), Management (1,635 | 8.7%), Health Diagnosing & Treating (1,500 | 8.0%), Education Instruction & Library (1,297 | 6.9%), and Health Technologists (1,118 | 5.9%).
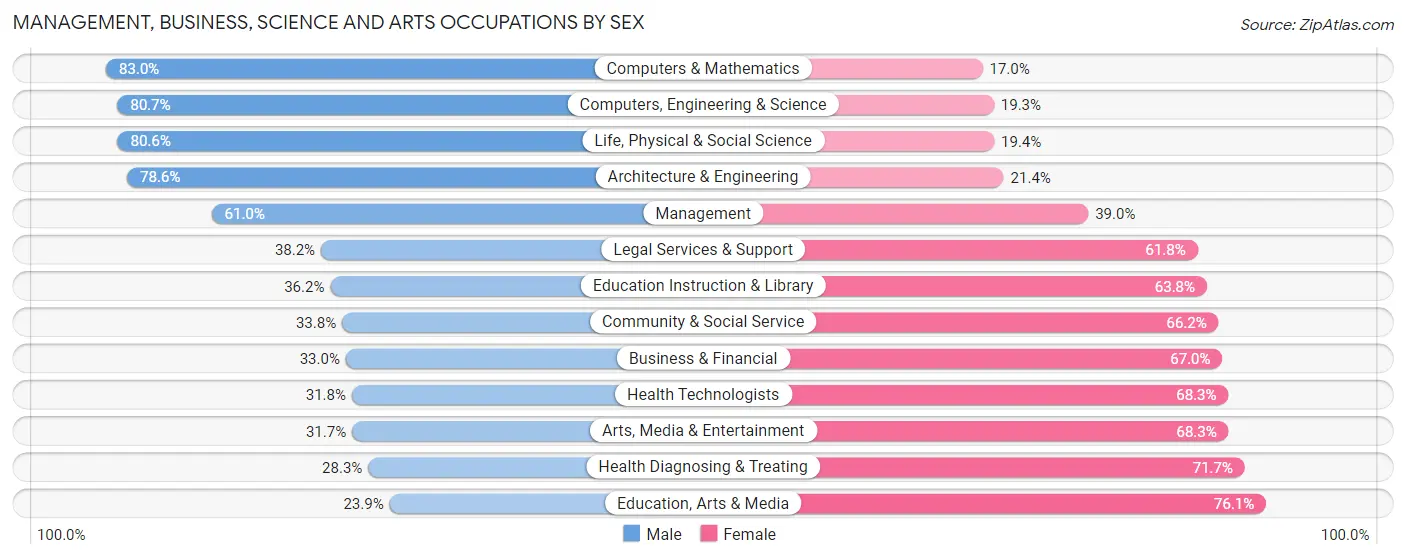
Management, Business, Science and Arts Occupations by Sex
Within the Management, Business, Science and Arts occupations in Ohio County, the most male-oriented occupations are Computers & Mathematics (83.0%), Computers, Engineering & Science (80.7%), and Life, Physical & Social Science (80.6%), while the most female-oriented occupations are Education, Arts & Media (76.1%), Health Diagnosing & Treating (71.7%), and Arts, Media & Entertainment (68.3%).
| Occupation | Male | Female |
| Management | 997 (61.0%) | 638 (39.0%) |
| Business & Financial | 303 (33.0%) | 615 (67.0%) |
| Computers, Engineering & Science | 559 (80.7%) | 134 (19.3%) |
| Computers & Mathematics | 230 (83.0%) | 47 (17.0%) |
| Architecture & Engineering | 250 (78.6%) | 68 (21.4%) |
| Life, Physical & Social Science | 79 (80.6%) | 19 (19.4%) |
| Community & Social Service | 789 (33.8%) | 1,546 (66.2%) |
| Education, Arts & Media | 107 (23.9%) | 341 (76.1%) |
| Legal Services & Support | 147 (38.2%) | 238 (61.8%) |
| Education Instruction & Library | 470 (36.2%) | 827 (63.8%) |
| Arts, Media & Entertainment | 65 (31.7%) | 140 (68.3%) |
| Health Diagnosing & Treating | 425 (28.3%) | 1,075 (71.7%) |
| Health Technologists | 355 (31.8%) | 763 (68.2%) |
| Total (Category) | 3,073 (43.4%) | 4,008 (56.6%) |
| Total (Overall) | 10,015 (53.2%) | 8,811 (46.8%) |
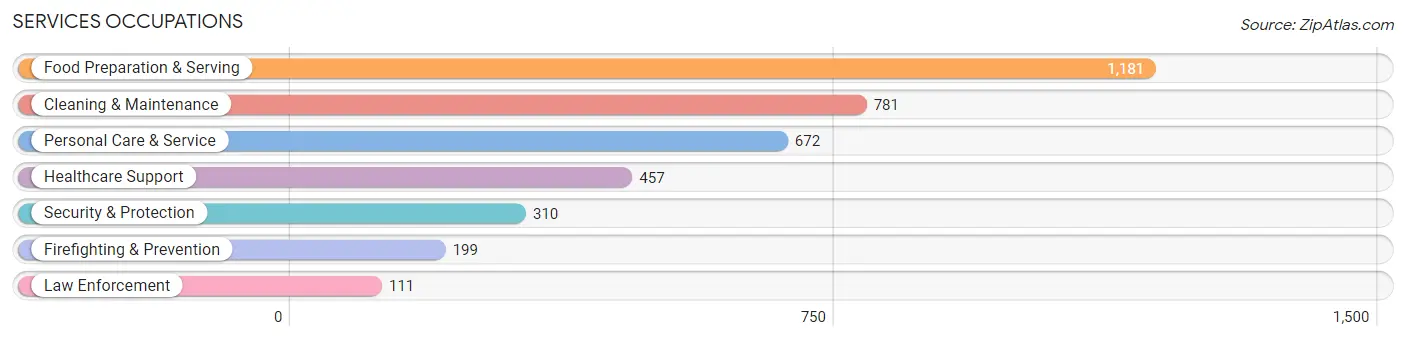
Services Occupations
The most common Services occupations in Ohio County are Food Preparation & Serving (1,181 | 6.3%), Cleaning & Maintenance (781 | 4.2%), Personal Care & Service (672 | 3.6%), Healthcare Support (457 | 2.4%), and Security & Protection (310 | 1.7%).
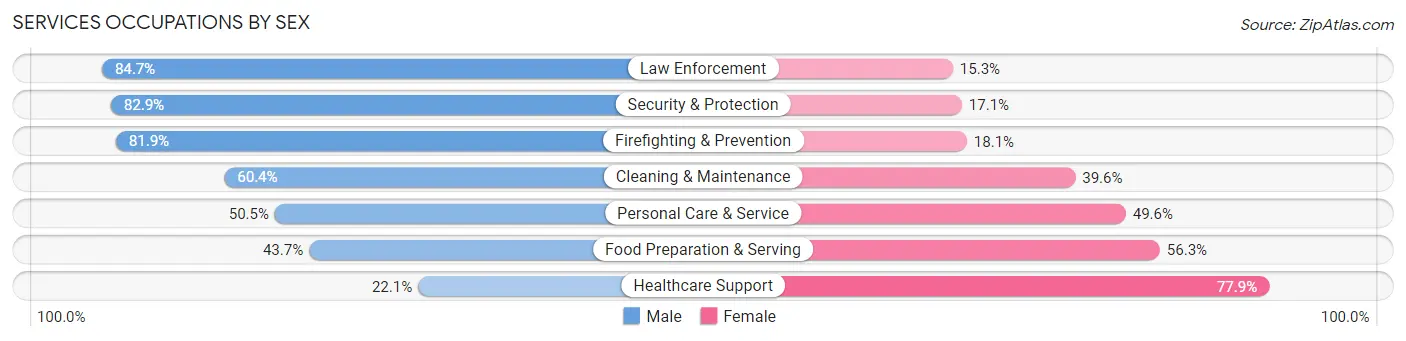
Services Occupations by Sex
Within the Services occupations in Ohio County, the most male-oriented occupations are Law Enforcement (84.7%), Security & Protection (82.9%), and Firefighting & Prevention (81.9%), while the most female-oriented occupations are Healthcare Support (77.9%), Food Preparation & Serving (56.3%), and Personal Care & Service (49.5%).
| Occupation | Male | Female |
| Healthcare Support | 101 (22.1%) | 356 (77.9%) |
| Security & Protection | 257 (82.9%) | 53 (17.1%) |
| Firefighting & Prevention | 163 (81.9%) | 36 (18.1%) |
| Law Enforcement | 94 (84.7%) | 17 (15.3%) |
| Food Preparation & Serving | 516 (43.7%) | 665 (56.3%) |
| Cleaning & Maintenance | 472 (60.4%) | 309 (39.6%) |
| Personal Care & Service | 339 (50.4%) | 333 (49.5%) |
| Total (Category) | 1,685 (49.5%) | 1,716 (50.5%) |
| Total (Overall) | 10,015 (53.2%) | 8,811 (46.8%) |
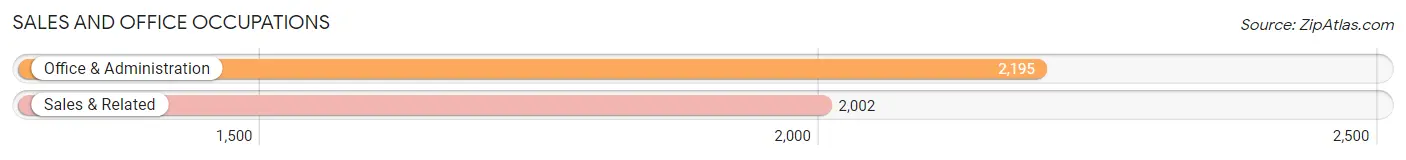
Sales and Office Occupations
The most common Sales and Office occupations in Ohio County are Office & Administration (2,195 | 11.7%), and Sales & Related (2,002 | 10.6%).
Sales and Office Occupations by Sex
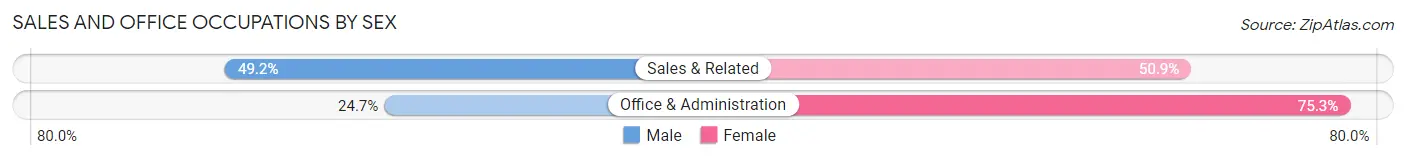
| Occupation | Male | Female |
| Sales & Related | 984 (49.1%) | 1,018 (50.8%) |
| Office & Administration | 542 (24.7%) | 1,653 (75.3%) |
| Total (Category) | 1,526 (36.4%) | 2,671 (63.6%) |
| Total (Overall) | 10,015 (53.2%) | 8,811 (46.8%) |
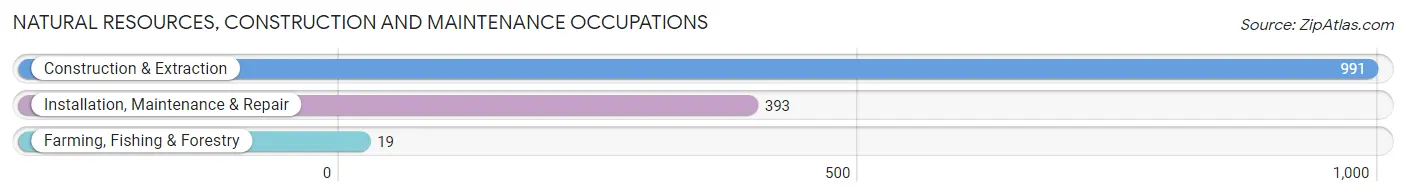
Natural Resources, Construction and Maintenance Occupations
The most common Natural Resources, Construction and Maintenance occupations in Ohio County are Construction & Extraction (991 | 5.3%), Installation, Maintenance & Repair (393 | 2.1%), and Farming, Fishing & Forestry (19 | 0.1%).
Natural Resources, Construction and Maintenance Occupations by Sex
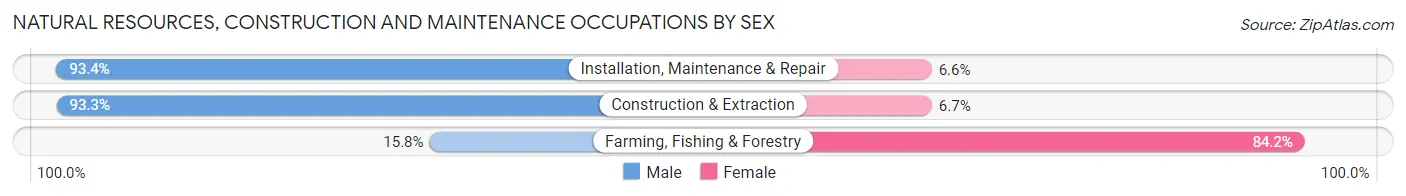
| Occupation | Male | Female |
| Farming, Fishing & Forestry | 3 (15.8%) | 16 (84.2%) |
| Construction & Extraction | 925 (93.3%) | 66 (6.7%) |
| Installation, Maintenance & Repair | 367 (93.4%) | 26 (6.6%) |
| Total (Category) | 1,295 (92.3%) | 108 (7.7%) |
| Total (Overall) | 10,015 (53.2%) | 8,811 (46.8%) |
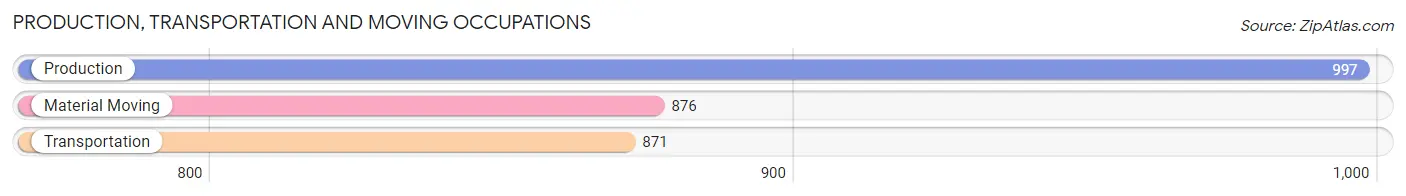
Production, Transportation and Moving Occupations
The most common Production, Transportation and Moving occupations in Ohio County are Production (997 | 5.3%), Material Moving (876 | 4.6%), and Transportation (871 | 4.6%).
Production, Transportation and Moving Occupations by Sex
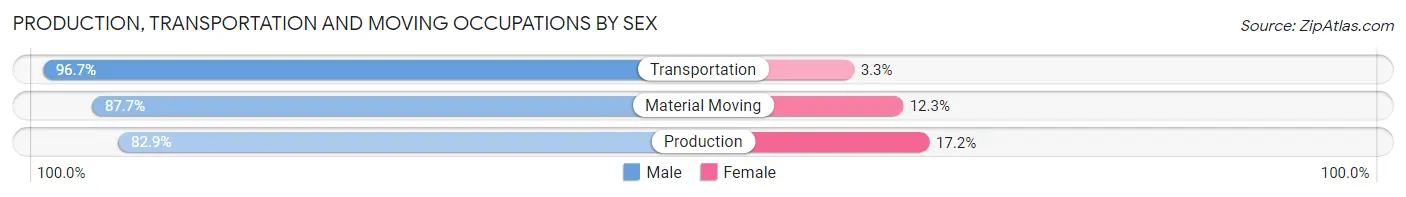
| Occupation | Male | Female |
| Production | 826 (82.9%) | 171 (17.2%) |
| Transportation | 842 (96.7%) | 29 (3.3%) |
| Material Moving | 768 (87.7%) | 108 (12.3%) |
| Total (Category) | 2,436 (88.8%) | 308 (11.2%) |
| Total (Overall) | 10,015 (53.2%) | 8,811 (46.8%) |
Employment Industries by Sex in Ohio County
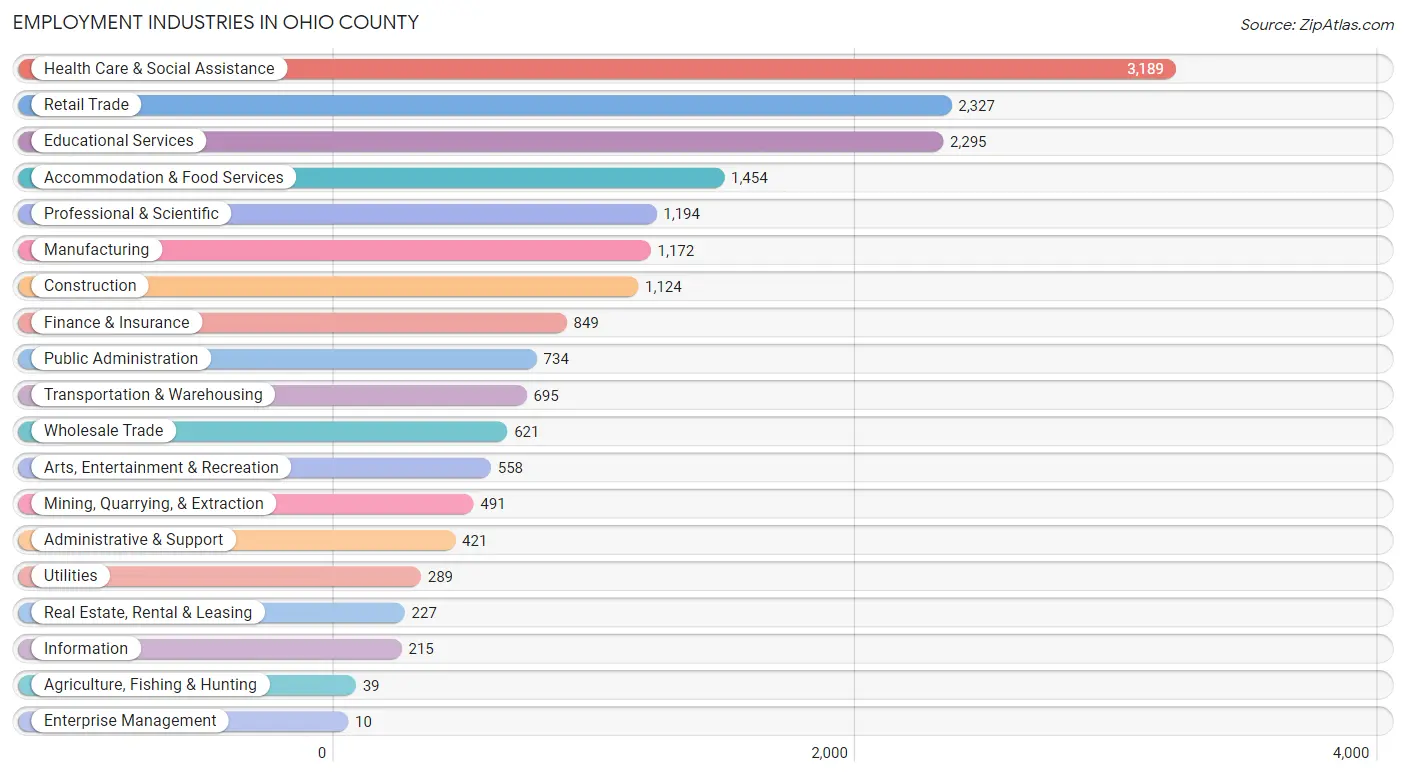
Employment Industries in Ohio County
The major employment industries in Ohio County include Health Care & Social Assistance (3,189 | 16.9%), Retail Trade (2,327 | 12.4%), Educational Services (2,295 | 12.2%), Accommodation & Food Services (1,454 | 7.7%), and Professional & Scientific (1,194 | 6.3%).
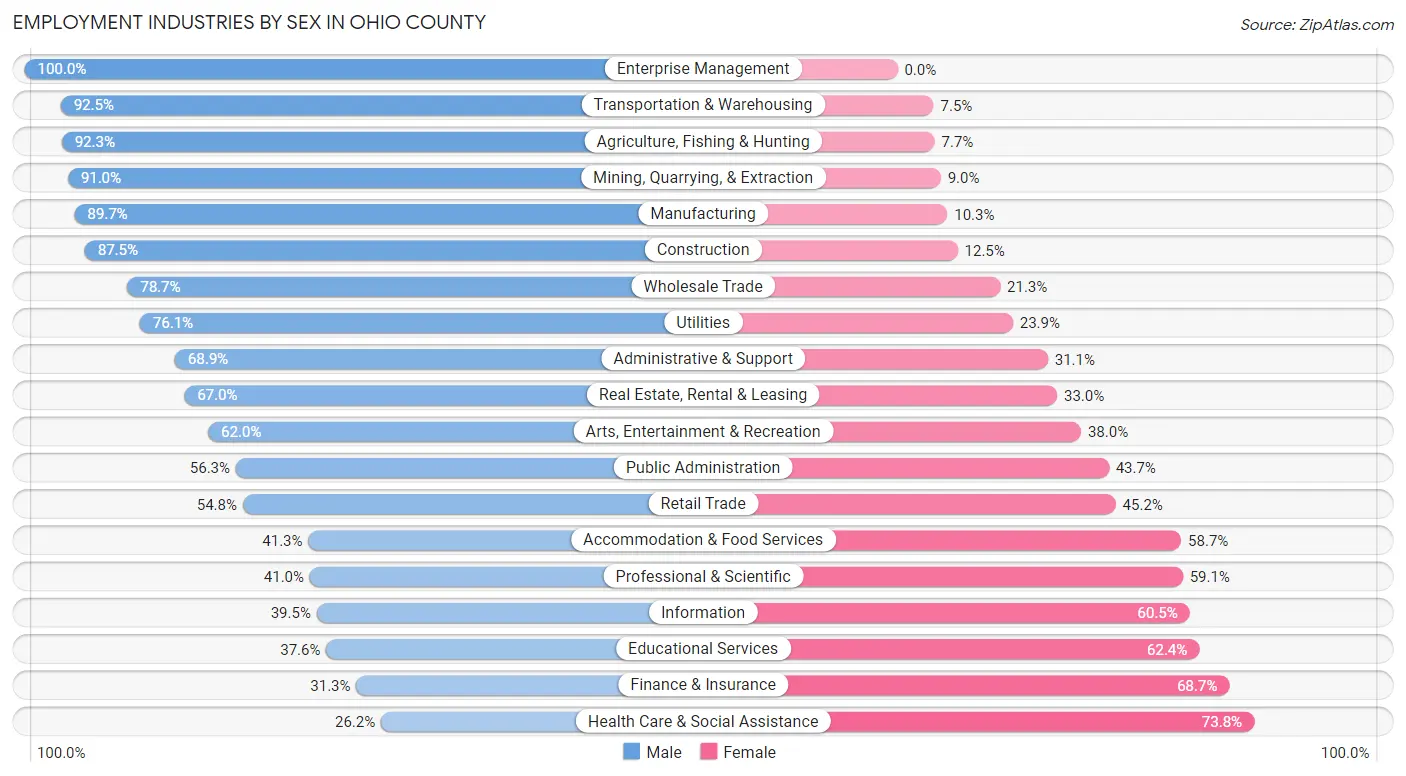
Employment Industries by Sex in Ohio County
The Ohio County industries that see more men than women are Enterprise Management (100.0%), Transportation & Warehousing (92.5%), and Agriculture, Fishing & Hunting (92.3%), whereas the industries that tend to have a higher number of women are Health Care & Social Assistance (73.8%), Finance & Insurance (68.7%), and Educational Services (62.4%).
| Industry | Male | Female |
| Agriculture, Fishing & Hunting | 36 (92.3%) | 3 (7.7%) |
| Mining, Quarrying, & Extraction | 447 (91.0%) | 44 (9.0%) |
| Construction | 984 (87.5%) | 140 (12.5%) |
| Manufacturing | 1,051 (89.7%) | 121 (10.3%) |
| Wholesale Trade | 489 (78.7%) | 132 (21.3%) |
| Retail Trade | 1,276 (54.8%) | 1,051 (45.2%) |
| Transportation & Warehousing | 643 (92.5%) | 52 (7.5%) |
| Utilities | 220 (76.1%) | 69 (23.9%) |
| Information | 85 (39.5%) | 130 (60.5%) |
| Finance & Insurance | 266 (31.3%) | 583 (68.7%) |
| Real Estate, Rental & Leasing | 152 (67.0%) | 75 (33.0%) |
| Professional & Scientific | 489 (40.9%) | 705 (59.1%) |
| Enterprise Management | 10 (100.0%) | 0 (0.0%) |
| Administrative & Support | 290 (68.9%) | 131 (31.1%) |
| Educational Services | 862 (37.6%) | 1,433 (62.4%) |
| Health Care & Social Assistance | 836 (26.2%) | 2,353 (73.8%) |
| Arts, Entertainment & Recreation | 346 (62.0%) | 212 (38.0%) |
| Accommodation & Food Services | 600 (41.3%) | 854 (58.7%) |
| Public Administration | 413 (56.3%) | 321 (43.7%) |
| Total | 10,015 (53.2%) | 8,811 (46.8%) |
Education in Ohio County
School Enrollment in Ohio County
The most common levels of schooling among the 9,603 students in Ohio County are college / undergraduate (2,613 | 27.2%), high school (1,992 | 20.7%), and elementary school (1,917 | 20.0%).
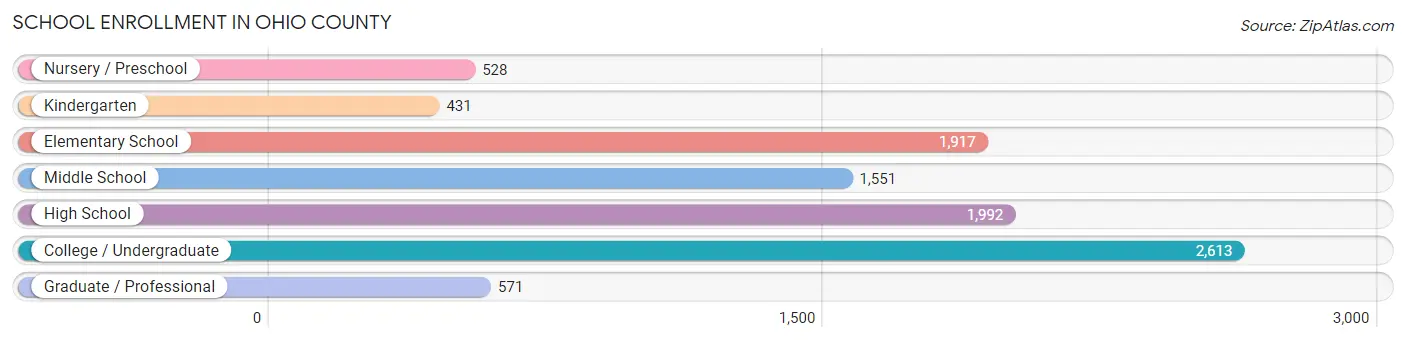
| School Level | # Students | % Students |
| Nursery / Preschool | 528 | 5.5% |
| Kindergarten | 431 | 4.5% |
| Elementary School | 1,917 | 20.0% |
| Middle School | 1,551 | 16.2% |
| High School | 1,992 | 20.7% |
| College / Undergraduate | 2,613 | 27.2% |
| Graduate / Professional | 571 | 5.9% |
| Total | 9,603 | 100.0% |
School Enrollment by Age by Funding Source in Ohio County
Out of a total of 9,603 students who are enrolled in schools in Ohio County, 2,074 (21.6%) attend a private institution, while the remaining 7,529 (78.4%) are enrolled in public schools. The age group of 35 years and over has the highest likelihood of being enrolled in private schools, with 143 (43.3% in the age bracket) enrolled. Conversely, the age group of 18 to 19 year olds has the lowest likelihood of being enrolled in a private school, with 1,048 (90.2% in the age bracket) attending a public institution.
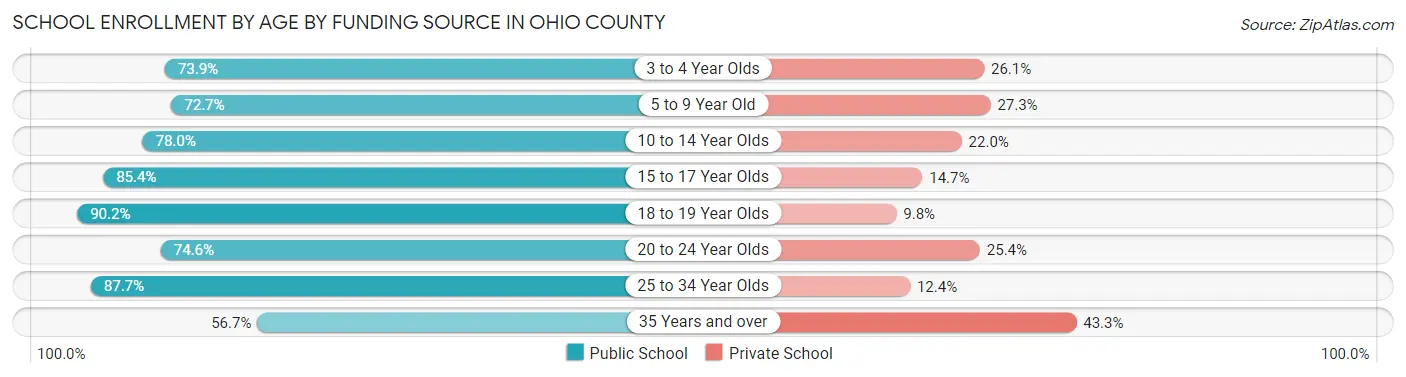
| Age Bracket | Public School | Private School |
| 3 to 4 Year Olds | 226 (73.9%) | 80 (26.1%) |
| 5 to 9 Year Old | 1,608 (72.7%) | 605 (27.3%) |
| 10 to 14 Year Olds | 1,697 (78.0%) | 478 (22.0%) |
| 15 to 17 Year Olds | 1,218 (85.4%) | 209 (14.6%) |
| 18 to 19 Year Olds | 1,048 (90.2%) | 114 (9.8%) |
| 20 to 24 Year Olds | 1,171 (74.6%) | 398 (25.4%) |
| 25 to 34 Year Olds | 369 (87.6%) | 52 (12.3%) |
| 35 Years and over | 187 (56.7%) | 143 (43.3%) |
| Total | 7,529 (78.4%) | 2,074 (21.6%) |
Educational Attainment by Field of Study in Ohio County
Education (1,709 | 16.0%), business (1,688 | 15.8%), science & technology (1,598 | 15.0%), social sciences (734 | 6.9%), and psychology (695 | 6.5%) are the most common fields of study among 10,664 individuals in Ohio County who have obtained a bachelor's degree or higher.
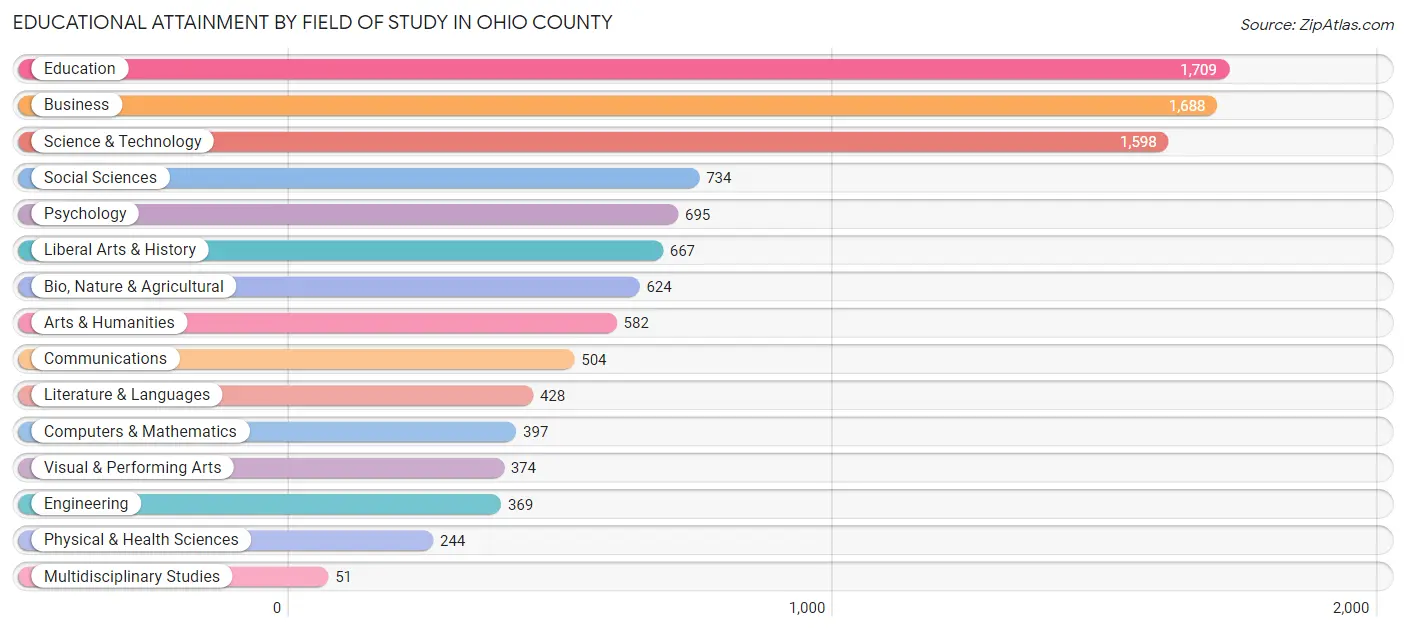
| Field of Study | # Graduates | % Graduates |
| Computers & Mathematics | 397 | 3.7% |
| Bio, Nature & Agricultural | 624 | 5.9% |
| Physical & Health Sciences | 244 | 2.3% |
| Psychology | 695 | 6.5% |
| Social Sciences | 734 | 6.9% |
| Engineering | 369 | 3.5% |
| Multidisciplinary Studies | 51 | 0.5% |
| Science & Technology | 1,598 | 15.0% |
| Business | 1,688 | 15.8% |
| Education | 1,709 | 16.0% |
| Literature & Languages | 428 | 4.0% |
| Liberal Arts & History | 667 | 6.2% |
| Visual & Performing Arts | 374 | 3.5% |
| Communications | 504 | 4.7% |
| Arts & Humanities | 582 | 5.5% |
| Total | 10,664 | 100.0% |
Transportation & Commute in Ohio County
Vehicle Availability by Sex in Ohio County
The most prevalent vehicle ownership categories in Ohio County are males with 2 vehicles (4,592, accounting for 48.2%) and females with 2 vehicles (3,813, making up 57.1%).
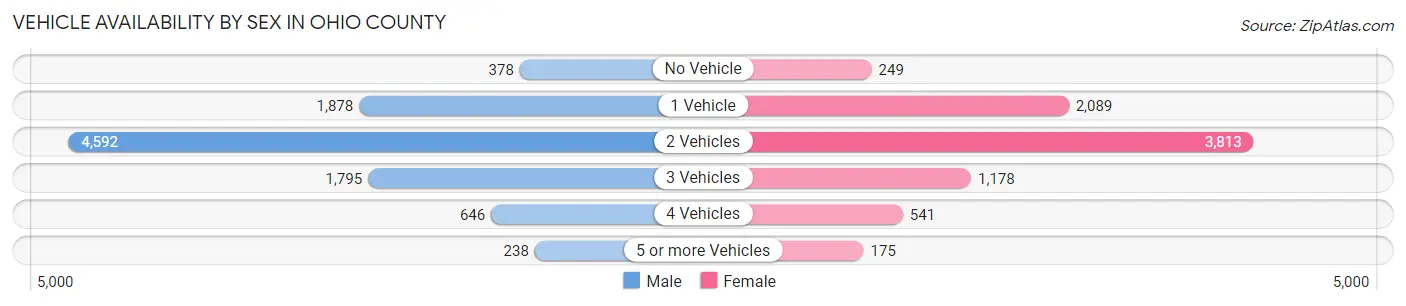
| Vehicles Available | Male | Female |
| No Vehicle | 378 (4.0%) | 249 (3.1%) |
| 1 Vehicle | 1,878 (19.7%) | 2,089 (26.0%) |
| 2 Vehicles | 4,592 (48.2%) | 3,813 (47.4%) |
| 3 Vehicles | 1,795 (18.8%) | 1,178 (14.6%) |
| 4 Vehicles | 646 (6.8%) | 541 (6.7%) |
| 5 or more Vehicles | 238 (2.5%) | 175 (2.2%) |
| Total | 9,527 (100.0%) | 8,045 (100.0%) |
Commute Time in Ohio County
The most frequently occuring commute durations in Ohio County are 10 to 14 minutes (3,709 commuters, 21.5%), 15 to 19 minutes (3,513 commuters, 20.4%), and 20 to 24 minutes (2,681 commuters, 15.6%).
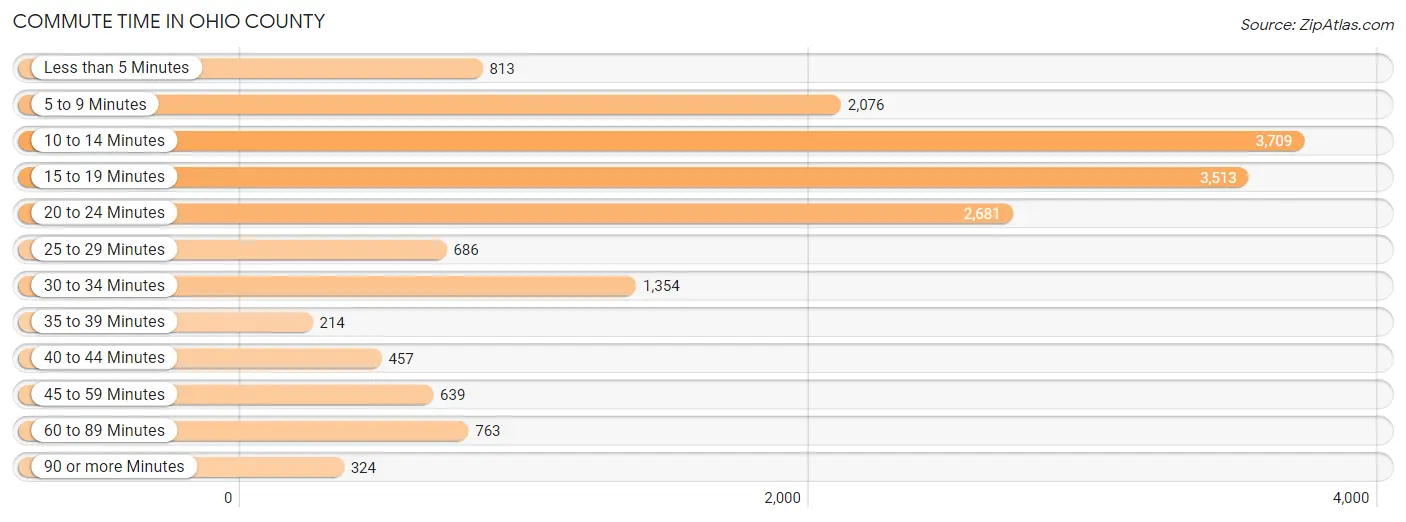
| Commute Time | # Commuters | % Commuters |
| Less than 5 Minutes | 813 | 4.7% |
| 5 to 9 Minutes | 2,076 | 12.0% |
| 10 to 14 Minutes | 3,709 | 21.5% |
| 15 to 19 Minutes | 3,513 | 20.4% |
| 20 to 24 Minutes | 2,681 | 15.6% |
| 25 to 29 Minutes | 686 | 4.0% |
| 30 to 34 Minutes | 1,354 | 7.9% |
| 35 to 39 Minutes | 214 | 1.2% |
| 40 to 44 Minutes | 457 | 2.6% |
| 45 to 59 Minutes | 639 | 3.7% |
| 60 to 89 Minutes | 763 | 4.4% |
| 90 or more Minutes | 324 | 1.9% |
Commute Time by Sex in Ohio County
The most common commute times in Ohio County are 10 to 14 minutes (1,944 commuters, 21.0%) for males and 10 to 14 minutes (1,765 commuters, 22.2%) for females.
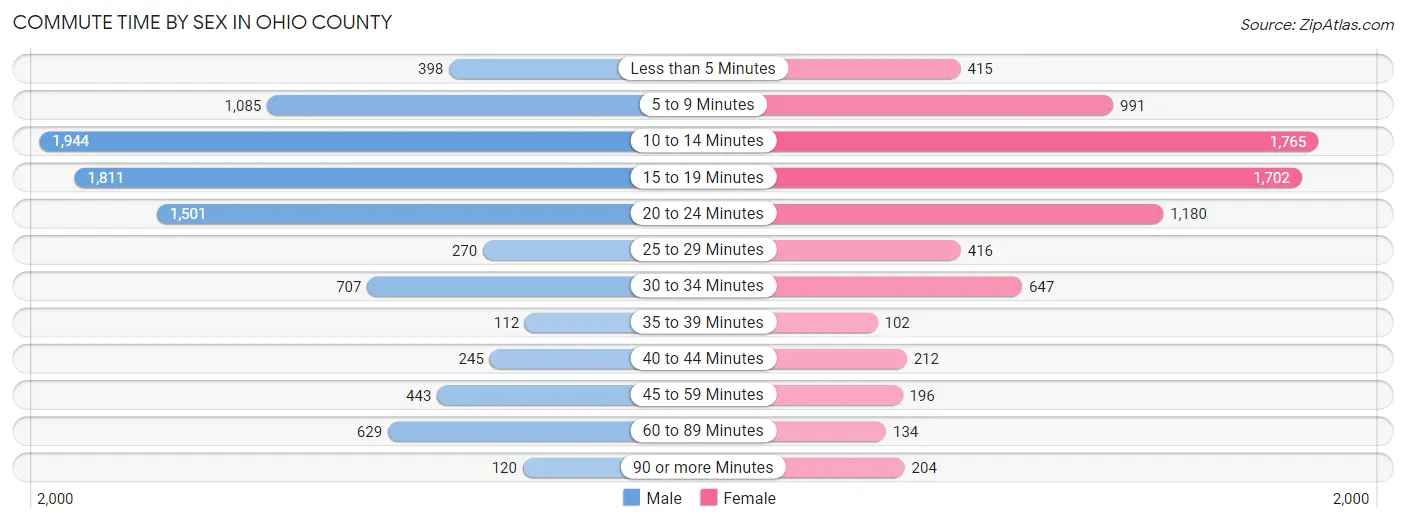
| Commute Time | Male | Female |
| Less than 5 Minutes | 398 (4.3%) | 415 (5.2%) |
| 5 to 9 Minutes | 1,085 (11.7%) | 991 (12.4%) |
| 10 to 14 Minutes | 1,944 (21.0%) | 1,765 (22.2%) |
| 15 to 19 Minutes | 1,811 (19.6%) | 1,702 (21.4%) |
| 20 to 24 Minutes | 1,501 (16.2%) | 1,180 (14.8%) |
| 25 to 29 Minutes | 270 (2.9%) | 416 (5.2%) |
| 30 to 34 Minutes | 707 (7.6%) | 647 (8.1%) |
| 35 to 39 Minutes | 112 (1.2%) | 102 (1.3%) |
| 40 to 44 Minutes | 245 (2.6%) | 212 (2.7%) |
| 45 to 59 Minutes | 443 (4.8%) | 196 (2.5%) |
| 60 to 89 Minutes | 629 (6.8%) | 134 (1.7%) |
| 90 or more Minutes | 120 (1.3%) | 204 (2.6%) |
Time of Departure to Work by Sex in Ohio County
The most frequent times of departure to work in Ohio County are 7:30 AM to 7:59 AM (1,349, 14.6%) for males and 7:30 AM to 7:59 AM (1,632, 20.5%) for females.
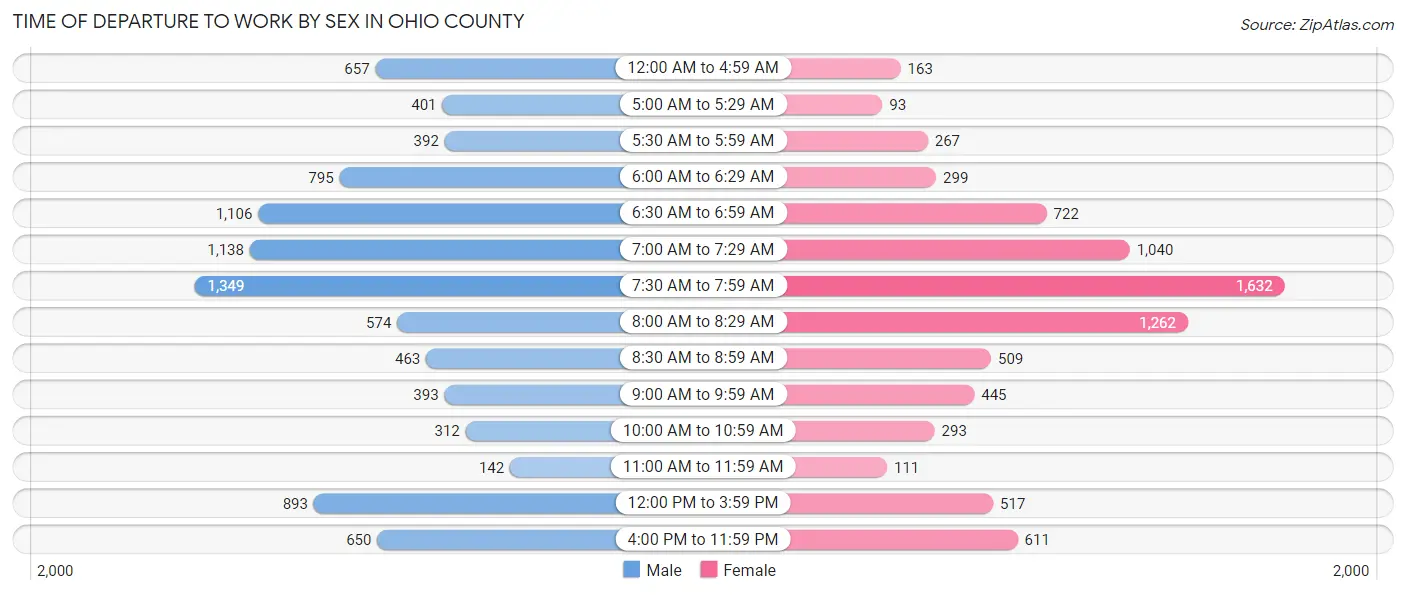
| Time of Departure | Male | Female |
| 12:00 AM to 4:59 AM | 657 (7.1%) | 163 (2.1%) |
| 5:00 AM to 5:29 AM | 401 (4.3%) | 93 (1.2%) |
| 5:30 AM to 5:59 AM | 392 (4.2%) | 267 (3.4%) |
| 6:00 AM to 6:29 AM | 795 (8.6%) | 299 (3.7%) |
| 6:30 AM to 6:59 AM | 1,106 (11.9%) | 722 (9.1%) |
| 7:00 AM to 7:29 AM | 1,138 (12.3%) | 1,040 (13.1%) |
| 7:30 AM to 7:59 AM | 1,349 (14.6%) | 1,632 (20.5%) |
| 8:00 AM to 8:29 AM | 574 (6.2%) | 1,262 (15.9%) |
| 8:30 AM to 8:59 AM | 463 (5.0%) | 509 (6.4%) |
| 9:00 AM to 9:59 AM | 393 (4.2%) | 445 (5.6%) |
| 10:00 AM to 10:59 AM | 312 (3.4%) | 293 (3.7%) |
| 11:00 AM to 11:59 AM | 142 (1.5%) | 111 (1.4%) |
| 12:00 PM to 3:59 PM | 893 (9.6%) | 517 (6.5%) |
| 4:00 PM to 11:59 PM | 650 (7.0%) | 611 (7.7%) |
| Total | 9,265 (100.0%) | 7,964 (100.0%) |
Housing Occupancy in Ohio County
Occupancy by Ownership in Ohio County
Of the total 17,487 dwellings in Ohio County, owner-occupied units account for 11,956 (68.4%), while renter-occupied units make up 5,531 (31.6%).
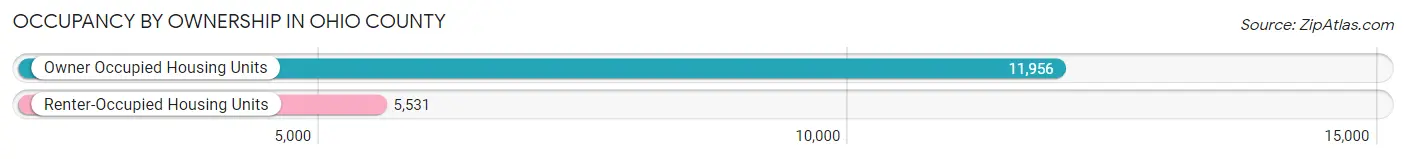
| Occupancy | # Housing Units | % Housing Units |
| Owner Occupied Housing Units | 11,956 | 68.4% |
| Renter-Occupied Housing Units | 5,531 | 31.6% |
| Total Occupied Housing Units | 17,487 | 100.0% |
Occupancy by Household Size in Ohio County
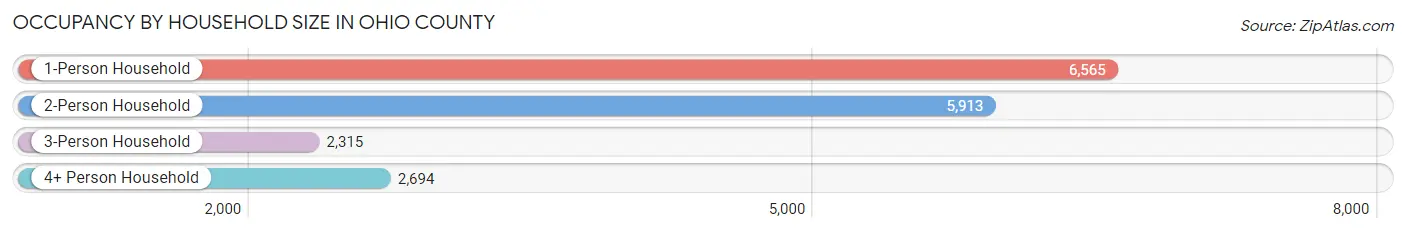
| Household Size | # Housing Units | % Housing Units |
| 1-Person Household | 6,565 | 37.5% |
| 2-Person Household | 5,913 | 33.8% |
| 3-Person Household | 2,315 | 13.2% |
| 4+ Person Household | 2,694 | 15.4% |
| Total Housing Units | 17,487 | 100.0% |
Occupancy by Ownership by Household Size in Ohio County
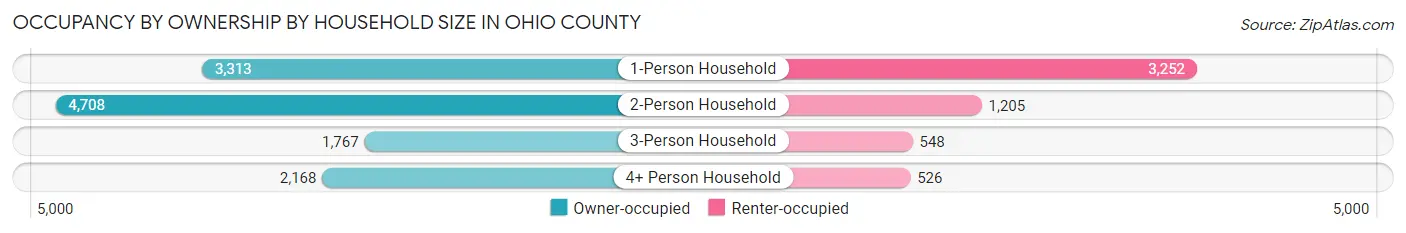
| Household Size | Owner-occupied | Renter-occupied |
| 1-Person Household | 3,313 (50.5%) | 3,252 (49.5%) |
| 2-Person Household | 4,708 (79.6%) | 1,205 (20.4%) |
| 3-Person Household | 1,767 (76.3%) | 548 (23.7%) |
| 4+ Person Household | 2,168 (80.5%) | 526 (19.5%) |
| Total Housing Units | 11,956 (68.4%) | 5,531 (31.6%) |
Occupancy by Educational Attainment in Ohio County
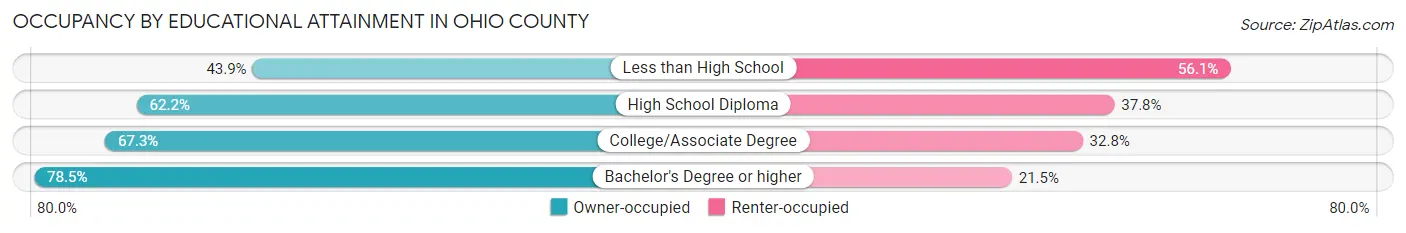
| Household Size | Owner-occupied | Renter-occupied |
| Less than High School | 454 (43.9%) | 581 (56.1%) |
| High School Diploma | 3,190 (62.2%) | 1,937 (37.8%) |
| College/Associate Degree | 3,449 (67.2%) | 1,680 (32.8%) |
| Bachelor's Degree or higher | 4,863 (78.5%) | 1,333 (21.5%) |
Occupancy by Age of Householder in Ohio County
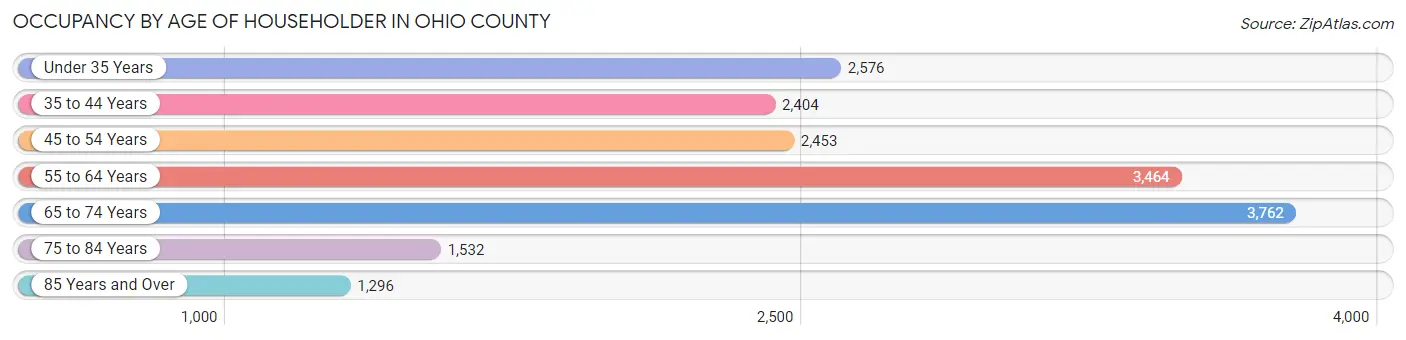
| Age Bracket | # Households | % Households |
| Under 35 Years | 2,576 | 14.7% |
| 35 to 44 Years | 2,404 | 13.8% |
| 45 to 54 Years | 2,453 | 14.0% |
| 55 to 64 Years | 3,464 | 19.8% |
| 65 to 74 Years | 3,762 | 21.5% |
| 75 to 84 Years | 1,532 | 8.8% |
| 85 Years and Over | 1,296 | 7.4% |
| Total | 17,487 | 100.0% |
Housing Finances in Ohio County
Median Income by Occupancy in Ohio County
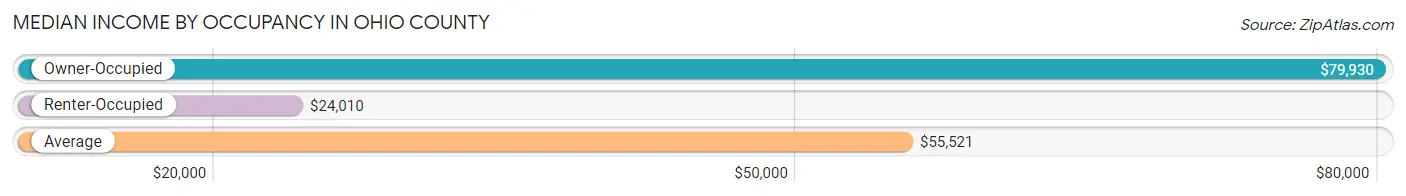
| Occupancy Type | # Households | Median Income |
| Owner-Occupied | 11,956 (68.4%) | $79,930 |
| Renter-Occupied | 5,531 (31.6%) | $24,010 |
| Average | 17,487 (100.0%) | $55,521 |
Occupancy by Householder Income Bracket in Ohio County
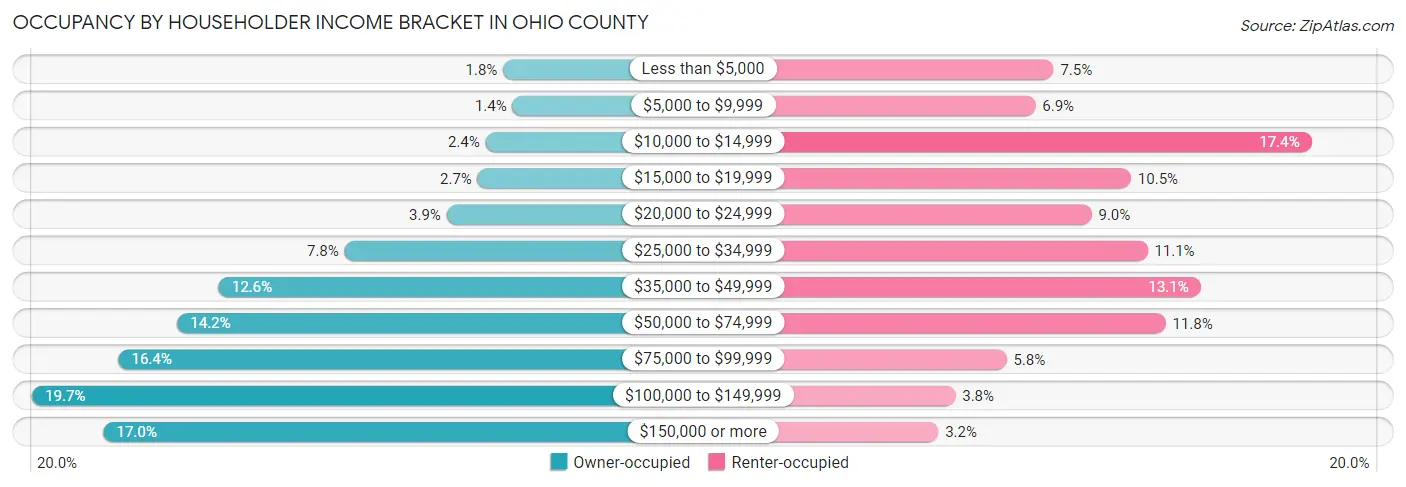
| Income Bracket | Owner-occupied | Renter-occupied |
| Less than $5,000 | 212 (1.8%) | 417 (7.5%) |
| $5,000 to $9,999 | 168 (1.4%) | 379 (6.9%) |
| $10,000 to $14,999 | 292 (2.4%) | 961 (17.4%) |
| $15,000 to $19,999 | 328 (2.7%) | 580 (10.5%) |
| $20,000 to $24,999 | 469 (3.9%) | 497 (9.0%) |
| $25,000 to $34,999 | 934 (7.8%) | 615 (11.1%) |
| $35,000 to $49,999 | 1,507 (12.6%) | 727 (13.1%) |
| $50,000 to $74,999 | 1,695 (14.2%) | 653 (11.8%) |
| $75,000 to $99,999 | 1,963 (16.4%) | 318 (5.8%) |
| $100,000 to $149,999 | 2,357 (19.7%) | 210 (3.8%) |
| $150,000 or more | 2,031 (17.0%) | 174 (3.2%) |
| Total | 11,956 (100.0%) | 5,531 (100.0%) |
Monthly Housing Cost Tiers in Ohio County
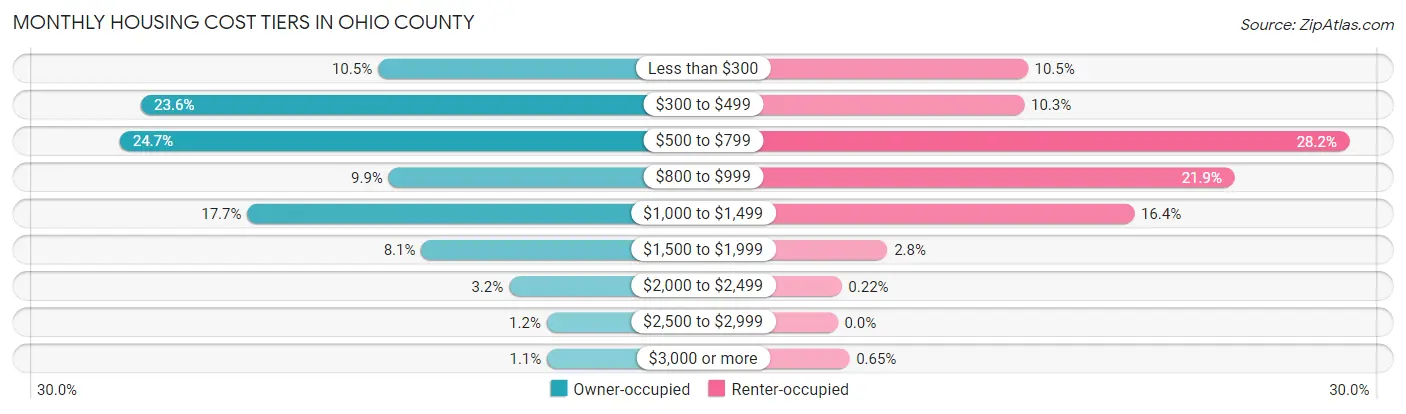
| Monthly Cost | Owner-occupied | Renter-occupied |
| Less than $300 | 1,253 (10.5%) | 581 (10.5%) |
| $300 to $499 | 2,817 (23.6%) | 570 (10.3%) |
| $500 to $799 | 2,958 (24.7%) | 1,562 (28.2%) |
| $800 to $999 | 1,183 (9.9%) | 1,211 (21.9%) |
| $1,000 to $1,499 | 2,116 (17.7%) | 906 (16.4%) |
| $1,500 to $1,999 | 967 (8.1%) | 152 (2.8%) |
| $2,000 to $2,499 | 387 (3.2%) | 12 (0.2%) |
| $2,500 to $2,999 | 139 (1.2%) | 0 (0.0%) |
| $3,000 or more | 136 (1.1%) | 36 (0.6%) |
| Total | 11,956 (100.0%) | 5,531 (100.0%) |
Physical Housing Characteristics in Ohio County
Housing Structures in Ohio County
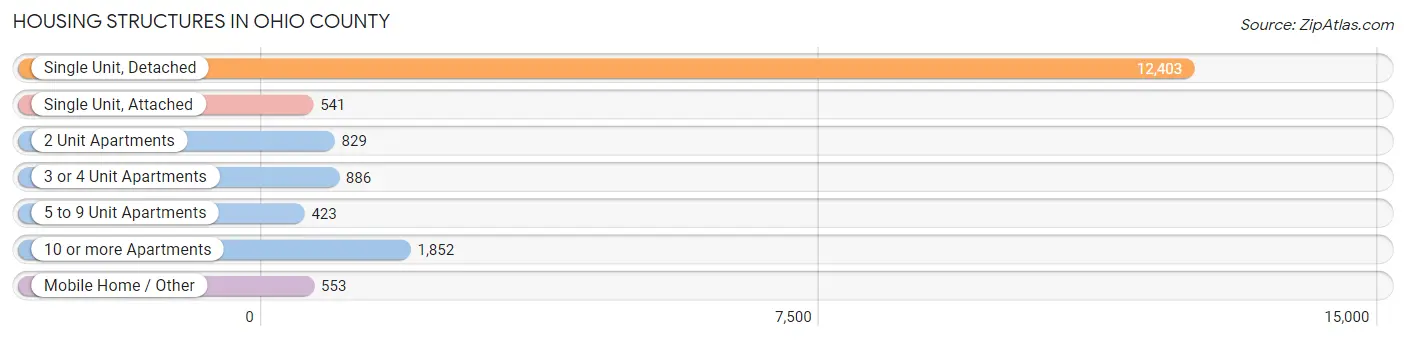
| Structure Type | # Housing Units | % Housing Units |
| Single Unit, Detached | 12,403 | 70.9% |
| Single Unit, Attached | 541 | 3.1% |
| 2 Unit Apartments | 829 | 4.7% |
| 3 or 4 Unit Apartments | 886 | 5.1% |
| 5 to 9 Unit Apartments | 423 | 2.4% |
| 10 or more Apartments | 1,852 | 10.6% |
| Mobile Home / Other | 553 | 3.2% |
| Total | 17,487 | 100.0% |
Housing Structures by Occupancy in Ohio County
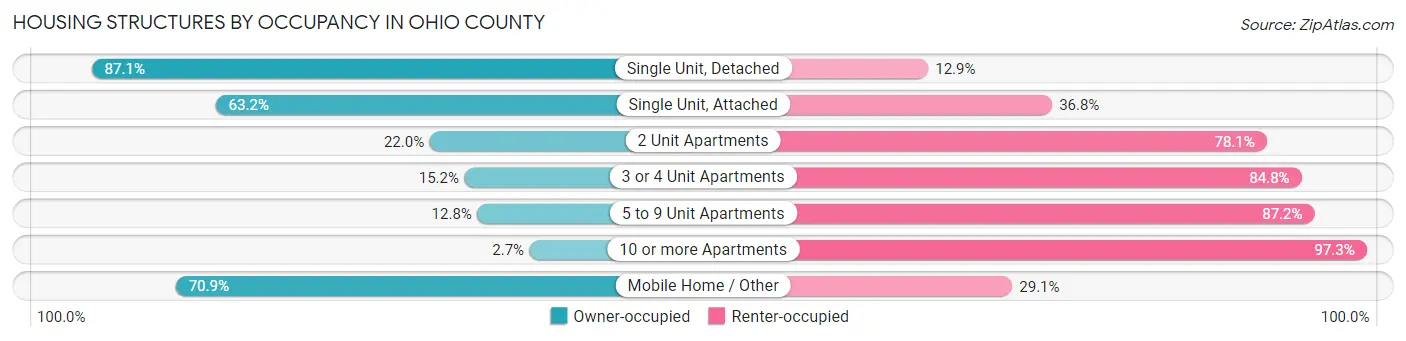
| Structure Type | Owner-occupied | Renter-occupied |
| Single Unit, Detached | 10,801 (87.1%) | 1,602 (12.9%) |
| Single Unit, Attached | 342 (63.2%) | 199 (36.8%) |
| 2 Unit Apartments | 182 (22.0%) | 647 (78.0%) |
| 3 or 4 Unit Apartments | 135 (15.2%) | 751 (84.8%) |
| 5 to 9 Unit Apartments | 54 (12.8%) | 369 (87.2%) |
| 10 or more Apartments | 50 (2.7%) | 1,802 (97.3%) |
| Mobile Home / Other | 392 (70.9%) | 161 (29.1%) |
| Total | 11,956 (68.4%) | 5,531 (31.6%) |
Housing Structures by Number of Rooms in Ohio County
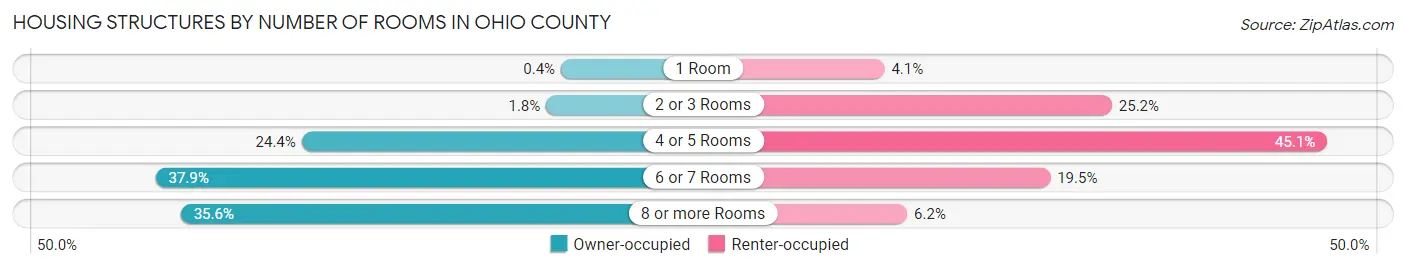
| Number of Rooms | Owner-occupied | Renter-occupied |
| 1 Room | 48 (0.4%) | 228 (4.1%) |
| 2 or 3 Rooms | 212 (1.8%) | 1,391 (25.2%) |
| 4 or 5 Rooms | 2,915 (24.4%) | 2,492 (45.1%) |
| 6 or 7 Rooms | 4,530 (37.9%) | 1,076 (19.5%) |
| 8 or more Rooms | 4,251 (35.6%) | 344 (6.2%) |
| Total | 11,956 (100.0%) | 5,531 (100.0%) |
Housing Structure by Heating Type in Ohio County
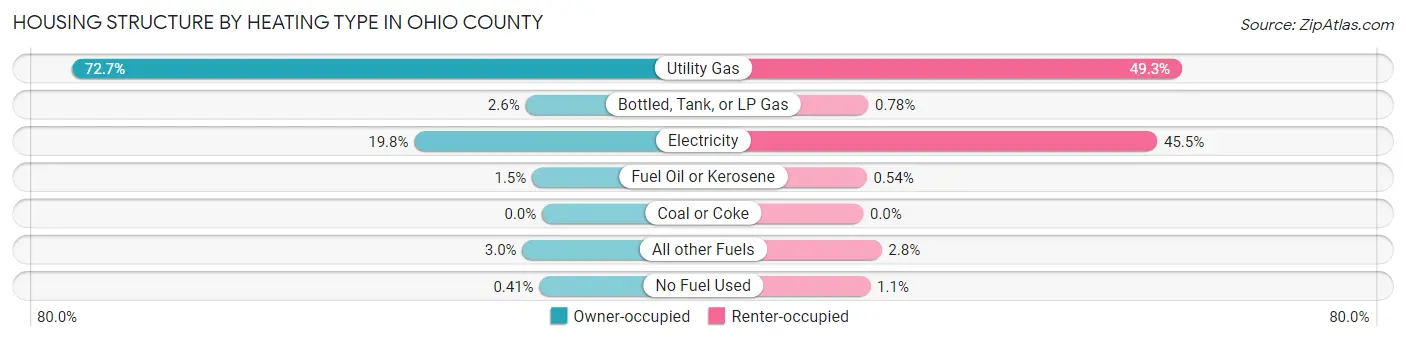
| Heating Type | Owner-occupied | Renter-occupied |
| Utility Gas | 8,691 (72.7%) | 2,726 (49.3%) |
| Bottled, Tank, or LP Gas | 307 (2.6%) | 43 (0.8%) |
| Electricity | 2,362 (19.8%) | 2,514 (45.5%) |
| Fuel Oil or Kerosene | 184 (1.5%) | 30 (0.5%) |
| Coal or Coke | 0 (0.0%) | 0 (0.0%) |
| All other Fuels | 363 (3.0%) | 157 (2.8%) |
| No Fuel Used | 49 (0.4%) | 61 (1.1%) |
| Total | 11,956 (100.0%) | 5,531 (100.0%) |
Household Vehicle Usage in Ohio County
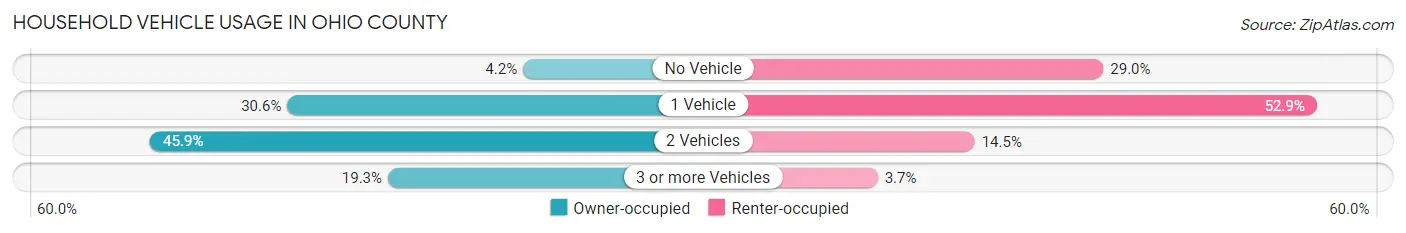
| Vehicles per Household | Owner-occupied | Renter-occupied |
| No Vehicle | 498 (4.2%) | 1,601 (28.9%) |
| 1 Vehicle | 3,656 (30.6%) | 2,923 (52.8%) |
| 2 Vehicles | 5,493 (45.9%) | 804 (14.5%) |
| 3 or more Vehicles | 2,309 (19.3%) | 203 (3.7%) |
| Total | 11,956 (100.0%) | 5,531 (100.0%) |
Real Estate & Mortgages in Ohio County
Real Estate and Mortgage Overview in Ohio County
| Characteristic | Without Mortgage | With Mortgage |
| Housing Units | 6,278 | 5,678 |
| Median Property Value | $143,400 | $161,800 |
| Median Household Income | $62,592 | $1,072 |
| Monthly Housing Costs | $436 | $136 |
| Real Estate Taxes | $959 | $139 |
Property Value by Mortgage Status in Ohio County
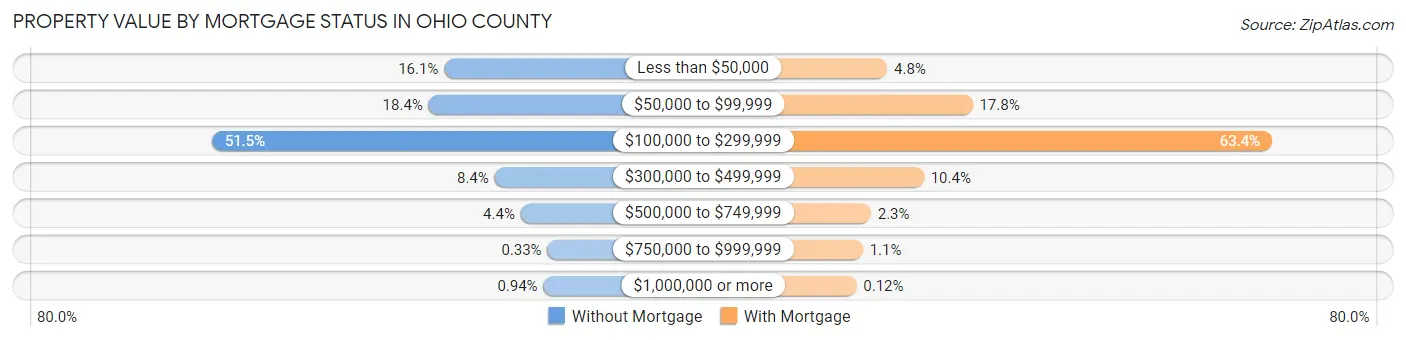
| Property Value | Without Mortgage | With Mortgage |
| Less than $50,000 | 1,008 (16.1%) | 273 (4.8%) |
| $50,000 to $99,999 | 1,157 (18.4%) | 1,012 (17.8%) |
| $100,000 to $299,999 | 3,231 (51.5%) | 3,602 (63.4%) |
| $300,000 to $499,999 | 526 (8.4%) | 590 (10.4%) |
| $500,000 to $749,999 | 276 (4.4%) | 132 (2.3%) |
| $750,000 to $999,999 | 21 (0.3%) | 62 (1.1%) |
| $1,000,000 or more | 59 (0.9%) | 7 (0.1%) |
| Total | 6,278 (100.0%) | 5,678 (100.0%) |
Household Income by Mortgage Status in Ohio County
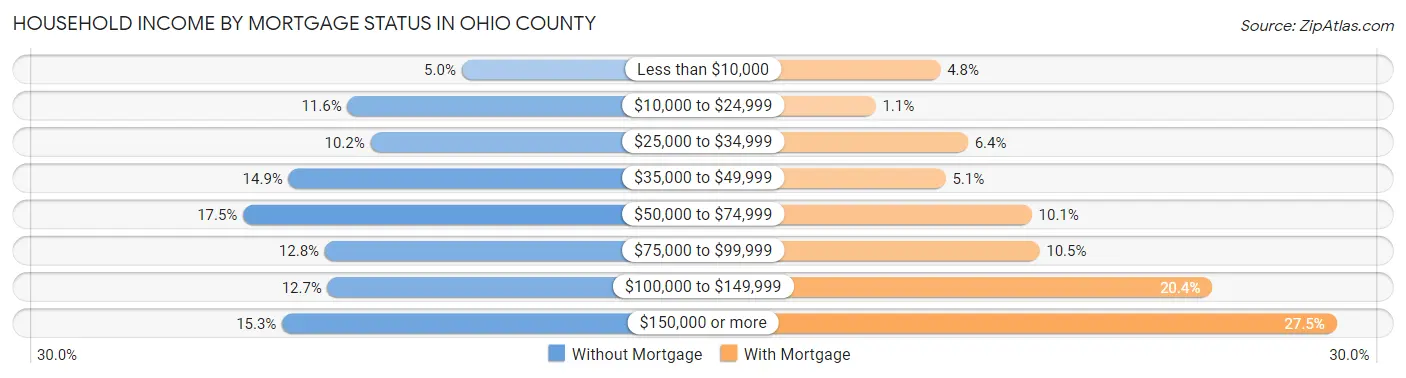
| Household Income | Without Mortgage | With Mortgage |
| Less than $10,000 | 315 (5.0%) | 275 (4.8%) |
| $10,000 to $24,999 | 725 (11.6%) | 65 (1.1%) |
| $25,000 to $34,999 | 642 (10.2%) | 364 (6.4%) |
| $35,000 to $49,999 | 936 (14.9%) | 292 (5.1%) |
| $50,000 to $74,999 | 1,099 (17.5%) | 571 (10.1%) |
| $75,000 to $99,999 | 806 (12.8%) | 596 (10.5%) |
| $100,000 to $149,999 | 796 (12.7%) | 1,157 (20.4%) |
| $150,000 or more | 959 (15.3%) | 1,561 (27.5%) |
| Total | 6,278 (100.0%) | 5,678 (100.0%) |
Property Value to Household Income Ratio in Ohio County
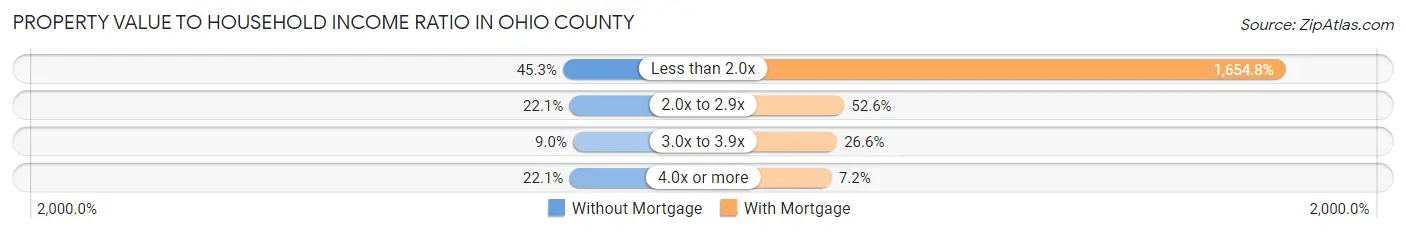
| Value-to-Income Ratio | Without Mortgage | With Mortgage |
| Less than 2.0x | 2,843 (45.3%) | 93,958 (1,654.8%) |
| 2.0x to 2.9x | 1,390 (22.1%) | 2,985 (52.6%) |
| 3.0x to 3.9x | 563 (9.0%) | 1,510 (26.6%) |
| 4.0x or more | 1,385 (22.1%) | 409 (7.2%) |
| Total | 6,278 (100.0%) | 5,678 (100.0%) |
Real Estate Taxes by Mortgage Status in Ohio County
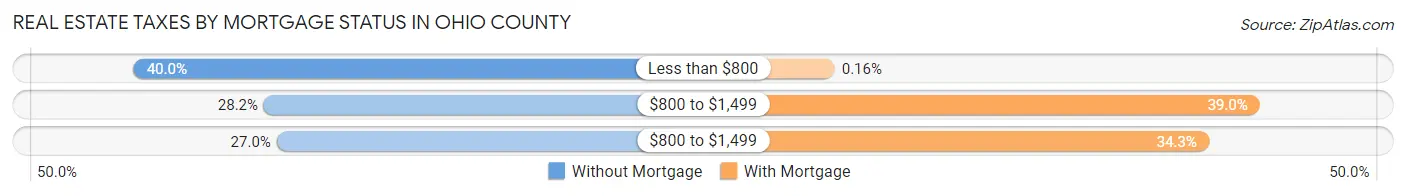
| Property Taxes | Without Mortgage | With Mortgage |
| Less than $800 | 2,513 (40.0%) | 9 (0.2%) |
| $800 to $1,499 | 1,767 (28.1%) | 2,212 (39.0%) |
| $800 to $1,499 | 1,694 (27.0%) | 1,948 (34.3%) |
| Total | 6,278 (100.0%) | 5,678 (100.0%) |
Health & Disability in Ohio County
Health Insurance Coverage by Age in Ohio County
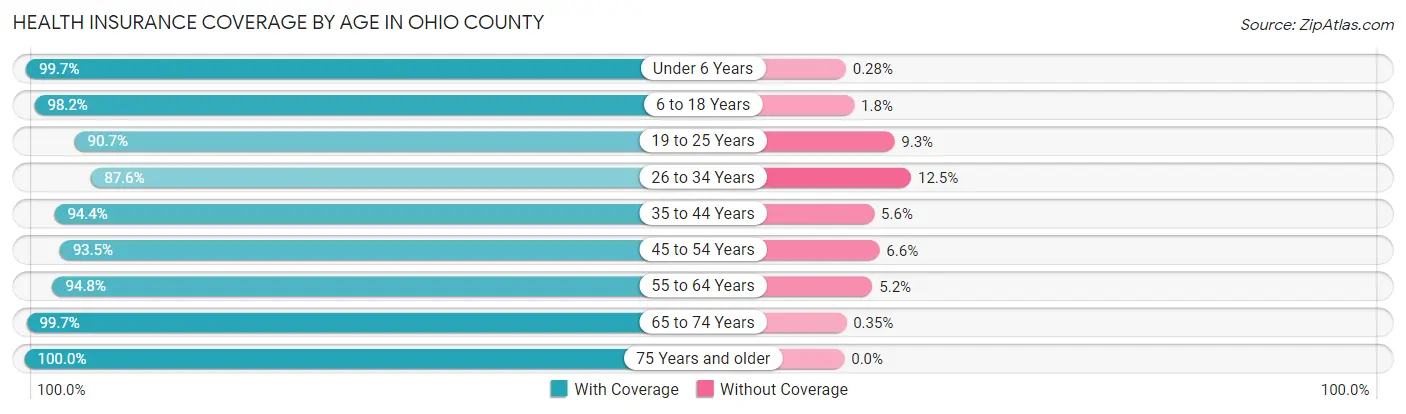
| Age Bracket | With Coverage | Without Coverage |
| Under 6 Years | 2,524 (99.7%) | 7 (0.3%) |
| 6 to 18 Years | 6,204 (98.2%) | 116 (1.8%) |
| 19 to 25 Years | 3,727 (90.7%) | 384 (9.3%) |
| 26 to 34 Years | 3,642 (87.5%) | 518 (12.4%) |
| 35 to 44 Years | 4,544 (94.4%) | 268 (5.6%) |
| 45 to 54 Years | 4,507 (93.4%) | 316 (6.6%) |
| 55 to 64 Years | 5,550 (94.8%) | 306 (5.2%) |
| 65 to 74 Years | 5,403 (99.7%) | 19 (0.4%) |
| 75 Years and older | 3,674 (100.0%) | 0 (0.0%) |
| Total | 39,775 (95.4%) | 1,934 (4.6%) |
Health Insurance Coverage by Citizenship Status in Ohio County
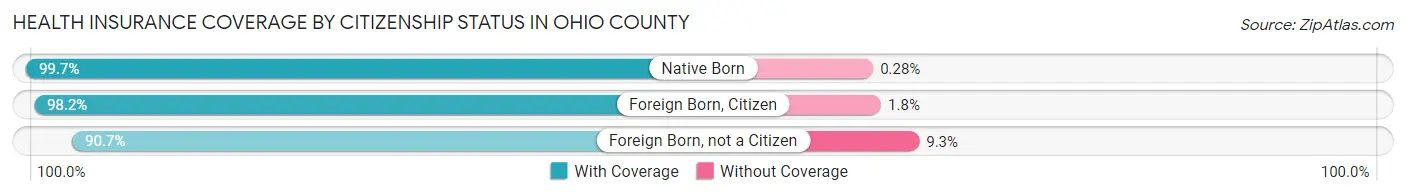
| Citizenship Status | With Coverage | Without Coverage |
| Native Born | 2,524 (99.7%) | 7 (0.3%) |
| Foreign Born, Citizen | 6,204 (98.2%) | 116 (1.8%) |
| Foreign Born, not a Citizen | 3,727 (90.7%) | 384 (9.3%) |
Health Insurance Coverage by Household Income in Ohio County
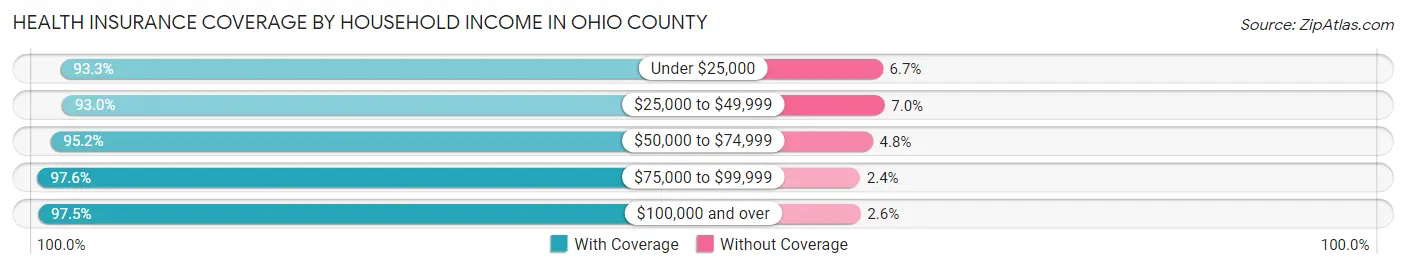
| Household Income | With Coverage | Without Coverage |
| Under $25,000 | 6,106 (93.3%) | 439 (6.7%) |
| $25,000 to $49,999 | 7,148 (93.0%) | 541 (7.0%) |
| $50,000 to $74,999 | 5,184 (95.2%) | 263 (4.8%) |
| $75,000 to $99,999 | 5,555 (97.6%) | 139 (2.4%) |
| $100,000 and over | 14,119 (97.5%) | 370 (2.5%) |
Public vs Private Health Insurance Coverage by Age in Ohio County
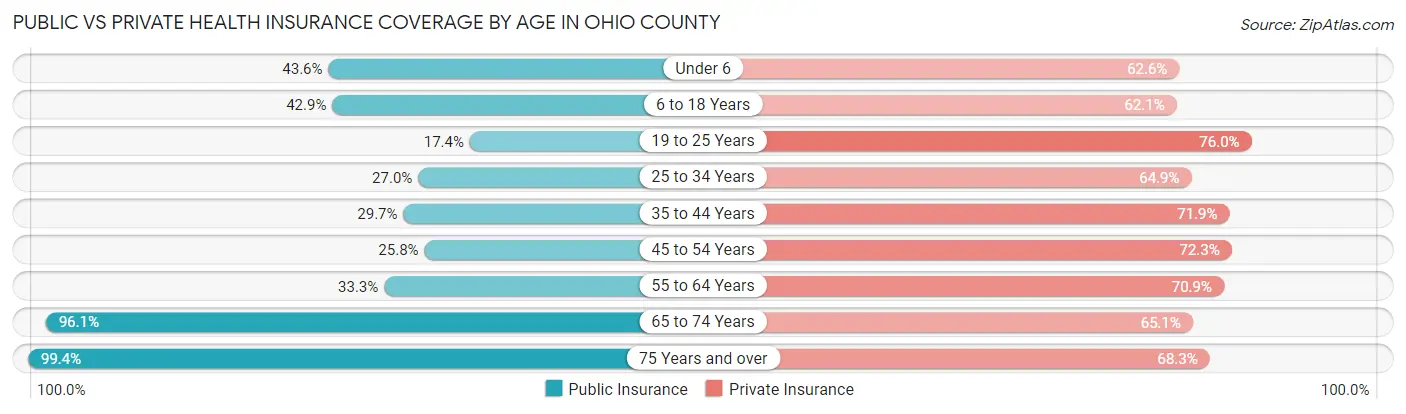
| Age Bracket | Public Insurance | Private Insurance |
| Under 6 | 1,104 (43.6%) | 1,585 (62.6%) |
| 6 to 18 Years | 2,711 (42.9%) | 3,926 (62.1%) |
| 19 to 25 Years | 714 (17.4%) | 3,125 (76.0%) |
| 25 to 34 Years | 1,121 (27.0%) | 2,699 (64.9%) |
| 35 to 44 Years | 1,429 (29.7%) | 3,461 (71.9%) |
| 45 to 54 Years | 1,244 (25.8%) | 3,489 (72.3%) |
| 55 to 64 Years | 1,948 (33.3%) | 4,152 (70.9%) |
| 65 to 74 Years | 5,209 (96.1%) | 3,532 (65.1%) |
| 75 Years and over | 3,652 (99.4%) | 2,508 (68.3%) |
| Total | 19,132 (45.9%) | 28,477 (68.3%) |
Disability Status by Sex by Age in Ohio County
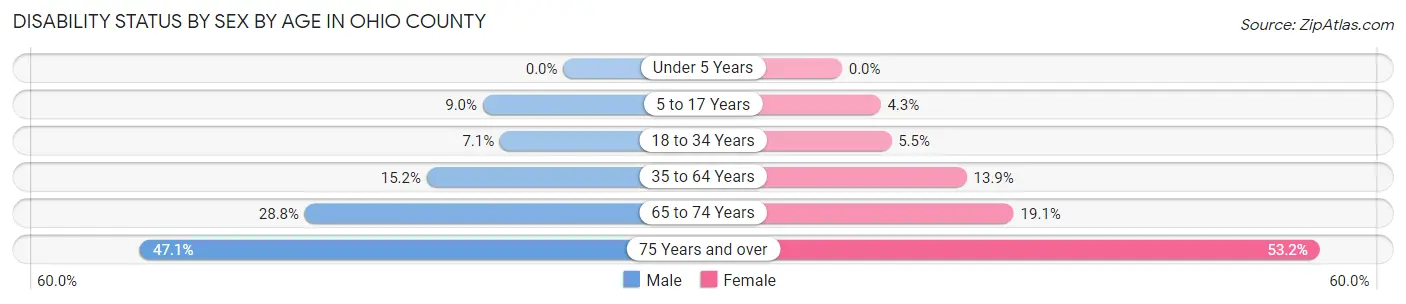
| Age Bracket | Male | Female |
| Under 5 Years | 0 (0.0%) | 0 (0.0%) |
| 5 to 17 Years | 271 (9.0%) | 128 (4.3%) |
| 18 to 34 Years | 317 (7.0%) | 246 (5.5%) |
| 35 to 64 Years | 1,167 (15.2%) | 1,086 (13.9%) |
| 65 to 74 Years | 735 (28.8%) | 549 (19.1%) |
| 75 Years and over | 659 (47.1%) | 1,211 (53.2%) |
Disability Class by Sex by Age in Ohio County
Disability Class: Hearing Difficulty
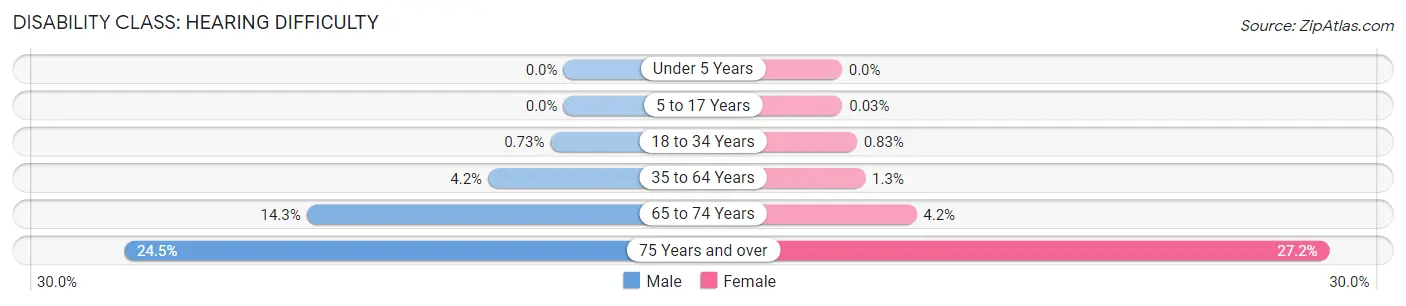
| Age Bracket | Male | Female |
| Under 5 Years | 0 (0.0%) | 0 (0.0%) |
| 5 to 17 Years | 0 (0.0%) | 1 (0.0%) |
| 18 to 34 Years | 33 (0.7%) | 37 (0.8%) |
| 35 to 64 Years | 322 (4.2%) | 102 (1.3%) |
| 65 to 74 Years | 365 (14.3%) | 119 (4.2%) |
| 75 Years and over | 342 (24.5%) | 618 (27.2%) |
Disability Class: Vision Difficulty
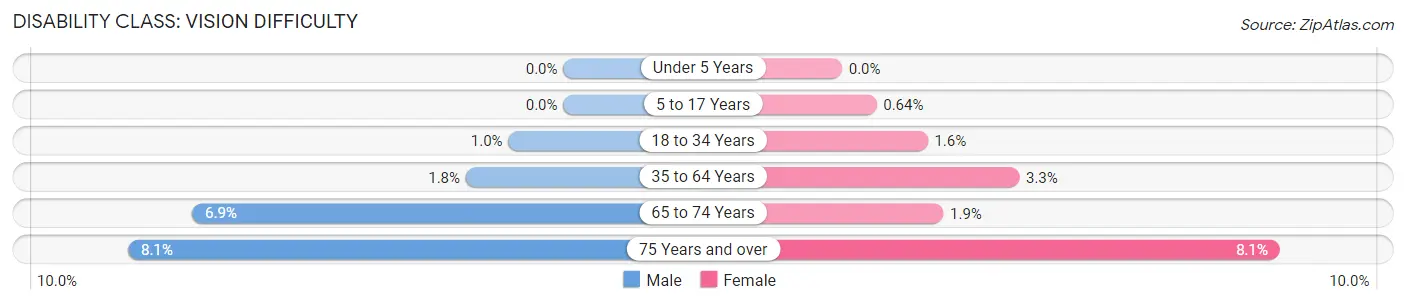
| Age Bracket | Male | Female |
| Under 5 Years | 0 (0.0%) | 0 (0.0%) |
| 5 to 17 Years | 0 (0.0%) | 19 (0.6%) |
| 18 to 34 Years | 46 (1.0%) | 71 (1.6%) |
| 35 to 64 Years | 139 (1.8%) | 257 (3.3%) |
| 65 to 74 Years | 176 (6.9%) | 54 (1.9%) |
| 75 Years and over | 113 (8.1%) | 185 (8.1%) |
Disability Class: Cognitive Difficulty
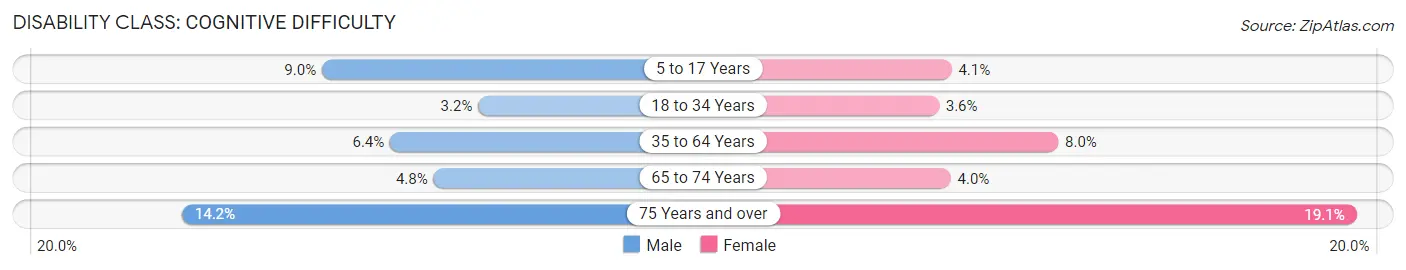
| Age Bracket | Male | Female |
| 5 to 17 Years | 271 (9.0%) | 121 (4.1%) |
| 18 to 34 Years | 142 (3.2%) | 161 (3.6%) |
| 35 to 64 Years | 493 (6.4%) | 628 (8.0%) |
| 65 to 74 Years | 123 (4.8%) | 116 (4.0%) |
| 75 Years and over | 198 (14.2%) | 435 (19.1%) |
Disability Class: Ambulatory Difficulty
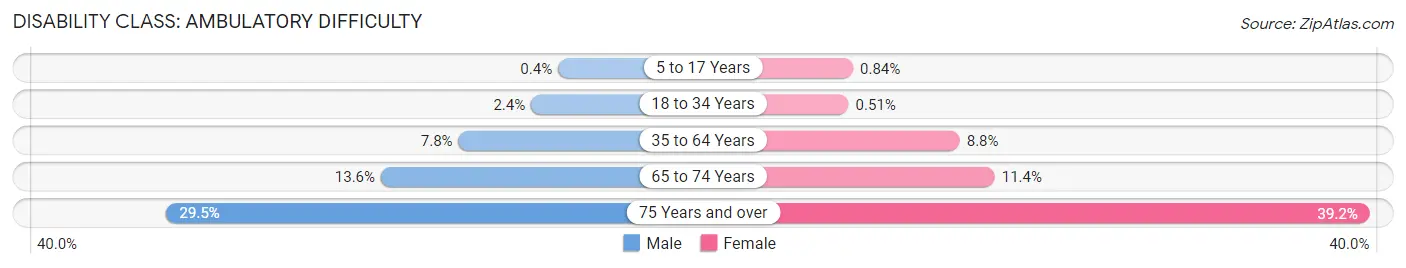
| Age Bracket | Male | Female |
| 5 to 17 Years | 12 (0.4%) | 25 (0.8%) |
| 18 to 34 Years | 108 (2.4%) | 23 (0.5%) |
| 35 to 64 Years | 598 (7.8%) | 685 (8.8%) |
| 65 to 74 Years | 346 (13.6%) | 326 (11.4%) |
| 75 Years and over | 412 (29.5%) | 892 (39.2%) |
Disability Class: Self-Care Difficulty
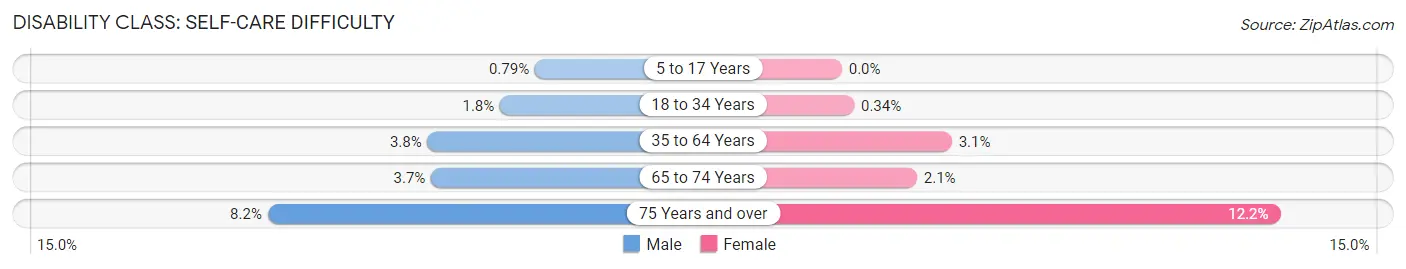
| Age Bracket | Male | Female |
| 5 to 17 Years | 24 (0.8%) | 0 (0.0%) |
| 18 to 34 Years | 79 (1.8%) | 15 (0.3%) |
| 35 to 64 Years | 290 (3.8%) | 239 (3.1%) |
| 65 to 74 Years | 94 (3.7%) | 60 (2.1%) |
| 75 Years and over | 115 (8.2%) | 278 (12.2%) |
Technology Access in Ohio County
Computing Device Access in Ohio County
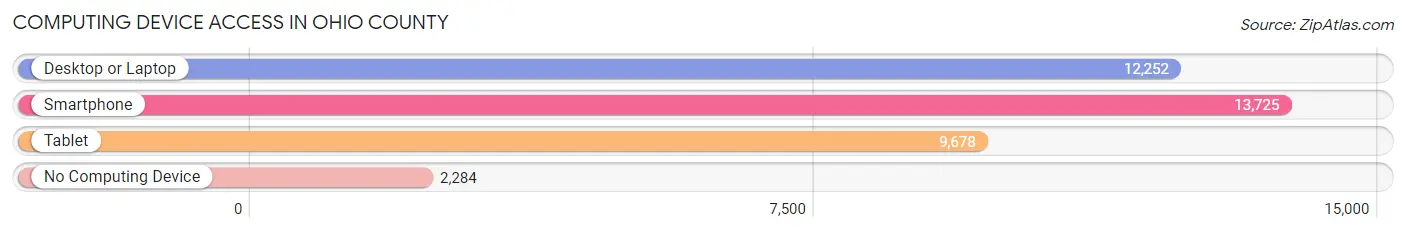
| Device Type | # Households | % Households |
| Desktop or Laptop | 12,252 | 70.1% |
| Smartphone | 13,725 | 78.5% |
| Tablet | 9,678 | 55.3% |
| No Computing Device | 2,284 | 13.1% |
| Total | 17,487 | 100.0% |
Internet Access in Ohio County
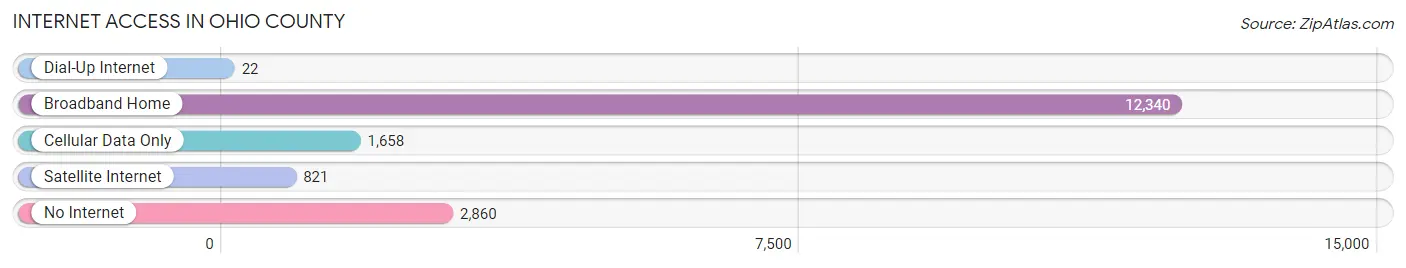
| Internet Type | # Households | % Households |
| Dial-Up Internet | 22 | 0.1% |
| Broadband Home | 12,340 | 70.6% |
| Cellular Data Only | 1,658 | 9.5% |
| Satellite Internet | 821 | 4.7% |
| No Internet | 2,860 | 16.4% |
| Total | 17,487 | 100.0% |
Ohio County Summary
History
Ohio County, West Virginia is located in the northern panhandle of the state and is bordered by Marshall County to the north, Wetzel County to the east, and Brooke County to the south. The county was created in 1776 from the western part of Yohogania County, Virginia. It was named after the Ohio River, which forms its western border. The county seat is Wheeling, which is also the largest city in the county.
Ohio County was an important part of the early history of West Virginia. It was the site of the first permanent settlement in the state, Fort Fincastle, which was built in 1774. During the American Revolution, the county was the site of several battles, including the Battle of Wheeling Island in 1777.
In the 19th century, Ohio County was an important center of industry and transportation. The National Road, the first federally funded highway in the United States, was built through the county in 1811. The Baltimore and Ohio Railroad also ran through the county, connecting it to the rest of the country.
The county was also an important center of the Underground Railroad, with many abolitionists living in the area. In 1859, the county was the site of the Wheeling Convention, which was the first step in the formation of the state of West Virginia.
Geography
Ohio County is located in the northern panhandle of West Virginia. It is bordered by Marshall County to the north, Wetzel County to the east, and Brooke County to the south. The county is located in the Appalachian Plateau region of the state, and is characterized by rolling hills and valleys.
The Ohio River forms the western border of the county, and the Wheeling Creek runs through the center of the county. The county is home to several state parks, including Oglebay Park, Tomlinson Run State Park, and Wheeling Island State Park.
Economy
Ohio County has a diverse economy, with a mix of manufacturing, retail, and service industries. The county is home to several large employers, including the Wheeling-Pittsburgh Steel Corporation, the West Virginia Northern Community College, and the Wheeling Hospital.
The county is also home to several tourist attractions, including Oglebay Park, the Wheeling Suspension Bridge, and the Wheeling Island Casino. Tourism is an important part of the county’s economy, and the county is home to several festivals and events throughout the year.
Demographics
As of the 2010 census, Ohio County had a population of 44,443. The population is predominantly white (93.3%), with small percentages of African Americans (3.3%), Asians (1.2%), and Native Americans (0.3%). The median household income is $41,945, and the median age is 41.
The county is home to several colleges and universities, including West Liberty University, Wheeling Jesuit University, and West Virginia Northern Community College. The county is also home to several museums, including the West Virginia Independence Hall and the Ohio County Historical Museum.
Common Questions
What is the Total Population of Ohio County?
Total Population of Ohio County is 42,224.
What is the Total Male Population of Ohio County?
Total Male Population of Ohio County is 20,497.
What is the Total Female Population of Ohio County?
Total Female Population of Ohio County is 21,727.
What is the Ratio of Males per 100 Females in Ohio County?
There are 94.34 Males per 100 Females in Ohio County.
What is the Ratio of Females per 100 Males in Ohio County?
There are 106.00 Females per 100 Males in Ohio County.
What is the Median Population Age in Ohio County?
Median Population Age in Ohio County is 43.1 Years.
What is the Average Family Size in Ohio County
Average Family Size in Ohio County is 3.0 People.
What is the Average Household Size in Ohio County
Average Household Size in Ohio County is 2.3 People.
What is Per Capita Income in Ohio County?
Per Capita income in Ohio County is $36,191.
What is the Median Family Income in Ohio County?
Median Family Income in Ohio County is $85,875.
What is the Median Household income in Ohio County?
Median Household Income in Ohio County is $55,521.
What is Income or Wage Gap in Ohio County?
Income or Wage Gap in Ohio County is 29.8%.
Women in Ohio County earn 70.2 cents for every dollar earned by a man.
What is Family Income Deficit in Ohio County?
Family Income Deficit in Ohio County is $9,558.
Families that are below poverty line in Ohio County earn $9,558 less on average than the poverty threshold level.
What is Inequality or Gini Index in Ohio County?
Inequality or Gini Index in Ohio County is 0.51.
How Large is the Labor Force in Ohio County?
There are 19,878 People in the Labor Forcein in Ohio County.
What is the Percentage of People in the Labor Force in Ohio County?
56.7% of People are in the Labor Force in Ohio County.
What is the Unemployment Rate in Ohio County?
Unemployment Rate in Ohio County is 5.3%.