Morgan County, WV
Morgan County Map

Morgan County Overview
17,237
TOTAL POPULATION
8,783
MALE POPULATION
8,454
FEMALE POPULATION
103.89
MALES / 100 FEMALES
96.25
FEMALES / 100 MALES
48.6
MEDIAN AGE
2.9
AVG FAMILY SIZE
2.4
AVG HOUSEHOLD SIZE
$33,029
PER CAPITA INCOME
$73,192
AVG FAMILY INCOME
$61,021
AVG HOUSEHOLD INCOME
29.9%
WAGE / INCOME GAP [ % ]
70.1¢/ $1
WAGE / INCOME GAP [ $ ]
0.40
INEQUALITY / GINI INDEX
8,227
LABOR FORCE [ PEOPLE ]
56.2%
PERCENT IN LABOR FORCE
5.1%
UNEMPLOYMENT RATE
Morgan County Area Codes
Race in Morgan County
The most populous races in Morgan County are White / Caucasian (16,289 | 94.5%), Two or more Races (564 | 3.3%), and Hispanic or Latino (331 | 1.9%).

| Race | # Population | % Population |
| Asian | 87 | 0.5% |
| Black / African American | 27 | 0.2% |
| Hawaiian / Pacific | 0 | 0.0% |
| Hispanic or Latino | 331 | 1.9% |
| Native / Alaskan | 121 | 0.7% |
| White / Caucasian | 16,289 | 94.5% |
| Two or more Races | 564 | 3.3% |
| Some other Race | 149 | 0.9% |
| Total | 17,237 | 100.0% |
Ancestry in Morgan County
The most populous ancestries reported in Morgan County are German (3,404 | 19.8%), Irish (2,121 | 12.3%), American (2,017 | 11.7%), English (1,930 | 11.2%), and Italian (658 | 3.8%), together accounting for 58.8% of all Morgan County residents.

| Ancestry | # Population | % Population |
| American | 2,017 | 11.7% |
| Apache | 7 | 0.0% |
| Arab | 8 | 0.1% |
| Austrian | 11 | 0.1% |
| Bhutanese | 14 | 0.1% |
| Blackfeet | 5 | 0.0% |
| Brazilian | 34 | 0.2% |
| British | 58 | 0.3% |
| Burmese | 28 | 0.2% |
| Celtic | 53 | 0.3% |
| Central American | 67 | 0.4% |
| Cherokee | 134 | 0.8% |
| Chilean | 4 | 0.0% |
| Choctaw | 7 | 0.0% |
| Cuban | 6 | 0.0% |
| Czech | 79 | 0.5% |
| Czechoslovakian | 28 | 0.2% |
| Danish | 53 | 0.3% |
| Dutch | 105 | 0.6% |
| Dutch West Indian | 18 | 0.1% |
| Eastern European | 19 | 0.1% |
| English | 1,930 | 11.2% |
| European | 237 | 1.4% |
| Finnish | 12 | 0.1% |
| French | 223 | 1.3% |
| French Canadian | 88 | 0.5% |
| German | 3,404 | 19.8% |
| Greek | 244 | 1.4% |
| Hungarian | 92 | 0.5% |
| Irish | 2,121 | 12.3% |
| Italian | 658 | 3.8% |
| Korean | 64 | 0.4% |
| Latvian | 4 | 0.0% |
| Mexican | 64 | 0.4% |
| Native Hawaiian | 7 | 0.0% |
| Nigerian | 9 | 0.1% |
| Northern European | 10 | 0.1% |
| Norwegian | 14 | 0.1% |
| Pakistani | 5 | 0.0% |
| Panamanian | 14 | 0.1% |
| Polish | 218 | 1.3% |
| Portuguese | 11 | 0.1% |
| Potawatomi | 8 | 0.1% |
| Puerto Rican | 63 | 0.4% |
| Romanian | 4 | 0.0% |
| Russian | 25 | 0.2% |
| Salvadoran | 53 | 0.3% |
| Scandinavian | 129 | 0.7% |
| Scotch-Irish | 424 | 2.5% |
| Scottish | 508 | 2.9% |
| Slovak | 11 | 0.1% |
| South American | 4 | 0.0% |
| Subsaharan African | 9 | 0.1% |
| Swedish | 48 | 0.3% |
| Swiss | 132 | 0.8% |
| Thai | 12 | 0.1% |
| Trinidadian and Tobagonian | 35 | 0.2% |
| U.S. Virgin Islander | 18 | 0.1% |
| Ukrainian | 22 | 0.1% |
| Welsh | 131 | 0.8% |
| Yugoslavian | 3 | 0.0% | View All 61 Rows |
Immigrants in Morgan County
The most numerous immigrant groups reported in Morgan County came from Latin America (111 | 0.6%), Europe (66 | 0.4%), Central America (63 | 0.4%), Caribbean (35 | 0.2%), and Asia (32 | 0.2%), together accounting for 1.8% of all Morgan County residents.

| Immigration Origin | # Population | % Population |
| Asia | 32 | 0.2% |
| Austria | 14 | 0.1% |
| Brazil | 13 | 0.1% |
| Canada | 7 | 0.0% |
| Caribbean | 35 | 0.2% |
| Central America | 63 | 0.4% |
| Czechoslovakia | 11 | 0.1% |
| Eastern Asia | 24 | 0.1% |
| Eastern Europe | 16 | 0.1% |
| El Salvador | 23 | 0.1% |
| England | 26 | 0.2% |
| Europe | 66 | 0.4% |
| Germany | 10 | 0.1% |
| Korea | 24 | 0.1% |
| Latin America | 111 | 0.6% |
| Mexico | 26 | 0.2% |
| Northern Europe | 26 | 0.2% |
| Panama | 14 | 0.1% |
| Philippines | 8 | 0.1% |
| South America | 13 | 0.1% |
| South Eastern Asia | 8 | 0.1% |
| Trinidad and Tobago | 17 | 0.1% |
| Ukraine | 5 | 0.0% |
| Western Europe | 24 | 0.1% | View All 24 Rows |
Sex and Age in Morgan County
Sex and Age in Morgan County
The most populous age groups in Morgan County are 70 to 74 Years (805 | 9.2%) for men and 60 to 64 Years (737 | 8.7%) for women.

| Age Bracket | Male | Female |
| Under 5 Years | 325 (3.7%) | 340 (4.0%) |
| 5 to 9 Years | 419 (4.8%) | 250 (3.0%) |
| 10 to 14 Years | 435 (5.0%) | 613 (7.2%) |
| 15 to 19 Years | 553 (6.3%) | 547 (6.5%) |
| 20 to 24 Years | 421 (4.8%) | 274 (3.2%) |
| 25 to 29 Years | 586 (6.7%) | 426 (5.0%) |
| 30 to 34 Years | 412 (4.7%) | 431 (5.1%) |
| 35 to 39 Years | 529 (6.0%) | 401 (4.7%) |
| 40 to 44 Years | 402 (4.6%) | 469 (5.6%) |
| 45 to 49 Years | 581 (6.6%) | 495 (5.9%) |
| 50 to 54 Years | 675 (7.7%) | 613 (7.2%) |
| 55 to 59 Years | 677 (7.7%) | 685 (8.1%) |
| 60 to 64 Years | 783 (8.9%) | 737 (8.7%) |
| 65 to 69 Years | 464 (5.3%) | 718 (8.5%) |
| 70 to 74 Years | 805 (9.2%) | 556 (6.6%) |
| 75 to 79 Years | 432 (4.9%) | 554 (6.6%) |
| 80 to 84 Years | 178 (2.0%) | 160 (1.9%) |
| 85 Years and over | 106 (1.2%) | 185 (2.2%) |
| Total | 8,783 (100.0%) | 8,454 (100.0%) |
Families and Households in Morgan County
Median Family Size in Morgan County
The median family size in Morgan County is 2.90 persons per family, with single male/father families (426 | 8.9%) accounting for the largest median family size of 3.41 persons per family. On the other hand, married-couple families (3,749 | 78.3%) represent the smallest median family size with 2.79 persons per family.

| Family Type | # Families | Family Size |
| Married-Couple | 3,749 (78.3%) | 2.79 |
| Single Male/Father | 426 (8.9%) | 3.41 |
| Single Female/Mother | 615 (12.8%) | 3.23 |
| Total Families | 4,790 (100.0%) | 2.90 |
Median Household Size in Morgan County
The median household size in Morgan County is 2.42 persons per household, with single male/father households (426 | 6.0%) accounting for the largest median household size of 3.73 persons per household. non-family households (2,263 | 32.1%) represent the smallest median household size with 1.19 persons per household.

| Household Type | # Households | Household Size |
| Married-Couple | 3,749 (53.1%) | 2.83 |
| Single Male/Father | 426 (6.0%) | 3.73 |
| Single Female/Mother | 615 (8.7%) | 3.57 |
| Non-family | 2,263 (32.1%) | 1.19 |
| Total Households | 7,053 (100.0%) | 2.42 |
Household Size by Marriage Status in Morgan County
Out of a total of 7,053 households in Morgan County, 4,790 (67.9%) are family households, while 2,263 (32.1%) are nonfamily households. The most numerous type of family households are 2-person households, comprising 2,685, and the most common type of nonfamily households are 1-person households, comprising 1,911.

| Household Size | Family Households | Nonfamily Households |
| 1-Person Households | - | 1,911 (27.1%) |
| 2-Person Households | 2,685 (38.1%) | 334 (4.7%) |
| 3-Person Households | 751 (10.6%) | 18 (0.3%) |
| 4-Person Households | 765 (10.8%) | 0 (0.0%) |
| 5-Person Households | 453 (6.4%) | 0 (0.0%) |
| 6-Person Households | 108 (1.5%) | 0 (0.0%) |
| 7+ Person Households | 28 (0.4%) | 0 (0.0%) |
| Total | 4,790 (67.9%) | 2,263 (32.1%) |
Female Fertility in Morgan County
Fertility by Age in Morgan County
Average fertility rate in Morgan County is 59.0 births per 1,000 women. Women in the age bracket of 20 to 34 years have the highest fertility rate with 134.0 births per 1,000 women. Women in the age bracket of 20 to 34 years acount for 84.0% of all women with births.

| Age Bracket | Women with Births | Births / 1,000 Women |
| 15 to 19 years | 0 (0.0%) | 0.0 |
| 20 to 34 years | 152 (84.0%) | 134.0 |
| 35 to 50 years | 29 (16.0%) | 21.0 |
| Total | 181 (100.0%) | 59.0 |
Fertility by Age by Marriage Status in Morgan County
61.3% of women with births (181) in Morgan County are married. The highest percentage of unmarried women with births falls into 20 to 34 years age bracket with 46.1% of them unmarried at the time of birth, while the lowest percentage of unmarried women with births belong to 35 to 50 years age bracket with 0.0% of them unmarried.

| Age Bracket | Married | Unmarried |
| 15 to 19 years | 0 (0.0%) | 0 (0.0%) |
| 20 to 34 years | 82 (53.9%) | 70 (46.1%) |
| 35 to 50 years | 29 (100.0%) | 0 (0.0%) |
| Total | 111 (61.3%) | 70 (38.7%) |
Fertility by Education in Morgan County

| Educational Attainment | Women with Births | Births / 1,000 Women |
| Less than High School | 0 (0.0%) | 0.0 |
| High School Diploma | 113 (62.4%) | 104.0 |
| College or Associate's Degree | 42 (23.2%) | 44.0 |
| Bachelor's Degree | 3 (1.7%) | 10.0 |
| Graduate Degree | 23 (12.7%) | 100.0 |
| Total | 181 (100.0%) | 59.0 |
Fertility by Education by Marriage Status in Morgan County
38.7% of women with births in Morgan County are unmarried. Women with the educational attainment of bachelor's degree are most likely to be married with 100.0% of them married at childbirth, while women with the educational attainment of college or associate's degree are least likely to be married with 47.6% of them unmarried at childbirth.
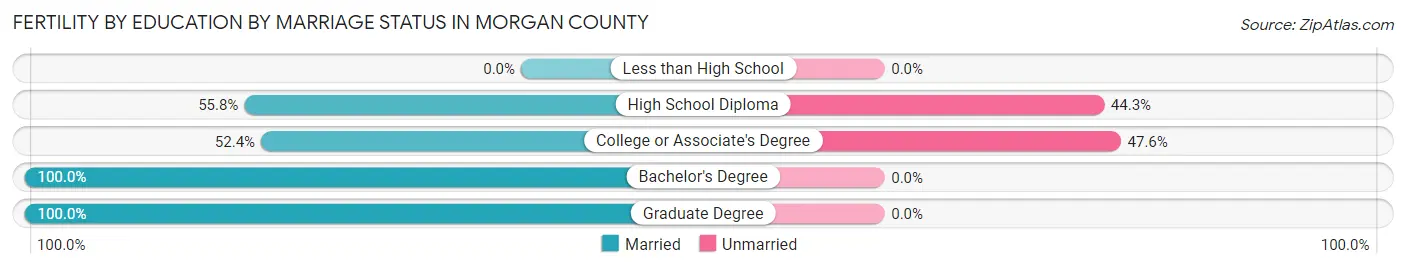
| Educational Attainment | Married | Unmarried |
| Less than High School | 0 (0.0%) | 0 (0.0%) |
| High School Diploma | 63 (55.7%) | 50 (44.3%) |
| College or Associate's Degree | 22 (52.4%) | 20 (47.6%) |
| Bachelor's Degree | 3 (100.0%) | 0 (0.0%) |
| Graduate Degree | 23 (100.0%) | 0 (0.0%) |
| Total | 111 (61.3%) | 70 (38.7%) |
Income in Morgan County
Income Overview in Morgan County
Per Capita Income in Morgan County is $33,029, while median incomes of families and households are $73,192 and $61,021 respectively.
| Characteristic | Number | Measure |
| Per Capita Income | 17,237 | $33,029 |
| Median Family Income | 4,790 | $73,192 |
| Mean Family Income | 4,790 | $89,458 |
| Median Household Income | 7,053 | $61,021 |
| Mean Household Income | 7,053 | $76,466 |
| Income Deficit | 4,790 | $0 |
| Wage / Income Gap (%) | 17,237 | 29.89% |
| Wage / Income Gap ($) | 17,237 | 70.11¢ per $1 |
| Gini / Inequality Index | 17,237 | 0.40 |
Earnings by Sex in Morgan County
Average Earnings in Morgan County are $35,784, $41,620 for men and $29,178 for women, a difference of 29.9%.

| Sex | Number | Average Earnings |
| Male | 4,702 (54.7%) | $41,620 |
| Female | 3,900 (45.3%) | $29,178 |
| Total | 8,602 (100.0%) | $35,784 |
Earnings by Sex by Income Bracket in Morgan County
The most common earnings brackets in Morgan County are $75,000 to $99,999 for men (520 | 11.1%) and $25,000 to $29,999 for women (482 | 12.4%).

| Income | Male | Female |
| $2,499 or less | 124 (2.6%) | 357 (9.1%) |
| $2,500 to $4,999 | 63 (1.3%) | 113 (2.9%) |
| $5,000 to $7,499 | 193 (4.1%) | 179 (4.6%) |
| $7,500 to $9,999 | 74 (1.6%) | 103 (2.6%) |
| $10,000 to $12,499 | 98 (2.1%) | 247 (6.3%) |
| $12,500 to $14,999 | 95 (2.0%) | 168 (4.3%) |
| $15,000 to $17,499 | 205 (4.4%) | 90 (2.3%) |
| $17,500 to $19,999 | 61 (1.3%) | 33 (0.9%) |
| $20,000 to $22,499 | 35 (0.7%) | 140 (3.6%) |
| $22,500 to $24,999 | 210 (4.5%) | 164 (4.2%) |
| $25,000 to $29,999 | 240 (5.1%) | 482 (12.4%) |
| $30,000 to $34,999 | 493 (10.5%) | 254 (6.5%) |
| $35,000 to $39,999 | 287 (6.1%) | 311 (8.0%) |
| $40,000 to $44,999 | 321 (6.8%) | 265 (6.8%) |
| $45,000 to $49,999 | 267 (5.7%) | 269 (6.9%) |
| $50,000 to $54,999 | 198 (4.2%) | 153 (3.9%) |
| $55,000 to $64,999 | 383 (8.2%) | 186 (4.8%) |
| $65,000 to $74,999 | 370 (7.9%) | 112 (2.9%) |
| $75,000 to $99,999 | 520 (11.1%) | 90 (2.3%) |
| $100,000+ | 465 (9.9%) | 184 (4.7%) |
| Total | 4,702 (100.0%) | 3,900 (100.0%) |
Earnings by Sex by Educational Attainment in Morgan County
Average earnings in Morgan County are $46,772 for men and $31,535 for women, a difference of 32.6%. Men with an educational attainment of graduate degree enjoy the highest average annual earnings of $66,875, while those with less than high school education earn the least with $34,034. Women with an educational attainment of graduate degree earn the most with the average annual earnings of $56,136, while those with less than high school education have the smallest earnings of $15,225.

| Educational Attainment | Male Income | Female Income |
| Less than High School | $34,034 | $15,225 |
| High School Diploma | $45,014 | $29,182 |
| College or Associate's Degree | $55,129 | $32,140 |
| Bachelor's Degree | $52,173 | $43,583 |
| Graduate Degree | $66,875 | $56,136 |
| Total | $46,772 | $31,535 |
Family Income in Morgan County
Family Income Brackets in Morgan County
According to the Morgan County family income data, there are 1,193 families falling into the $50,000 to $74,999 income range, which is the most common income bracket and makes up 24.9% of all families. Conversely, the $10,000 to $14,999 income bracket is the least frequent group with only 43 families (0.9%) belonging to this category.

| Income Bracket | # Families | % Families |
| Less than $10,000 | 115 | 2.4% |
| $10,000 to $14,999 | 43 | 0.9% |
| $15,000 to $24,999 | 211 | 4.4% |
| $25,000 to $34,999 | 316 | 6.6% |
| $35,000 to $49,999 | 565 | 11.8% |
| $50,000 to $74,999 | 1,193 | 24.9% |
| $75,000 to $99,999 | 795 | 16.6% |
| $100,000 to $149,999 | 1,030 | 21.5% |
| $150,000 to $199,999 | 297 | 6.2% |
| $200,000+ | 225 | 4.7% |
Family Income by Famaliy Size in Morgan County
5-person families (338 | 7.1%) account for the highest median family income in Morgan County with $105,027 per family, while 2-person families (2,742 | 57.2%) have the highest median income of $35,678 per family member.

| Income Bracket | # Families | Median Income |
| 2-Person Families | 2,742 (57.2%) | $71,357 |
| 3-Person Families | 863 (18.0%) | $75,226 |
| 4-Person Families | 748 (15.6%) | $82,632 |
| 5-Person Families | 338 (7.1%) | $105,027 |
| 6-Person Families | 71 (1.5%) | $45,492 |
| 7+ Person Families | 28 (0.6%) | $0 |
| Total | 4,790 (100.0%) | $73,192 |
Family Income by Number of Earners in Morgan County
The median family income in Morgan County is $73,192, with families comprising 2 earners (1,943) having the highest median family income of $97,204, while families with no earners (965) have the lowest median family income of $45,120, accounting for 40.6% and 20.2% of families, respectively.

| Number of Earners | # Families | Median Income |
| No Earners | 965 (20.2%) | $45,120 |
| 1 Earner | 1,625 (33.9%) | $64,420 |
| 2 Earners | 1,943 (40.6%) | $97,204 |
| 3+ Earners | 257 (5.4%) | $94,196 |
| Total | 4,790 (100.0%) | $73,192 |
Household Income in Morgan County
Household Income Brackets in Morgan County
With 1,636 households falling in the category, the $50,000 to $74,999 income range is the most frequent in Morgan County, accounting for 23.2% of all households. In contrast, only 233 households (3.3%) fall into the $200,000+ income bracket, making it the least populous group.

| Income Bracket | # Households | % Households |
| Less than $10,000 | 296 | 4.2% |
| $10,000 to $14,999 | 268 | 3.8% |
| $15,000 to $24,999 | 465 | 6.6% |
| $25,000 to $34,999 | 719 | 10.2% |
| $35,000 to $49,999 | 882 | 12.5% |
| $50,000 to $74,999 | 1,636 | 23.2% |
| $75,000 to $99,999 | 1,044 | 14.8% |
| $100,000 to $149,999 | 1,185 | 16.8% |
| $150,000 to $199,999 | 317 | 4.5% |
| $200,000+ | 233 | 3.3% |
Household Income by Householder Age in Morgan County
The median household income in Morgan County is $61,021, with the highest median household income of $74,095 found in the 25 to 44 years age bracket for the primary householder. A total of 1,451 households (20.6%) fall into this category. Meanwhile, the 15 to 24 years age bracket for the primary householder has the lowest median household income of $26,524, with 128 households (1.8%) in this group.

| Income Bracket | # Households | Median Income |
| 15 to 24 Years | 128 (1.8%) | $26,524 |
| 25 to 44 Years | 1,451 (20.6%) | $74,095 |
| 45 to 64 Years | 2,776 (39.4%) | $72,763 |
| 65+ Years | 2,698 (38.3%) | $49,103 |
| Total | 7,053 (100.0%) | $61,021 |
Poverty in Morgan County
Income Below Poverty by Sex and Age in Morgan County
With 11.3% poverty level for males and 9.8% for females among the residents of Morgan County, under 5 year old males and 18 to 24 year old females are the most vulnerable to poverty, with 134 males (41.2%) and 141 females (26.7%) in their respective age groups living below the poverty level.

| Age Bracket | Male | Female |
| Under 5 Years | 134 (41.2%) | 55 (16.2%) |
| 5 Years | 0 (0.0%) | 0 (0.0%) |
| 6 to 11 Years | 142 (28.9%) | 31 (7.4%) |
| 12 to 14 Years | 21 (9.1%) | 29 (7.2%) |
| 15 Years | 38 (29.2%) | 3 (3.5%) |
| 16 and 17 Years | 47 (23.9%) | 15 (7.3%) |
| 18 to 24 Years | 25 (3.9%) | 141 (26.7%) |
| 25 to 34 Years | 64 (6.4%) | 29 (3.4%) |
| 35 to 44 Years | 83 (8.9%) | 119 (13.7%) |
| 45 to 54 Years | 80 (6.4%) | 62 (5.6%) |
| 55 to 64 Years | 141 (9.9%) | 172 (12.1%) |
| 65 to 74 Years | 150 (11.8%) | 134 (10.6%) |
| 75 Years and over | 66 (9.3%) | 27 (3.3%) |
| Total | 991 (11.3%) | 817 (9.8%) |
Income Above Poverty by Sex and Age in Morgan County
According to the poverty statistics in Morgan County, males aged 5 years and females aged 5 years are the age groups that are most secure financially, with 100.0% of males and 100.0% of females in these age groups living above the poverty line.

| Age Bracket | Male | Female |
| Under 5 Years | 191 (58.8%) | 285 (83.8%) |
| 5 Years | 131 (100.0%) | 3 (100.0%) |
| 6 to 11 Years | 350 (71.1%) | 385 (92.5%) |
| 12 to 14 Years | 210 (90.9%) | 375 (92.8%) |
| 15 Years | 92 (70.8%) | 84 (96.6%) |
| 16 and 17 Years | 150 (76.1%) | 190 (92.7%) |
| 18 to 24 Years | 622 (96.1%) | 388 (73.4%) |
| 25 to 34 Years | 934 (93.6%) | 828 (96.6%) |
| 35 to 44 Years | 848 (91.1%) | 751 (86.3%) |
| 45 to 54 Years | 1,176 (93.6%) | 1,046 (94.4%) |
| 55 to 64 Years | 1,284 (90.1%) | 1,250 (87.9%) |
| 65 to 74 Years | 1,117 (88.2%) | 1,135 (89.4%) |
| 75 Years and over | 646 (90.7%) | 783 (96.7%) |
| Total | 7,751 (88.7%) | 7,503 (90.2%) |
Income Below Poverty Among Married-Couple Families in Morgan County
The poverty statistics for married-couple families in Morgan County show that 3.8% or 141 of the total 3,749 families live below the poverty line. Families with 3 or 4 children have the highest poverty rate of 10.6%, comprising of 29 families. On the other hand, families with no children have the lowest poverty rate of 2.5%, which includes 64 families.

| Children | Above Poverty | Below Poverty |
| No Children | 2,512 (97.5%) | 64 (2.5%) |
| 1 or 2 Children | 852 (94.7%) | 48 (5.3%) |
| 3 or 4 Children | 244 (89.4%) | 29 (10.6%) |
| 5 or more Children | 0 (0.0%) | 0 (0.0%) |
| Total | 3,608 (96.2%) | 141 (3.8%) |
Income Below Poverty Among Single-Parent Households in Morgan County
According to the poverty data in Morgan County, 4.9% or 21 single-father households and 25.0% or 154 single-mother households are living below the poverty line. Among single-father households, those with 1 or 2 children have the highest poverty rate, with 21 households (12.7%) experiencing poverty. Likewise, among single-mother households, those with 3 or 4 children have the highest poverty rate, with 63 households (82.9%) falling below the poverty line.
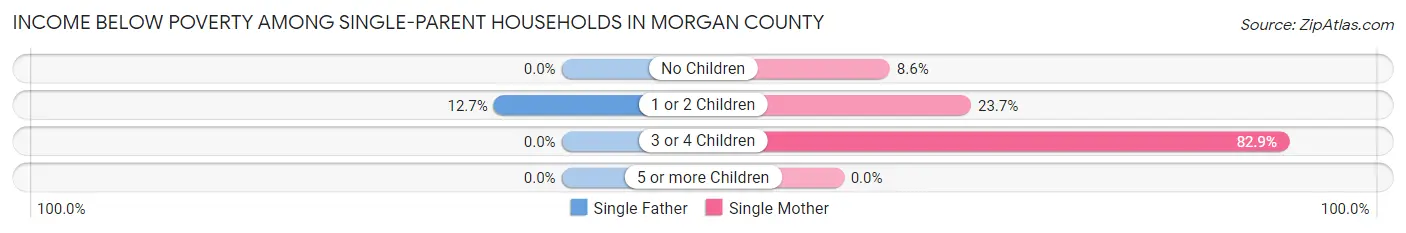
| Children | Single Father | Single Mother |
| No Children | 0 (0.0%) | 21 (8.6%) |
| 1 or 2 Children | 21 (12.7%) | 70 (23.7%) |
| 3 or 4 Children | 0 (0.0%) | 63 (82.9%) |
| 5 or more Children | 0 (0.0%) | 0 (0.0%) |
| Total | 21 (4.9%) | 154 (25.0%) |
Income Below Poverty Among Married-Couple vs Single-Parent Households in Morgan County
The poverty data for Morgan County shows that 141 of the married-couple family households (3.8%) and 175 of the single-parent households (16.8%) are living below the poverty level. Within the married-couple family households, those with 3 or 4 children have the highest poverty rate, with 29 households (10.6%) falling below the poverty line. Among the single-parent households, those with 3 or 4 children have the highest poverty rate, with 63 household (47.0%) living below poverty.

| Children | Married-Couple Families | Single-Parent Households |
| No Children | 64 (2.5%) | 21 (4.7%) |
| 1 or 2 Children | 48 (5.3%) | 91 (19.7%) |
| 3 or 4 Children | 29 (10.6%) | 63 (47.0%) |
| 5 or more Children | 0 (0.0%) | 0 (0.0%) |
| Total | 141 (3.8%) | 175 (16.8%) |
Employment Characteristics in Morgan County
Employment by Class of Employer in Morgan County
Among the 7,721 employed individuals in Morgan County, private company employees (5,090 | 65.9%), local government employees (668 | 8.6%), and not-for-profit organizations (587 | 7.6%) make up the most common classes of employment.

| Employer Class | # Employees | % Employees |
| Private Company Employees | 5,090 | 65.9% |
| Self-Employed (Incorporated) | 201 | 2.6% |
| Self-Employed (Not Incorporated) | 349 | 4.5% |
| Not-for-profit Organizations | 587 | 7.6% |
| Local Government Employees | 668 | 8.6% |
| State Government Employees | 340 | 4.4% |
| Federal Government Employees | 486 | 6.3% |
| Unpaid Family Workers | 0 | 0.0% |
| Total | 7,721 | 100.0% |
Employment Status by Age in Morgan County
According to the labor force statistics for Morgan County, out of the total population over 16 years of age (14,638), 56.2% or 8,227 individuals are in the labor force, with 5.1% or 420 of them unemployed. The age group with the highest labor force participation rate is 20 to 24 years, with 91.5% or 636 individuals in the labor force. Within the labor force, the 16 to 19 years age range has the highest percentage of unemployed individuals, with 27.1% or 121 of them being unemployed.

| Age Bracket | In Labor Force | Unemployed |
| 16 to 19 Years | 446 (50.5%) | 121 (27.1%) |
| 20 to 24 Years | 636 (91.5%) | 100 (15.7%) |
| 25 to 29 Years | 832 (82.2%) | 35 (4.2%) |
| 30 to 34 Years | 589 (69.9%) | 0 (0.0%) |
| 35 to 44 Years | 1,416 (78.6%) | 17 (1.2%) |
| 45 to 54 Years | 1,981 (83.8%) | 75 (3.8%) |
| 55 to 59 Years | 904 (66.4%) | 23 (2.5%) |
| 60 to 64 Years | 739 (48.6%) | 29 (3.9%) |
| 65 to 74 Years | 567 (22.3%) | 19 (3.3%) |
| 75 Years and over | 113 (7.0%) | 0 (0.0%) |
| Total | 8,227 (56.2%) | 420 (5.1%) |
Employment Status by Educational Attainment in Morgan County
According to labor force statistics for Morgan County, 72.6% of individuals (6,463) out of the total population between 25 and 64 years of age (8,902) are in the labor force, with 2.8% or 181 of them being unemployed. The group with the highest labor force participation rate are those with the educational attainment of bachelor's degree or higher, with 83.1% or 1,232 individuals in the labor force. Within the labor force, individuals with bachelor's degree or higher education have the highest percentage of unemployment, with 6.1% or 75 of them being unemployed.

| Educational Attainment | In Labor Force | Unemployed |
| Less than High School | 555 (58.2%) | 53 (5.6%) |
| High School Diploma | 2,853 (69.5%) | 57 (1.4%) |
| College / Associate Degree | 1,820 (77.1%) | 45 (1.9%) |
| Bachelor's Degree or higher | 1,232 (83.1%) | 90 (6.1%) |
| Total | 6,463 (72.6%) | 249 (2.8%) |
Employment Occupations by Sex in Morgan County
Management, Business, Science and Arts Occupations
The most common Management, Business, Science and Arts occupations in Morgan County are Community & Social Service (648 | 8.3%), Management (450 | 5.8%), Education Instruction & Library (429 | 5.5%), Business & Financial (286 | 3.7%), and Health Diagnosing & Treating (276 | 3.5%).

Management, Business, Science and Arts Occupations by Sex
Within the Management, Business, Science and Arts occupations in Morgan County, the most male-oriented occupations are Architecture & Engineering (100.0%), Arts, Media & Entertainment (73.5%), and Computers, Engineering & Science (61.2%), while the most female-oriented occupations are Health Diagnosing & Treating (100.0%), Health Technologists (100.0%), and Education Instruction & Library (86.0%).

| Occupation | Male | Female |
| Management | 249 (55.3%) | 201 (44.7%) |
| Business & Financial | 174 (60.8%) | 112 (39.2%) |
| Computers, Engineering & Science | 142 (61.2%) | 90 (38.8%) |
| Computers & Mathematics | 71 (47.6%) | 78 (52.3%) |
| Architecture & Engineering | 68 (100.0%) | 0 (0.0%) |
| Life, Physical & Social Science | 3 (20.0%) | 12 (80.0%) |
| Community & Social Service | 197 (30.4%) | 451 (69.6%) |
| Education, Arts & Media | 22 (42.3%) | 30 (57.7%) |
| Legal Services & Support | 15 (48.4%) | 16 (51.6%) |
| Education Instruction & Library | 60 (14.0%) | 369 (86.0%) |
| Arts, Media & Entertainment | 100 (73.5%) | 36 (26.5%) |
| Health Diagnosing & Treating | 0 (0.0%) | 276 (100.0%) |
| Health Technologists | 0 (0.0%) | 96 (100.0%) |
| Total (Category) | 762 (40.3%) | 1,130 (59.7%) |
| Total (Overall) | 4,320 (55.4%) | 3,471 (44.6%) |
Services Occupations
The most common Services occupations in Morgan County are Cleaning & Maintenance (591 | 7.6%), Food Preparation & Serving (433 | 5.6%), Healthcare Support (399 | 5.1%), Personal Care & Service (206 | 2.6%), and Security & Protection (160 | 2.1%).

Services Occupations by Sex
Within the Services occupations in Morgan County, the most male-oriented occupations are Firefighting & Prevention (100.0%), Cleaning & Maintenance (77.5%), and Security & Protection (76.2%), while the most female-oriented occupations are Healthcare Support (89.5%), Food Preparation & Serving (74.8%), and Personal Care & Service (48.1%).

| Occupation | Male | Female |
| Healthcare Support | 42 (10.5%) | 357 (89.5%) |
| Security & Protection | 122 (76.2%) | 38 (23.7%) |
| Firefighting & Prevention | 39 (100.0%) | 0 (0.0%) |
| Law Enforcement | 83 (68.6%) | 38 (31.4%) |
| Food Preparation & Serving | 109 (25.2%) | 324 (74.8%) |
| Cleaning & Maintenance | 458 (77.5%) | 133 (22.5%) |
| Personal Care & Service | 107 (51.9%) | 99 (48.1%) |
| Total (Category) | 838 (46.8%) | 951 (53.2%) |
| Total (Overall) | 4,320 (55.4%) | 3,471 (44.6%) |
Sales and Office Occupations
The most common Sales and Office occupations in Morgan County are Office & Administration (887 | 11.4%), and Sales & Related (808 | 10.4%).

Sales and Office Occupations by Sex

| Occupation | Male | Female |
| Sales & Related | 379 (46.9%) | 429 (53.1%) |
| Office & Administration | 150 (16.9%) | 737 (83.1%) |
| Total (Category) | 529 (31.2%) | 1,166 (68.8%) |
| Total (Overall) | 4,320 (55.4%) | 3,471 (44.6%) |
Natural Resources, Construction and Maintenance Occupations
The most common Natural Resources, Construction and Maintenance occupations in Morgan County are Construction & Extraction (852 | 10.9%), Installation, Maintenance & Repair (489 | 6.3%), and Farming, Fishing & Forestry (73 | 0.9%).

Natural Resources, Construction and Maintenance Occupations by Sex

| Occupation | Male | Female |
| Farming, Fishing & Forestry | 48 (65.7%) | 25 (34.3%) |
| Construction & Extraction | 852 (100.0%) | 0 (0.0%) |
| Installation, Maintenance & Repair | 489 (100.0%) | 0 (0.0%) |
| Total (Category) | 1,389 (98.2%) | 25 (1.8%) |
| Total (Overall) | 4,320 (55.4%) | 3,471 (44.6%) |
Production, Transportation and Moving Occupations
The most common Production, Transportation and Moving occupations in Morgan County are Material Moving (346 | 4.4%), Transportation (331 | 4.3%), and Production (324 | 4.2%).

Production, Transportation and Moving Occupations by Sex

| Occupation | Male | Female |
| Production | 261 (80.6%) | 63 (19.4%) |
| Transportation | 268 (81.0%) | 63 (19.0%) |
| Material Moving | 273 (78.9%) | 73 (21.1%) |
| Total (Category) | 802 (80.1%) | 199 (19.9%) |
| Total (Overall) | 4,320 (55.4%) | 3,471 (44.6%) |
Employment Industries by Sex in Morgan County
Employment Industries in Morgan County
The major employment industries in Morgan County include Health Care & Social Assistance (1,080 | 13.9%), Construction (1,070 | 13.7%), Retail Trade (976 | 12.5%), Manufacturing (749 | 9.6%), and Public Administration (720 | 9.2%).

Employment Industries by Sex in Morgan County
The Morgan County industries that see more men than women are Mining, Quarrying, & Extraction (100.0%), Real Estate, Rental & Leasing (100.0%), and Construction (98.7%), whereas the industries that tend to have a higher number of women are Enterprise Management (100.0%), Health Care & Social Assistance (88.3%), and Finance & Insurance (81.6%).

| Industry | Male | Female |
| Agriculture, Fishing & Hunting | 102 (80.3%) | 25 (19.7%) |
| Mining, Quarrying, & Extraction | 66 (100.0%) | 0 (0.0%) |
| Construction | 1,056 (98.7%) | 14 (1.3%) |
| Manufacturing | 634 (84.7%) | 115 (15.3%) |
| Wholesale Trade | 164 (90.6%) | 17 (9.4%) |
| Retail Trade | 430 (44.1%) | 546 (55.9%) |
| Transportation & Warehousing | 249 (62.7%) | 148 (37.3%) |
| Utilities | 97 (92.4%) | 8 (7.6%) |
| Information | 62 (41.1%) | 89 (58.9%) |
| Finance & Insurance | 28 (18.4%) | 124 (81.6%) |
| Real Estate, Rental & Leasing | 48 (100.0%) | 0 (0.0%) |
| Professional & Scientific | 123 (46.2%) | 143 (53.8%) |
| Enterprise Management | 0 (0.0%) | 1 (100.0%) |
| Administrative & Support | 266 (87.5%) | 38 (12.5%) |
| Educational Services | 146 (22.3%) | 509 (77.7%) |
| Health Care & Social Assistance | 126 (11.7%) | 954 (88.3%) |
| Arts, Entertainment & Recreation | 42 (38.2%) | 68 (61.8%) |
| Accommodation & Food Services | 80 (28.9%) | 197 (71.1%) |
| Public Administration | 404 (56.1%) | 316 (43.9%) |
| Total | 4,320 (55.4%) | 3,471 (44.6%) |
Education in Morgan County
School Enrollment in Morgan County
The most common levels of schooling among the 2,908 students in Morgan County are high school (883 | 30.4%), middle school (834 | 28.7%), and college / undergraduate (527 | 18.1%).

| School Level | # Students | % Students |
| Nursery / Preschool | 126 | 4.3% |
| Kindergarten | 64 | 2.2% |
| Elementary School | 457 | 15.7% |
| Middle School | 834 | 28.7% |
| High School | 883 | 30.4% |
| College / Undergraduate | 527 | 18.1% |
| Graduate / Professional | 17 | 0.6% |
| Total | 2,908 | 100.0% |
School Enrollment by Age by Funding Source in Morgan County
Out of a total of 2,908 students who are enrolled in schools in Morgan County, 497 (17.1%) attend a private institution, while the remaining 2,411 (82.9%) are enrolled in public schools. The age group of 3 to 4 year olds has the highest likelihood of being enrolled in private schools, with 55 (80.9% in the age bracket) enrolled. Conversely, the age group of 18 to 19 year olds has the lowest likelihood of being enrolled in a private school, with 322 (98.5% in the age bracket) attending a public institution.

| Age Bracket | Public School | Private School |
| 3 to 4 Year Olds | 13 (19.1%) | 55 (80.9%) |
| 5 to 9 Year Old | 473 (95.8%) | 21 (4.3%) |
| 10 to 14 Year Olds | 870 (86.1%) | 141 (14.0%) |
| 15 to 17 Year Olds | 561 (90.6%) | 58 (9.4%) |
| 18 to 19 Year Olds | 322 (98.5%) | 5 (1.5%) |
| 20 to 24 Year Olds | 63 (92.6%) | 5 (7.3%) |
| 25 to 34 Year Olds | 91 (31.6%) | 197 (68.4%) |
| 35 Years and over | 19 (57.6%) | 14 (42.4%) |
| Total | 2,411 (82.9%) | 497 (17.1%) |
Educational Attainment by Field of Study in Morgan County
Education (462 | 17.0%), science & technology (327 | 12.1%), business (325 | 12.0%), bio, nature & agricultural (269 | 9.9%), and engineering (217 | 8.0%) are the most common fields of study among 2,712 individuals in Morgan County who have obtained a bachelor's degree or higher.

| Field of Study | # Graduates | % Graduates |
| Computers & Mathematics | 154 | 5.7% |
| Bio, Nature & Agricultural | 269 | 9.9% |
| Physical & Health Sciences | 82 | 3.0% |
| Psychology | 131 | 4.8% |
| Social Sciences | 133 | 4.9% |
| Engineering | 217 | 8.0% |
| Multidisciplinary Studies | 12 | 0.4% |
| Science & Technology | 327 | 12.1% |
| Business | 325 | 12.0% |
| Education | 462 | 17.0% |
| Literature & Languages | 57 | 2.1% |
| Liberal Arts & History | 137 | 5.1% |
| Visual & Performing Arts | 110 | 4.1% |
| Communications | 81 | 3.0% |
| Arts & Humanities | 215 | 7.9% |
| Total | 2,712 | 100.0% |
Transportation & Commute in Morgan County
Vehicle Availability by Sex in Morgan County
The most prevalent vehicle ownership categories in Morgan County are males with 3 vehicles (1,495, accounting for 34.8%) and females with 3 vehicles (1,075, making up 43.6%).

| Vehicles Available | Male | Female |
| No Vehicle | 102 (2.4%) | 33 (1.0%) |
| 1 Vehicle | 477 (11.1%) | 615 (17.9%) |
| 2 Vehicles | 1,348 (31.4%) | 986 (28.8%) |
| 3 Vehicles | 1,495 (34.8%) | 1,075 (31.4%) |
| 4 Vehicles | 640 (14.9%) | 621 (18.1%) |
| 5 or more Vehicles | 232 (5.4%) | 96 (2.8%) |
| Total | 4,294 (100.0%) | 3,426 (100.0%) |
Commute Time in Morgan County
The most frequently occuring commute durations in Morgan County are 45 to 59 minutes (1,529 commuters, 21.1%), 60 to 89 minutes (1,323 commuters, 18.3%), and 20 to 24 minutes (863 commuters, 11.9%).

| Commute Time | # Commuters | % Commuters |
| Less than 5 Minutes | 119 | 1.6% |
| 5 to 9 Minutes | 439 | 6.1% |
| 10 to 14 Minutes | 587 | 8.1% |
| 15 to 19 Minutes | 519 | 7.2% |
| 20 to 24 Minutes | 863 | 11.9% |
| 25 to 29 Minutes | 372 | 5.1% |
| 30 to 34 Minutes | 531 | 7.3% |
| 35 to 39 Minutes | 193 | 2.7% |
| 40 to 44 Minutes | 160 | 2.2% |
| 45 to 59 Minutes | 1,529 | 21.1% |
| 60 to 89 Minutes | 1,323 | 18.3% |
| 90 or more Minutes | 600 | 8.3% |
Commute Time by Sex in Morgan County
The most common commute times in Morgan County are 45 to 59 minutes (910 commuters, 22.0%) for males and 45 to 59 minutes (619 commuters, 20.0%) for females.

| Commute Time | Male | Female |
| Less than 5 Minutes | 56 (1.3%) | 63 (2.0%) |
| 5 to 9 Minutes | 235 (5.7%) | 204 (6.6%) |
| 10 to 14 Minutes | 295 (7.1%) | 292 (9.4%) |
| 15 to 19 Minutes | 204 (4.9%) | 315 (10.2%) |
| 20 to 24 Minutes | 262 (6.3%) | 601 (19.4%) |
| 25 to 29 Minutes | 176 (4.3%) | 196 (6.3%) |
| 30 to 34 Minutes | 358 (8.7%) | 173 (5.6%) |
| 35 to 39 Minutes | 123 (3.0%) | 70 (2.3%) |
| 40 to 44 Minutes | 136 (3.3%) | 24 (0.8%) |
| 45 to 59 Minutes | 910 (22.0%) | 619 (20.0%) |
| 60 to 89 Minutes | 857 (20.7%) | 466 (15.0%) |
| 90 or more Minutes | 524 (12.7%) | 76 (2.5%) |
Time of Departure to Work by Sex in Morgan County
The most frequent times of departure to work in Morgan County are 12:00 AM to 4:59 AM (787, 19.0%) for males and 7:00 AM to 7:29 AM (770, 24.8%) for females.

| Time of Departure | Male | Female |
| 12:00 AM to 4:59 AM | 787 (19.0%) | 125 (4.0%) |
| 5:00 AM to 5:29 AM | 363 (8.8%) | 191 (6.2%) |
| 5:30 AM to 5:59 AM | 364 (8.8%) | 202 (6.5%) |
| 6:00 AM to 6:29 AM | 636 (15.4%) | 304 (9.8%) |
| 6:30 AM to 6:59 AM | 379 (9.2%) | 239 (7.7%) |
| 7:00 AM to 7:29 AM | 486 (11.7%) | 770 (24.8%) |
| 7:30 AM to 7:59 AM | 190 (4.6%) | 501 (16.2%) |
| 8:00 AM to 8:29 AM | 122 (2.9%) | 138 (4.4%) |
| 8:30 AM to 8:59 AM | 20 (0.5%) | 92 (3.0%) |
| 9:00 AM to 9:59 AM | 111 (2.7%) | 91 (2.9%) |
| 10:00 AM to 10:59 AM | 35 (0.9%) | 84 (2.7%) |
| 11:00 AM to 11:59 AM | 39 (0.9%) | 80 (2.6%) |
| 12:00 PM to 3:59 PM | 248 (6.0%) | 95 (3.1%) |
| 4:00 PM to 11:59 PM | 356 (8.6%) | 187 (6.0%) |
| Total | 4,136 (100.0%) | 3,099 (100.0%) |
Housing Occupancy in Morgan County
Occupancy by Ownership in Morgan County
Of the total 7,053 dwellings in Morgan County, owner-occupied units account for 5,947 (84.3%), while renter-occupied units make up 1,106 (15.7%).

| Occupancy | # Housing Units | % Housing Units |
| Owner Occupied Housing Units | 5,947 | 84.3% |
| Renter-Occupied Housing Units | 1,106 | 15.7% |
| Total Occupied Housing Units | 7,053 | 100.0% |
Occupancy by Household Size in Morgan County

| Household Size | # Housing Units | % Housing Units |
| 1-Person Household | 1,911 | 27.1% |
| 2-Person Household | 3,019 | 42.8% |
| 3-Person Household | 769 | 10.9% |
| 4+ Person Household | 1,354 | 19.2% |
| Total Housing Units | 7,053 | 100.0% |
Occupancy by Ownership by Household Size in Morgan County

| Household Size | Owner-occupied | Renter-occupied |
| 1-Person Household | 1,435 (75.1%) | 476 (24.9%) |
| 2-Person Household | 2,691 (89.1%) | 328 (10.9%) |
| 3-Person Household | 687 (89.3%) | 82 (10.7%) |
| 4+ Person Household | 1,134 (83.8%) | 220 (16.3%) |
| Total Housing Units | 5,947 (84.3%) | 1,106 (15.7%) |
Occupancy by Educational Attainment in Morgan County

| Household Size | Owner-occupied | Renter-occupied |
| Less than High School | 598 (87.9%) | 82 (12.1%) |
| High School Diploma | 2,596 (84.9%) | 463 (15.1%) |
| College/Associate Degree | 1,501 (79.8%) | 380 (20.2%) |
| Bachelor's Degree or higher | 1,252 (87.4%) | 181 (12.6%) |
Occupancy by Age of Householder in Morgan County

| Age Bracket | # Households | % Households |
| Under 35 Years | 692 | 9.8% |
| 35 to 44 Years | 887 | 12.6% |
| 45 to 54 Years | 1,175 | 16.7% |
| 55 to 64 Years | 1,601 | 22.7% |
| 65 to 74 Years | 1,713 | 24.3% |
| 75 to 84 Years | 776 | 11.0% |
| 85 Years and Over | 209 | 3.0% |
| Total | 7,053 | 100.0% |
Housing Finances in Morgan County
Median Income by Occupancy in Morgan County

| Occupancy Type | # Households | Median Income |
| Owner-Occupied | 5,947 (84.3%) | $69,776 |
| Renter-Occupied | 1,106 (15.7%) | $31,514 |
| Average | 7,053 (100.0%) | $61,021 |
Occupancy by Householder Income Bracket in Morgan County

| Income Bracket | Owner-occupied | Renter-occupied |
| Less than $5,000 | 125 (2.1%) | 33 (3.0%) |
| $5,000 to $9,999 | 64 (1.1%) | 71 (6.4%) |
| $10,000 to $14,999 | 176 (3.0%) | 94 (8.5%) |
| $15,000 to $19,999 | 141 (2.4%) | 135 (12.2%) |
| $20,000 to $24,999 | 168 (2.8%) | 19 (1.7%) |
| $25,000 to $34,999 | 484 (8.1%) | 237 (21.4%) |
| $35,000 to $49,999 | 653 (11.0%) | 232 (21.0%) |
| $50,000 to $74,999 | 1,447 (24.3%) | 192 (17.4%) |
| $75,000 to $99,999 | 1,003 (16.9%) | 42 (3.8%) |
| $100,000 to $149,999 | 1,137 (19.1%) | 47 (4.3%) |
| $150,000 or more | 549 (9.2%) | 4 (0.4%) |
| Total | 5,947 (100.0%) | 1,106 (100.0%) |
Monthly Housing Cost Tiers in Morgan County

| Monthly Cost | Owner-occupied | Renter-occupied |
| Less than $300 | 833 (14.0%) | 22 (2.0%) |
| $300 to $499 | 1,079 (18.1%) | 137 (12.4%) |
| $500 to $799 | 790 (13.3%) | 328 (29.7%) |
| $800 to $999 | 598 (10.1%) | 140 (12.7%) |
| $1,000 to $1,499 | 1,644 (27.6%) | 227 (20.5%) |
| $1,500 to $1,999 | 704 (11.8%) | 9 (0.8%) |
| $2,000 to $2,499 | 238 (4.0%) | 0 (0.0%) |
| $2,500 to $2,999 | 50 (0.8%) | 0 (0.0%) |
| $3,000 or more | 11 (0.2%) | 0 (0.0%) |
| Total | 5,947 (100.0%) | 1,106 (100.0%) |
Physical Housing Characteristics in Morgan County
Housing Structures in Morgan County

| Structure Type | # Housing Units | % Housing Units |
| Single Unit, Detached | 5,830 | 82.7% |
| Single Unit, Attached | 51 | 0.7% |
| 2 Unit Apartments | 107 | 1.5% |
| 3 or 4 Unit Apartments | 62 | 0.9% |
| 5 to 9 Unit Apartments | 151 | 2.1% |
| 10 or more Apartments | 19 | 0.3% |
| Mobile Home / Other | 833 | 11.8% |
| Total | 7,053 | 100.0% |
Housing Structures by Occupancy in Morgan County

| Structure Type | Owner-occupied | Renter-occupied |
| Single Unit, Detached | 5,271 (90.4%) | 559 (9.6%) |
| Single Unit, Attached | 21 (41.2%) | 30 (58.8%) |
| 2 Unit Apartments | 30 (28.0%) | 77 (72.0%) |
| 3 or 4 Unit Apartments | 6 (9.7%) | 56 (90.3%) |
| 5 to 9 Unit Apartments | 0 (0.0%) | 151 (100.0%) |
| 10 or more Apartments | 0 (0.0%) | 19 (100.0%) |
| Mobile Home / Other | 619 (74.3%) | 214 (25.7%) |
| Total | 5,947 (84.3%) | 1,106 (15.7%) |
Housing Structures by Number of Rooms in Morgan County

| Number of Rooms | Owner-occupied | Renter-occupied |
| 1 Room | 6 (0.1%) | 54 (4.9%) |
| 2 or 3 Rooms | 203 (3.4%) | 176 (15.9%) |
| 4 or 5 Rooms | 1,813 (30.5%) | 547 (49.5%) |
| 6 or 7 Rooms | 2,310 (38.8%) | 194 (17.5%) |
| 8 or more Rooms | 1,615 (27.2%) | 135 (12.2%) |
| Total | 5,947 (100.0%) | 1,106 (100.0%) |
Housing Structure by Heating Type in Morgan County

| Heating Type | Owner-occupied | Renter-occupied |
| Utility Gas | 179 (3.0%) | 91 (8.2%) |
| Bottled, Tank, or LP Gas | 289 (4.9%) | 44 (4.0%) |
| Electricity | 3,497 (58.8%) | 625 (56.5%) |
| Fuel Oil or Kerosene | 552 (9.3%) | 208 (18.8%) |
| Coal or Coke | 25 (0.4%) | 0 (0.0%) |
| All other Fuels | 1,370 (23.0%) | 110 (10.0%) |
| No Fuel Used | 35 (0.6%) | 28 (2.5%) |
| Total | 5,947 (100.0%) | 1,106 (100.0%) |
Household Vehicle Usage in Morgan County

| Vehicles per Household | Owner-occupied | Renter-occupied |
| No Vehicle | 116 (1.9%) | 185 (16.7%) |
| 1 Vehicle | 1,337 (22.5%) | 490 (44.3%) |
| 2 Vehicles | 2,037 (34.3%) | 303 (27.4%) |
| 3 or more Vehicles | 2,457 (41.3%) | 128 (11.6%) |
| Total | 5,947 (100.0%) | 1,106 (100.0%) |
Real Estate & Mortgages in Morgan County
Real Estate and Mortgage Overview in Morgan County
| Characteristic | Without Mortgage | With Mortgage |
| Housing Units | 2,353 | 3,594 |
| Median Property Value | $169,700 | $230,100 |
| Median Household Income | $55,858 | $439 |
| Monthly Housing Costs | $342 | $11 |
| Real Estate Taxes | $924 | $96 |
Property Value by Mortgage Status in Morgan County

| Property Value | Without Mortgage | With Mortgage |
| Less than $50,000 | 363 (15.4%) | 180 (5.0%) |
| $50,000 to $99,999 | 450 (19.1%) | 152 (4.2%) |
| $100,000 to $299,999 | 1,210 (51.4%) | 2,452 (68.2%) |
| $300,000 to $499,999 | 252 (10.7%) | 769 (21.4%) |
| $500,000 to $749,999 | 49 (2.1%) | 25 (0.7%) |
| $750,000 to $999,999 | 9 (0.4%) | 8 (0.2%) |
| $1,000,000 or more | 20 (0.9%) | 8 (0.2%) |
| Total | 2,353 (100.0%) | 3,594 (100.0%) |
Household Income by Mortgage Status in Morgan County

| Household Income | Without Mortgage | With Mortgage |
| Less than $10,000 | 138 (5.9%) | 67 (1.9%) |
| $10,000 to $24,999 | 400 (17.0%) | 51 (1.4%) |
| $25,000 to $34,999 | 229 (9.7%) | 85 (2.4%) |
| $35,000 to $49,999 | 232 (9.9%) | 255 (7.1%) |
| $50,000 to $74,999 | 620 (26.4%) | 421 (11.7%) |
| $75,000 to $99,999 | 435 (18.5%) | 827 (23.0%) |
| $100,000 to $149,999 | 189 (8.0%) | 568 (15.8%) |
| $150,000 or more | 110 (4.7%) | 948 (26.4%) |
| Total | 2,353 (100.0%) | 3,594 (100.0%) |
Property Value to Household Income Ratio in Morgan County

| Value-to-Income Ratio | Without Mortgage | With Mortgage |
| Less than 2.0x | 810 (34.4%) | 82,746 (2,302.3%) |
| 2.0x to 2.9x | 292 (12.4%) | 1,006 (28.0%) |
| 3.0x to 3.9x | 338 (14.4%) | 966 (26.9%) |
| 4.0x or more | 900 (38.3%) | 758 (21.1%) |
| Total | 2,353 (100.0%) | 3,594 (100.0%) |
Real Estate Taxes by Mortgage Status in Morgan County

| Property Taxes | Without Mortgage | With Mortgage |
| Less than $800 | 975 (41.4%) | 19 (0.5%) |
| $800 to $1,499 | 749 (31.8%) | 705 (19.6%) |
| $800 to $1,499 | 524 (22.3%) | 1,694 (47.1%) |
| Total | 2,353 (100.0%) | 3,594 (100.0%) |
Health & Disability in Morgan County
Health Insurance Coverage by Age in Morgan County

| Age Bracket | With Coverage | Without Coverage |
| Under 6 Years | 788 (98.6%) | 11 (1.4%) |
| 6 to 18 Years | 2,201 (91.7%) | 200 (8.3%) |
| 19 to 25 Years | 978 (91.3%) | 93 (8.7%) |
| 26 to 34 Years | 1,638 (93.0%) | 123 (7.0%) |
| 35 to 44 Years | 1,463 (81.8%) | 325 (18.2%) |
| 45 to 54 Years | 2,027 (85.7%) | 337 (14.3%) |
| 55 to 64 Years | 2,691 (94.5%) | 156 (5.5%) |
| 65 to 74 Years | 2,534 (99.9%) | 2 (0.1%) |
| 75 Years and older | 1,522 (100.0%) | 0 (0.0%) |
| Total | 15,842 (92.7%) | 1,247 (7.3%) |
Health Insurance Coverage by Citizenship Status in Morgan County

| Citizenship Status | With Coverage | Without Coverage |
| Native Born | 788 (98.6%) | 11 (1.4%) |
| Foreign Born, Citizen | 2,201 (91.7%) | 200 (8.3%) |
| Foreign Born, not a Citizen | 978 (91.3%) | 93 (8.7%) |
Health Insurance Coverage by Household Income in Morgan County

| Household Income | With Coverage | Without Coverage |
| Under $25,000 | 1,475 (96.3%) | 57 (3.7%) |
| $25,000 to $49,999 | 2,755 (84.4%) | 510 (15.6%) |
| $50,000 to $74,999 | 4,039 (96.1%) | 162 (3.9%) |
| $75,000 to $99,999 | 2,887 (96.9%) | 92 (3.1%) |
| $100,000 and over | 4,682 (91.7%) | 426 (8.3%) |
Public vs Private Health Insurance Coverage by Age in Morgan County

| Age Bracket | Public Insurance | Private Insurance |
| Under 6 | 428 (53.6%) | 360 (45.1%) |
| 6 to 18 Years | 808 (33.7%) | 1,462 (60.9%) |
| 19 to 25 Years | 318 (29.7%) | 695 (64.9%) |
| 25 to 34 Years | 341 (19.4%) | 1,322 (75.1%) |
| 35 to 44 Years | 301 (16.8%) | 1,204 (67.3%) |
| 45 to 54 Years | 383 (16.2%) | 1,783 (75.4%) |
| 55 to 64 Years | 814 (28.6%) | 2,117 (74.4%) |
| 65 to 74 Years | 2,519 (99.3%) | 1,478 (58.3%) |
| 75 Years and over | 1,516 (99.6%) | 1,241 (81.5%) |
| Total | 7,428 (43.5%) | 11,662 (68.2%) |
Disability Status by Sex by Age in Morgan County

| Age Bracket | Male | Female |
| Under 5 Years | 0 (0.0%) | 0 (0.0%) |
| 5 to 17 Years | 12 (1.0%) | 71 (6.1%) |
| 18 to 34 Years | 227 (13.8%) | 80 (5.8%) |
| 35 to 64 Years | 466 (13.0%) | 631 (18.6%) |
| 65 to 74 Years | 335 (26.4%) | 275 (21.7%) |
| 75 Years and over | 351 (49.3%) | 340 (42.0%) |
Disability Class by Sex by Age in Morgan County
Disability Class: Hearing Difficulty

| Age Bracket | Male | Female |
| Under 5 Years | 0 (0.0%) | 0 (0.0%) |
| 5 to 17 Years | 0 (0.0%) | 0 (0.0%) |
| 18 to 34 Years | 0 (0.0%) | 0 (0.0%) |
| 35 to 64 Years | 131 (3.6%) | 78 (2.3%) |
| 65 to 74 Years | 157 (12.4%) | 98 (7.7%) |
| 75 Years and over | 159 (22.3%) | 151 (18.6%) |
Disability Class: Vision Difficulty

| Age Bracket | Male | Female |
| Under 5 Years | 0 (0.0%) | 0 (0.0%) |
| 5 to 17 Years | 0 (0.0%) | 17 (1.5%) |
| 18 to 34 Years | 28 (1.7%) | 0 (0.0%) |
| 35 to 64 Years | 113 (3.1%) | 97 (2.9%) |
| 65 to 74 Years | 35 (2.8%) | 59 (4.6%) |
| 75 Years and over | 78 (11.0%) | 110 (13.6%) |
Disability Class: Cognitive Difficulty

| Age Bracket | Male | Female |
| 5 to 17 Years | 12 (1.0%) | 71 (6.1%) |
| 18 to 34 Years | 222 (13.5%) | 17 (1.2%) |
| 35 to 64 Years | 152 (4.2%) | 255 (7.5%) |
| 65 to 74 Years | 85 (6.7%) | 22 (1.7%) |
| 75 Years and over | 50 (7.0%) | 161 (19.9%) |
Disability Class: Ambulatory Difficulty

| Age Bracket | Male | Female |
| 5 to 17 Years | 0 (0.0%) | 17 (1.5%) |
| 18 to 34 Years | 0 (0.0%) | 26 (1.9%) |
| 35 to 64 Years | 269 (7.5%) | 409 (12.0%) |
| 65 to 74 Years | 157 (12.4%) | 161 (12.7%) |
| 75 Years and over | 175 (24.6%) | 263 (32.5%) |
Disability Class: Self-Care Difficulty

| Age Bracket | Male | Female |
| 5 to 17 Years | 10 (0.9%) | 17 (1.5%) |
| 18 to 34 Years | 127 (7.7%) | 26 (1.9%) |
| 35 to 64 Years | 162 (4.5%) | 155 (4.6%) |
| 65 to 74 Years | 20 (1.6%) | 19 (1.5%) |
| 75 Years and over | 84 (11.8%) | 79 (9.8%) |
Technology Access in Morgan County
Computing Device Access in Morgan County

| Device Type | # Households | % Households |
| Desktop or Laptop | 5,085 | 72.1% |
| Smartphone | 5,306 | 75.2% |
| Tablet | 3,692 | 52.3% |
| No Computing Device | 740 | 10.5% |
| Total | 7,053 | 100.0% |
Internet Access in Morgan County

| Internet Type | # Households | % Households |
| Dial-Up Internet | 62 | 0.9% |
| Broadband Home | 4,214 | 59.8% |
| Cellular Data Only | 879 | 12.5% |
| Satellite Internet | 553 | 7.8% |
| No Internet | 1,382 | 19.6% |
| Total | 7,053 | 100.0% |
Morgan County Summary
Morgan County is located in the Eastern Panhandle of West Virginia, and is part of the Cumberland Valley region. It is bordered by Berkeley County to the north, Hampshire County to the east, Mineral County to the south, and Jefferson County to the west. The county seat is Berkeley Springs, which is also the county’s largest town.
History
Morgan County was formed in 1820 from parts of Berkeley and Hampshire counties. It was named for General Daniel Morgan, a Revolutionary War hero. The county was originally part of the Virginia Colony, and was one of the first counties in the state of West Virginia when it was formed in 1863.
The county was home to several Native American tribes, including the Shawnee, Delaware, and Susquehannock. The first European settlers arrived in the area in the late 1700s, and the county was officially established in 1820.
The county was home to several prominent figures in American history, including George Washington, who owned a large estate in the county. The county was also home to the first spa in the United States, Berkeley Springs, which was founded in 1756.
Geography
Morgan County covers an area of approximately 246 square miles, and is located in the Eastern Panhandle of West Virginia. The county is located in the Appalachian Mountains, and is part of the Cumberland Valley region. The county is bordered by Berkeley County to the north, Hampshire County to the east, Mineral County to the south, and Jefferson County to the west.
The county is home to several rivers and streams, including the Potomac River, Cacapon River, and Sleepy Creek. The county is also home to several state parks, including Cacapon State Park and Sleepy Creek Wildlife Management Area.
Economy
The economy of Morgan County is largely based on agriculture and tourism. The county is home to several farms, which produce a variety of crops, including corn, soybeans, hay, and wheat. The county is also home to several wineries, which produce a variety of wines.
Tourism is also an important part of the county’s economy. Berkeley Springs, the county seat, is home to several spas and resorts, as well as a variety of shops and restaurants. The county is also home to several state parks, which attract visitors from all over the region.
Demographics
As of the 2010 census, the population of Morgan County was 17,541. The population is largely white (94.3%), with small percentages of African American (2.7%), Hispanic (1.2%), and Asian (0.7%) residents. The median household income is $41,945, and the median home value is $133,400.
The county is home to several colleges and universities, including Shepherd University and West Virginia University. The county is also home to several public schools, as well as several private schools.
Conclusion
Morgan County is located in the Eastern Panhandle of West Virginia, and is part of the Cumberland Valley region. The county was formed in 1820, and is named for General Daniel Morgan, a Revolutionary War hero. The county is largely rural, and is home to several farms, wineries, and state parks. The economy of the county is largely based on agriculture and tourism, and the population is largely white. The county is home to several colleges and universities, as well as several public and private schools.
Common Questions
What is the Total Population of Morgan County?
Total Population of Morgan County is 17,237.
What is the Total Male Population of Morgan County?
Total Male Population of Morgan County is 8,783.
What is the Total Female Population of Morgan County?
Total Female Population of Morgan County is 8,454.
What is the Ratio of Males per 100 Females in Morgan County?
There are 103.89 Males per 100 Females in Morgan County.
What is the Ratio of Females per 100 Males in Morgan County?
There are 96.25 Females per 100 Males in Morgan County.
What is the Median Population Age in Morgan County?
Median Population Age in Morgan County is 48.6 Years.
What is the Average Family Size in Morgan County
Average Family Size in Morgan County is 2.9 People.
What is the Average Household Size in Morgan County
Average Household Size in Morgan County is 2.4 People.
What is Per Capita Income in Morgan County?
Per Capita income in Morgan County is $33,029.
What is the Median Family Income in Morgan County?
Median Family Income in Morgan County is $73,192.
What is the Median Household income in Morgan County?
Median Household Income in Morgan County is $61,021.
What is Income or Wage Gap in Morgan County?
Income or Wage Gap in Morgan County is 29.9%.
Women in Morgan County earn 70.1 cents for every dollar earned by a man.
What is Inequality or Gini Index in Morgan County?
Inequality or Gini Index in Morgan County is 0.40.
How Large is the Labor Force in Morgan County?
There are 8,227 People in the Labor Forcein in Morgan County.
What is the Percentage of People in the Labor Force in Morgan County?
56.2% of People are in the Labor Force in Morgan County.
What is the Unemployment Rate in Morgan County?
Unemployment Rate in Morgan County is 5.1%.