Monongalia County, WV
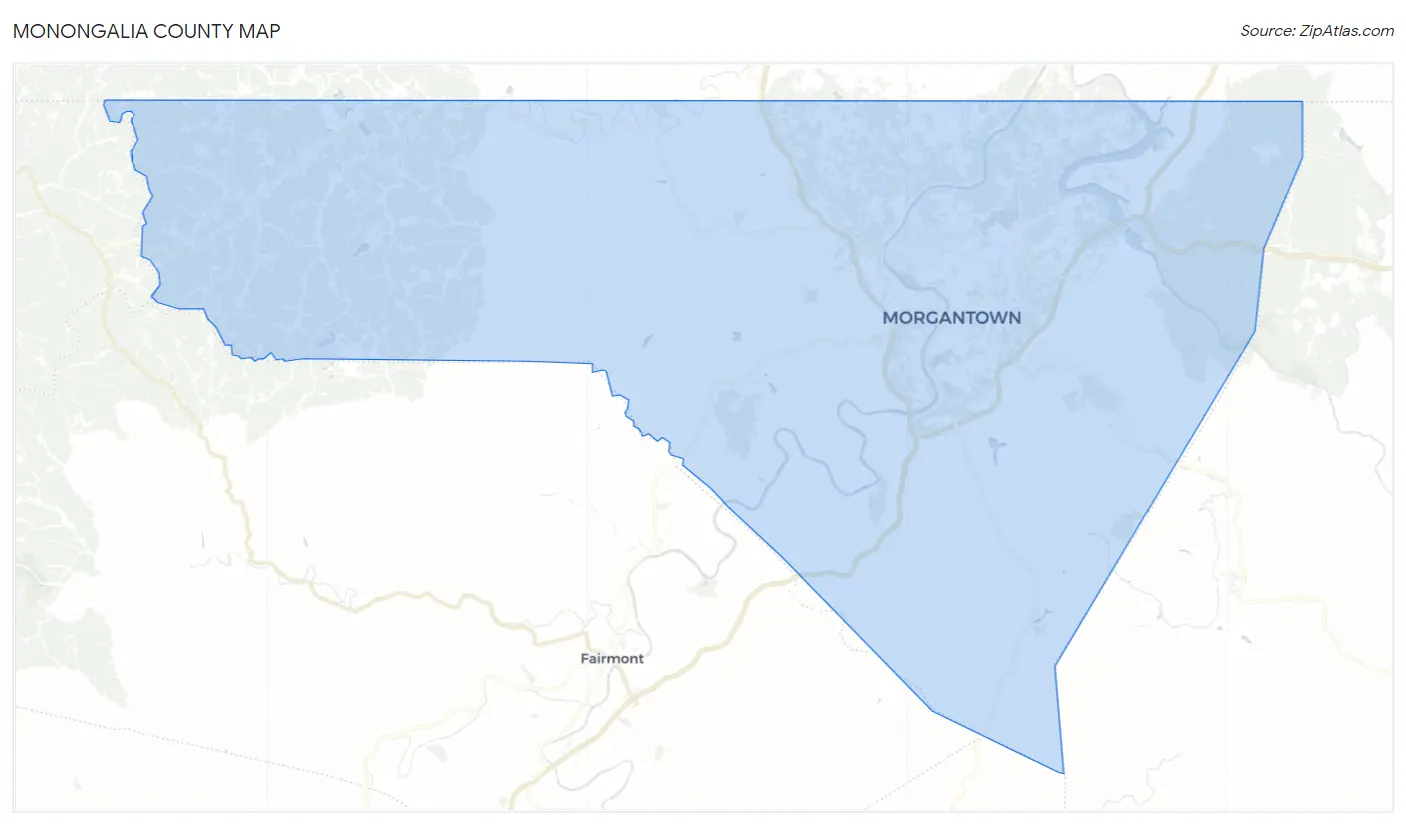
Monongalia County Map
Monongalia County Overview
105,988
TOTAL POPULATION
54,753
MALE POPULATION
51,235
FEMALE POPULATION
106.87
MALES / 100 FEMALES
93.57
FEMALES / 100 MALES
32.2
MEDIAN AGE
2.9
AVG FAMILY SIZE
2.3
AVG HOUSEHOLD SIZE
$38,757
PER CAPITA INCOME
$99,540
AVG FAMILY INCOME
$60,893
AVG HOUSEHOLD INCOME
23.1%
WAGE / INCOME GAP [ % ]
76.9¢/ $1
WAGE / INCOME GAP [ $ ]
$11,118
FAMILY INCOME DEFICIT
0.51
INEQUALITY / GINI INDEX
57,835
LABOR FORCE [ PEOPLE ]
63.5%
PERCENT IN LABOR FORCE
5.7%
UNEMPLOYMENT RATE
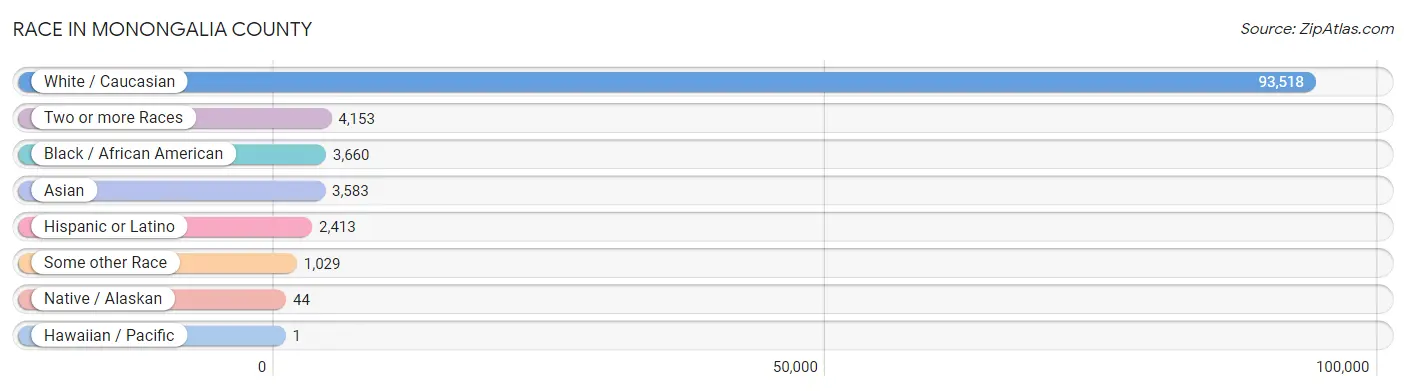
Race in Monongalia County
The most populous races in Monongalia County are White / Caucasian (93,518 | 88.2%), Two or more Races (4,153 | 3.9%), and Black / African American (3,660 | 3.5%).
| Race | # Population | % Population |
| Asian | 3,583 | 3.4% |
| Black / African American | 3,660 | 3.5% |
| Hawaiian / Pacific | 1 | 0.0% |
| Hispanic or Latino | 2,413 | 2.3% |
| Native / Alaskan | 44 | 0.0% |
| White / Caucasian | 93,518 | 88.2% |
| Two or more Races | 4,153 | 3.9% |
| Some other Race | 1,029 | 1.0% |
| Total | 105,988 | 100.0% |
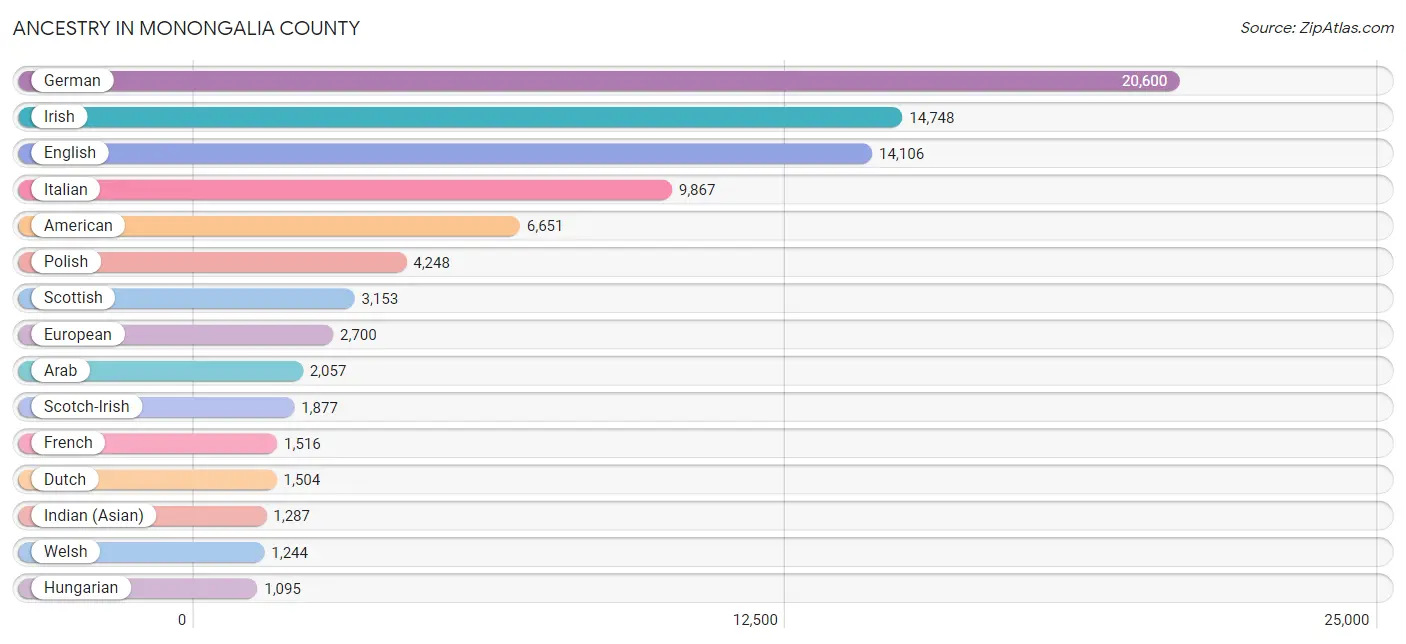
Ancestry in Monongalia County
The most populous ancestries reported in Monongalia County are German (20,600 | 19.4%), Irish (14,748 | 13.9%), English (14,106 | 13.3%), Italian (9,867 | 9.3%), and American (6,651 | 6.3%), together accounting for 62.2% of all Monongalia County residents.
| Ancestry | # Population | % Population |
| African | 357 | 0.3% |
| American | 6,651 | 6.3% |
| Apache | 34 | 0.0% |
| Arab | 2,057 | 1.9% |
| Argentinean | 122 | 0.1% |
| Armenian | 36 | 0.0% |
| Australian | 21 | 0.0% |
| Austrian | 90 | 0.1% |
| Belgian | 106 | 0.1% |
| Bhutanese | 320 | 0.3% |
| Blackfeet | 49 | 0.1% |
| Bolivian | 19 | 0.0% |
| Brazilian | 94 | 0.1% |
| British | 787 | 0.7% |
| Burmese | 161 | 0.2% |
| Cajun | 8 | 0.0% |
| Canadian | 106 | 0.1% |
| Carpatho Rusyn | 4 | 0.0% |
| Celtic | 14 | 0.0% |
| Central American | 400 | 0.4% |
| Central American Indian | 35 | 0.0% |
| Cherokee | 192 | 0.2% |
| Chickasaw | 1 | 0.0% |
| Chippewa | 3 | 0.0% |
| Choctaw | 10 | 0.0% |
| Colombian | 58 | 0.1% |
| Creek | 8 | 0.0% |
| Croatian | 283 | 0.3% |
| Cuban | 114 | 0.1% |
| Czech | 628 | 0.6% |
| Czechoslovakian | 155 | 0.2% |
| Danish | 122 | 0.1% |
| Dominican | 59 | 0.1% |
| Dutch | 1,504 | 1.4% |
| Eastern European | 246 | 0.2% |
| Ecuadorian | 9 | 0.0% |
| Egyptian | 161 | 0.2% |
| English | 14,106 | 13.3% |
| European | 2,700 | 2.5% |
| Filipino | 34 | 0.0% |
| Finnish | 183 | 0.2% |
| French | 1,516 | 1.4% |
| French American Indian | 15 | 0.0% |
| French Canadian | 257 | 0.2% |
| German | 20,600 | 19.4% |
| Greek | 489 | 0.5% |
| Guamanian / Chamorro | 47 | 0.0% |
| Guatemalan | 47 | 0.0% |
| Haitian | 27 | 0.0% |
| Honduran | 165 | 0.2% |
| Hungarian | 1,095 | 1.0% |
| Indian (Asian) | 1,287 | 1.2% |
| Iranian | 237 | 0.2% |
| Iraqi | 73 | 0.1% |
| Irish | 14,748 | 13.9% |
| Italian | 9,867 | 9.3% |
| Jamaican | 134 | 0.1% |
| Japanese | 1 | 0.0% |
| Jordanian | 6 | 0.0% |
| Kenyan | 94 | 0.1% |
| Korean | 974 | 0.9% |
| Laotian | 28 | 0.0% |
| Lebanese | 234 | 0.2% |
| Lithuanian | 269 | 0.3% |
| Lumbee | 5 | 0.0% |
| Luxembourger | 9 | 0.0% |
| Macedonian | 7 | 0.0% |
| Mexican | 959 | 0.9% |
| Mexican American Indian | 108 | 0.1% |
| Native Hawaiian | 7 | 0.0% |
| Nigerian | 274 | 0.3% |
| Northern European | 183 | 0.2% |
| Norwegian | 482 | 0.4% |
| Pakistani | 10 | 0.0% |
| Palestinian | 398 | 0.4% |
| Panamanian | 55 | 0.1% |
| Pennsylvania German | 90 | 0.1% |
| Peruvian | 57 | 0.1% |
| Polish | 4,248 | 4.0% |
| Portuguese | 66 | 0.1% |
| Puerto Rican | 257 | 0.2% |
| Romanian | 73 | 0.1% |
| Russian | 445 | 0.4% |
| Salvadoran | 133 | 0.1% |
| Scandinavian | 391 | 0.4% |
| Scotch-Irish | 1,877 | 1.8% |
| Scottish | 3,153 | 3.0% |
| Seminole | 23 | 0.0% |
| Serbian | 148 | 0.1% |
| Sioux | 7 | 0.0% |
| Slavic | 157 | 0.2% |
| Slovak | 892 | 0.8% |
| Slovene | 15 | 0.0% |
| South African | 54 | 0.1% |
| South American | 300 | 0.3% |
| Spaniard | 114 | 0.1% |
| Spanish | 106 | 0.1% |
| Sri Lankan | 484 | 0.5% |
| Subsaharan African | 813 | 0.8% |
| Swedish | 547 | 0.5% |
| Swiss | 290 | 0.3% |
| Syrian | 347 | 0.3% |
| Thai | 793 | 0.7% |
| Tlingit-Haida | 1 | 0.0% |
| Trinidadian and Tobagonian | 36 | 0.0% |
| Turkish | 55 | 0.1% |
| Ukrainian | 176 | 0.2% |
| Venezuelan | 12 | 0.0% |
| Welsh | 1,244 | 1.2% |
| Yugoslavian | 149 | 0.1% |
| Zimbabwean | 4 | 0.0% | View All 111 Rows |
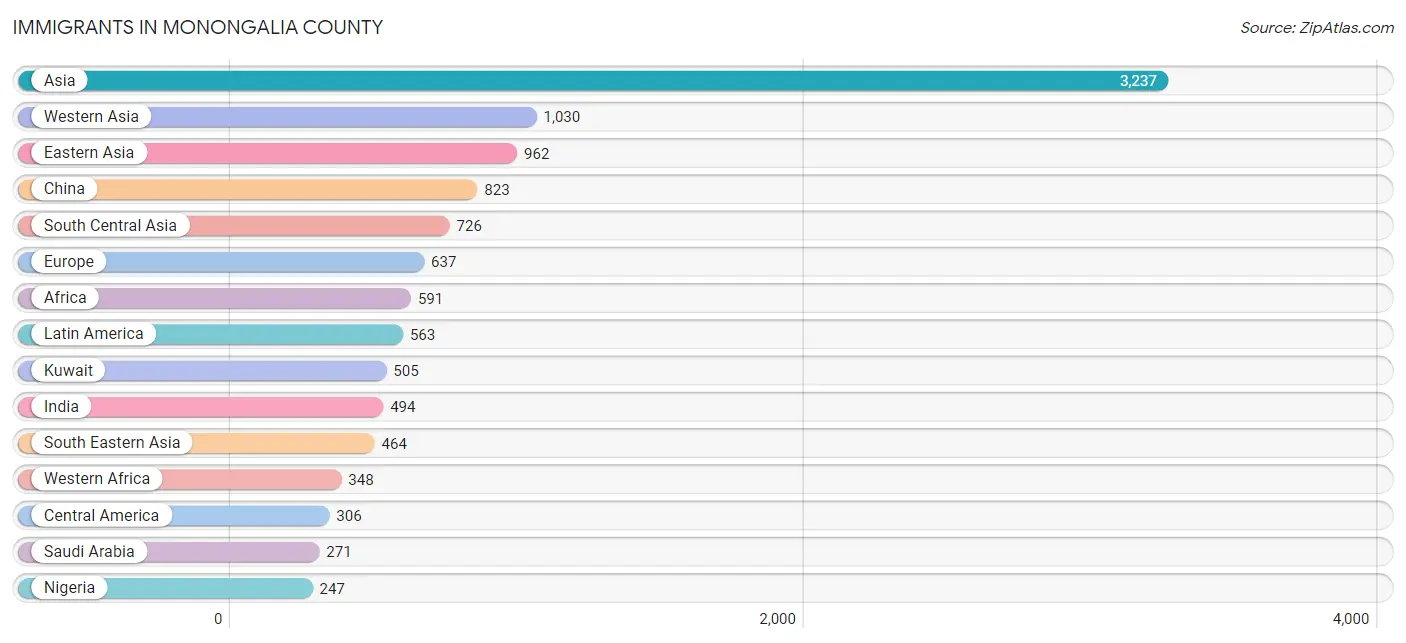
Immigrants in Monongalia County
The most numerous immigrant groups reported in Monongalia County came from Asia (3,237 | 3.0%), Western Asia (1,030 | 1.0%), Eastern Asia (962 | 0.9%), China (823 | 0.8%), and South Central Asia (726 | 0.7%), together accounting for 6.4% of all Monongalia County residents.
| Immigration Origin | # Population | % Population |
| Africa | 591 | 0.6% |
| Asia | 3,237 | 3.0% |
| Belarus | 9 | 0.0% |
| Bolivia | 19 | 0.0% |
| Brazil | 128 | 0.1% |
| Canada | 142 | 0.1% |
| Caribbean | 20 | 0.0% |
| Central America | 306 | 0.3% |
| China | 823 | 0.8% |
| Colombia | 42 | 0.0% |
| Costa Rica | 18 | 0.0% |
| Czechoslovakia | 71 | 0.1% |
| Eastern Africa | 63 | 0.1% |
| Eastern Asia | 962 | 0.9% |
| Eastern Europe | 222 | 0.2% |
| Ecuador | 9 | 0.0% |
| Egypt | 131 | 0.1% |
| El Salvador | 90 | 0.1% |
| England | 52 | 0.1% |
| Europe | 637 | 0.6% |
| France | 8 | 0.0% |
| Germany | 191 | 0.2% |
| Ghana | 101 | 0.1% |
| Greece | 51 | 0.1% |
| Guatemala | 18 | 0.0% |
| Honduras | 105 | 0.1% |
| Hong Kong | 28 | 0.0% |
| India | 494 | 0.5% |
| Indonesia | 28 | 0.0% |
| Iran | 62 | 0.1% |
| Iraq | 68 | 0.1% |
| Italy | 26 | 0.0% |
| Jamaica | 1 | 0.0% |
| Japan | 52 | 0.1% |
| Jordan | 27 | 0.0% |
| Kazakhstan | 10 | 0.0% |
| Kenya | 63 | 0.1% |
| Korea | 87 | 0.1% |
| Kuwait | 505 | 0.5% |
| Laos | 20 | 0.0% |
| Latin America | 563 | 0.5% |
| Mexico | 75 | 0.1% |
| Moldova | 5 | 0.0% |
| Nepal | 132 | 0.1% |
| Netherlands | 23 | 0.0% |
| Nigeria | 247 | 0.2% |
| Northern Africa | 136 | 0.1% |
| Northern Europe | 91 | 0.1% |
| Pakistan | 20 | 0.0% |
| Peru | 27 | 0.0% |
| Philippines | 147 | 0.1% |
| Poland | 23 | 0.0% |
| Romania | 16 | 0.0% |
| Russia | 51 | 0.1% |
| Saudi Arabia | 271 | 0.3% |
| Serbia | 17 | 0.0% |
| Singapore | 26 | 0.0% |
| South Africa | 44 | 0.0% |
| South America | 237 | 0.2% |
| South Central Asia | 726 | 0.7% |
| South Eastern Asia | 464 | 0.4% |
| Southern Europe | 102 | 0.1% |
| Spain | 25 | 0.0% |
| Sri Lanka | 8 | 0.0% |
| Syria | 110 | 0.1% |
| Taiwan | 59 | 0.1% |
| Thailand | 10 | 0.0% |
| Trinidad and Tobago | 19 | 0.0% |
| Venezuela | 12 | 0.0% |
| Vietnam | 233 | 0.2% |
| Western Africa | 348 | 0.3% |
| Western Asia | 1,030 | 1.0% |
| Western Europe | 222 | 0.2% | View All 73 Rows |
Sex and Age in Monongalia County
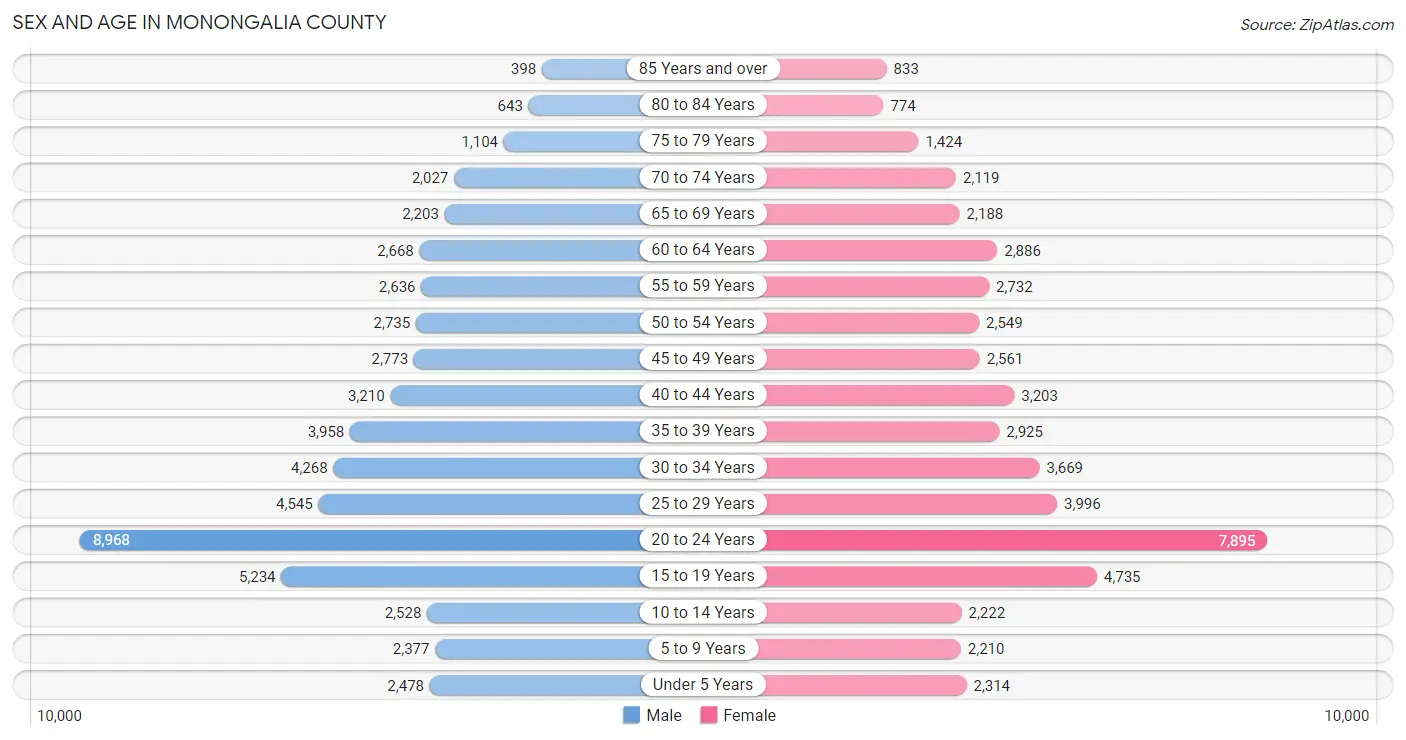
Sex and Age in Monongalia County
The most populous age groups in Monongalia County are 20 to 24 Years (8,968 | 16.4%) for men and 20 to 24 Years (7,895 | 15.4%) for women.
| Age Bracket | Male | Female |
| Under 5 Years | 2,478 (4.5%) | 2,314 (4.5%) |
| 5 to 9 Years | 2,377 (4.3%) | 2,210 (4.3%) |
| 10 to 14 Years | 2,528 (4.6%) | 2,222 (4.3%) |
| 15 to 19 Years | 5,234 (9.6%) | 4,735 (9.2%) |
| 20 to 24 Years | 8,968 (16.4%) | 7,895 (15.4%) |
| 25 to 29 Years | 4,545 (8.3%) | 3,996 (7.8%) |
| 30 to 34 Years | 4,268 (7.8%) | 3,669 (7.2%) |
| 35 to 39 Years | 3,958 (7.2%) | 2,925 (5.7%) |
| 40 to 44 Years | 3,210 (5.9%) | 3,203 (6.2%) |
| 45 to 49 Years | 2,773 (5.1%) | 2,561 (5.0%) |
| 50 to 54 Years | 2,735 (5.0%) | 2,549 (5.0%) |
| 55 to 59 Years | 2,636 (4.8%) | 2,732 (5.3%) |
| 60 to 64 Years | 2,668 (4.9%) | 2,886 (5.6%) |
| 65 to 69 Years | 2,203 (4.0%) | 2,188 (4.3%) |
| 70 to 74 Years | 2,027 (3.7%) | 2,119 (4.1%) |
| 75 to 79 Years | 1,104 (2.0%) | 1,424 (2.8%) |
| 80 to 84 Years | 643 (1.2%) | 774 (1.5%) |
| 85 Years and over | 398 (0.7%) | 833 (1.6%) |
| Total | 54,753 (100.0%) | 51,235 (100.0%) |
Families and Households in Monongalia County
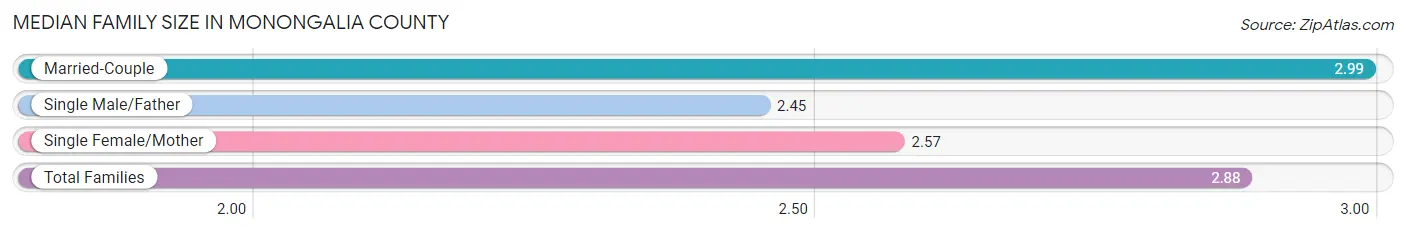
Median Family Size in Monongalia County
The median family size in Monongalia County is 2.88 persons per family, with married-couple families (17,855 | 77.2%) accounting for the largest median family size of 2.99 persons per family. On the other hand, single male/father families (1,982 | 8.6%) represent the smallest median family size with 2.45 persons per family.
| Family Type | # Families | Family Size |
| Married-Couple | 17,855 (77.2%) | 2.99 |
| Single Male/Father | 1,982 (8.6%) | 2.45 |
| Single Female/Mother | 3,301 (14.3%) | 2.57 |
| Total Families | 23,138 (100.0%) | 2.88 |
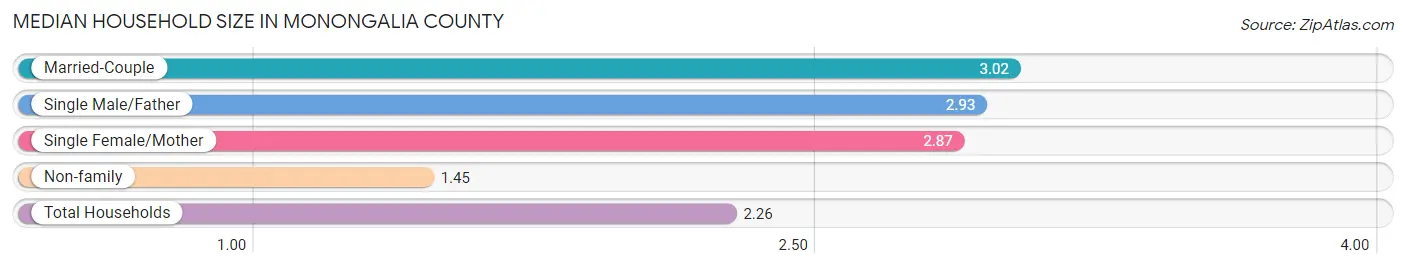
Median Household Size in Monongalia County
The median household size in Monongalia County is 2.26 persons per household, with married-couple households (17,855 | 40.4%) accounting for the largest median household size of 3.02 persons per household. non-family households (21,068 | 47.7%) represent the smallest median household size with 1.45 persons per household.
| Household Type | # Households | Household Size |
| Married-Couple | 17,855 (40.4%) | 3.02 |
| Single Male/Father | 1,982 (4.5%) | 2.93 |
| Single Female/Mother | 3,301 (7.5%) | 2.87 |
| Non-family | 21,068 (47.7%) | 1.45 |
| Total Households | 44,206 (100.0%) | 2.26 |
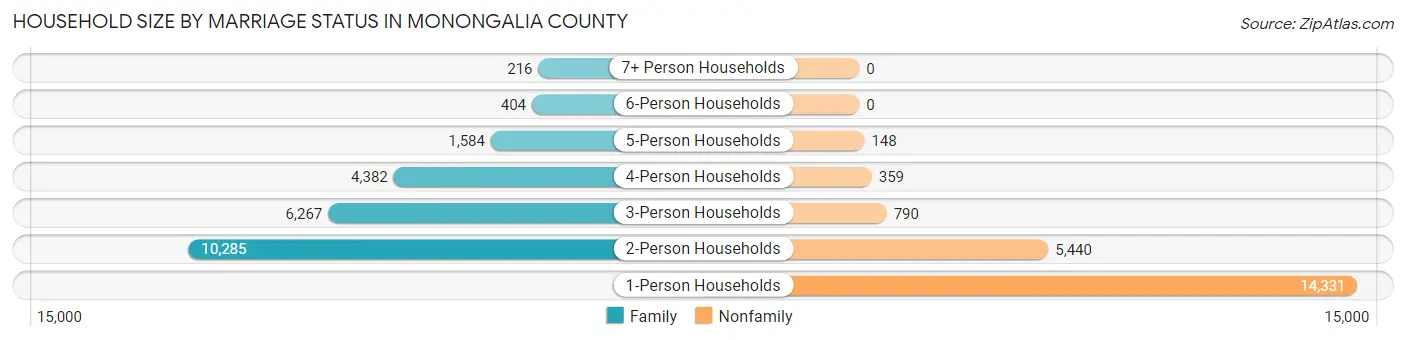
Household Size by Marriage Status in Monongalia County
Out of a total of 44,206 households in Monongalia County, 23,138 (52.3%) are family households, while 21,068 (47.7%) are nonfamily households. The most numerous type of family households are 2-person households, comprising 10,285, and the most common type of nonfamily households are 1-person households, comprising 14,331.
| Household Size | Family Households | Nonfamily Households |
| 1-Person Households | - | 14,331 (32.4%) |
| 2-Person Households | 10,285 (23.3%) | 5,440 (12.3%) |
| 3-Person Households | 6,267 (14.2%) | 790 (1.8%) |
| 4-Person Households | 4,382 (9.9%) | 359 (0.8%) |
| 5-Person Households | 1,584 (3.6%) | 148 (0.3%) |
| 6-Person Households | 404 (0.9%) | 0 (0.0%) |
| 7+ Person Households | 216 (0.5%) | 0 (0.0%) |
| Total | 23,138 (52.3%) | 21,068 (47.7%) |
Female Fertility in Monongalia County
Fertility by Age in Monongalia County
Average fertility rate in Monongalia County is 46.0 births per 1,000 women. Women in the age bracket of 20 to 34 years have the highest fertility rate with 68.0 births per 1,000 women. Women in the age bracket of 20 to 34 years acount for 77.6% of all women with births.
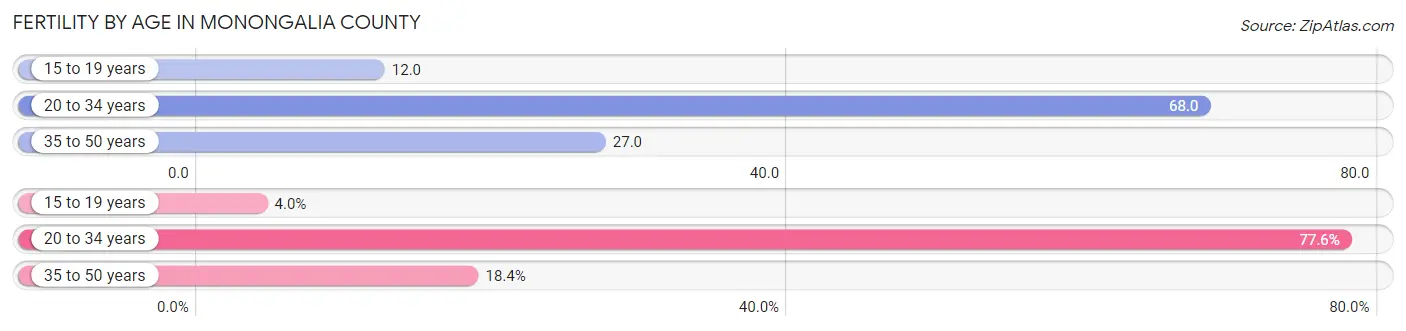
| Age Bracket | Women with Births | Births / 1,000 Women |
| 15 to 19 years | 55 (4.0%) | 12.0 |
| 20 to 34 years | 1,057 (77.6%) | 68.0 |
| 35 to 50 years | 250 (18.4%) | 27.0 |
| Total | 1,362 (100.0%) | 46.0 |
Fertility by Age by Marriage Status in Monongalia County
73.3% of women with births (1,362) in Monongalia County are married. The highest percentage of unmarried women with births falls into 15 to 19 years age bracket with 100.0% of them unmarried at the time of birth, while the lowest percentage of unmarried women with births belong to 35 to 50 years age bracket with 16.4% of them unmarried.
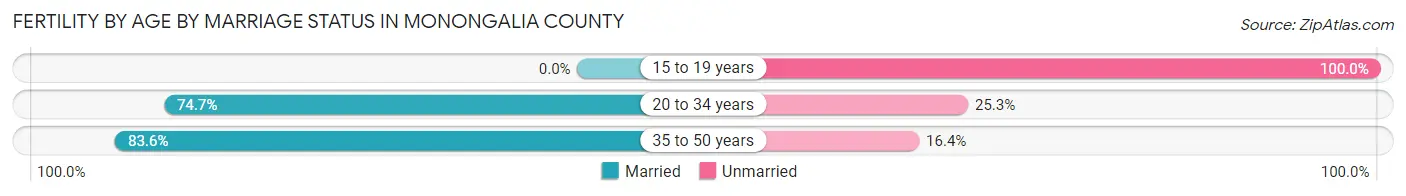
| Age Bracket | Married | Unmarried |
| 15 to 19 years | 0 (0.0%) | 55 (100.0%) |
| 20 to 34 years | 790 (74.7%) | 267 (25.3%) |
| 35 to 50 years | 209 (83.6%) | 41 (16.4%) |
| Total | 998 (73.3%) | 364 (26.7%) |
Fertility by Education in Monongalia County
Average fertility rate in Monongalia County is 46.0 births per 1,000 women. Women with the education attainment of graduate degree have the highest fertility rate of 77.0 births per 1,000 women, while women with the education attainment of college or associate's degree have the lowest fertility at 20.0 births per 1,000 women. Women with the education attainment of graduate degree represent 35.0% of all women with births.
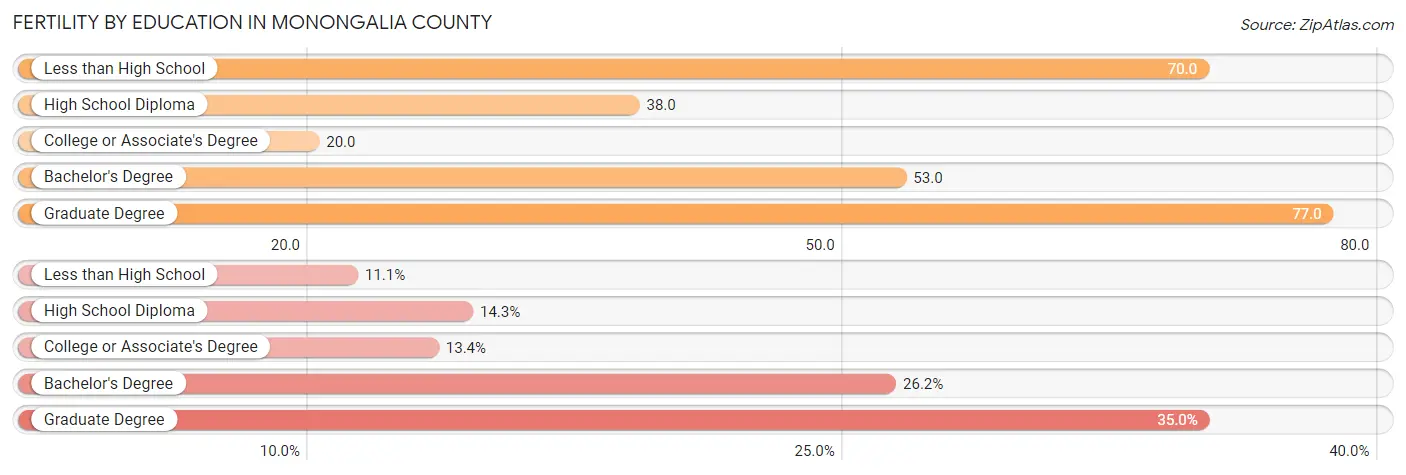
| Educational Attainment | Women with Births | Births / 1,000 Women |
| Less than High School | 151 (11.1%) | 70.0 |
| High School Diploma | 195 (14.3%) | 38.0 |
| College or Associate's Degree | 182 (13.4%) | 20.0 |
| Bachelor's Degree | 357 (26.2%) | 53.0 |
| Graduate Degree | 477 (35.0%) | 77.0 |
| Total | 1,362 (100.0%) | 46.0 |
Fertility by Education by Marriage Status in Monongalia County
26.7% of women with births in Monongalia County are unmarried. Women with the educational attainment of graduate degree are most likely to be married with 97.5% of them married at childbirth, while women with the educational attainment of less than high school are least likely to be married with 84.8% of them unmarried at childbirth.
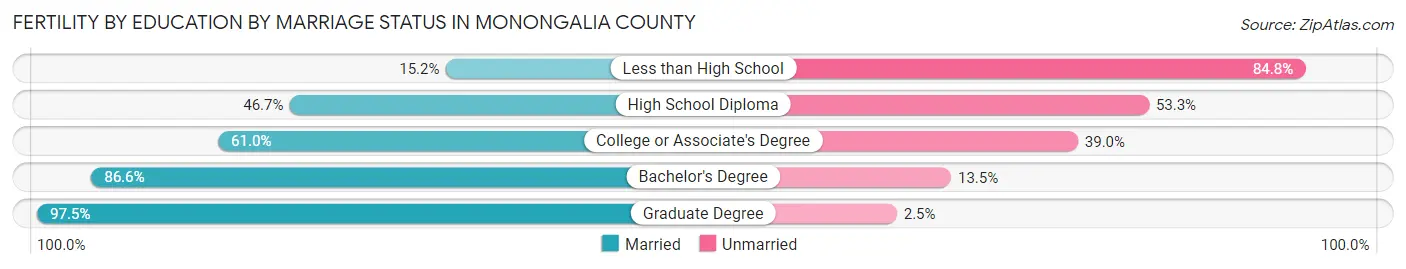
| Educational Attainment | Married | Unmarried |
| Less than High School | 23 (15.2%) | 128 (84.8%) |
| High School Diploma | 91 (46.7%) | 104 (53.3%) |
| College or Associate's Degree | 111 (61.0%) | 71 (39.0%) |
| Bachelor's Degree | 309 (86.6%) | 48 (13.5%) |
| Graduate Degree | 465 (97.5%) | 12 (2.5%) |
| Total | 998 (73.3%) | 364 (26.7%) |
Income in Monongalia County
Income Overview in Monongalia County
Per Capita Income in Monongalia County is $38,757, while median incomes of families and households are $99,540 and $60,893 respectively.
| Characteristic | Number | Measure |
| Per Capita Income | 105,988 | $38,757 |
| Median Family Income | 23,138 | $99,540 |
| Mean Family Income | 23,138 | $127,535 |
| Median Household Income | 44,206 | $60,893 |
| Mean Household Income | 44,206 | $90,976 |
| Income Deficit | 23,138 | $11,118 |
| Wage / Income Gap (%) | 105,988 | 23.07% |
| Wage / Income Gap ($) | 105,988 | 76.93¢ per $1 |
| Gini / Inequality Index | 105,988 | 0.51 |
Earnings by Sex in Monongalia County
Average Earnings in Monongalia County are $32,569, $36,837 for men and $28,337 for women, a difference of 23.1%.
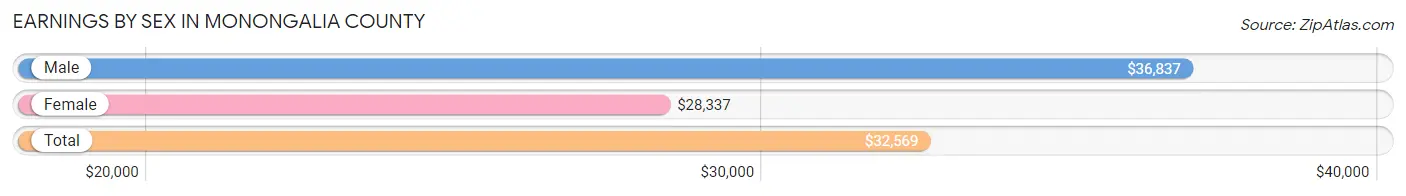
| Sex | Number | Average Earnings |
| Male | 34,726 (53.6%) | $36,837 |
| Female | 30,112 (46.4%) | $28,337 |
| Total | 64,838 (100.0%) | $32,569 |
Earnings by Sex by Income Bracket in Monongalia County
The most common earnings brackets in Monongalia County are $100,000+ for men (5,528 | 15.9%) and $2,499 or less for women (2,920 | 9.7%).
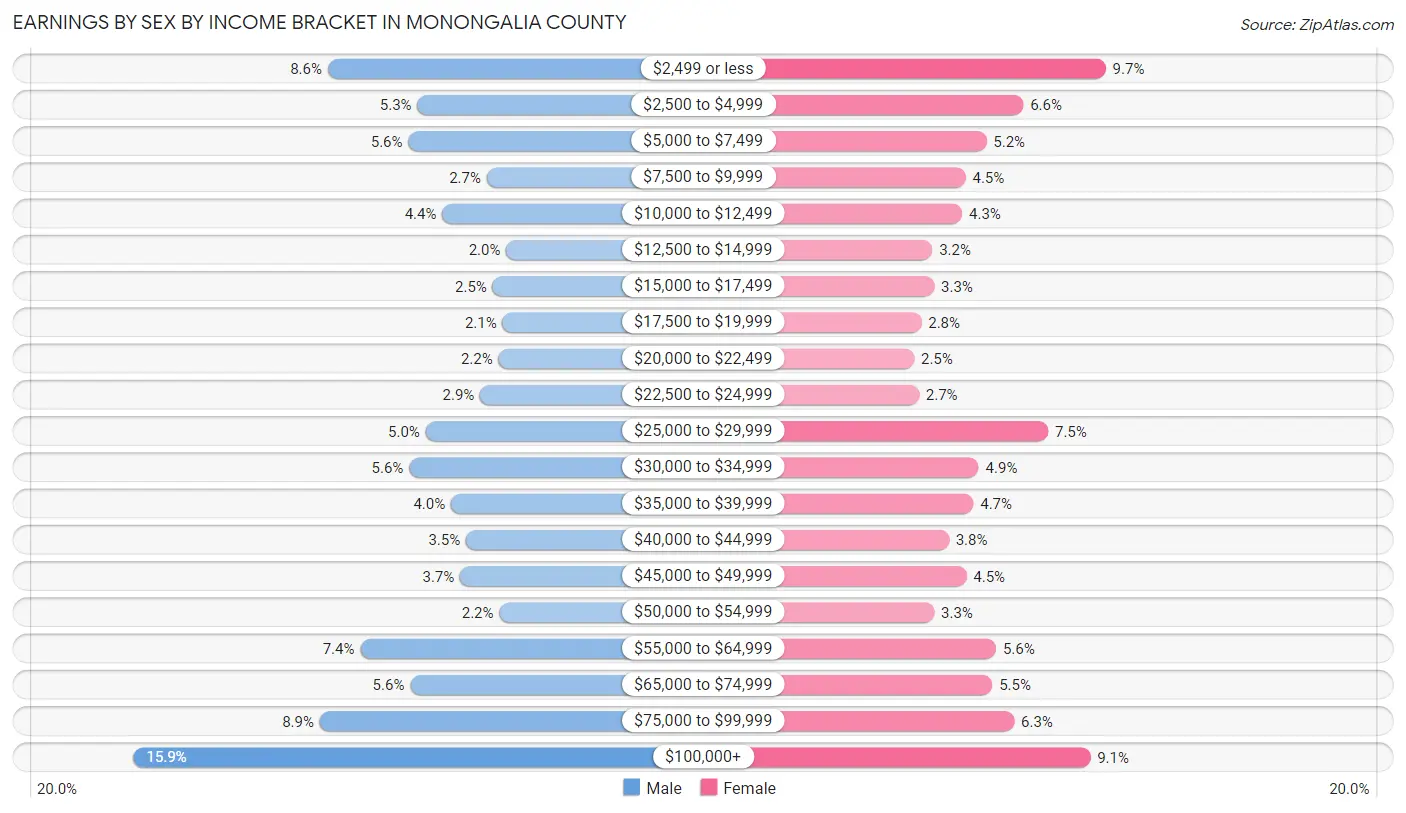
| Income | Male | Female |
| $2,499 or less | 3,001 (8.6%) | 2,920 (9.7%) |
| $2,500 to $4,999 | 1,835 (5.3%) | 1,990 (6.6%) |
| $5,000 to $7,499 | 1,952 (5.6%) | 1,574 (5.2%) |
| $7,500 to $9,999 | 932 (2.7%) | 1,339 (4.4%) |
| $10,000 to $12,499 | 1,509 (4.3%) | 1,301 (4.3%) |
| $12,500 to $14,999 | 677 (1.9%) | 964 (3.2%) |
| $15,000 to $17,499 | 854 (2.5%) | 984 (3.3%) |
| $17,500 to $19,999 | 725 (2.1%) | 839 (2.8%) |
| $20,000 to $22,499 | 779 (2.2%) | 758 (2.5%) |
| $22,500 to $24,999 | 1,016 (2.9%) | 812 (2.7%) |
| $25,000 to $29,999 | 1,725 (5.0%) | 2,271 (7.5%) |
| $30,000 to $34,999 | 1,940 (5.6%) | 1,487 (4.9%) |
| $35,000 to $39,999 | 1,396 (4.0%) | 1,428 (4.7%) |
| $40,000 to $44,999 | 1,200 (3.5%) | 1,149 (3.8%) |
| $45,000 to $49,999 | 1,278 (3.7%) | 1,350 (4.5%) |
| $50,000 to $54,999 | 769 (2.2%) | 985 (3.3%) |
| $55,000 to $64,999 | 2,576 (7.4%) | 1,684 (5.6%) |
| $65,000 to $74,999 | 1,929 (5.6%) | 1,641 (5.4%) |
| $75,000 to $99,999 | 3,105 (8.9%) | 1,889 (6.3%) |
| $100,000+ | 5,528 (15.9%) | 2,747 (9.1%) |
| Total | 34,726 (100.0%) | 30,112 (100.0%) |
Earnings by Sex by Educational Attainment in Monongalia County
Average earnings in Monongalia County are $55,496 for men and $42,529 for women, a difference of 23.4%. Men with an educational attainment of graduate degree enjoy the highest average annual earnings of $83,577, while those with less than high school education earn the least with $19,207. Women with an educational attainment of graduate degree earn the most with the average annual earnings of $67,045, while those with less than high school education have the smallest earnings of $14,315.
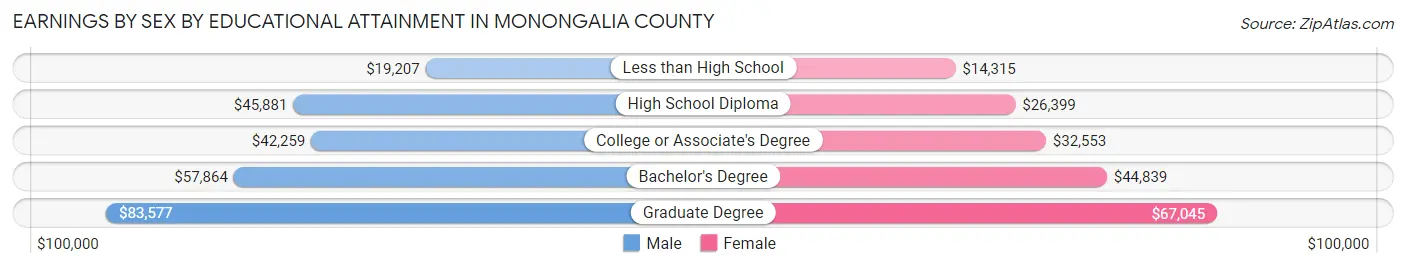
| Educational Attainment | Male Income | Female Income |
| Less than High School | $19,207 | $14,315 |
| High School Diploma | $45,881 | $26,399 |
| College or Associate's Degree | $42,259 | $32,553 |
| Bachelor's Degree | $57,864 | $44,839 |
| Graduate Degree | $83,577 | $67,045 |
| Total | $55,496 | $42,529 |
Family Income in Monongalia County
Family Income Brackets in Monongalia County
According to the Monongalia County family income data, there are 4,720 families falling into the $100,000 to $149,999 income range, which is the most common income bracket and makes up 20.4% of all families. Conversely, the $10,000 to $14,999 income bracket is the least frequent group with only 578 families (2.5%) belonging to this category.
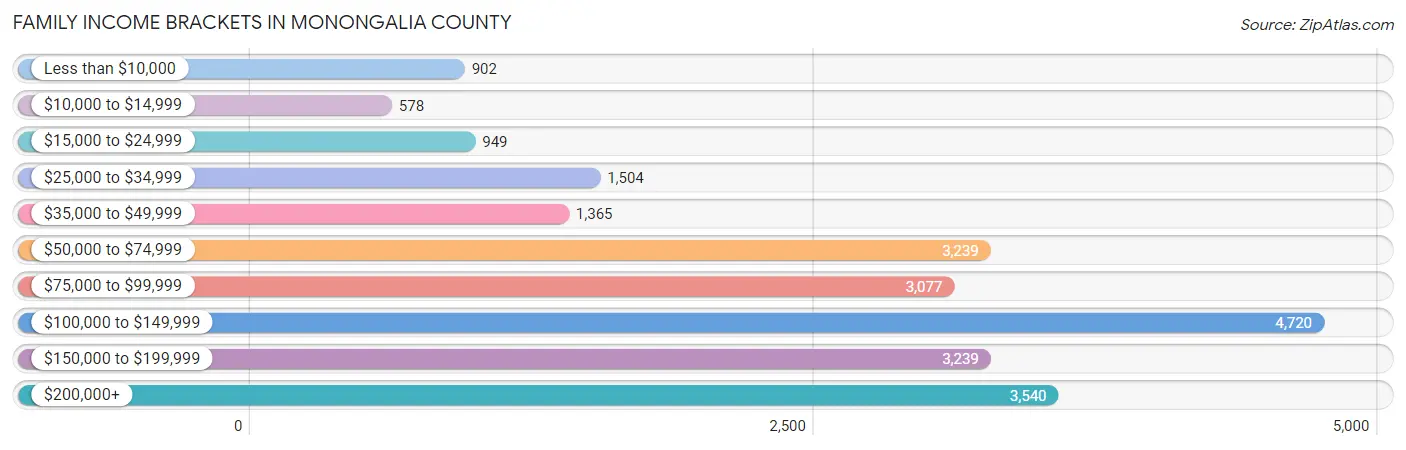
| Income Bracket | # Families | % Families |
| Less than $10,000 | 902 | 3.9% |
| $10,000 to $14,999 | 578 | 2.5% |
| $15,000 to $24,999 | 949 | 4.1% |
| $25,000 to $34,999 | 1,504 | 6.5% |
| $35,000 to $49,999 | 1,365 | 5.9% |
| $50,000 to $74,999 | 3,239 | 14.0% |
| $75,000 to $99,999 | 3,077 | 13.3% |
| $100,000 to $149,999 | 4,720 | 20.4% |
| $150,000 to $199,999 | 3,239 | 14.0% |
| $200,000+ | 3,540 | 15.3% |
Family Income by Famaliy Size in Monongalia County
5-person families (1,226 | 5.3%) account for the highest median family income in Monongalia County with $140,078 per family, while 2-person families (11,423 | 49.4%) have the highest median income of $41,353 per family member.
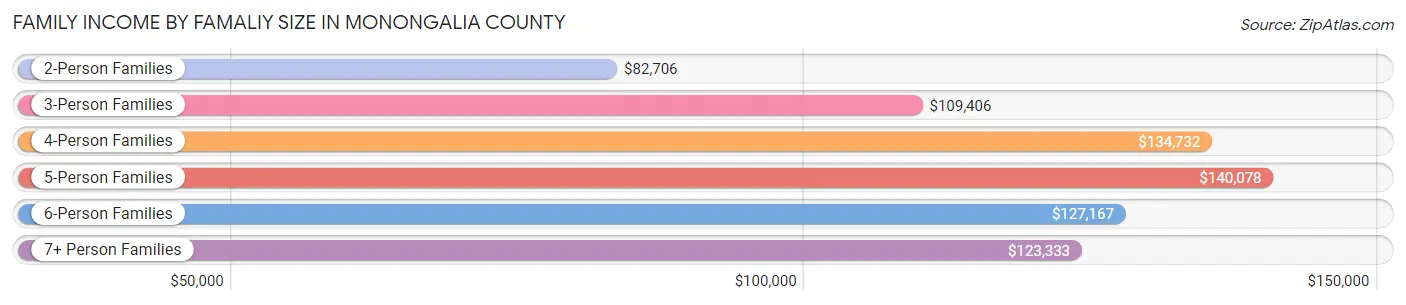
| Income Bracket | # Families | Median Income |
| 2-Person Families | 11,423 (49.4%) | $82,706 |
| 3-Person Families | 5,775 (25.0%) | $109,406 |
| 4-Person Families | 4,142 (17.9%) | $134,732 |
| 5-Person Families | 1,226 (5.3%) | $140,078 |
| 6-Person Families | 364 (1.6%) | $127,167 |
| 7+ Person Families | 208 (0.9%) | $123,333 |
| Total | 23,138 (100.0%) | $99,540 |
Family Income by Number of Earners in Monongalia County
The median family income in Monongalia County is $99,540, with families comprising 3+ earners (2,154) having the highest median family income of $160,441, while families with no earners (3,409) have the lowest median family income of $57,770, accounting for 9.3% and 14.7% of families, respectively.
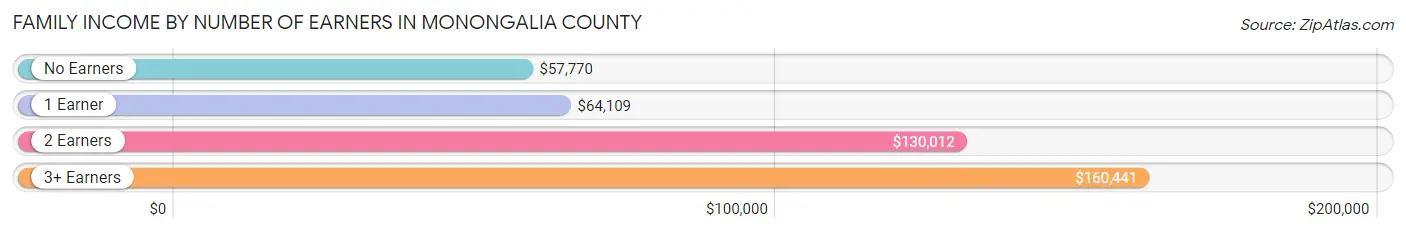
| Number of Earners | # Families | Median Income |
| No Earners | 3,409 (14.7%) | $57,770 |
| 1 Earner | 7,170 (31.0%) | $64,109 |
| 2 Earners | 10,405 (45.0%) | $130,012 |
| 3+ Earners | 2,154 (9.3%) | $160,441 |
| Total | 23,138 (100.0%) | $99,540 |
Household Income in Monongalia County
Household Income Brackets in Monongalia County
With 6,808 households falling in the category, the $50,000 to $74,999 income range is the most frequent in Monongalia County, accounting for 15.4% of all households. In contrast, only 2,078 households (4.7%) fall into the $10,000 to $14,999 income bracket, making it the least populous group.
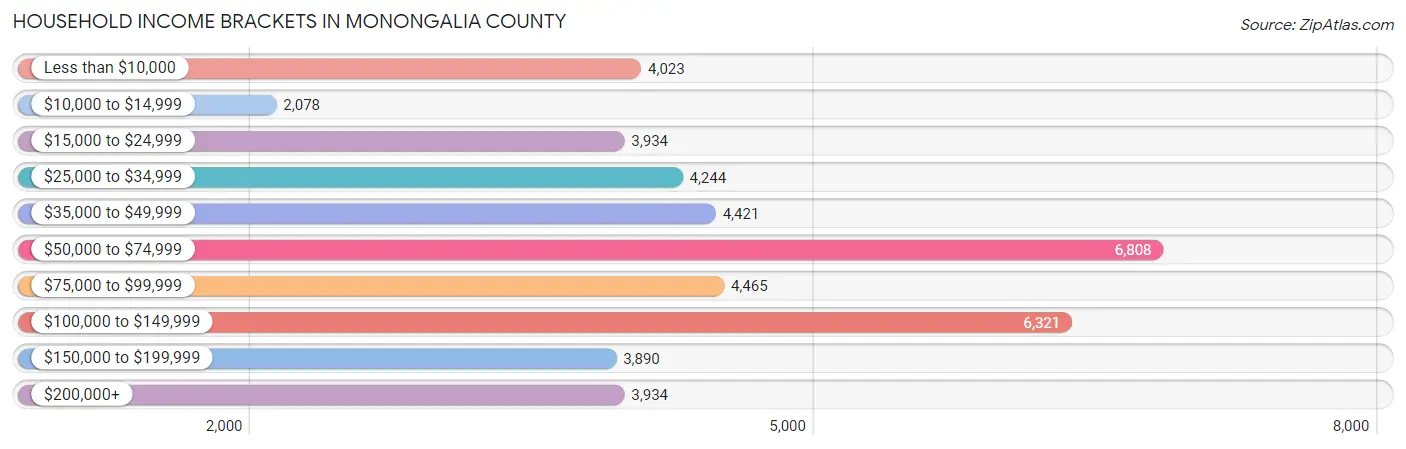
| Income Bracket | # Households | % Households |
| Less than $10,000 | 4,023 | 9.1% |
| $10,000 to $14,999 | 2,078 | 4.7% |
| $15,000 to $24,999 | 3,934 | 8.9% |
| $25,000 to $34,999 | 4,244 | 9.6% |
| $35,000 to $49,999 | 4,421 | 10.0% |
| $50,000 to $74,999 | 6,808 | 15.4% |
| $75,000 to $99,999 | 4,465 | 10.1% |
| $100,000 to $149,999 | 6,321 | 14.3% |
| $150,000 to $199,999 | 3,890 | 8.8% |
| $200,000+ | 3,934 | 8.9% |
Household Income by Householder Age in Monongalia County
The median household income in Monongalia County is $60,893, with the highest median household income of $93,800 found in the 45 to 64 years age bracket for the primary householder. A total of 12,266 households (27.8%) fall into this category. Meanwhile, the 15 to 24 years age bracket for the primary householder has the lowest median household income of $19,265, with 7,575 households (17.1%) in this group.
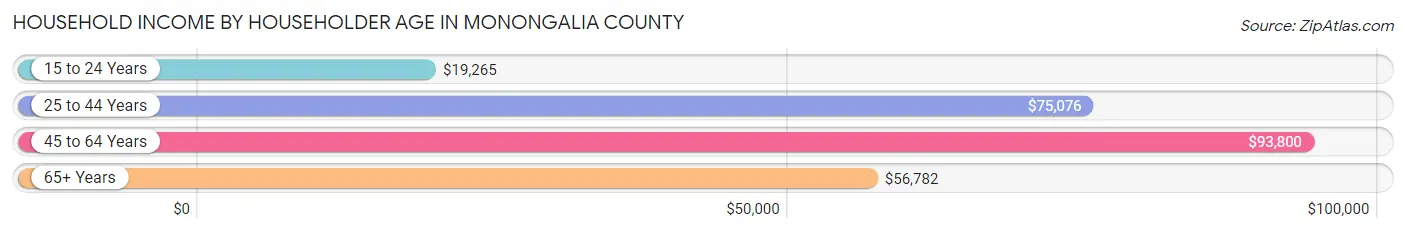
| Income Bracket | # Households | Median Income |
| 15 to 24 Years | 7,575 (17.1%) | $19,265 |
| 25 to 44 Years | 15,646 (35.4%) | $75,076 |
| 45 to 64 Years | 12,266 (27.8%) | $93,800 |
| 65+ Years | 8,719 (19.7%) | $56,782 |
| Total | 44,206 (100.0%) | $60,893 |
Poverty in Monongalia County
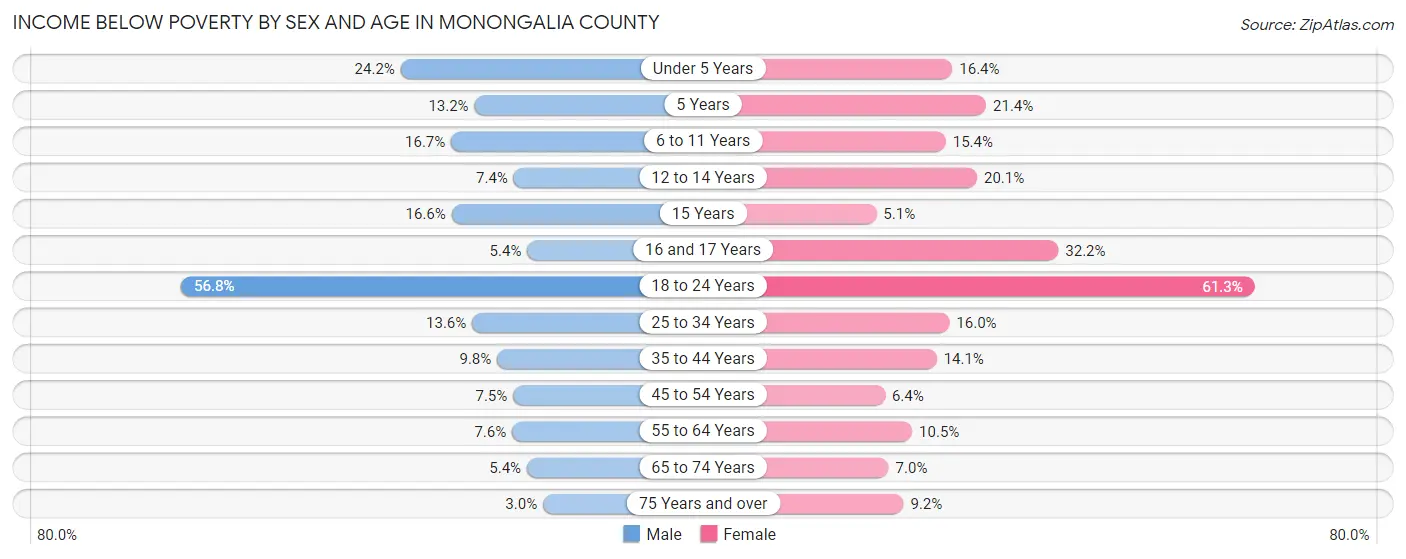
Income Below Poverty by Sex and Age in Monongalia County
With 19.7% poverty level for males and 21.6% for females among the residents of Monongalia County, 18 to 24 year old males and 18 to 24 year old females are the most vulnerable to poverty, with 5,796 males (56.8%) and 5,453 females (61.3%) in their respective age groups living below the poverty level.
| Age Bracket | Male | Female |
| Under 5 Years | 588 (24.2%) | 372 (16.4%) |
| 5 Years | 52 (13.2%) | 90 (21.4%) |
| 6 to 11 Years | 502 (16.7%) | 384 (15.4%) |
| 12 to 14 Years | 107 (7.4%) | 293 (20.1%) |
| 15 Years | 68 (16.6%) | 19 (5.1%) |
| 16 and 17 Years | 50 (5.4%) | 320 (32.2%) |
| 18 to 24 Years | 5,796 (56.8%) | 5,453 (61.3%) |
| 25 to 34 Years | 1,179 (13.6%) | 1,224 (16.0%) |
| 35 to 44 Years | 679 (9.8%) | 863 (14.1%) |
| 45 to 54 Years | 401 (7.5%) | 327 (6.4%) |
| 55 to 64 Years | 396 (7.6%) | 586 (10.4%) |
| 65 to 74 Years | 225 (5.4%) | 297 (7.0%) |
| 75 Years and over | 62 (3.0%) | 261 (9.2%) |
| Total | 10,105 (19.7%) | 10,489 (21.6%) |
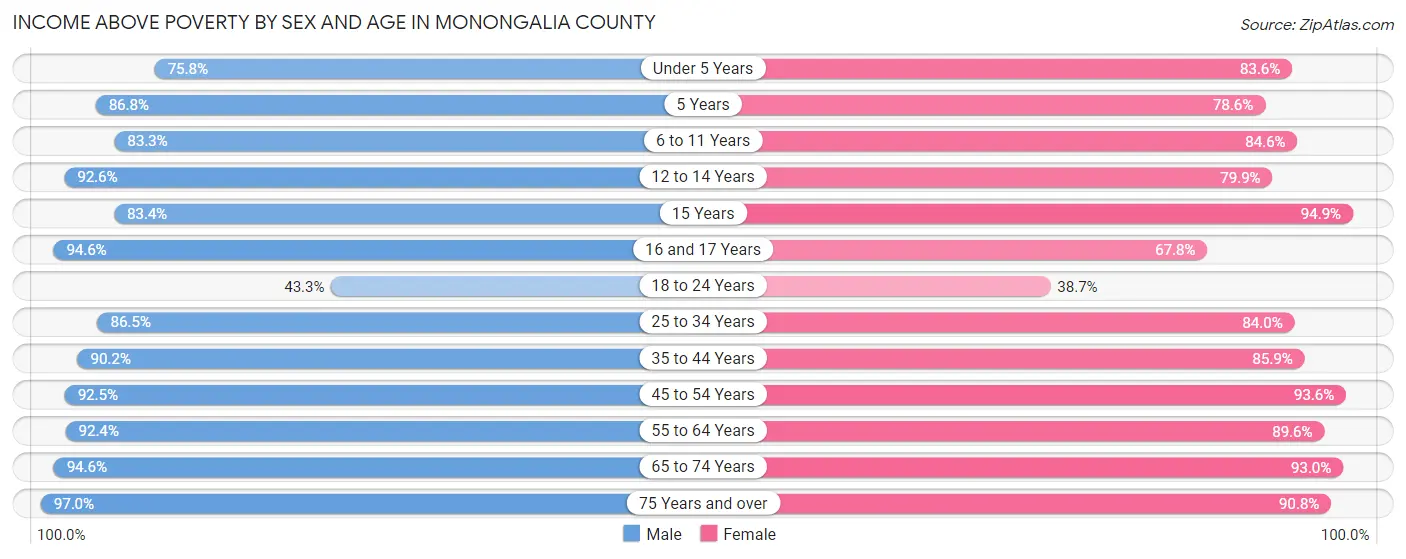
Income Above Poverty by Sex and Age in Monongalia County
According to the poverty statistics in Monongalia County, males aged 75 years and over and females aged 15 years are the age groups that are most secure financially, with 97.0% of males and 94.9% of females in these age groups living above the poverty line.
| Age Bracket | Male | Female |
| Under 5 Years | 1,846 (75.8%) | 1,894 (83.6%) |
| 5 Years | 342 (86.8%) | 330 (78.6%) |
| 6 to 11 Years | 2,510 (83.3%) | 2,103 (84.6%) |
| 12 to 14 Years | 1,342 (92.6%) | 1,166 (79.9%) |
| 15 Years | 342 (83.4%) | 351 (94.9%) |
| 16 and 17 Years | 882 (94.6%) | 675 (67.8%) |
| 18 to 24 Years | 4,417 (43.2%) | 3,445 (38.7%) |
| 25 to 34 Years | 7,525 (86.5%) | 6,435 (84.0%) |
| 35 to 44 Years | 6,223 (90.2%) | 5,264 (85.9%) |
| 45 to 54 Years | 4,971 (92.5%) | 4,777 (93.6%) |
| 55 to 64 Years | 4,802 (92.4%) | 5,023 (89.5%) |
| 65 to 74 Years | 3,931 (94.6%) | 3,968 (93.0%) |
| 75 Years and over | 1,993 (97.0%) | 2,584 (90.8%) |
| Total | 41,126 (80.3%) | 38,015 (78.4%) |
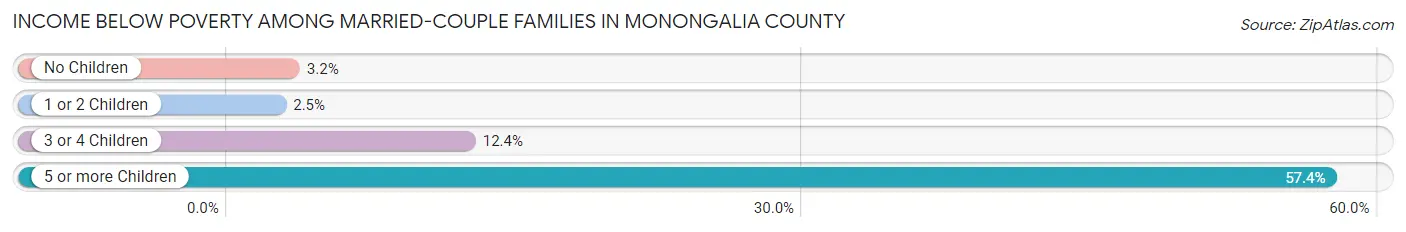
Income Below Poverty Among Married-Couple Families in Monongalia County
The poverty statistics for married-couple families in Monongalia County show that 3.7% or 662 of the total 17,855 families live below the poverty line. Families with 5 or more children have the highest poverty rate of 57.4%, comprising of 31 families. On the other hand, families with 1 or 2 children have the lowest poverty rate of 2.5%, which includes 154 families.
| Children | Above Poverty | Below Poverty |
| No Children | 10,263 (96.8%) | 343 (3.2%) |
| 1 or 2 Children | 5,962 (97.5%) | 154 (2.5%) |
| 3 or 4 Children | 945 (87.6%) | 134 (12.4%) |
| 5 or more Children | 23 (42.6%) | 31 (57.4%) |
| Total | 17,193 (96.3%) | 662 (3.7%) |
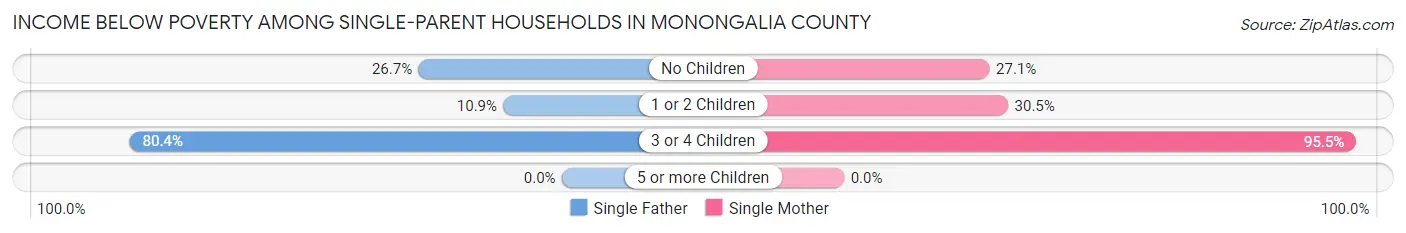
Income Below Poverty Among Single-Parent Households in Monongalia County
According to the poverty data in Monongalia County, 22.8% or 451 single-father households and 35.8% or 1,183 single-mother households are living below the poverty line. Among single-father households, those with 3 or 4 children have the highest poverty rate, with 74 households (80.4%) experiencing poverty. Likewise, among single-mother households, those with 3 or 4 children have the highest poverty rate, with 315 households (95.5%) falling below the poverty line.
| Children | Single Father | Single Mother |
| No Children | 290 (26.7%) | 310 (27.1%) |
| 1 or 2 Children | 87 (10.9%) | 558 (30.5%) |
| 3 or 4 Children | 74 (80.4%) | 315 (95.5%) |
| 5 or more Children | 0 (0.0%) | 0 (0.0%) |
| Total | 451 (22.8%) | 1,183 (35.8%) |
Income Below Poverty Among Married-Couple vs Single-Parent Households in Monongalia County
The poverty data for Monongalia County shows that 662 of the married-couple family households (3.7%) and 1,634 of the single-parent households (30.9%) are living below the poverty level. Within the married-couple family households, those with 5 or more children have the highest poverty rate, with 31 households (57.4%) falling below the poverty line. Among the single-parent households, those with 3 or 4 children have the highest poverty rate, with 389 household (92.2%) living below poverty.
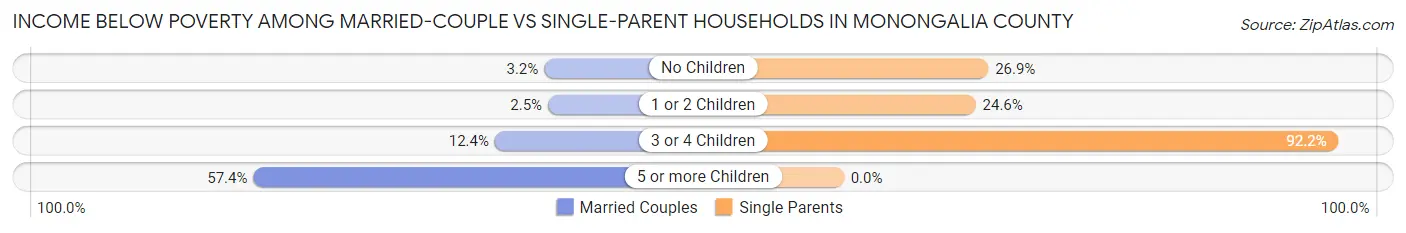
| Children | Married-Couple Families | Single-Parent Households |
| No Children | 343 (3.2%) | 600 (26.9%) |
| 1 or 2 Children | 154 (2.5%) | 645 (24.6%) |
| 3 or 4 Children | 134 (12.4%) | 389 (92.2%) |
| 5 or more Children | 31 (57.4%) | 0 (0.0%) |
| Total | 662 (3.7%) | 1,634 (30.9%) |
Employment Characteristics in Monongalia County
Employment by Class of Employer in Monongalia County
Among the 53,500 employed individuals in Monongalia County, private company employees (31,358 | 58.6%), state government employees (7,940 | 14.8%), and not-for-profit organizations (5,734 | 10.7%) make up the most common classes of employment.
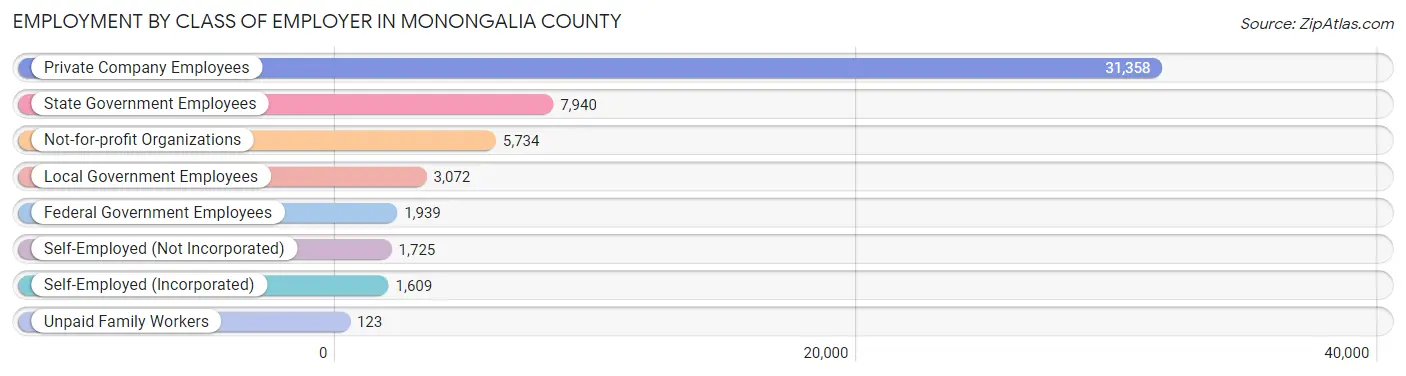
| Employer Class | # Employees | % Employees |
| Private Company Employees | 31,358 | 58.6% |
| Self-Employed (Incorporated) | 1,609 | 3.0% |
| Self-Employed (Not Incorporated) | 1,725 | 3.2% |
| Not-for-profit Organizations | 5,734 | 10.7% |
| Local Government Employees | 3,072 | 5.7% |
| State Government Employees | 7,940 | 14.8% |
| Federal Government Employees | 1,939 | 3.6% |
| Unpaid Family Workers | 123 | 0.2% |
| Total | 53,500 | 100.0% |
Employment Status by Age in Monongalia County
According to the labor force statistics for Monongalia County, out of the total population over 16 years of age (91,078), 63.5% or 57,835 individuals are in the labor force, with 5.7% or 3,297 of them unemployed. The age group with the highest labor force participation rate is 35 to 44 years, with 85.6% or 11,381 individuals in the labor force. Within the labor force, the 16 to 19 years age range has the highest percentage of unemployed individuals, with 28.2% or 927 of them being unemployed.
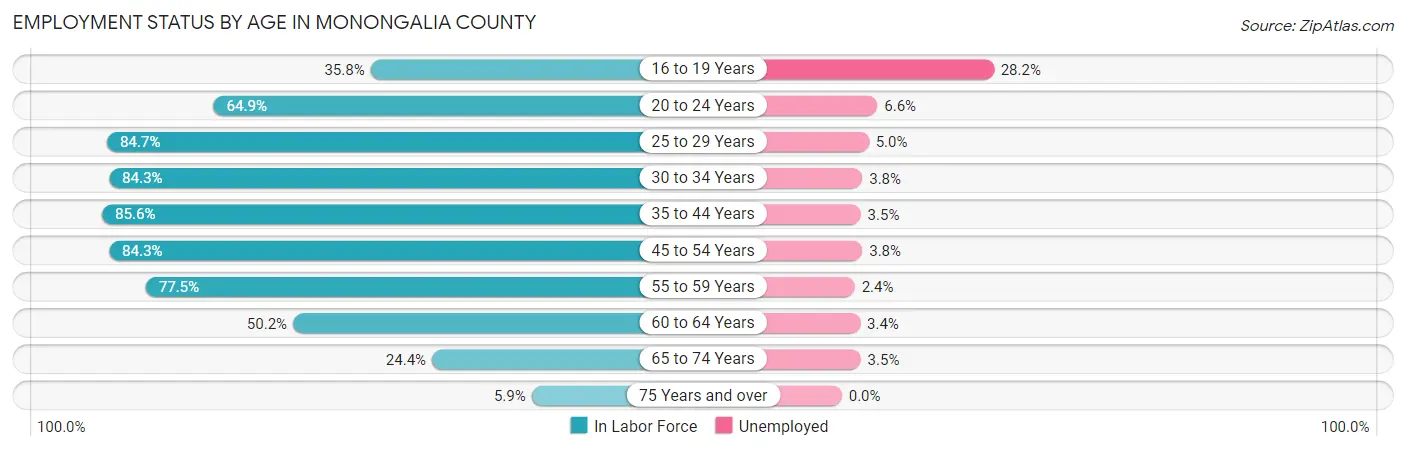
| Age Bracket | In Labor Force | Unemployed |
| 16 to 19 Years | 3,289 (35.8%) | 927 (28.2%) |
| 20 to 24 Years | 10,944 (64.9%) | 722 (6.6%) |
| 25 to 29 Years | 7,234 (84.7%) | 362 (5.0%) |
| 30 to 34 Years | 6,691 (84.3%) | 254 (3.8%) |
| 35 to 44 Years | 11,381 (85.6%) | 398 (3.5%) |
| 45 to 54 Years | 8,951 (84.3%) | 340 (3.8%) |
| 55 to 59 Years | 4,160 (77.5%) | 100 (2.4%) |
| 60 to 64 Years | 2,788 (50.2%) | 95 (3.4%) |
| 65 to 74 Years | 2,083 (24.4%) | 73 (3.5%) |
| 75 Years and over | 305 (5.9%) | 0 (0.0%) |
| Total | 57,835 (63.5%) | 3,297 (5.7%) |
Employment Status by Educational Attainment in Monongalia County
According to labor force statistics for Monongalia County, 80.3% of individuals (41,205) out of the total population between 25 and 64 years of age (51,314) are in the labor force, with 3.8% or 1,566 of them being unemployed. The group with the highest labor force participation rate are those with the educational attainment of bachelor's degree or higher, with 87.1% or 23,142 individuals in the labor force. Within the labor force, individuals with less than high school education have the highest percentage of unemployment, with 15.4% or 215 of them being unemployed.
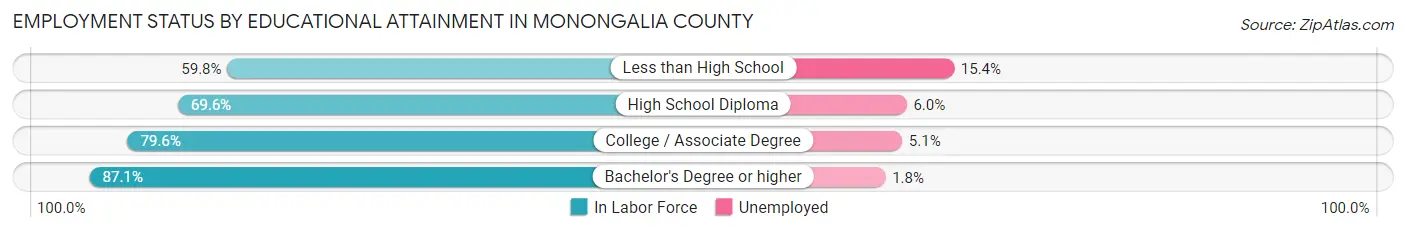
| Educational Attainment | In Labor Force | Unemployed |
| Less than High School | 1,399 (59.8%) | 360 (15.4%) |
| High School Diploma | 8,149 (69.6%) | 702 (6.0%) |
| College / Associate Degree | 8,514 (79.6%) | 545 (5.1%) |
| Bachelor's Degree or higher | 23,142 (87.1%) | 478 (1.8%) |
| Total | 41,205 (80.3%) | 1,950 (3.8%) |
Employment Occupations by Sex in Monongalia County
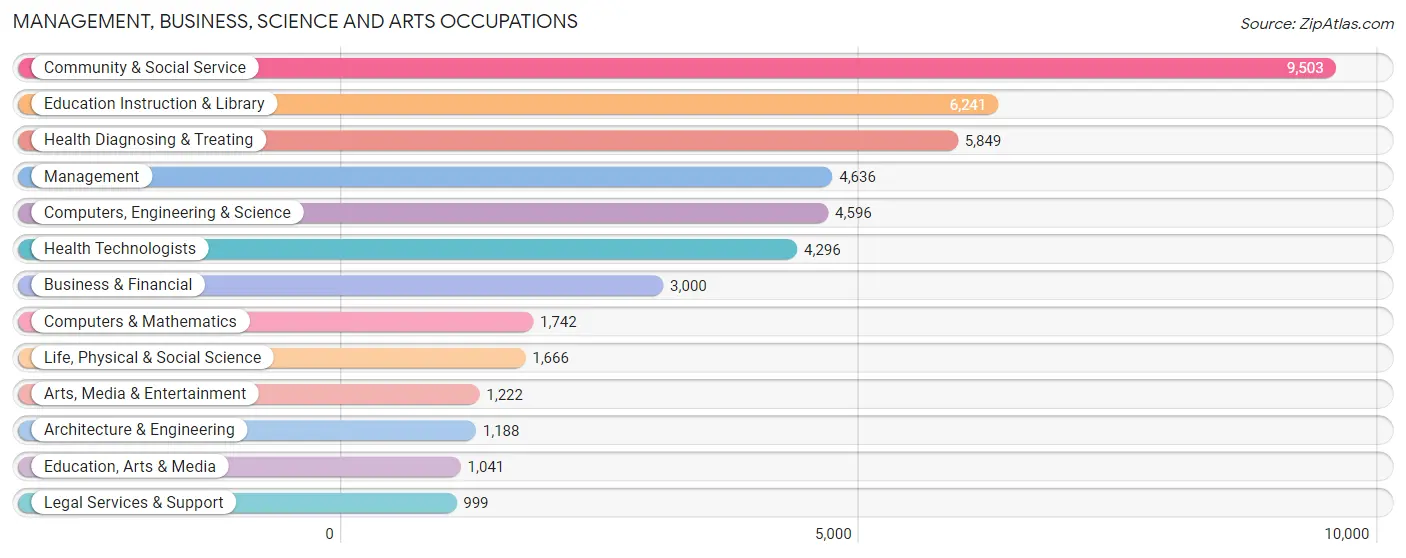
Management, Business, Science and Arts Occupations
The most common Management, Business, Science and Arts occupations in Monongalia County are Community & Social Service (9,503 | 17.5%), Education Instruction & Library (6,241 | 11.5%), Health Diagnosing & Treating (5,849 | 10.7%), Management (4,636 | 8.5%), and Computers, Engineering & Science (4,596 | 8.5%).
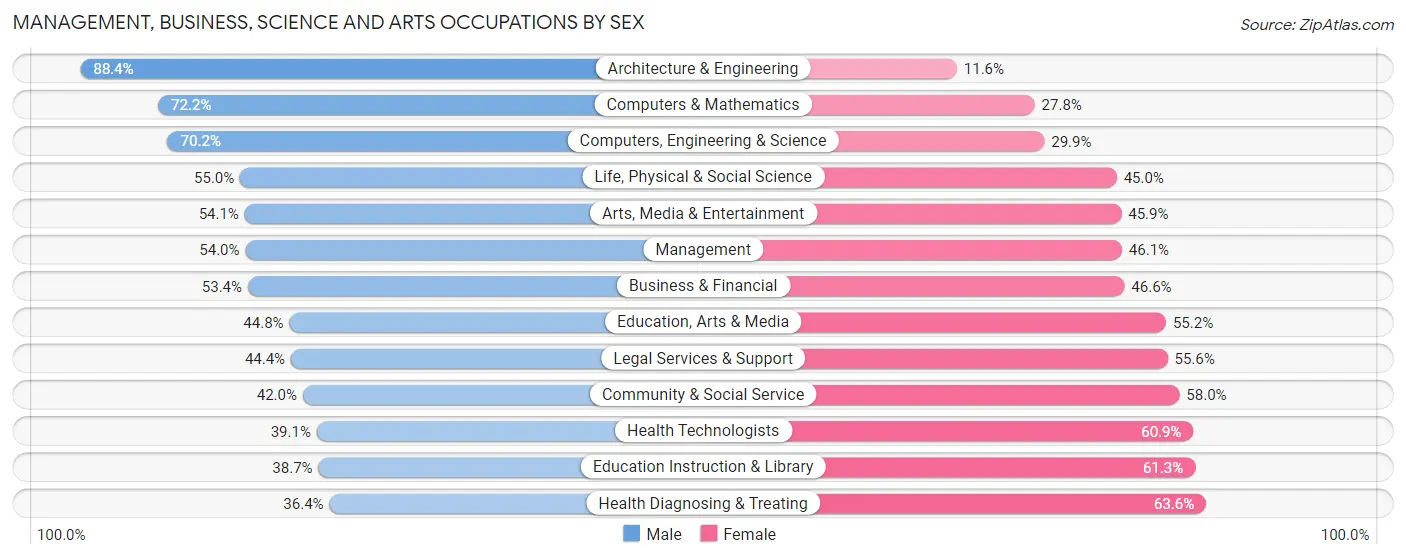
Management, Business, Science and Arts Occupations by Sex
Within the Management, Business, Science and Arts occupations in Monongalia County, the most male-oriented occupations are Architecture & Engineering (88.4%), Computers & Mathematics (72.2%), and Computers, Engineering & Science (70.2%), while the most female-oriented occupations are Health Diagnosing & Treating (63.6%), Education Instruction & Library (61.3%), and Health Technologists (60.9%).
| Occupation | Male | Female |
| Management | 2,501 (53.9%) | 2,135 (46.1%) |
| Business & Financial | 1,603 (53.4%) | 1,397 (46.6%) |
| Computers, Engineering & Science | 3,224 (70.2%) | 1,372 (29.8%) |
| Computers & Mathematics | 1,257 (72.2%) | 485 (27.8%) |
| Architecture & Engineering | 1,050 (88.4%) | 138 (11.6%) |
| Life, Physical & Social Science | 917 (55.0%) | 749 (45.0%) |
| Community & Social Service | 3,987 (42.0%) | 5,516 (58.0%) |
| Education, Arts & Media | 466 (44.8%) | 575 (55.2%) |
| Legal Services & Support | 444 (44.4%) | 555 (55.6%) |
| Education Instruction & Library | 2,416 (38.7%) | 3,825 (61.3%) |
| Arts, Media & Entertainment | 661 (54.1%) | 561 (45.9%) |
| Health Diagnosing & Treating | 2,130 (36.4%) | 3,719 (63.6%) |
| Health Technologists | 1,678 (39.1%) | 2,618 (60.9%) |
| Total (Category) | 13,445 (48.7%) | 14,139 (51.3%) |
| Total (Overall) | 28,657 (52.7%) | 25,729 (47.3%) |
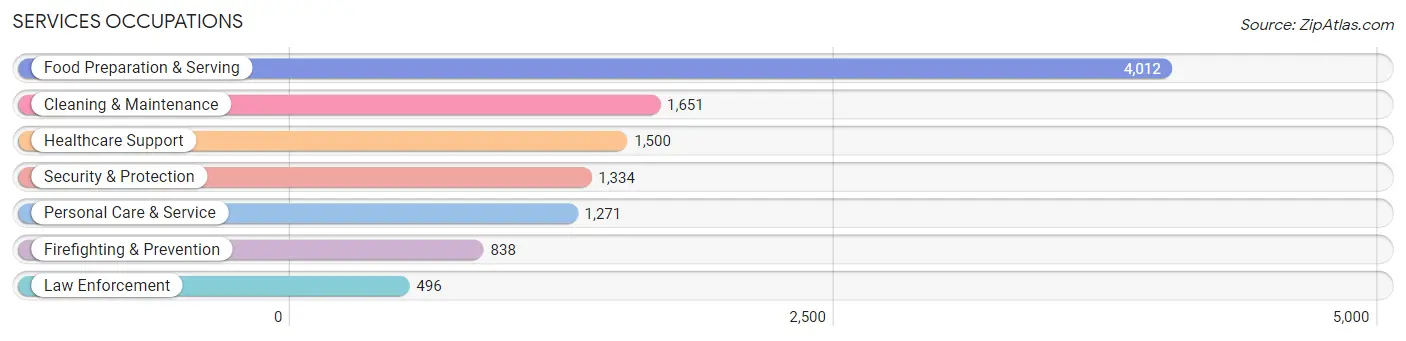
Services Occupations
The most common Services occupations in Monongalia County are Food Preparation & Serving (4,012 | 7.4%), Cleaning & Maintenance (1,651 | 3.0%), Healthcare Support (1,500 | 2.8%), Security & Protection (1,334 | 2.5%), and Personal Care & Service (1,271 | 2.3%).
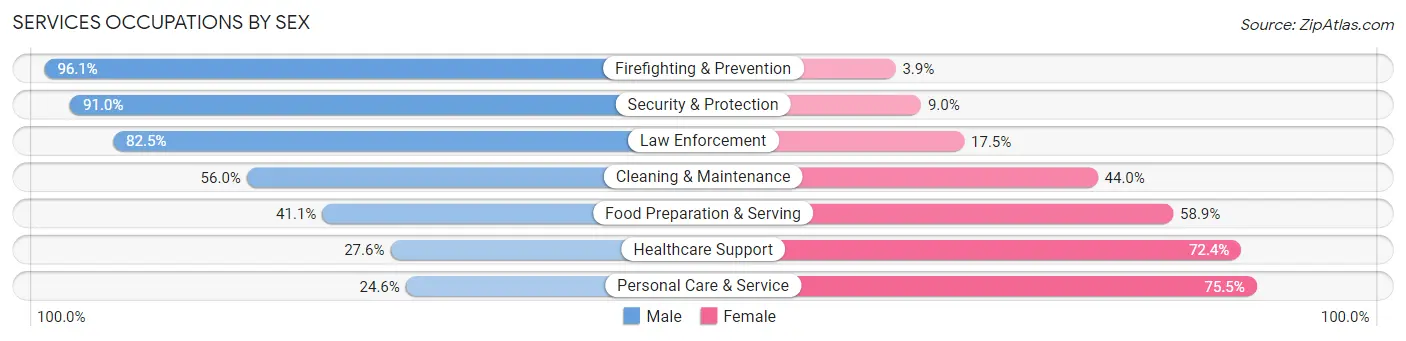
Services Occupations by Sex
Within the Services occupations in Monongalia County, the most male-oriented occupations are Firefighting & Prevention (96.1%), Security & Protection (91.0%), and Law Enforcement (82.5%), while the most female-oriented occupations are Personal Care & Service (75.4%), Healthcare Support (72.4%), and Food Preparation & Serving (58.9%).
| Occupation | Male | Female |
| Healthcare Support | 414 (27.6%) | 1,086 (72.4%) |
| Security & Protection | 1,214 (91.0%) | 120 (9.0%) |
| Firefighting & Prevention | 805 (96.1%) | 33 (3.9%) |
| Law Enforcement | 409 (82.5%) | 87 (17.5%) |
| Food Preparation & Serving | 1,648 (41.1%) | 2,364 (58.9%) |
| Cleaning & Maintenance | 925 (56.0%) | 726 (44.0%) |
| Personal Care & Service | 312 (24.5%) | 959 (75.4%) |
| Total (Category) | 4,513 (46.2%) | 5,255 (53.8%) |
| Total (Overall) | 28,657 (52.7%) | 25,729 (47.3%) |
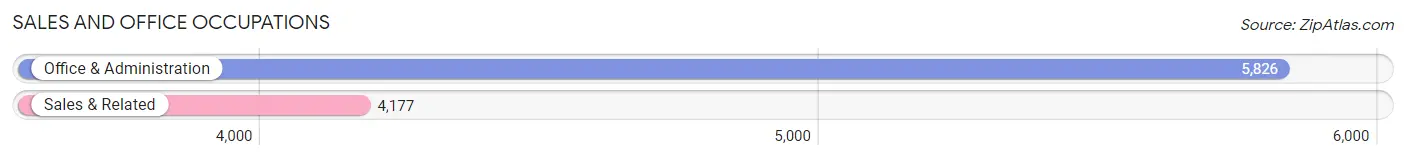
Sales and Office Occupations
The most common Sales and Office occupations in Monongalia County are Office & Administration (5,826 | 10.7%), and Sales & Related (4,177 | 7.7%).
Sales and Office Occupations by Sex
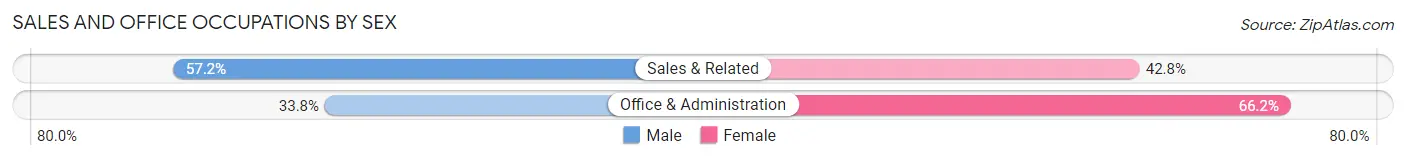
| Occupation | Male | Female |
| Sales & Related | 2,389 (57.2%) | 1,788 (42.8%) |
| Office & Administration | 1,970 (33.8%) | 3,856 (66.2%) |
| Total (Category) | 4,359 (43.6%) | 5,644 (56.4%) |
| Total (Overall) | 28,657 (52.7%) | 25,729 (47.3%) |
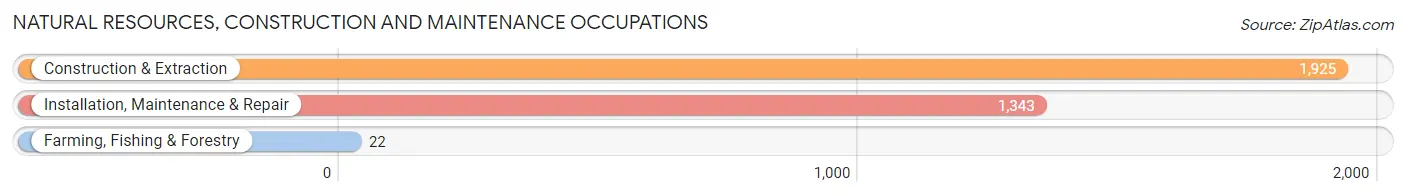
Natural Resources, Construction and Maintenance Occupations
The most common Natural Resources, Construction and Maintenance occupations in Monongalia County are Construction & Extraction (1,925 | 3.5%), Installation, Maintenance & Repair (1,343 | 2.5%), and Farming, Fishing & Forestry (22 | 0.0%).
Natural Resources, Construction and Maintenance Occupations by Sex
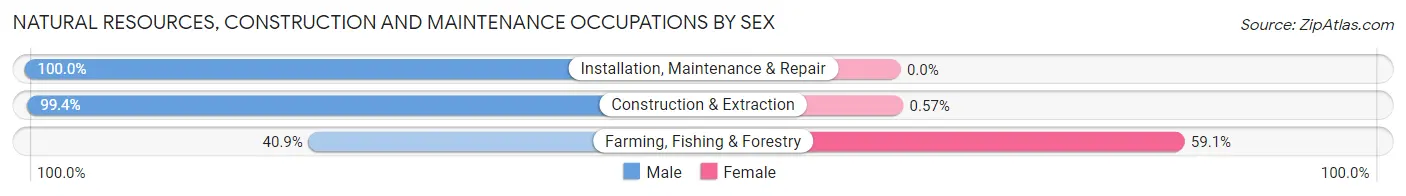
| Occupation | Male | Female |
| Farming, Fishing & Forestry | 9 (40.9%) | 13 (59.1%) |
| Construction & Extraction | 1,914 (99.4%) | 11 (0.6%) |
| Installation, Maintenance & Repair | 1,343 (100.0%) | 0 (0.0%) |
| Total (Category) | 3,266 (99.3%) | 24 (0.7%) |
| Total (Overall) | 28,657 (52.7%) | 25,729 (47.3%) |
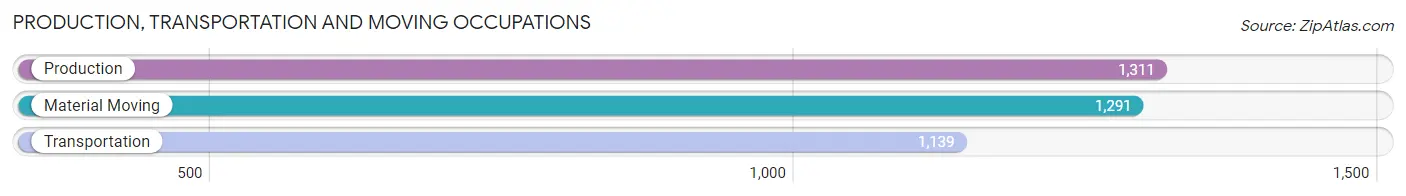
Production, Transportation and Moving Occupations
The most common Production, Transportation and Moving occupations in Monongalia County are Production (1,311 | 2.4%), Material Moving (1,291 | 2.4%), and Transportation (1,139 | 2.1%).
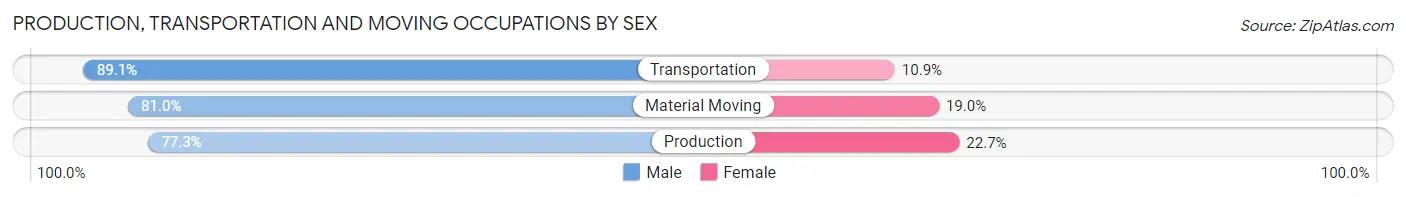
Production, Transportation and Moving Occupations by Sex
| Occupation | Male | Female |
| Production | 1,013 (77.3%) | 298 (22.7%) |
| Transportation | 1,015 (89.1%) | 124 (10.9%) |
| Material Moving | 1,046 (81.0%) | 245 (19.0%) |
| Total (Category) | 3,074 (82.2%) | 667 (17.8%) |
| Total (Overall) | 28,657 (52.7%) | 25,729 (47.3%) |
Employment Industries by Sex in Monongalia County
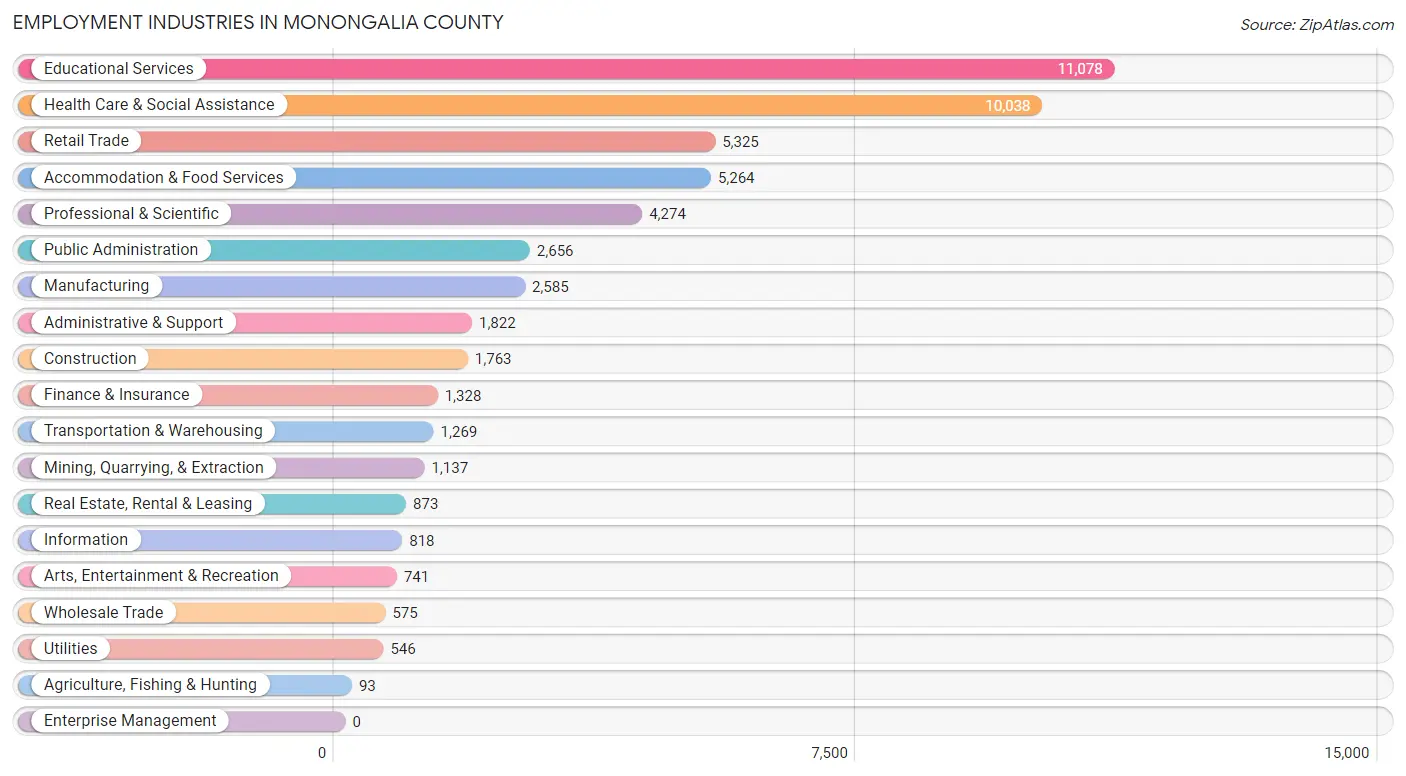
Employment Industries in Monongalia County
The major employment industries in Monongalia County include Educational Services (11,078 | 20.4%), Health Care & Social Assistance (10,038 | 18.5%), Retail Trade (5,325 | 9.8%), Accommodation & Food Services (5,264 | 9.7%), and Professional & Scientific (4,274 | 7.9%).
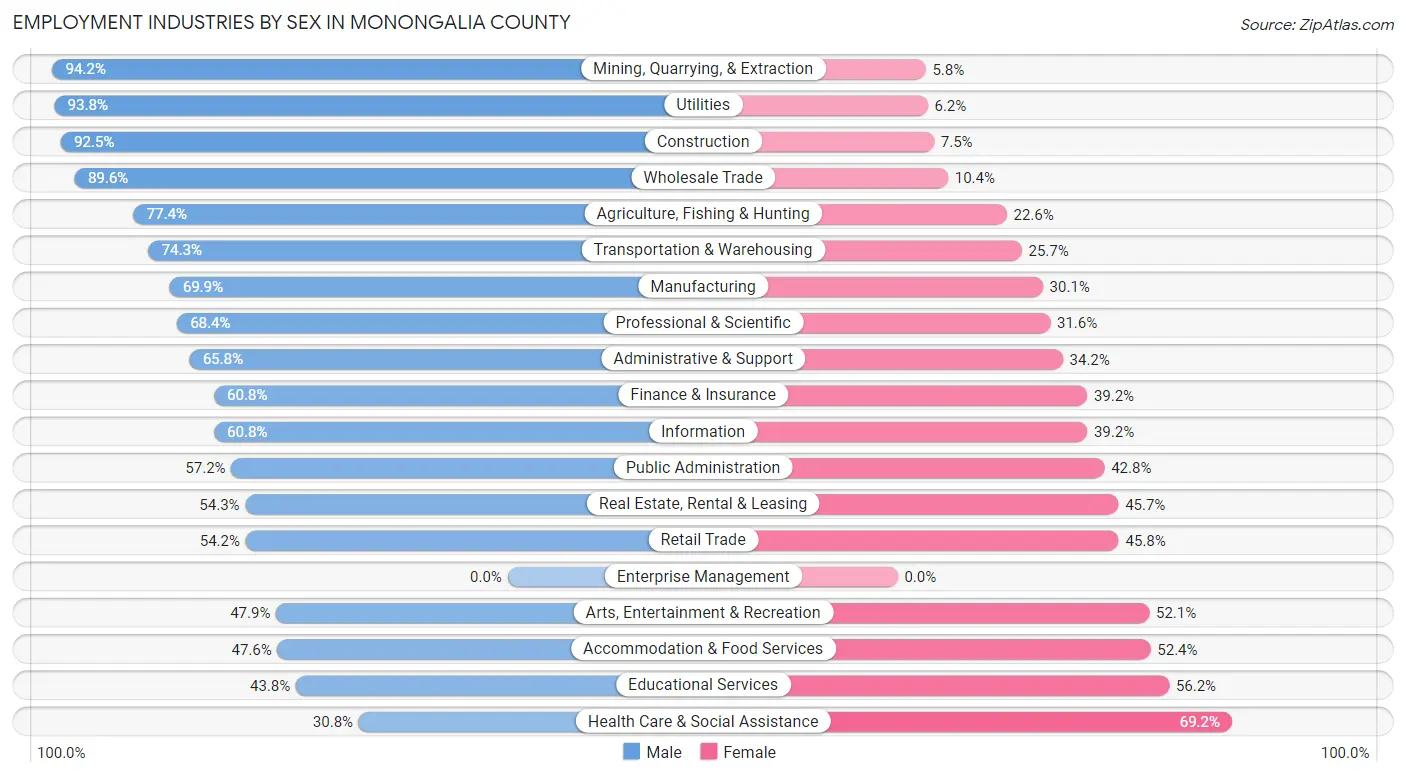
Employment Industries by Sex in Monongalia County
The Monongalia County industries that see more men than women are Mining, Quarrying, & Extraction (94.2%), Utilities (93.8%), and Construction (92.5%), whereas the industries that tend to have a higher number of women are Health Care & Social Assistance (69.2%), Educational Services (56.2%), and Accommodation & Food Services (52.4%).
| Industry | Male | Female |
| Agriculture, Fishing & Hunting | 72 (77.4%) | 21 (22.6%) |
| Mining, Quarrying, & Extraction | 1,071 (94.2%) | 66 (5.8%) |
| Construction | 1,630 (92.5%) | 133 (7.5%) |
| Manufacturing | 1,808 (69.9%) | 777 (30.1%) |
| Wholesale Trade | 515 (89.6%) | 60 (10.4%) |
| Retail Trade | 2,887 (54.2%) | 2,438 (45.8%) |
| Transportation & Warehousing | 943 (74.3%) | 326 (25.7%) |
| Utilities | 512 (93.8%) | 34 (6.2%) |
| Information | 497 (60.8%) | 321 (39.2%) |
| Finance & Insurance | 807 (60.8%) | 521 (39.2%) |
| Real Estate, Rental & Leasing | 474 (54.3%) | 399 (45.7%) |
| Professional & Scientific | 2,924 (68.4%) | 1,350 (31.6%) |
| Enterprise Management | 0 (0.0%) | 0 (0.0%) |
| Administrative & Support | 1,199 (65.8%) | 623 (34.2%) |
| Educational Services | 4,852 (43.8%) | 6,226 (56.2%) |
| Health Care & Social Assistance | 3,092 (30.8%) | 6,946 (69.2%) |
| Arts, Entertainment & Recreation | 355 (47.9%) | 386 (52.1%) |
| Accommodation & Food Services | 2,508 (47.6%) | 2,756 (52.4%) |
| Public Administration | 1,519 (57.2%) | 1,137 (42.8%) |
| Total | 28,657 (52.7%) | 25,729 (47.3%) |
Education in Monongalia County
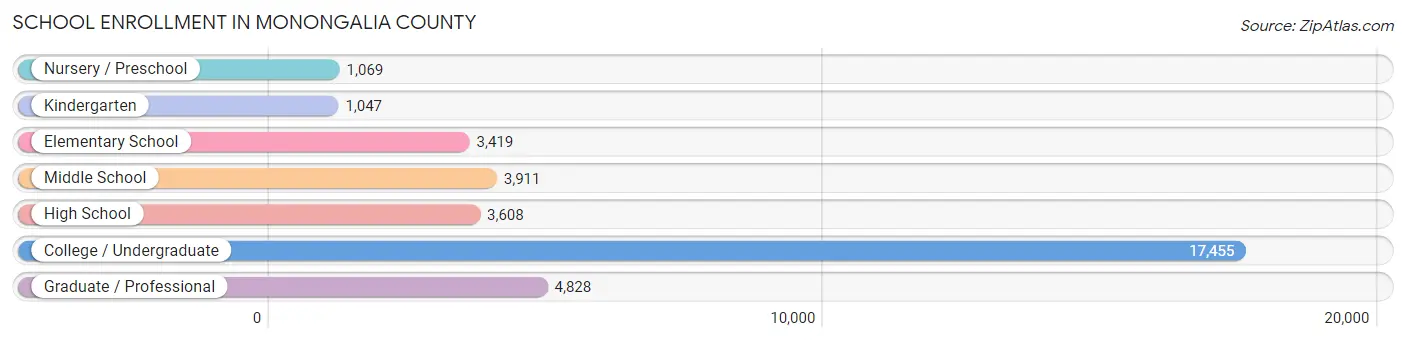
School Enrollment in Monongalia County
The most common levels of schooling among the 35,337 students in Monongalia County are college / undergraduate (17,455 | 49.4%), graduate / professional (4,828 | 13.7%), and middle school (3,911 | 11.1%).
| School Level | # Students | % Students |
| Nursery / Preschool | 1,069 | 3.0% |
| Kindergarten | 1,047 | 3.0% |
| Elementary School | 3,419 | 9.7% |
| Middle School | 3,911 | 11.1% |
| High School | 3,608 | 10.2% |
| College / Undergraduate | 17,455 | 49.4% |
| Graduate / Professional | 4,828 | 13.7% |
| Total | 35,337 | 100.0% |
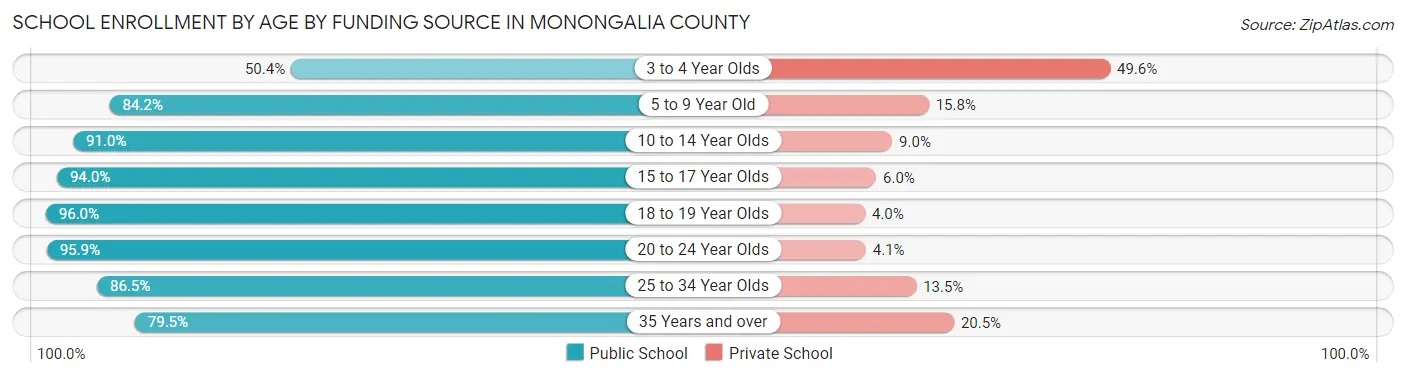
School Enrollment by Age by Funding Source in Monongalia County
Out of a total of 35,337 students who are enrolled in schools in Monongalia County, 3,110 (8.8%) attend a private institution, while the remaining 32,227 (91.2%) are enrolled in public schools. The age group of 3 to 4 year olds has the highest likelihood of being enrolled in private schools, with 389 (49.6% in the age bracket) enrolled. Conversely, the age group of 18 to 19 year olds has the lowest likelihood of being enrolled in a private school, with 6,379 (96.0% in the age bracket) attending a public institution.
| Age Bracket | Public School | Private School |
| 3 to 4 Year Olds | 395 (50.4%) | 389 (49.6%) |
| 5 to 9 Year Old | 3,661 (84.2%) | 689 (15.8%) |
| 10 to 14 Year Olds | 4,273 (91.0%) | 424 (9.0%) |
| 15 to 17 Year Olds | 2,566 (94.0%) | 165 (6.0%) |
| 18 to 19 Year Olds | 6,379 (96.0%) | 264 (4.0%) |
| 20 to 24 Year Olds | 11,238 (95.9%) | 484 (4.1%) |
| 25 to 34 Year Olds | 2,753 (86.5%) | 430 (13.5%) |
| 35 Years and over | 975 (79.5%) | 252 (20.5%) |
| Total | 32,227 (91.2%) | 3,110 (8.8%) |
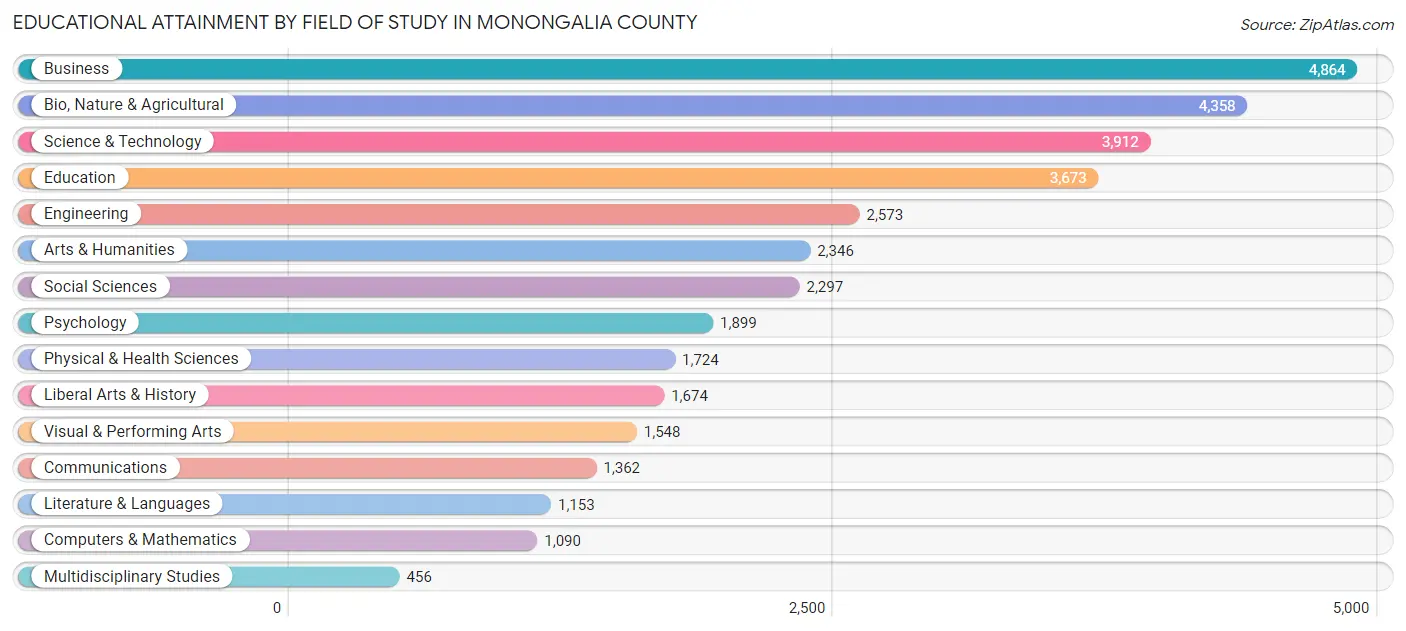
Educational Attainment by Field of Study in Monongalia County
Business (4,864 | 13.9%), bio, nature & agricultural (4,358 | 12.5%), science & technology (3,912 | 11.2%), education (3,673 | 10.5%), and engineering (2,573 | 7.4%) are the most common fields of study among 34,929 individuals in Monongalia County who have obtained a bachelor's degree or higher.
| Field of Study | # Graduates | % Graduates |
| Computers & Mathematics | 1,090 | 3.1% |
| Bio, Nature & Agricultural | 4,358 | 12.5% |
| Physical & Health Sciences | 1,724 | 4.9% |
| Psychology | 1,899 | 5.4% |
| Social Sciences | 2,297 | 6.6% |
| Engineering | 2,573 | 7.4% |
| Multidisciplinary Studies | 456 | 1.3% |
| Science & Technology | 3,912 | 11.2% |
| Business | 4,864 | 13.9% |
| Education | 3,673 | 10.5% |
| Literature & Languages | 1,153 | 3.3% |
| Liberal Arts & History | 1,674 | 4.8% |
| Visual & Performing Arts | 1,548 | 4.4% |
| Communications | 1,362 | 3.9% |
| Arts & Humanities | 2,346 | 6.7% |
| Total | 34,929 | 100.0% |
Transportation & Commute in Monongalia County
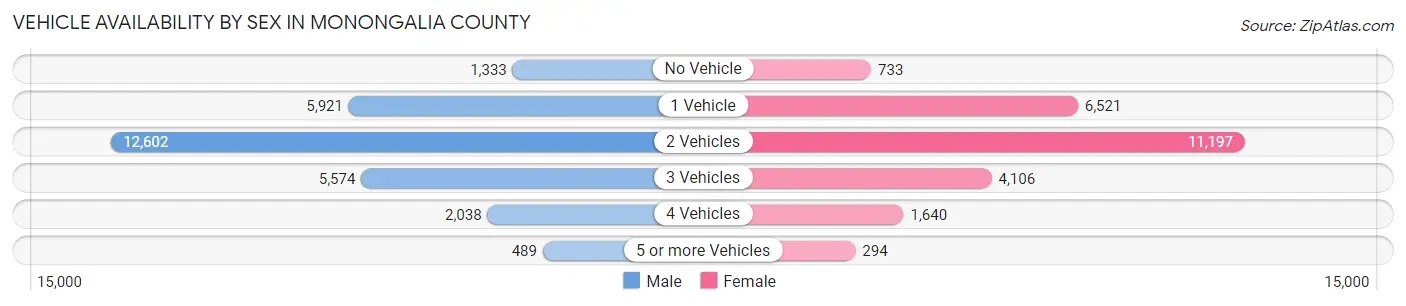
Vehicle Availability by Sex in Monongalia County
The most prevalent vehicle ownership categories in Monongalia County are males with 2 vehicles (12,602, accounting for 45.1%) and females with 2 vehicles (11,197, making up 51.5%).
| Vehicles Available | Male | Female |
| No Vehicle | 1,333 (4.8%) | 733 (3.0%) |
| 1 Vehicle | 5,921 (21.2%) | 6,521 (26.6%) |
| 2 Vehicles | 12,602 (45.1%) | 11,197 (45.7%) |
| 3 Vehicles | 5,574 (19.9%) | 4,106 (16.8%) |
| 4 Vehicles | 2,038 (7.3%) | 1,640 (6.7%) |
| 5 or more Vehicles | 489 (1.8%) | 294 (1.2%) |
| Total | 27,957 (100.0%) | 24,491 (100.0%) |
Commute Time in Monongalia County
The most frequently occuring commute durations in Monongalia County are 15 to 19 minutes (9,752 commuters, 20.5%), 10 to 14 minutes (8,726 commuters, 18.3%), and 20 to 24 minutes (7,360 commuters, 15.5%).
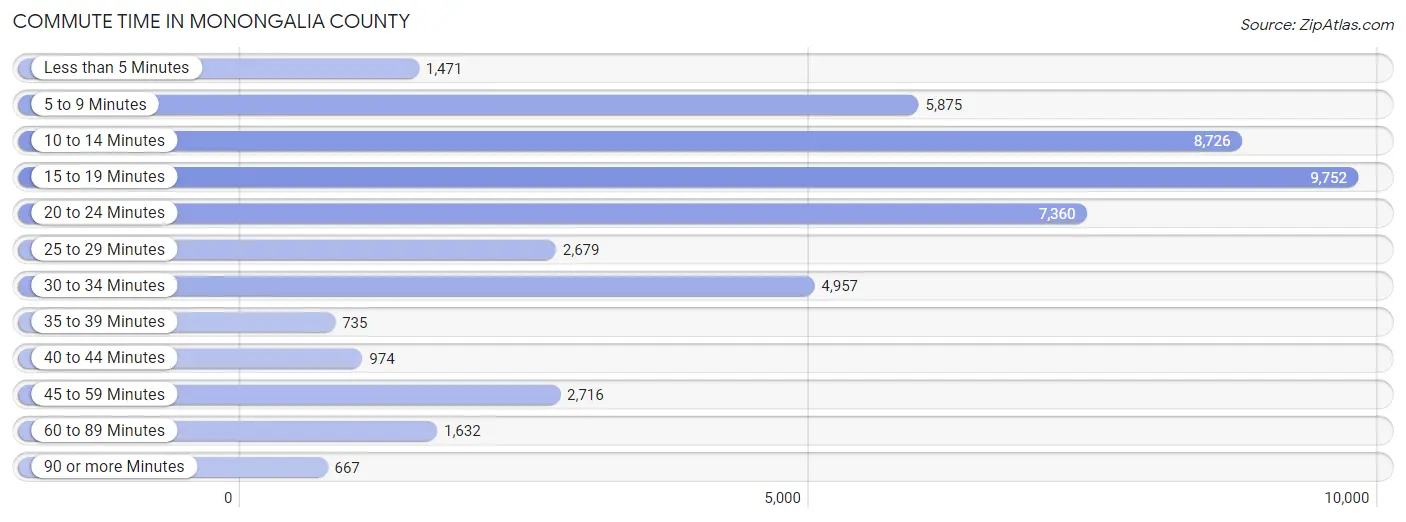
| Commute Time | # Commuters | % Commuters |
| Less than 5 Minutes | 1,471 | 3.1% |
| 5 to 9 Minutes | 5,875 | 12.4% |
| 10 to 14 Minutes | 8,726 | 18.3% |
| 15 to 19 Minutes | 9,752 | 20.5% |
| 20 to 24 Minutes | 7,360 | 15.5% |
| 25 to 29 Minutes | 2,679 | 5.6% |
| 30 to 34 Minutes | 4,957 | 10.4% |
| 35 to 39 Minutes | 735 | 1.5% |
| 40 to 44 Minutes | 974 | 2.1% |
| 45 to 59 Minutes | 2,716 | 5.7% |
| 60 to 89 Minutes | 1,632 | 3.4% |
| 90 or more Minutes | 667 | 1.4% |
Commute Time by Sex in Monongalia County
The most common commute times in Monongalia County are 15 to 19 minutes (4,689 commuters, 18.3%) for males and 15 to 19 minutes (5,063 commuters, 23.1%) for females.
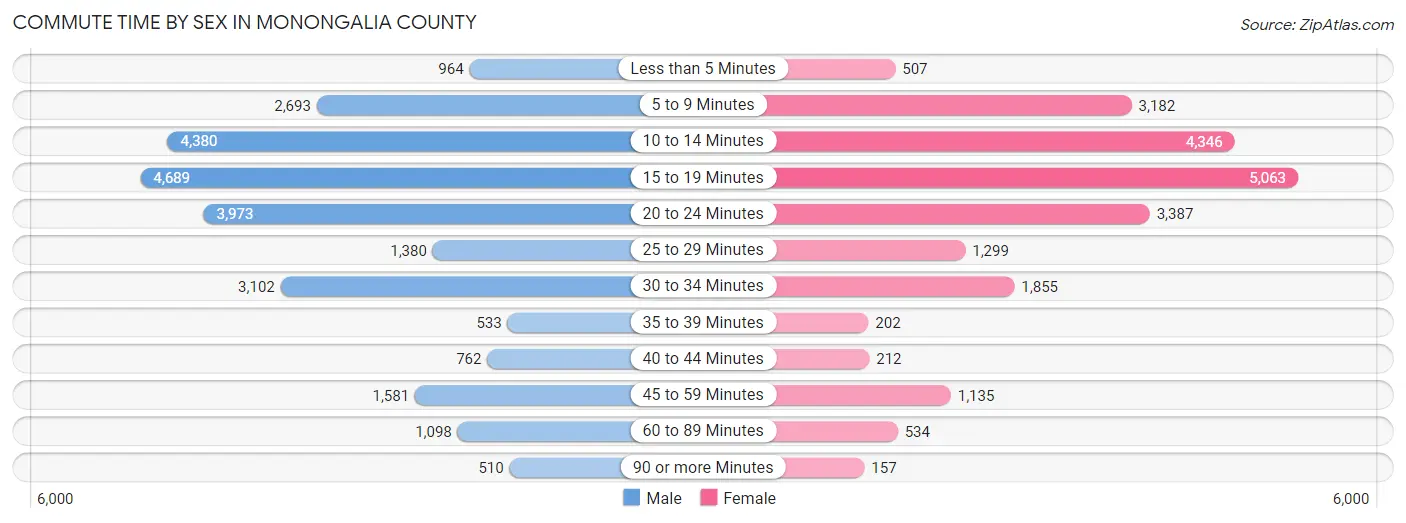
| Commute Time | Male | Female |
| Less than 5 Minutes | 964 (3.8%) | 507 (2.3%) |
| 5 to 9 Minutes | 2,693 (10.5%) | 3,182 (14.5%) |
| 10 to 14 Minutes | 4,380 (17.1%) | 4,346 (19.9%) |
| 15 to 19 Minutes | 4,689 (18.3%) | 5,063 (23.1%) |
| 20 to 24 Minutes | 3,973 (15.5%) | 3,387 (15.5%) |
| 25 to 29 Minutes | 1,380 (5.4%) | 1,299 (5.9%) |
| 30 to 34 Minutes | 3,102 (12.1%) | 1,855 (8.5%) |
| 35 to 39 Minutes | 533 (2.1%) | 202 (0.9%) |
| 40 to 44 Minutes | 762 (3.0%) | 212 (1.0%) |
| 45 to 59 Minutes | 1,581 (6.2%) | 1,135 (5.2%) |
| 60 to 89 Minutes | 1,098 (4.3%) | 534 (2.4%) |
| 90 or more Minutes | 510 (2.0%) | 157 (0.7%) |
Time of Departure to Work by Sex in Monongalia County
The most frequent times of departure to work in Monongalia County are 7:00 AM to 7:29 AM (3,200, 12.5%) for males and 8:00 AM to 8:29 AM (3,407, 15.6%) for females.
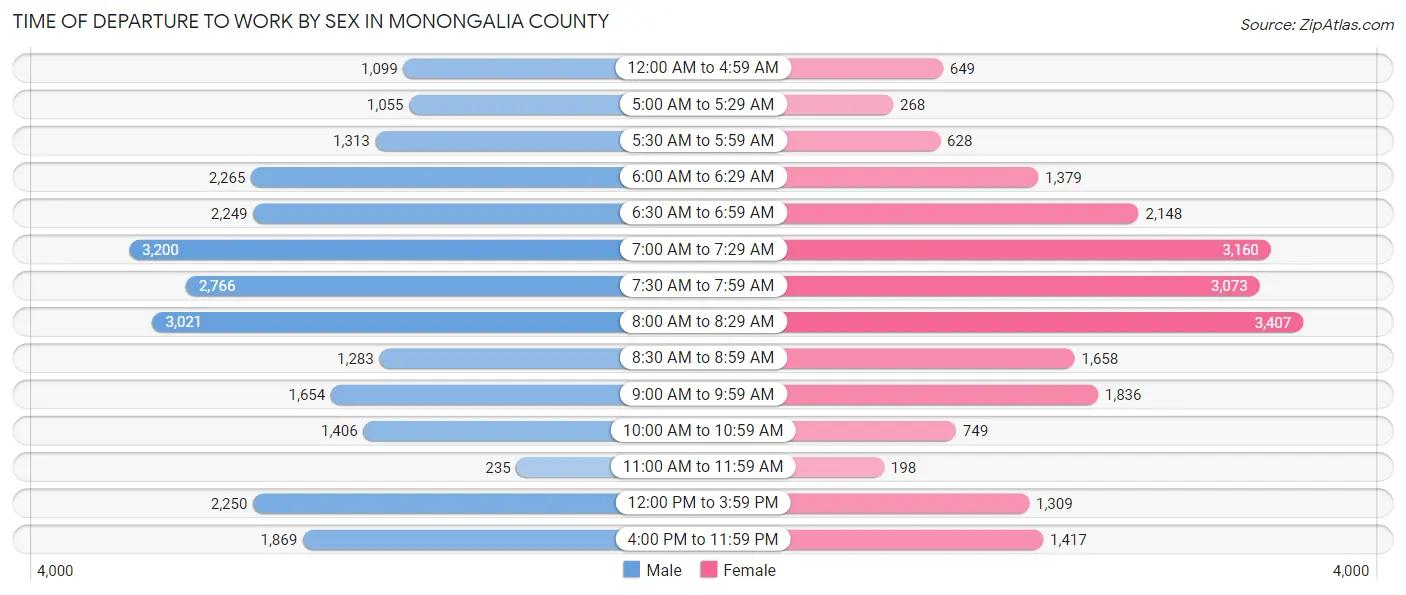
| Time of Departure | Male | Female |
| 12:00 AM to 4:59 AM | 1,099 (4.3%) | 649 (3.0%) |
| 5:00 AM to 5:29 AM | 1,055 (4.1%) | 268 (1.2%) |
| 5:30 AM to 5:59 AM | 1,313 (5.1%) | 628 (2.9%) |
| 6:00 AM to 6:29 AM | 2,265 (8.8%) | 1,379 (6.3%) |
| 6:30 AM to 6:59 AM | 2,249 (8.8%) | 2,148 (9.8%) |
| 7:00 AM to 7:29 AM | 3,200 (12.5%) | 3,160 (14.4%) |
| 7:30 AM to 7:59 AM | 2,766 (10.8%) | 3,073 (14.1%) |
| 8:00 AM to 8:29 AM | 3,021 (11.8%) | 3,407 (15.6%) |
| 8:30 AM to 8:59 AM | 1,283 (5.0%) | 1,658 (7.6%) |
| 9:00 AM to 9:59 AM | 1,654 (6.4%) | 1,836 (8.4%) |
| 10:00 AM to 10:59 AM | 1,406 (5.5%) | 749 (3.4%) |
| 11:00 AM to 11:59 AM | 235 (0.9%) | 198 (0.9%) |
| 12:00 PM to 3:59 PM | 2,250 (8.8%) | 1,309 (6.0%) |
| 4:00 PM to 11:59 PM | 1,869 (7.3%) | 1,417 (6.5%) |
| Total | 25,665 (100.0%) | 21,879 (100.0%) |
Housing Occupancy in Monongalia County
Occupancy by Ownership in Monongalia County
Of the total 44,206 dwellings in Monongalia County, owner-occupied units account for 25,199 (57.0%), while renter-occupied units make up 19,007 (43.0%).
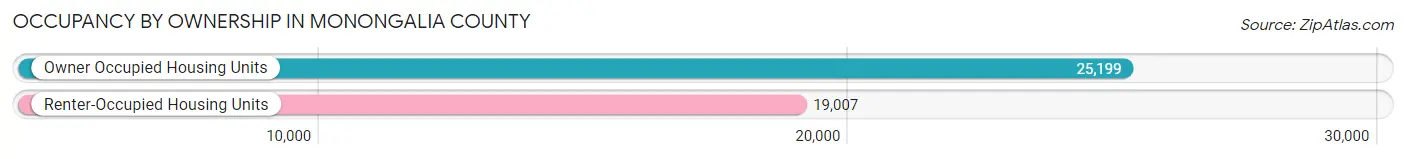
| Occupancy | # Housing Units | % Housing Units |
| Owner Occupied Housing Units | 25,199 | 57.0% |
| Renter-Occupied Housing Units | 19,007 | 43.0% |
| Total Occupied Housing Units | 44,206 | 100.0% |
Occupancy by Household Size in Monongalia County
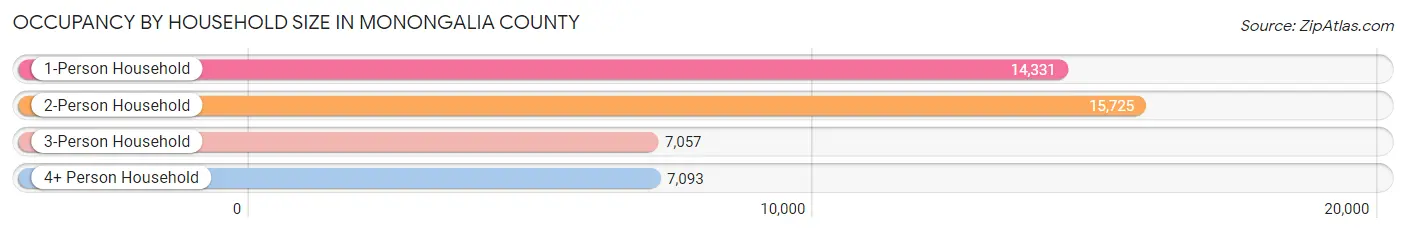
| Household Size | # Housing Units | % Housing Units |
| 1-Person Household | 14,331 | 32.4% |
| 2-Person Household | 15,725 | 35.6% |
| 3-Person Household | 7,057 | 16.0% |
| 4+ Person Household | 7,093 | 16.1% |
| Total Housing Units | 44,206 | 100.0% |
Occupancy by Ownership by Household Size in Monongalia County
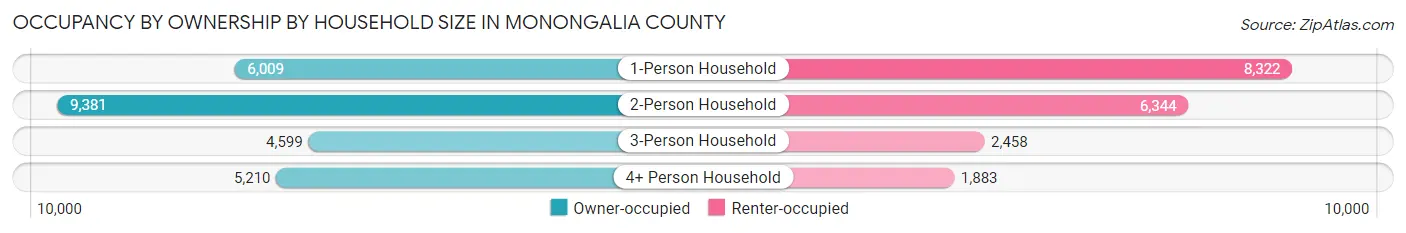
| Household Size | Owner-occupied | Renter-occupied |
| 1-Person Household | 6,009 (41.9%) | 8,322 (58.1%) |
| 2-Person Household | 9,381 (59.7%) | 6,344 (40.3%) |
| 3-Person Household | 4,599 (65.2%) | 2,458 (34.8%) |
| 4+ Person Household | 5,210 (73.5%) | 1,883 (26.6%) |
| Total Housing Units | 25,199 (57.0%) | 19,007 (43.0%) |
Occupancy by Educational Attainment in Monongalia County
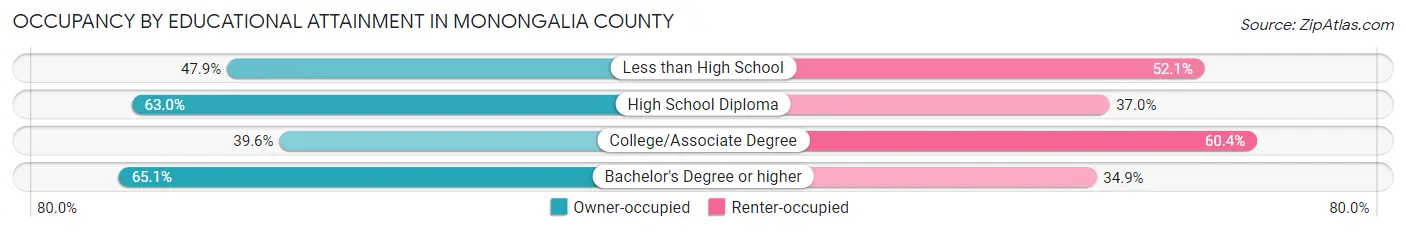
| Household Size | Owner-occupied | Renter-occupied |
| Less than High School | 853 (47.9%) | 928 (52.1%) |
| High School Diploma | 5,764 (63.0%) | 3,381 (37.0%) |
| College/Associate Degree | 4,776 (39.6%) | 7,287 (60.4%) |
| Bachelor's Degree or higher | 13,806 (65.1%) | 7,411 (34.9%) |
Occupancy by Age of Householder in Monongalia County
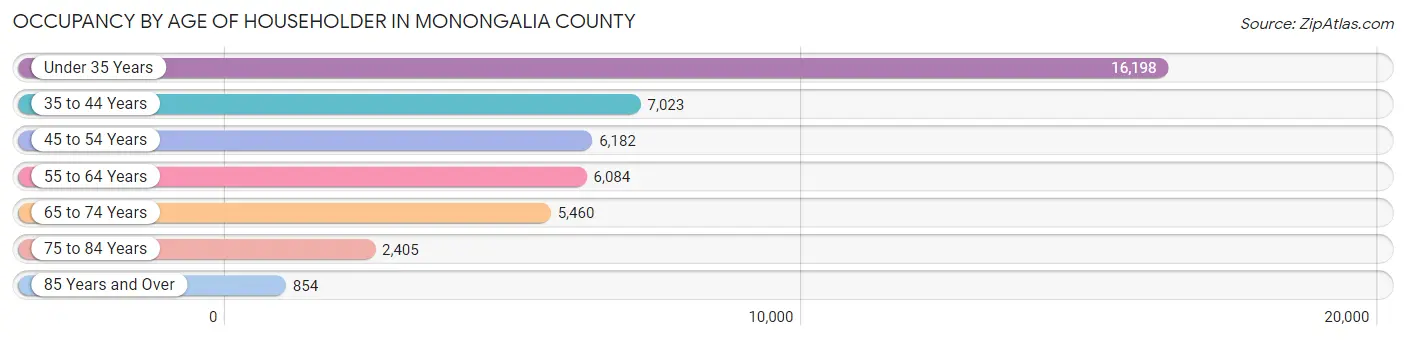
| Age Bracket | # Households | % Households |
| Under 35 Years | 16,198 | 36.6% |
| 35 to 44 Years | 7,023 | 15.9% |
| 45 to 54 Years | 6,182 | 14.0% |
| 55 to 64 Years | 6,084 | 13.8% |
| 65 to 74 Years | 5,460 | 12.3% |
| 75 to 84 Years | 2,405 | 5.4% |
| 85 Years and Over | 854 | 1.9% |
| Total | 44,206 | 100.0% |
Housing Finances in Monongalia County
Median Income by Occupancy in Monongalia County
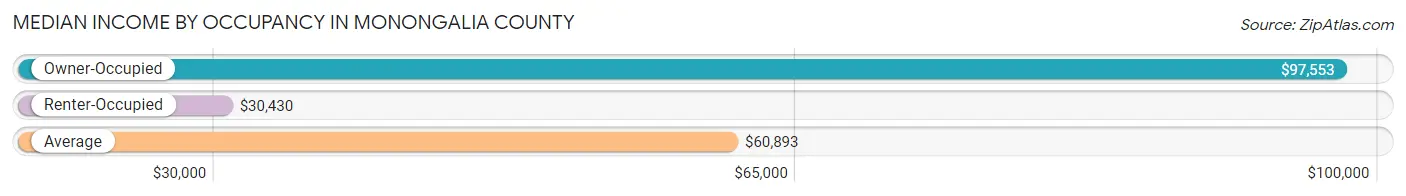
| Occupancy Type | # Households | Median Income |
| Owner-Occupied | 25,199 (57.0%) | $97,553 |
| Renter-Occupied | 19,007 (43.0%) | $30,430 |
| Average | 44,206 (100.0%) | $60,893 |
Occupancy by Householder Income Bracket in Monongalia County
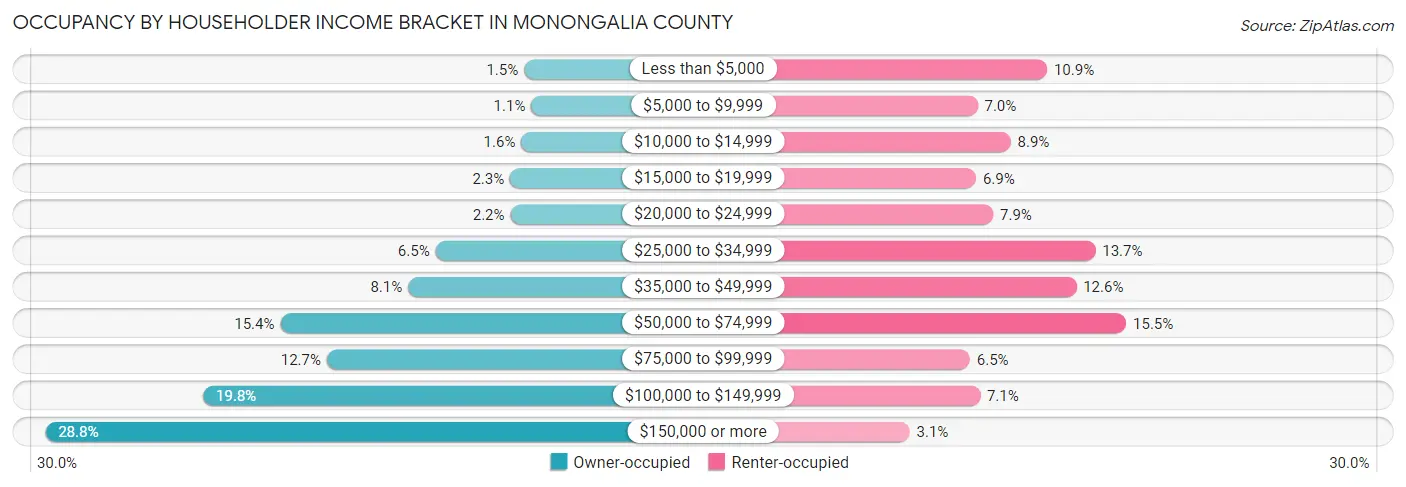
| Income Bracket | Owner-occupied | Renter-occupied |
| Less than $5,000 | 368 (1.5%) | 2,079 (10.9%) |
| $5,000 to $9,999 | 265 (1.1%) | 1,324 (7.0%) |
| $10,000 to $14,999 | 408 (1.6%) | 1,684 (8.9%) |
| $15,000 to $19,999 | 570 (2.3%) | 1,307 (6.9%) |
| $20,000 to $24,999 | 565 (2.2%) | 1,494 (7.9%) |
| $25,000 to $34,999 | 1,643 (6.5%) | 2,604 (13.7%) |
| $35,000 to $49,999 | 2,039 (8.1%) | 2,396 (12.6%) |
| $50,000 to $74,999 | 3,878 (15.4%) | 2,939 (15.5%) |
| $75,000 to $99,999 | 3,209 (12.7%) | 1,241 (6.5%) |
| $100,000 to $149,999 | 4,991 (19.8%) | 1,351 (7.1%) |
| $150,000 or more | 7,263 (28.8%) | 588 (3.1%) |
| Total | 25,199 (100.0%) | 19,007 (100.0%) |
Monthly Housing Cost Tiers in Monongalia County
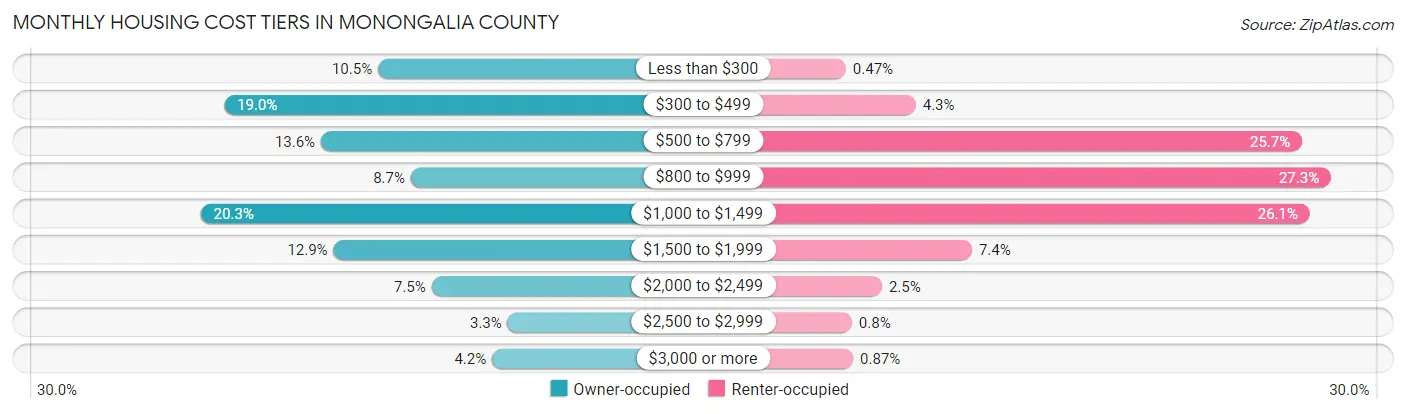
| Monthly Cost | Owner-occupied | Renter-occupied |
| Less than $300 | 2,641 (10.5%) | 89 (0.5%) |
| $300 to $499 | 4,782 (19.0%) | 823 (4.3%) |
| $500 to $799 | 3,435 (13.6%) | 4,877 (25.7%) |
| $800 to $999 | 2,184 (8.7%) | 5,181 (27.3%) |
| $1,000 to $1,499 | 5,111 (20.3%) | 4,959 (26.1%) |
| $1,500 to $1,999 | 3,261 (12.9%) | 1,413 (7.4%) |
| $2,000 to $2,499 | 1,894 (7.5%) | 467 (2.5%) |
| $2,500 to $2,999 | 837 (3.3%) | 153 (0.8%) |
| $3,000 or more | 1,054 (4.2%) | 166 (0.9%) |
| Total | 25,199 (100.0%) | 19,007 (100.0%) |
Physical Housing Characteristics in Monongalia County
Housing Structures in Monongalia County
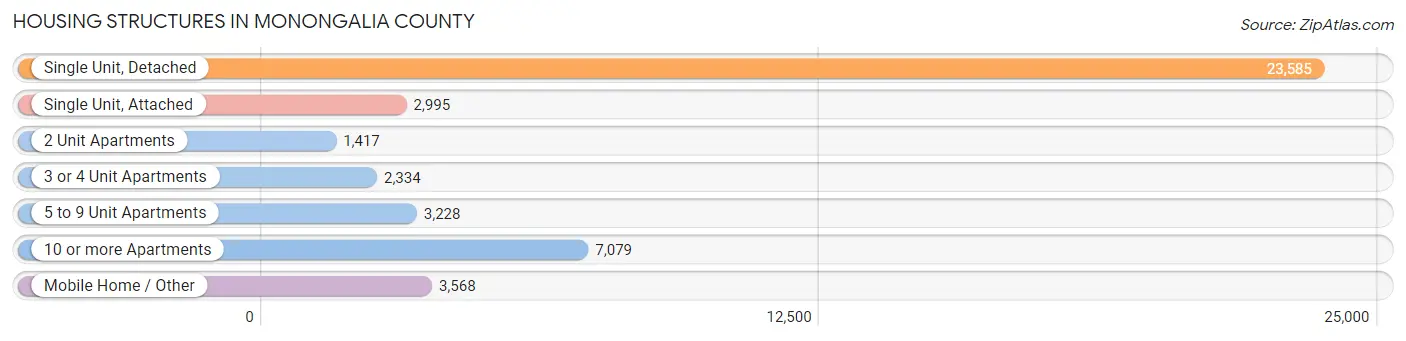
| Structure Type | # Housing Units | % Housing Units |
| Single Unit, Detached | 23,585 | 53.3% |
| Single Unit, Attached | 2,995 | 6.8% |
| 2 Unit Apartments | 1,417 | 3.2% |
| 3 or 4 Unit Apartments | 2,334 | 5.3% |
| 5 to 9 Unit Apartments | 3,228 | 7.3% |
| 10 or more Apartments | 7,079 | 16.0% |
| Mobile Home / Other | 3,568 | 8.1% |
| Total | 44,206 | 100.0% |
Housing Structures by Occupancy in Monongalia County
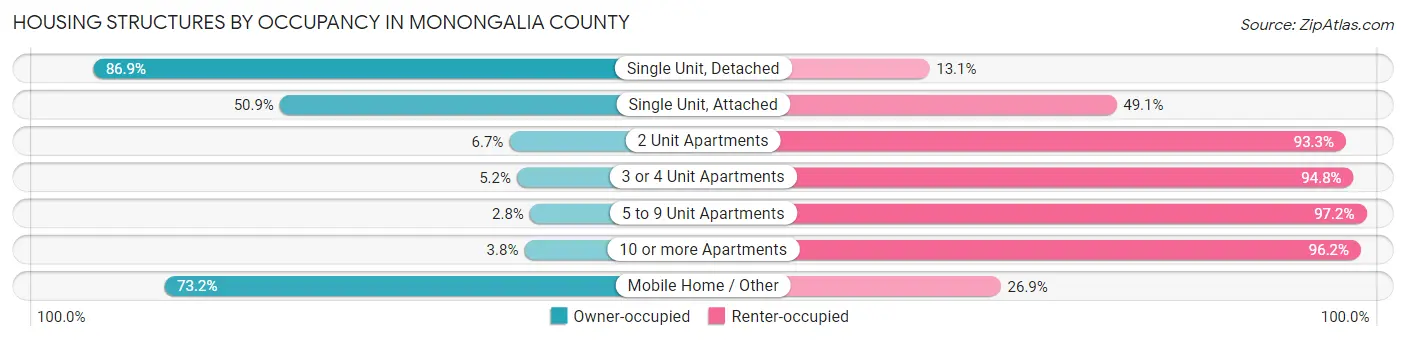
| Structure Type | Owner-occupied | Renter-occupied |
| Single Unit, Detached | 20,490 (86.9%) | 3,095 (13.1%) |
| Single Unit, Attached | 1,524 (50.9%) | 1,471 (49.1%) |
| 2 Unit Apartments | 95 (6.7%) | 1,322 (93.3%) |
| 3 or 4 Unit Apartments | 122 (5.2%) | 2,212 (94.8%) |
| 5 to 9 Unit Apartments | 89 (2.8%) | 3,139 (97.2%) |
| 10 or more Apartments | 269 (3.8%) | 6,810 (96.2%) |
| Mobile Home / Other | 2,610 (73.2%) | 958 (26.9%) |
| Total | 25,199 (57.0%) | 19,007 (43.0%) |
Housing Structures by Number of Rooms in Monongalia County
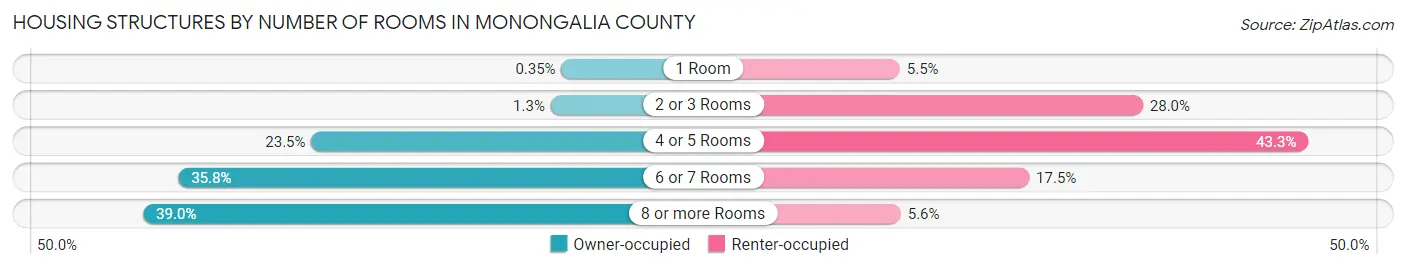
| Number of Rooms | Owner-occupied | Renter-occupied |
| 1 Room | 88 (0.4%) | 1,053 (5.5%) |
| 2 or 3 Rooms | 338 (1.3%) | 5,325 (28.0%) |
| 4 or 5 Rooms | 5,917 (23.5%) | 8,232 (43.3%) |
| 6 or 7 Rooms | 9,018 (35.8%) | 3,327 (17.5%) |
| 8 or more Rooms | 9,838 (39.0%) | 1,070 (5.6%) |
| Total | 25,199 (100.0%) | 19,007 (100.0%) |
Housing Structure by Heating Type in Monongalia County
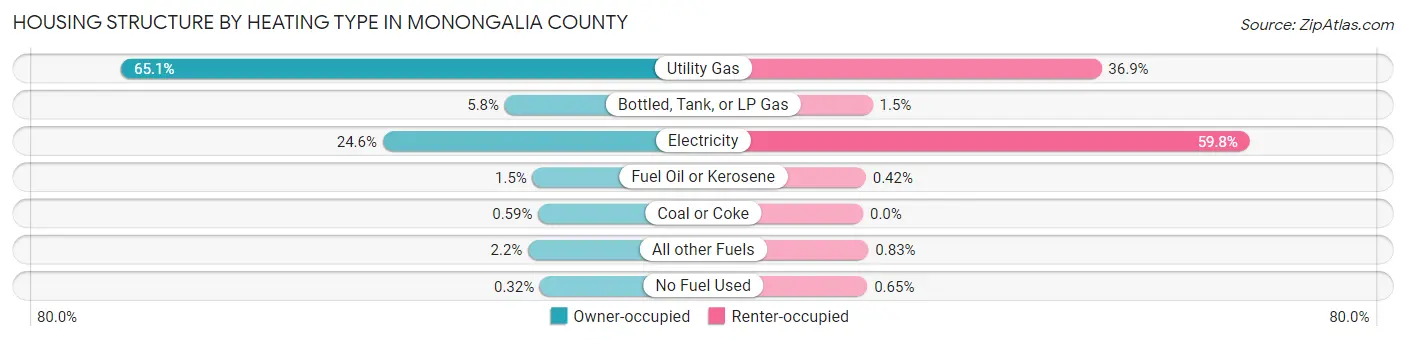
| Heating Type | Owner-occupied | Renter-occupied |
| Utility Gas | 16,403 (65.1%) | 7,005 (36.8%) |
| Bottled, Tank, or LP Gas | 1,452 (5.8%) | 282 (1.5%) |
| Electricity | 6,206 (24.6%) | 11,360 (59.8%) |
| Fuel Oil or Kerosene | 367 (1.5%) | 80 (0.4%) |
| Coal or Coke | 149 (0.6%) | 0 (0.0%) |
| All other Fuels | 542 (2.1%) | 157 (0.8%) |
| No Fuel Used | 80 (0.3%) | 123 (0.6%) |
| Total | 25,199 (100.0%) | 19,007 (100.0%) |
Household Vehicle Usage in Monongalia County
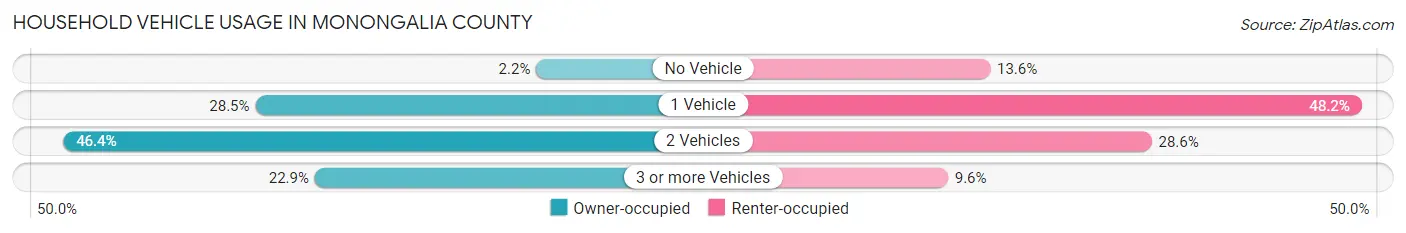
| Vehicles per Household | Owner-occupied | Renter-occupied |
| No Vehicle | 564 (2.2%) | 2,575 (13.6%) |
| 1 Vehicle | 7,172 (28.5%) | 9,168 (48.2%) |
| 2 Vehicles | 11,690 (46.4%) | 5,440 (28.6%) |
| 3 or more Vehicles | 5,773 (22.9%) | 1,824 (9.6%) |
| Total | 25,199 (100.0%) | 19,007 (100.0%) |
Real Estate & Mortgages in Monongalia County
Real Estate and Mortgage Overview in Monongalia County
| Characteristic | Without Mortgage | With Mortgage |
| Housing Units | 10,673 | 14,526 |
| Median Property Value | $213,900 | $264,500 |
| Median Household Income | $63,599 | $5,394 |
| Monthly Housing Costs | $401 | $1,046 |
| Real Estate Taxes | $955 | $287 |
Property Value by Mortgage Status in Monongalia County
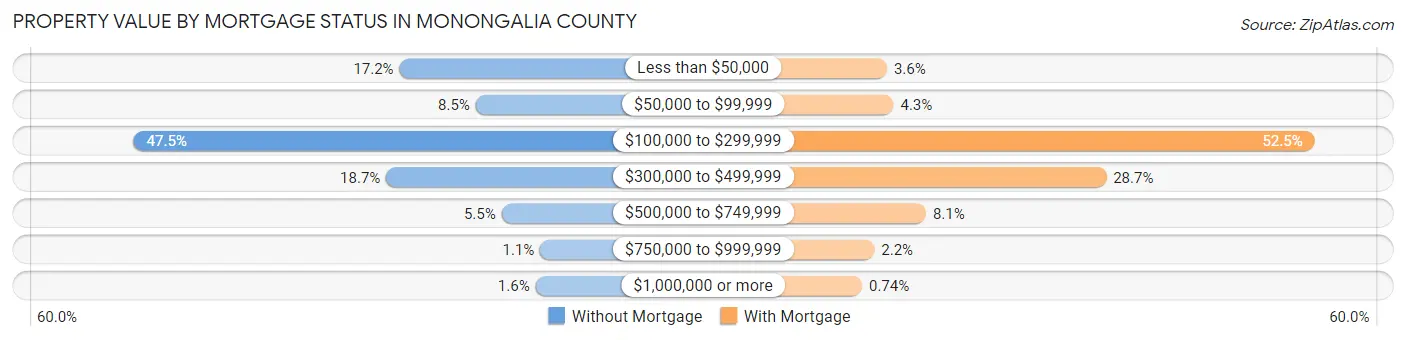
| Property Value | Without Mortgage | With Mortgage |
| Less than $50,000 | 1,831 (17.2%) | 522 (3.6%) |
| $50,000 to $99,999 | 902 (8.5%) | 631 (4.3%) |
| $100,000 to $299,999 | 5,073 (47.5%) | 7,621 (52.5%) |
| $300,000 to $499,999 | 1,994 (18.7%) | 4,162 (28.6%) |
| $500,000 to $749,999 | 586 (5.5%) | 1,169 (8.1%) |
| $750,000 to $999,999 | 115 (1.1%) | 313 (2.1%) |
| $1,000,000 or more | 172 (1.6%) | 108 (0.7%) |
| Total | 10,673 (100.0%) | 14,526 (100.0%) |
Household Income by Mortgage Status in Monongalia County
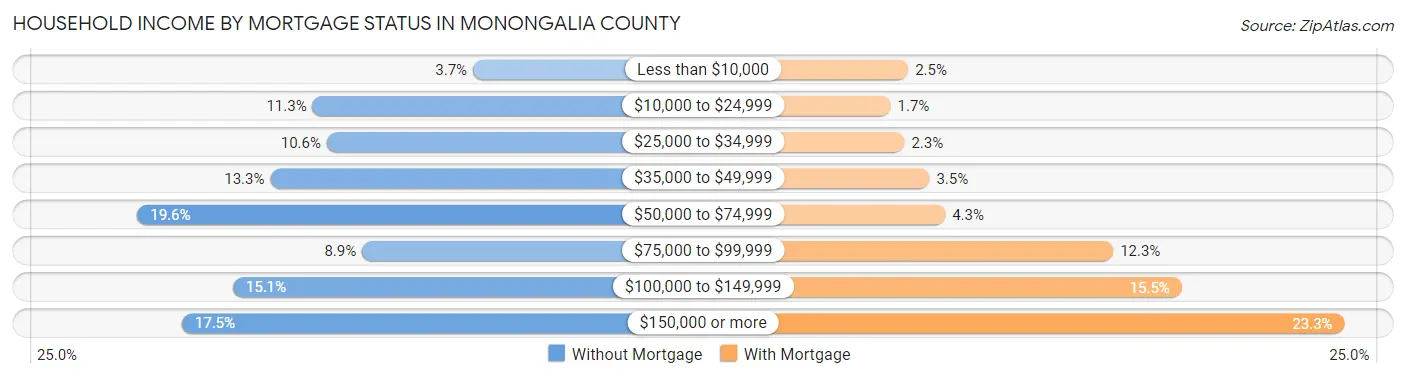
| Household Income | Without Mortgage | With Mortgage |
| Less than $10,000 | 390 (3.6%) | 364 (2.5%) |
| $10,000 to $24,999 | 1,205 (11.3%) | 243 (1.7%) |
| $25,000 to $34,999 | 1,132 (10.6%) | 338 (2.3%) |
| $35,000 to $49,999 | 1,419 (13.3%) | 511 (3.5%) |
| $50,000 to $74,999 | 2,095 (19.6%) | 620 (4.3%) |
| $75,000 to $99,999 | 953 (8.9%) | 1,783 (12.3%) |
| $100,000 to $149,999 | 1,610 (15.1%) | 2,256 (15.5%) |
| $150,000 or more | 1,869 (17.5%) | 3,381 (23.3%) |
| Total | 10,673 (100.0%) | 14,526 (100.0%) |
Property Value to Household Income Ratio in Monongalia County
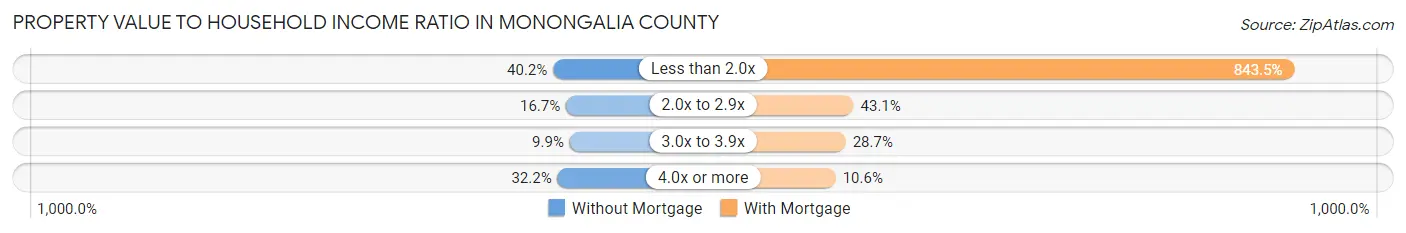
| Value-to-Income Ratio | Without Mortgage | With Mortgage |
| Less than 2.0x | 4,293 (40.2%) | 122,530 (843.5%) |
| 2.0x to 2.9x | 1,787 (16.7%) | 6,254 (43.0%) |
| 3.0x to 3.9x | 1,061 (9.9%) | 4,169 (28.7%) |
| 4.0x or more | 3,440 (32.2%) | 1,533 (10.5%) |
| Total | 10,673 (100.0%) | 14,526 (100.0%) |
Real Estate Taxes by Mortgage Status in Monongalia County
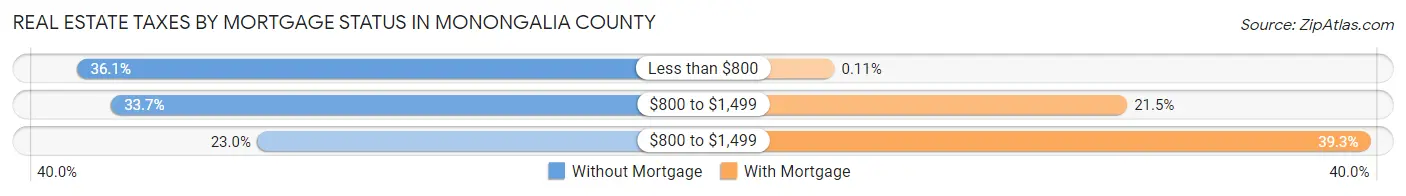
| Property Taxes | Without Mortgage | With Mortgage |
| Less than $800 | 3,856 (36.1%) | 16 (0.1%) |
| $800 to $1,499 | 3,594 (33.7%) | 3,121 (21.5%) |
| $800 to $1,499 | 2,459 (23.0%) | 5,702 (39.3%) |
| Total | 10,673 (100.0%) | 14,526 (100.0%) |
Health & Disability in Monongalia County
Health Insurance Coverage by Age in Monongalia County
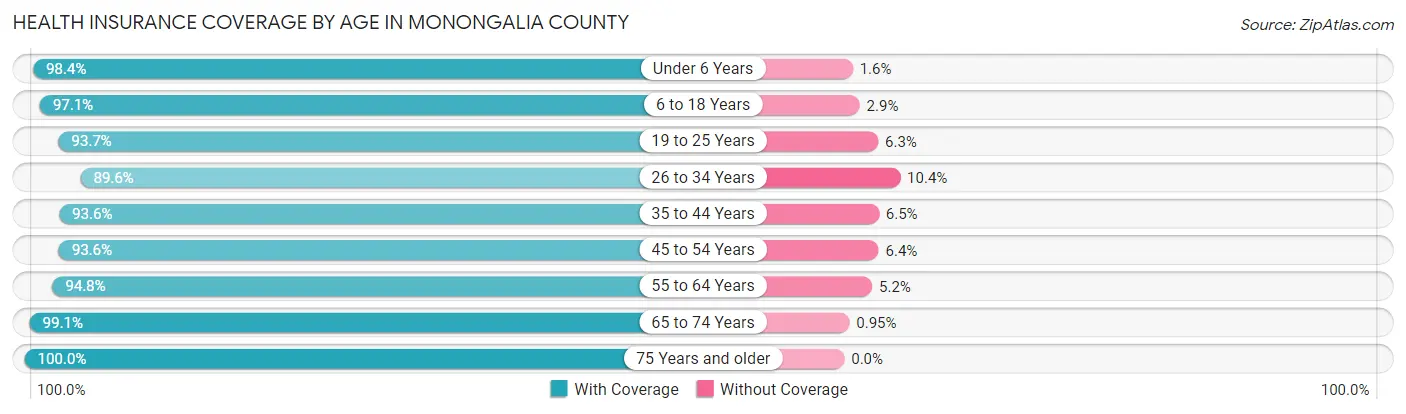
| Age Bracket | With Coverage | Without Coverage |
| Under 6 Years | 5,531 (98.4%) | 88 (1.6%) |
| 6 to 18 Years | 14,276 (97.1%) | 420 (2.9%) |
| 19 to 25 Years | 20,845 (93.7%) | 1,405 (6.3%) |
| 26 to 34 Years | 13,066 (89.6%) | 1,520 (10.4%) |
| 35 to 44 Years | 12,147 (93.5%) | 837 (6.5%) |
| 45 to 54 Years | 9,807 (93.6%) | 670 (6.4%) |
| 55 to 64 Years | 10,247 (94.8%) | 560 (5.2%) |
| 65 to 74 Years | 8,341 (99.1%) | 80 (0.9%) |
| 75 Years and older | 4,900 (100.0%) | 0 (0.0%) |
| Total | 99,160 (94.7%) | 5,580 (5.3%) |
Health Insurance Coverage by Citizenship Status in Monongalia County
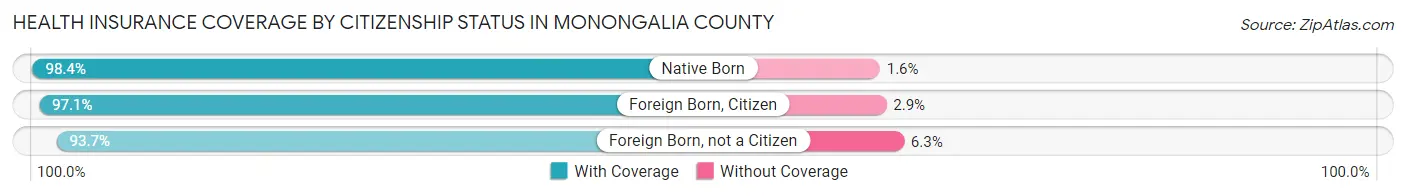
| Citizenship Status | With Coverage | Without Coverage |
| Native Born | 5,531 (98.4%) | 88 (1.6%) |
| Foreign Born, Citizen | 14,276 (97.1%) | 420 (2.9%) |
| Foreign Born, not a Citizen | 20,845 (93.7%) | 1,405 (6.3%) |
Health Insurance Coverage by Household Income in Monongalia County
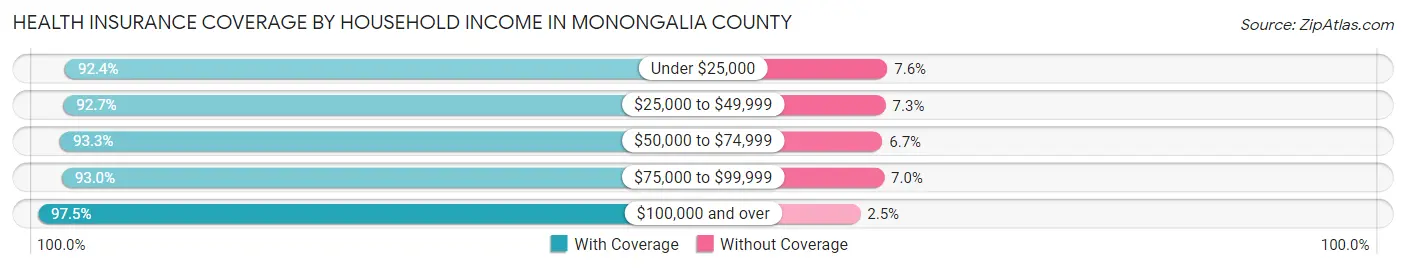
| Household Income | With Coverage | Without Coverage |
| Under $25,000 | 16,493 (92.4%) | 1,354 (7.6%) |
| $25,000 to $49,999 | 14,615 (92.7%) | 1,147 (7.3%) |
| $50,000 to $74,999 | 13,404 (93.3%) | 957 (6.7%) |
| $75,000 to $99,999 | 10,025 (93.0%) | 753 (7.0%) |
| $100,000 and over | 39,859 (97.5%) | 1,040 (2.5%) |
Public vs Private Health Insurance Coverage by Age in Monongalia County
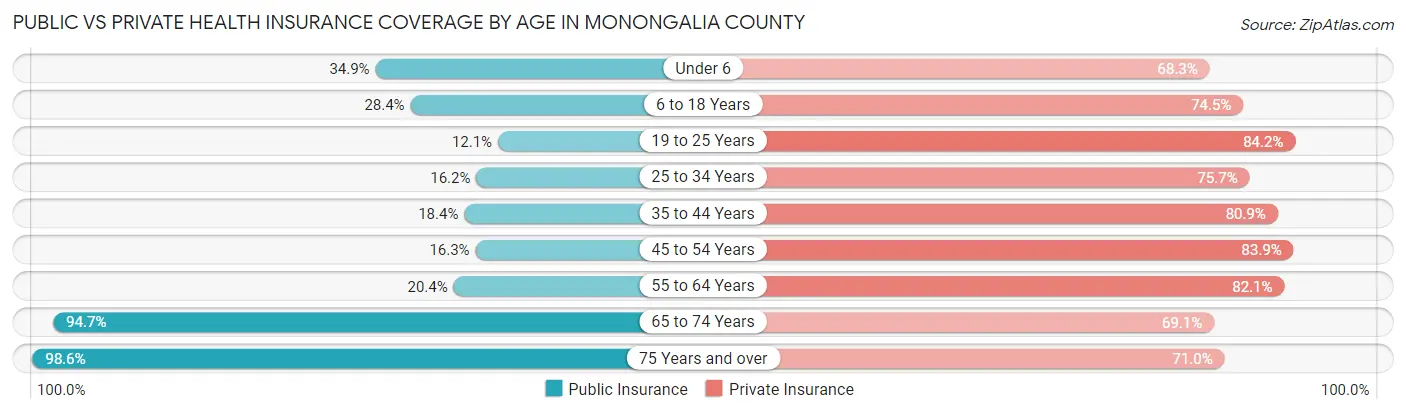
| Age Bracket | Public Insurance | Private Insurance |
| Under 6 | 1,960 (34.9%) | 3,836 (68.3%) |
| 6 to 18 Years | 4,170 (28.4%) | 10,948 (74.5%) |
| 19 to 25 Years | 2,702 (12.1%) | 18,725 (84.2%) |
| 25 to 34 Years | 2,357 (16.2%) | 11,037 (75.7%) |
| 35 to 44 Years | 2,389 (18.4%) | 10,504 (80.9%) |
| 45 to 54 Years | 1,710 (16.3%) | 8,787 (83.9%) |
| 55 to 64 Years | 2,203 (20.4%) | 8,877 (82.1%) |
| 65 to 74 Years | 7,974 (94.7%) | 5,817 (69.1%) |
| 75 Years and over | 4,830 (98.6%) | 3,481 (71.0%) |
| Total | 30,295 (28.9%) | 82,012 (78.3%) |
Disability Status by Sex by Age in Monongalia County
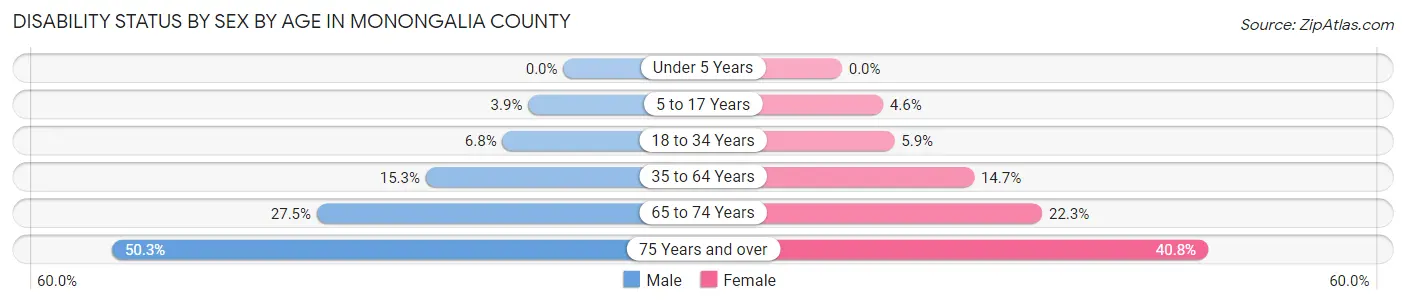
| Age Bracket | Male | Female |
| Under 5 Years | 0 (0.0%) | 0 (0.0%) |
| 5 to 17 Years | 246 (3.9%) | 266 (4.6%) |
| 18 to 34 Years | 1,448 (6.8%) | 1,105 (5.9%) |
| 35 to 64 Years | 2,669 (15.3%) | 2,479 (14.7%) |
| 65 to 74 Years | 1,141 (27.5%) | 951 (22.3%) |
| 75 Years and over | 1,033 (50.3%) | 1,160 (40.8%) |
Disability Class by Sex by Age in Monongalia County
Disability Class: Hearing Difficulty
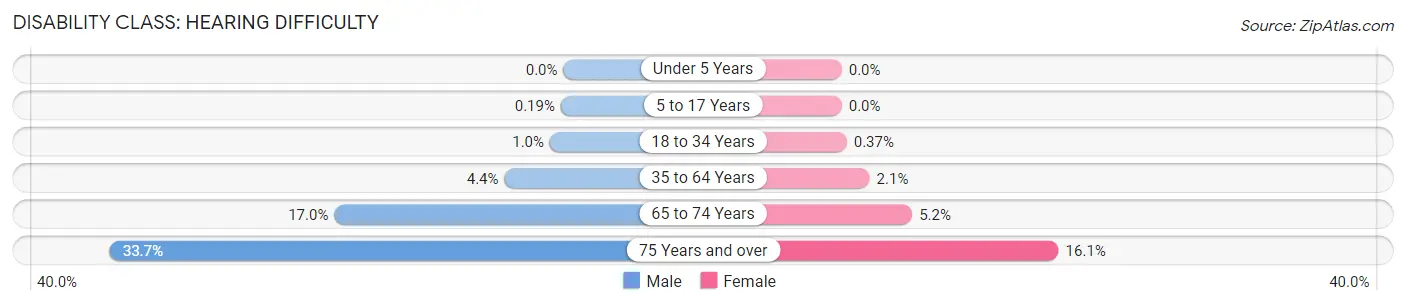
| Age Bracket | Male | Female |
| Under 5 Years | 0 (0.0%) | 0 (0.0%) |
| 5 to 17 Years | 12 (0.2%) | 0 (0.0%) |
| 18 to 34 Years | 213 (1.0%) | 69 (0.4%) |
| 35 to 64 Years | 764 (4.4%) | 348 (2.1%) |
| 65 to 74 Years | 707 (17.0%) | 223 (5.2%) |
| 75 Years and over | 692 (33.7%) | 458 (16.1%) |
Disability Class: Vision Difficulty
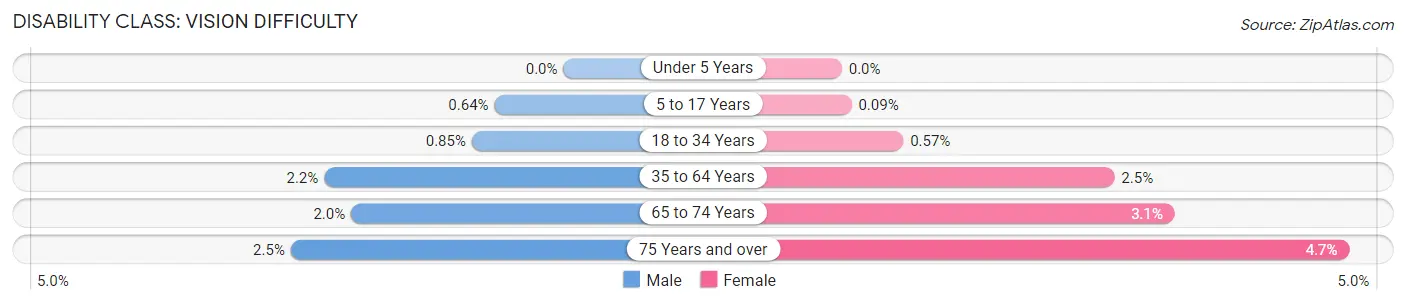
| Age Bracket | Male | Female |
| Under 5 Years | 0 (0.0%) | 0 (0.0%) |
| 5 to 17 Years | 40 (0.6%) | 5 (0.1%) |
| 18 to 34 Years | 181 (0.9%) | 107 (0.6%) |
| 35 to 64 Years | 387 (2.2%) | 426 (2.5%) |
| 65 to 74 Years | 82 (2.0%) | 132 (3.1%) |
| 75 Years and over | 52 (2.5%) | 134 (4.7%) |
Disability Class: Cognitive Difficulty
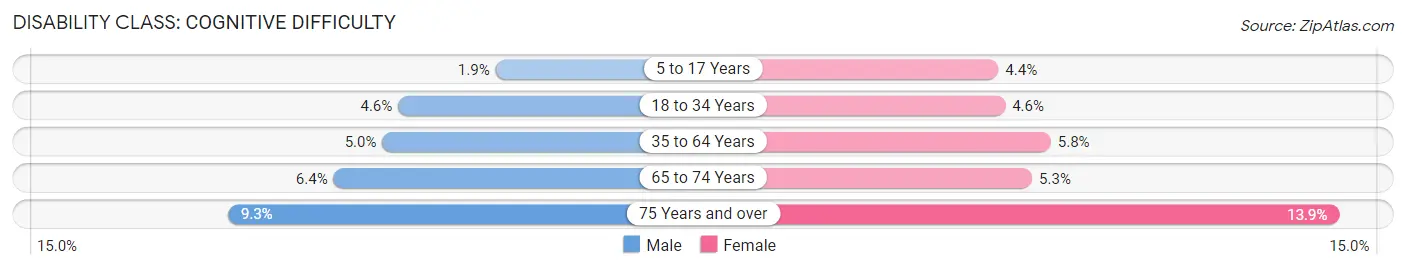
| Age Bracket | Male | Female |
| 5 to 17 Years | 119 (1.9%) | 253 (4.4%) |
| 18 to 34 Years | 983 (4.6%) | 859 (4.5%) |
| 35 to 64 Years | 879 (5.0%) | 980 (5.8%) |
| 65 to 74 Years | 266 (6.4%) | 226 (5.3%) |
| 75 Years and over | 192 (9.3%) | 394 (13.9%) |
Disability Class: Ambulatory Difficulty
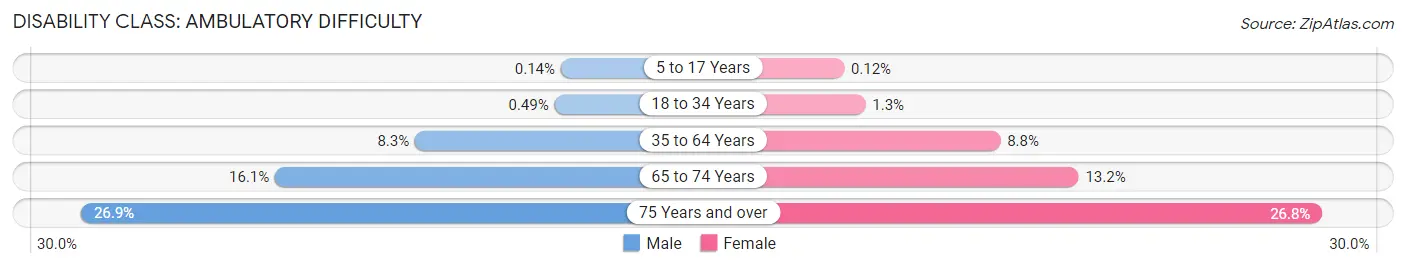
| Age Bracket | Male | Female |
| 5 to 17 Years | 9 (0.1%) | 7 (0.1%) |
| 18 to 34 Years | 104 (0.5%) | 248 (1.3%) |
| 35 to 64 Years | 1,440 (8.3%) | 1,486 (8.8%) |
| 65 to 74 Years | 667 (16.1%) | 562 (13.2%) |
| 75 Years and over | 552 (26.9%) | 761 (26.8%) |
Disability Class: Self-Care Difficulty
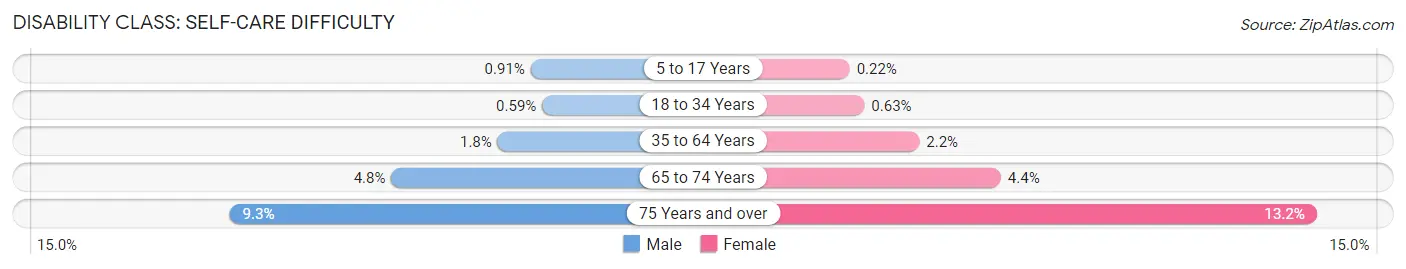
| Age Bracket | Male | Female |
| 5 to 17 Years | 57 (0.9%) | 13 (0.2%) |
| 18 to 34 Years | 126 (0.6%) | 119 (0.6%) |
| 35 to 64 Years | 319 (1.8%) | 363 (2.2%) |
| 65 to 74 Years | 199 (4.8%) | 189 (4.4%) |
| 75 Years and over | 191 (9.3%) | 376 (13.2%) |
Technology Access in Monongalia County
Computing Device Access in Monongalia County
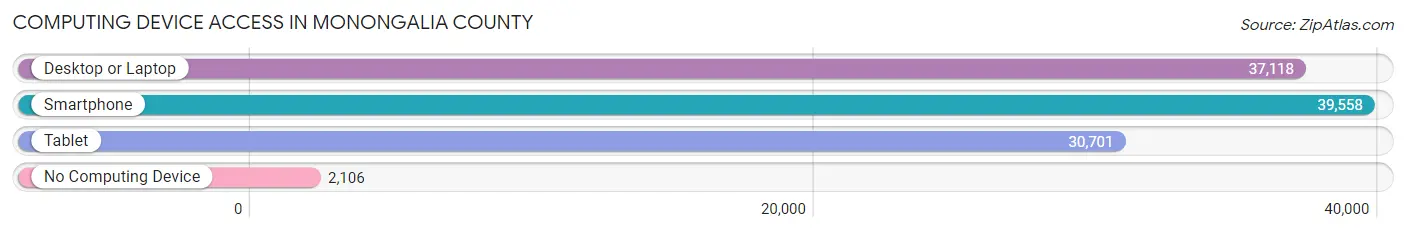
| Device Type | # Households | % Households |
| Desktop or Laptop | 37,118 | 84.0% |
| Smartphone | 39,558 | 89.5% |
| Tablet | 30,701 | 69.5% |
| No Computing Device | 2,106 | 4.8% |
| Total | 44,206 | 100.0% |
Internet Access in Monongalia County
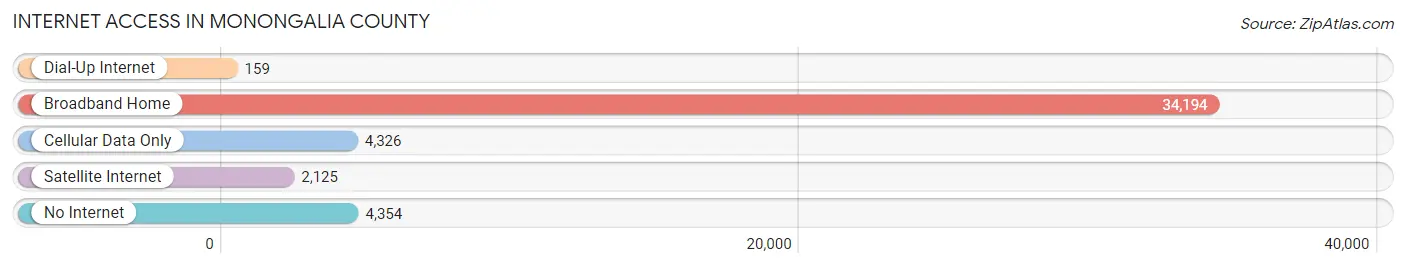
| Internet Type | # Households | % Households |
| Dial-Up Internet | 159 | 0.4% |
| Broadband Home | 34,194 | 77.3% |
| Cellular Data Only | 4,326 | 9.8% |
| Satellite Internet | 2,125 | 4.8% |
| No Internet | 4,354 | 9.9% |
| Total | 44,206 | 100.0% |
Monongalia County Summary
Monongalia County, West Virginia is located in the north-central part of the state and is part of the Morgantown Metropolitan Statistical Area. The county was created in 1776 and is named after the Monongahela River, which forms its western border. As of the 2010 census, the population was 96,189, making it the third most populous county in the state.
Geography
Monongalia County is located in the Appalachian Mountains of West Virginia and is bordered by Preston County to the north, Marion County to the east, Taylor County to the south, and the Monongahela River to the west. The county has a total area of 518 square miles, of which 517 square miles is land and 1 square mile is water. The highest point in the county is Cheat Mountain, which has an elevation of 4,848 feet.
The county is home to several state parks, including Coopers Rock State Forest, Blackwater Falls State Park, and Monongahela National Forest. The county also contains several rivers, including the Monongahela, Cheat, and Tygart Valley Rivers.
Economy
Monongalia County is home to several major employers, including Mylan Pharmaceuticals, West Virginia University, and Mon Health System. The county is also home to several large coal mines, including the Blacksville No. 2 Mine, the Blacksville No. 1 Mine, and the Loveridge Mine.
The county has a diverse economy, with a mix of manufacturing, retail, and service industries. The county is also home to several large shopping centers, including the Morgantown Mall and the University Town Centre.
Demographics
As of the 2010 census, there were 96,189 people, 37,945 households, and 22,945 families living in the county. The population density was 186.3 people per square mile. The racial makeup of the county was 92.2% White, 4.2% African American, 0.3% Native American, 1.7% Asian, 0.1% Pacific Islander, 0.5% from other races, and 1.1% from two or more races. Hispanic or Latino of any race were 1.7% of the population.
The median income for a household in the county was $41,945, and the median income for a family was $54,945. The per capita income for the county was $21,945. About 11.2% of families and 17.2% of the population were below the poverty line, including 22.2% of those under age 18 and 8.2% of those age 65 or over.
Conclusion
Monongalia County, West Virginia is a diverse county located in the Appalachian Mountains of the state. The county is home to several major employers, including Mylan Pharmaceuticals, West Virginia University, and Mon Health System. The county has a diverse economy, with a mix of manufacturing, retail, and service industries. As of the 2010 census, the population was 96,189, with a median household income of $41,945. The county is home to several state parks, rivers, and shopping centers, making it an attractive place to live and work.
Common Questions
What is the Total Population of Monongalia County?
Total Population of Monongalia County is 105,988.
What is the Total Male Population of Monongalia County?
Total Male Population of Monongalia County is 54,753.
What is the Total Female Population of Monongalia County?
Total Female Population of Monongalia County is 51,235.
What is the Ratio of Males per 100 Females in Monongalia County?
There are 106.87 Males per 100 Females in Monongalia County.
What is the Ratio of Females per 100 Males in Monongalia County?
There are 93.57 Females per 100 Males in Monongalia County.
What is the Median Population Age in Monongalia County?
Median Population Age in Monongalia County is 32.2 Years.
What is the Average Family Size in Monongalia County
Average Family Size in Monongalia County is 2.9 People.
What is the Average Household Size in Monongalia County
Average Household Size in Monongalia County is 2.3 People.
What is Per Capita Income in Monongalia County?
Per Capita income in Monongalia County is $38,757.
What is the Median Family Income in Monongalia County?
Median Family Income in Monongalia County is $99,540.
What is the Median Household income in Monongalia County?
Median Household Income in Monongalia County is $60,893.
What is Income or Wage Gap in Monongalia County?
Income or Wage Gap in Monongalia County is 23.1%.
Women in Monongalia County earn 76.9 cents for every dollar earned by a man.
What is Family Income Deficit in Monongalia County?
Family Income Deficit in Monongalia County is $11,118.
Families that are below poverty line in Monongalia County earn $11,118 less on average than the poverty threshold level.
What is Inequality or Gini Index in Monongalia County?
Inequality or Gini Index in Monongalia County is 0.51.
How Large is the Labor Force in Monongalia County?
There are 57,835 People in the Labor Forcein in Monongalia County.
What is the Percentage of People in the Labor Force in Monongalia County?
63.5% of People are in the Labor Force in Monongalia County.
What is the Unemployment Rate in Monongalia County?
Unemployment Rate in Monongalia County is 5.7%.