Mingo County, WV
Mingo County Overview
23,466
TOTAL POPULATION
11,577
MALE POPULATION
11,889
FEMALE POPULATION
97.38
MALES / 100 FEMALES
102.69
FEMALES / 100 MALES
44.3
MEDIAN AGE
3.1
AVG FAMILY SIZE
2.6
AVG HOUSEHOLD SIZE
$21,342
PER CAPITA INCOME
$51,270
AVG FAMILY INCOME
$38,305
AVG HOUSEHOLD INCOME
27.9%
WAGE / INCOME GAP [ % ]
72.1¢/ $1
WAGE / INCOME GAP [ $ ]
$11,124
FAMILY INCOME DEFICIT
0.50
INEQUALITY / GINI INDEX
7,164
LABOR FORCE [ PEOPLE ]
37.6%
PERCENT IN LABOR FORCE
11.2%
UNEMPLOYMENT RATE
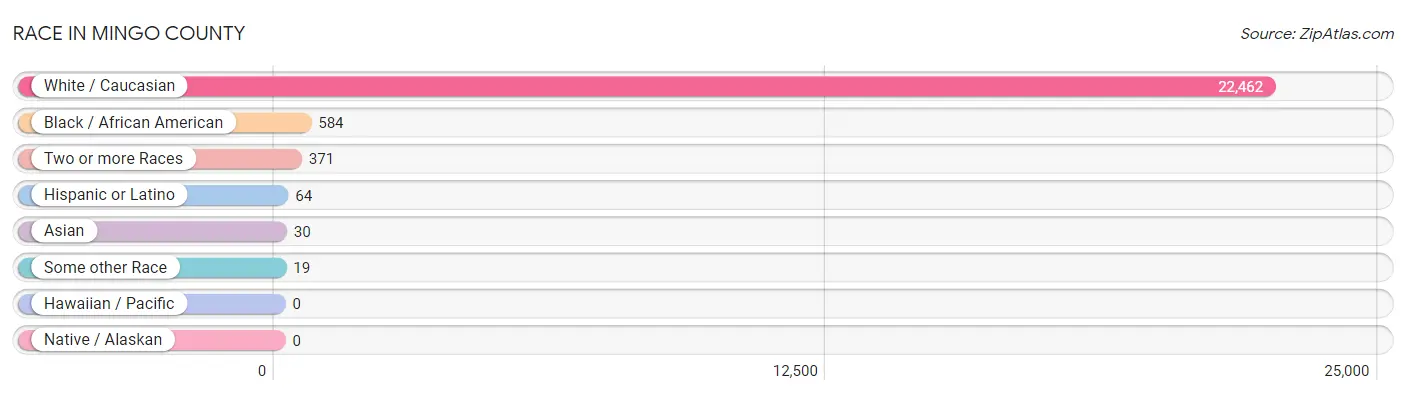
Race in Mingo County
The most populous races in Mingo County are White / Caucasian (22,462 | 95.7%), Black / African American (584 | 2.5%), and Two or more Races (371 | 1.6%).
| Race | # Population | % Population |
| Asian | 30 | 0.1% |
| Black / African American | 584 | 2.5% |
| Hawaiian / Pacific | 0 | 0.0% |
| Hispanic or Latino | 64 | 0.3% |
| Native / Alaskan | 0 | 0.0% |
| White / Caucasian | 22,462 | 95.7% |
| Two or more Races | 371 | 1.6% |
| Some other Race | 19 | 0.1% |
| Total | 23,466 | 100.0% |
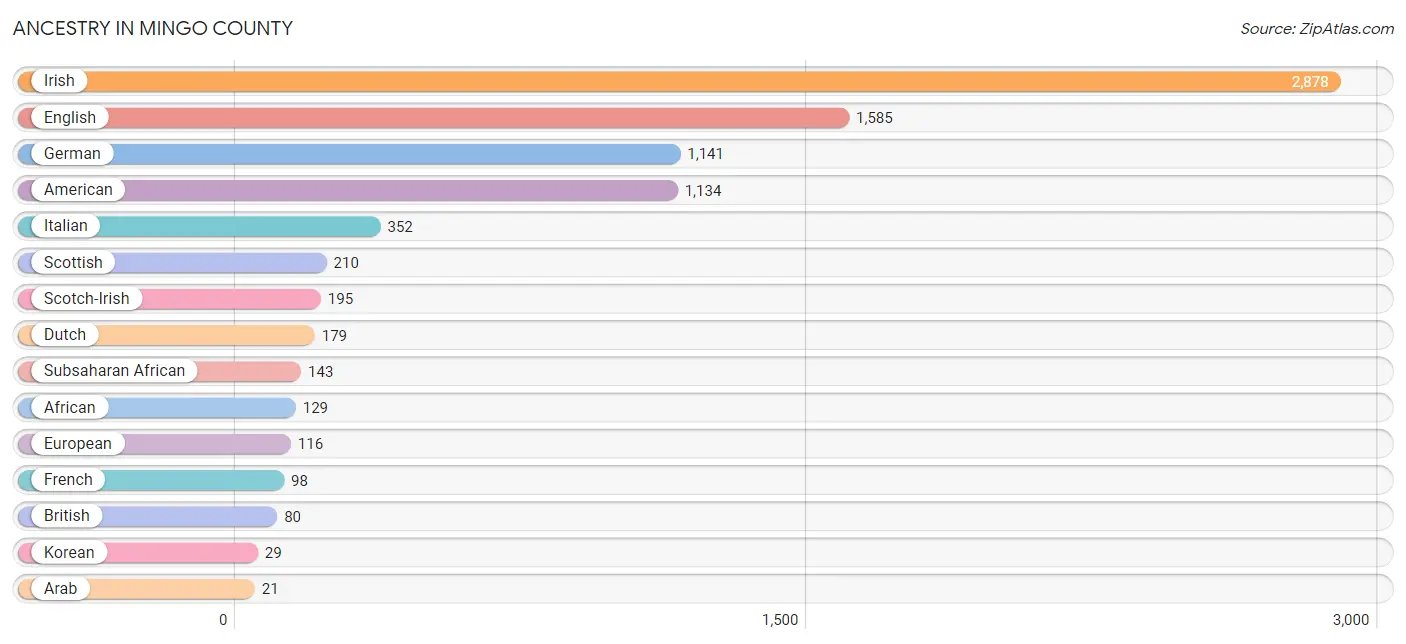
Ancestry in Mingo County
The most populous ancestries reported in Mingo County are Irish (2,878 | 12.3%), English (1,585 | 6.8%), German (1,141 | 4.9%), American (1,134 | 4.8%), and Italian (352 | 1.5%), together accounting for 30.2% of all Mingo County residents.
| Ancestry | # Population | % Population |
| African | 129 | 0.5% |
| American | 1,134 | 4.8% |
| Arab | 21 | 0.1% |
| British | 80 | 0.3% |
| Cherokee | 19 | 0.1% |
| Danish | 3 | 0.0% |
| Dutch | 179 | 0.8% |
| English | 1,585 | 6.8% |
| European | 116 | 0.5% |
| French | 98 | 0.4% |
| German | 1,141 | 4.9% |
| Hungarian | 20 | 0.1% |
| Indian (Asian) | 2 | 0.0% |
| Irish | 2,878 | 12.3% |
| Italian | 352 | 1.5% |
| Korean | 29 | 0.1% |
| Lebanese | 21 | 0.1% |
| Mexican | 19 | 0.1% |
| Polish | 12 | 0.1% |
| Portuguese | 10 | 0.0% |
| Russian | 2 | 0.0% |
| Scandinavian | 6 | 0.0% |
| Scotch-Irish | 195 | 0.8% |
| Scottish | 210 | 0.9% |
| Subsaharan African | 143 | 0.6% |
| Swedish | 11 | 0.1% |
| Welsh | 14 | 0.1% | View All 27 Rows |
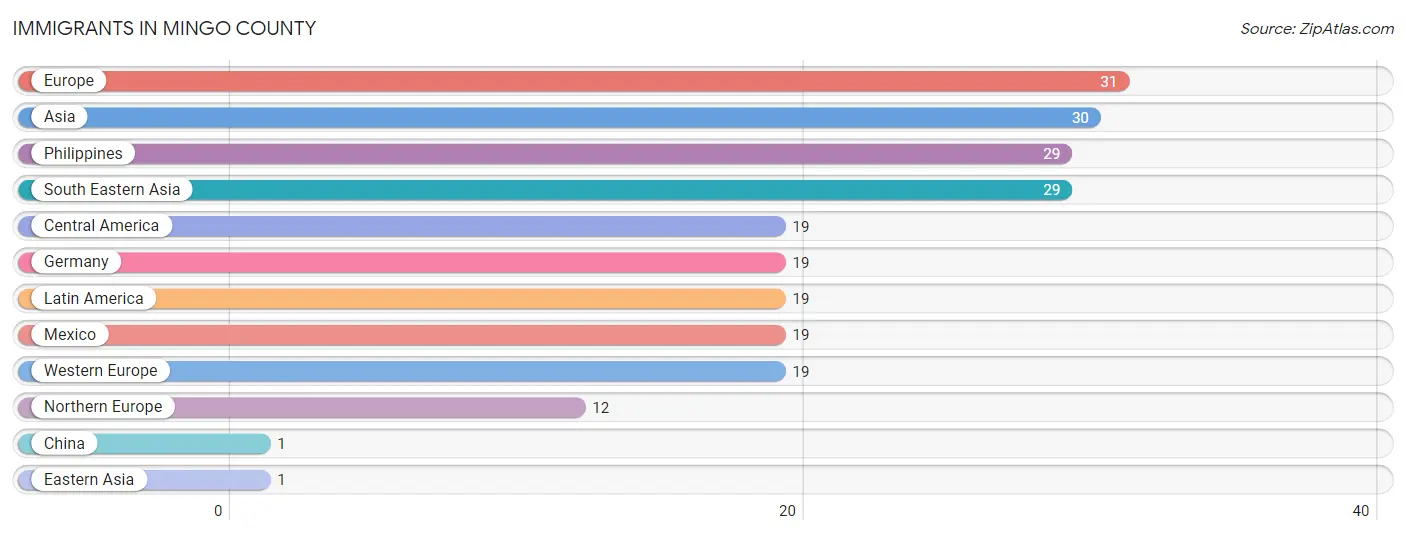
Immigrants in Mingo County
The most numerous immigrant groups reported in Mingo County came from Europe (31 | 0.1%), Asia (30 | 0.1%), Philippines (29 | 0.1%), South Eastern Asia (29 | 0.1%), and Central America (19 | 0.1%), together accounting for 0.6% of all Mingo County residents.
| Immigration Origin | # Population | % Population |
| Asia | 30 | 0.1% |
| Central America | 19 | 0.1% |
| China | 1 | 0.0% |
| Eastern Asia | 1 | 0.0% |
| Europe | 31 | 0.1% |
| Germany | 19 | 0.1% |
| Latin America | 19 | 0.1% |
| Mexico | 19 | 0.1% |
| Northern Europe | 12 | 0.1% |
| Philippines | 29 | 0.1% |
| South Eastern Asia | 29 | 0.1% |
| Western Europe | 19 | 0.1% | View All 12 Rows |
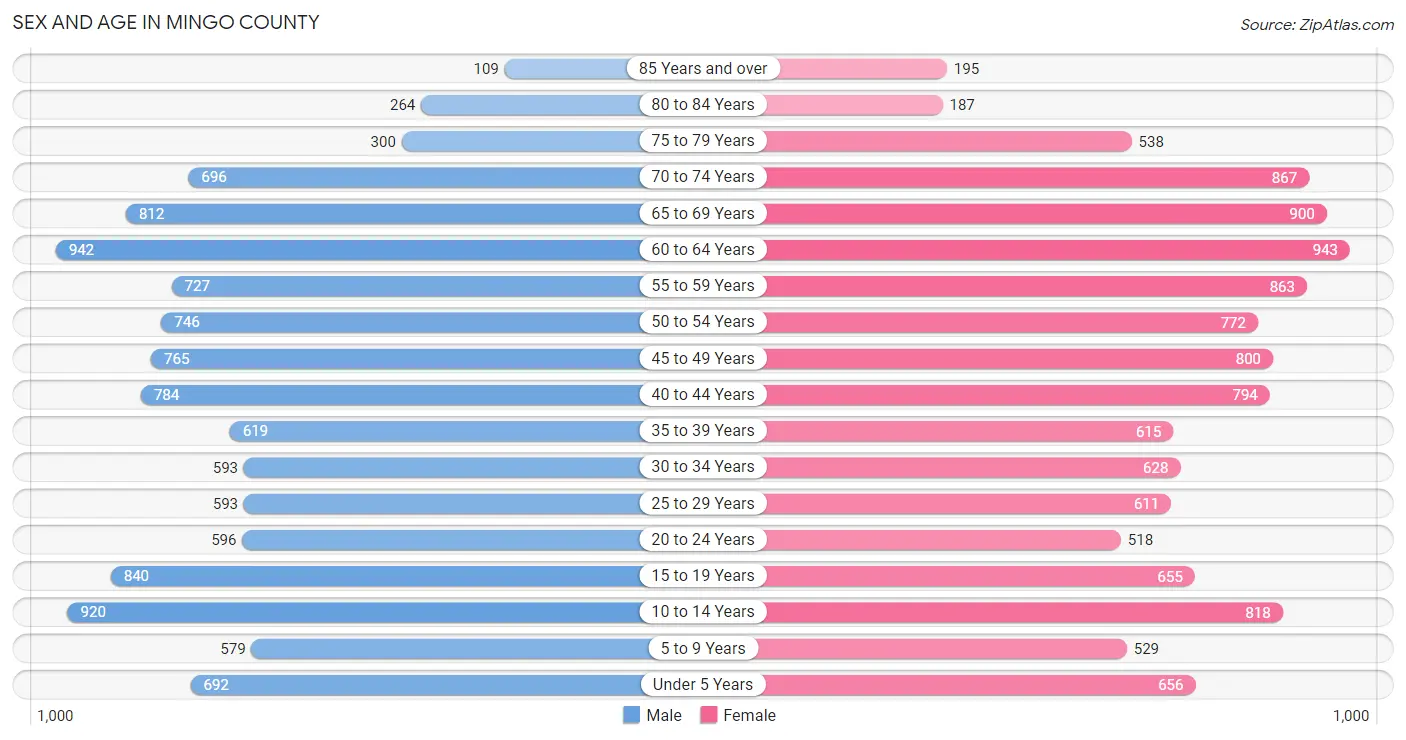
Sex and Age in Mingo County
Sex and Age in Mingo County
The most populous age groups in Mingo County are 60 to 64 Years (942 | 8.1%) for men and 60 to 64 Years (943 | 7.9%) for women.
| Age Bracket | Male | Female |
| Under 5 Years | 692 (6.0%) | 656 (5.5%) |
| 5 to 9 Years | 579 (5.0%) | 529 (4.4%) |
| 10 to 14 Years | 920 (8.0%) | 818 (6.9%) |
| 15 to 19 Years | 840 (7.3%) | 655 (5.5%) |
| 20 to 24 Years | 596 (5.1%) | 518 (4.4%) |
| 25 to 29 Years | 593 (5.1%) | 611 (5.1%) |
| 30 to 34 Years | 593 (5.1%) | 628 (5.3%) |
| 35 to 39 Years | 619 (5.3%) | 615 (5.2%) |
| 40 to 44 Years | 784 (6.8%) | 794 (6.7%) |
| 45 to 49 Years | 765 (6.6%) | 800 (6.7%) |
| 50 to 54 Years | 746 (6.4%) | 772 (6.5%) |
| 55 to 59 Years | 727 (6.3%) | 863 (7.3%) |
| 60 to 64 Years | 942 (8.1%) | 943 (7.9%) |
| 65 to 69 Years | 812 (7.0%) | 900 (7.6%) |
| 70 to 74 Years | 696 (6.0%) | 867 (7.3%) |
| 75 to 79 Years | 300 (2.6%) | 538 (4.5%) |
| 80 to 84 Years | 264 (2.3%) | 187 (1.6%) |
| 85 Years and over | 109 (0.9%) | 195 (1.6%) |
| Total | 11,577 (100.0%) | 11,889 (100.0%) |
Families and Households in Mingo County
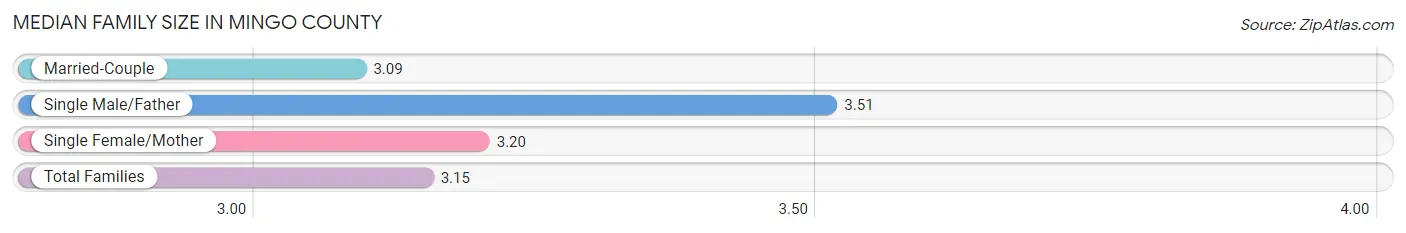
Median Family Size in Mingo County
The median family size in Mingo County is 3.15 persons per family, with single male/father families (530 | 8.5%) accounting for the largest median family size of 3.51 persons per family. On the other hand, married-couple families (4,552 | 72.7%) represent the smallest median family size with 3.09 persons per family.
| Family Type | # Families | Family Size |
| Married-Couple | 4,552 (72.7%) | 3.09 |
| Single Male/Father | 530 (8.5%) | 3.51 |
| Single Female/Mother | 1,184 (18.9%) | 3.20 |
| Total Families | 6,266 (100.0%) | 3.15 |
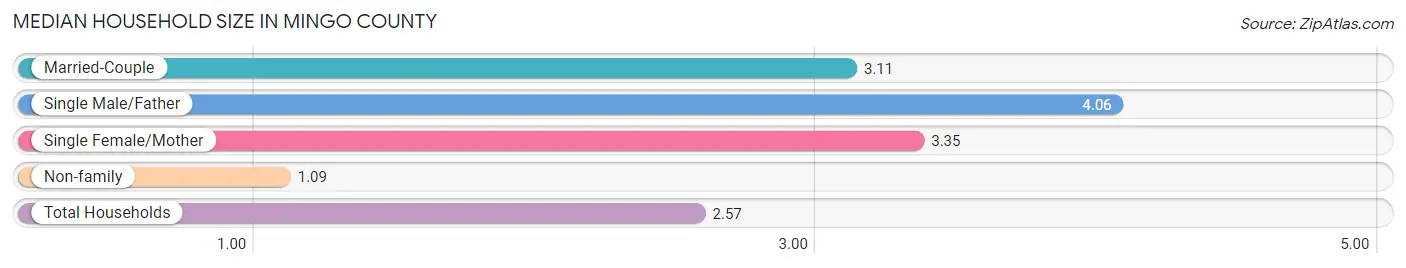
Median Household Size in Mingo County
The median household size in Mingo County is 2.57 persons per household, with single male/father households (530 | 5.8%) accounting for the largest median household size of 4.06 persons per household. non-family households (2,827 | 31.1%) represent the smallest median household size with 1.09 persons per household.
| Household Type | # Households | Household Size |
| Married-Couple | 4,552 (50.1%) | 3.11 |
| Single Male/Father | 530 (5.8%) | 4.06 |
| Single Female/Mother | 1,184 (13.0%) | 3.35 |
| Non-family | 2,827 (31.1%) | 1.09 |
| Total Households | 9,093 (100.0%) | 2.57 |
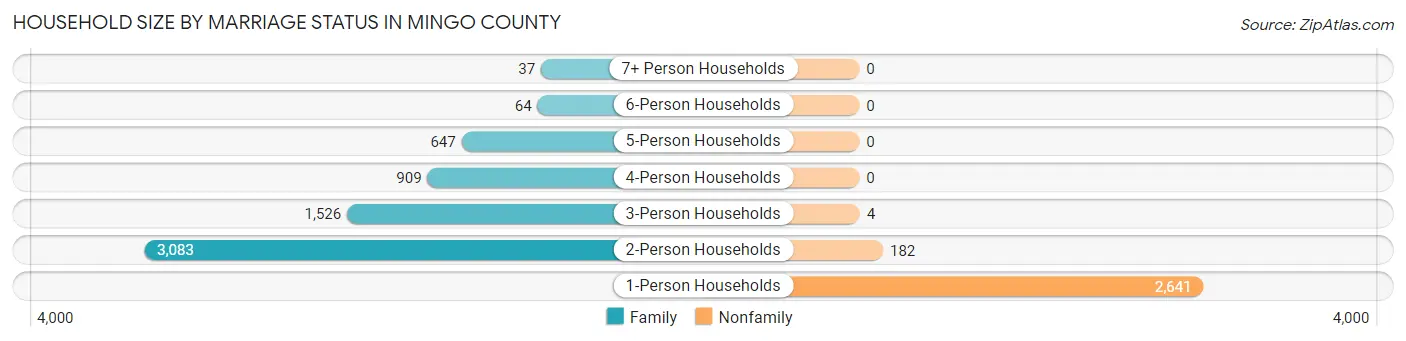
Household Size by Marriage Status in Mingo County
Out of a total of 9,093 households in Mingo County, 6,266 (68.9%) are family households, while 2,827 (31.1%) are nonfamily households. The most numerous type of family households are 2-person households, comprising 3,083, and the most common type of nonfamily households are 1-person households, comprising 2,641.
| Household Size | Family Households | Nonfamily Households |
| 1-Person Households | - | 2,641 (29.0%) |
| 2-Person Households | 3,083 (33.9%) | 182 (2.0%) |
| 3-Person Households | 1,526 (16.8%) | 4 (0.0%) |
| 4-Person Households | 909 (10.0%) | 0 (0.0%) |
| 5-Person Households | 647 (7.1%) | 0 (0.0%) |
| 6-Person Households | 64 (0.7%) | 0 (0.0%) |
| 7+ Person Households | 37 (0.4%) | 0 (0.0%) |
| Total | 6,266 (68.9%) | 2,827 (31.1%) |
Female Fertility in Mingo County
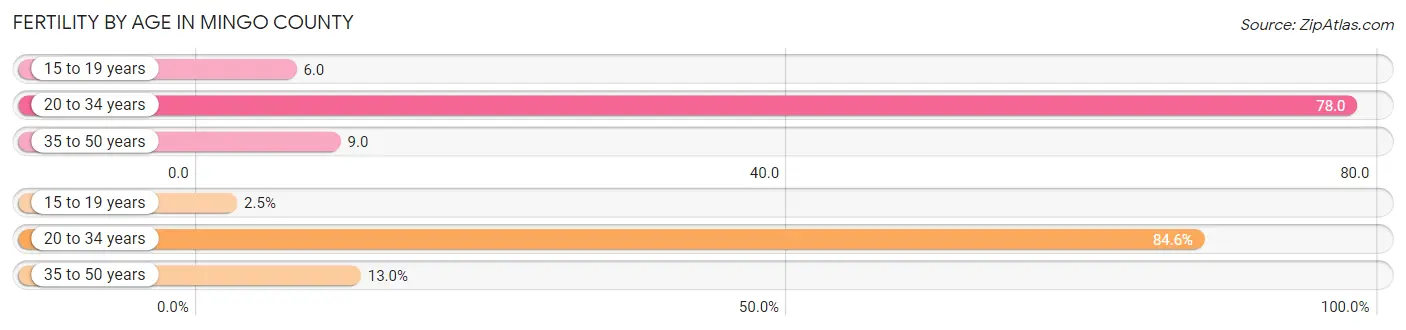
Fertility by Age in Mingo County
Average fertility rate in Mingo County is 34.0 births per 1,000 women. Women in the age bracket of 20 to 34 years have the highest fertility rate with 78.0 births per 1,000 women. Women in the age bracket of 20 to 34 years acount for 84.6% of all women with births.
| Age Bracket | Women with Births | Births / 1,000 Women |
| 15 to 19 years | 4 (2.5%) | 6.0 |
| 20 to 34 years | 137 (84.6%) | 78.0 |
| 35 to 50 years | 21 (13.0%) | 9.0 |
| Total | 162 (100.0%) | 34.0 |
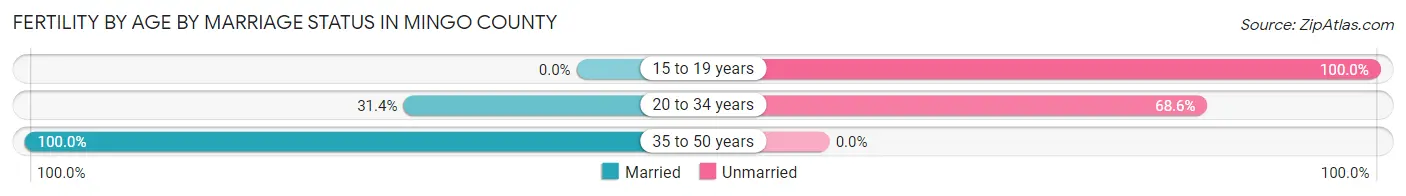
Fertility by Age by Marriage Status in Mingo County
39.5% of women with births (162) in Mingo County are married. The highest percentage of unmarried women with births falls into 15 to 19 years age bracket with 100.0% of them unmarried at the time of birth, while the lowest percentage of unmarried women with births belong to 35 to 50 years age bracket with 0.0% of them unmarried.
| Age Bracket | Married | Unmarried |
| 15 to 19 years | 0 (0.0%) | 4 (100.0%) |
| 20 to 34 years | 43 (31.4%) | 94 (68.6%) |
| 35 to 50 years | 21 (100.0%) | 0 (0.0%) |
| Total | 64 (39.5%) | 98 (60.5%) |
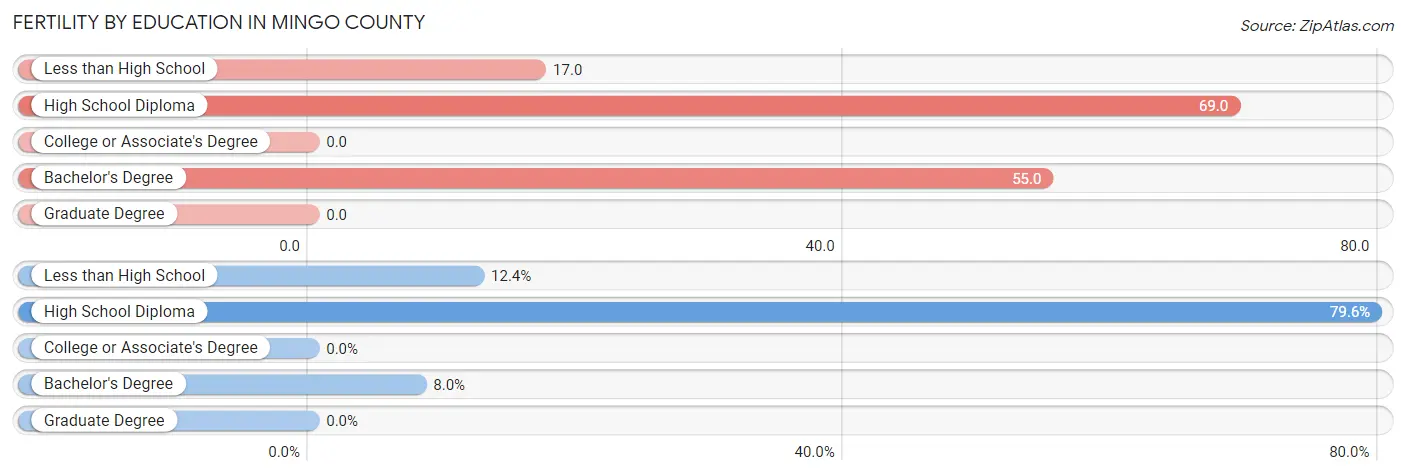
Fertility by Education in Mingo County
| Educational Attainment | Women with Births | Births / 1,000 Women |
| Less than High School | 20 (12.3%) | 17.0 |
| High School Diploma | 129 (79.6%) | 69.0 |
| College or Associate's Degree | 0 (0.0%) | 0.0 |
| Bachelor's Degree | 13 (8.0%) | 55.0 |
| Graduate Degree | 0 (0.0%) | 0.0 |
| Total | 162 (100.0%) | 34.0 |
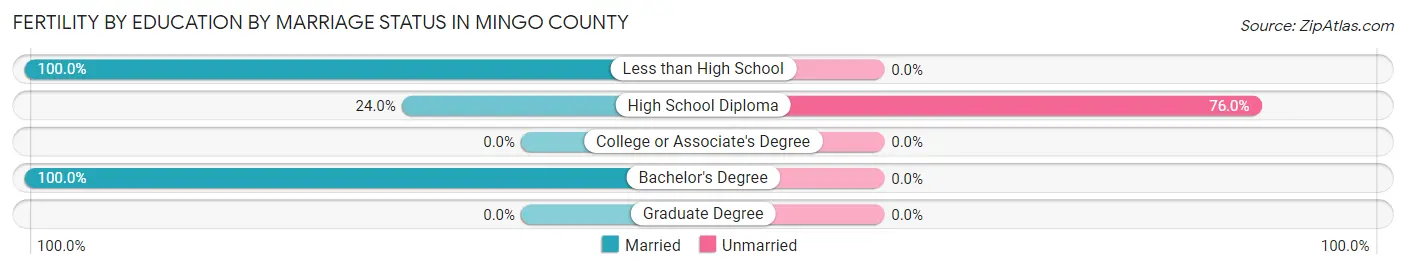
Fertility by Education by Marriage Status in Mingo County
60.5% of women with births in Mingo County are unmarried. Women with the educational attainment of less than high school are most likely to be married with 100.0% of them married at childbirth, while women with the educational attainment of high school diploma are least likely to be married with 76.0% of them unmarried at childbirth.
| Educational Attainment | Married | Unmarried |
| Less than High School | 20 (100.0%) | 0 (0.0%) |
| High School Diploma | 31 (24.0%) | 98 (76.0%) |
| College or Associate's Degree | 0 (0.0%) | 0 (0.0%) |
| Bachelor's Degree | 13 (100.0%) | 0 (0.0%) |
| Graduate Degree | 0 (0.0%) | 0 (0.0%) |
| Total | 64 (39.5%) | 98 (60.5%) |
Income in Mingo County
Income Overview in Mingo County
Per Capita Income in Mingo County is $21,342, while median incomes of families and households are $51,270 and $38,305 respectively.
| Characteristic | Number | Measure |
| Per Capita Income | 23,466 | $21,342 |
| Median Family Income | 6,266 | $51,270 |
| Mean Family Income | 6,266 | $64,857 |
| Median Household Income | 9,093 | $38,305 |
| Mean Household Income | 9,093 | $52,853 |
| Income Deficit | 6,266 | $11,124 |
| Wage / Income Gap (%) | 23,466 | 27.90% |
| Wage / Income Gap ($) | 23,466 | 72.10¢ per $1 |
| Gini / Inequality Index | 23,466 | 0.50 |
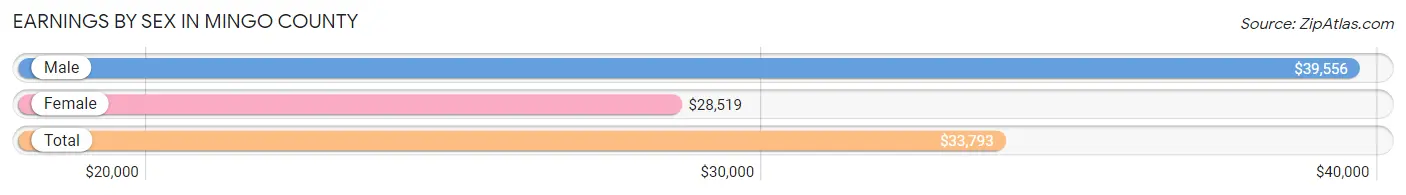
Earnings by Sex in Mingo County
Average Earnings in Mingo County are $33,793, $39,556 for men and $28,519 for women, a difference of 27.9%.
| Sex | Number | Average Earnings |
| Male | 3,913 (55.1%) | $39,556 |
| Female | 3,183 (44.9%) | $28,519 |
| Total | 7,096 (100.0%) | $33,793 |
Earnings by Sex by Income Bracket in Mingo County
The most common earnings brackets in Mingo County are $75,000 to $99,999 for men (421 | 10.8%) and $30,000 to $34,999 for women (304 | 9.6%).
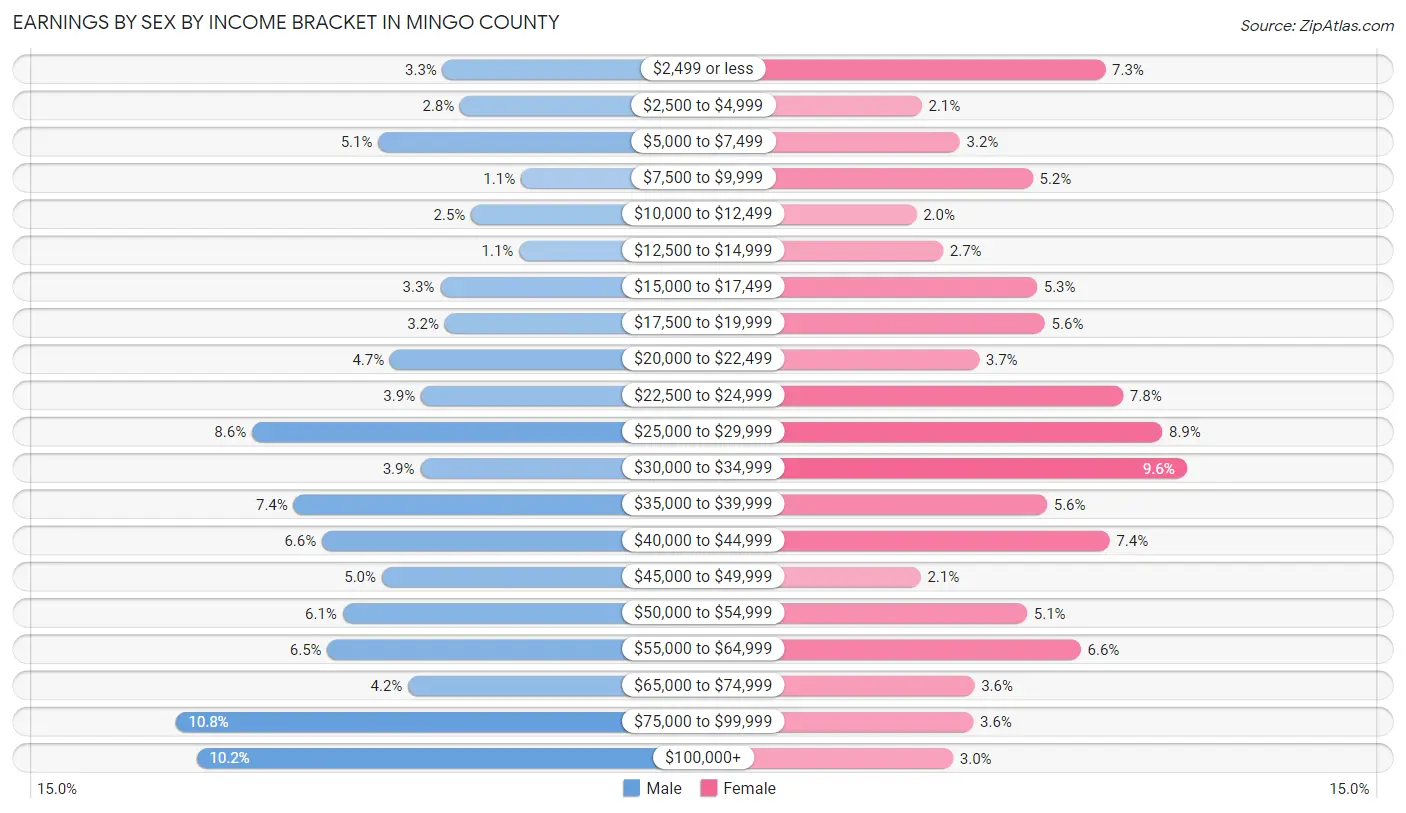
| Income | Male | Female |
| $2,499 or less | 127 (3.3%) | 231 (7.3%) |
| $2,500 to $4,999 | 108 (2.8%) | 67 (2.1%) |
| $5,000 to $7,499 | 198 (5.1%) | 101 (3.2%) |
| $7,500 to $9,999 | 41 (1.1%) | 166 (5.2%) |
| $10,000 to $12,499 | 96 (2.5%) | 62 (1.9%) |
| $12,500 to $14,999 | 43 (1.1%) | 86 (2.7%) |
| $15,000 to $17,499 | 130 (3.3%) | 170 (5.3%) |
| $17,500 to $19,999 | 125 (3.2%) | 177 (5.6%) |
| $20,000 to $22,499 | 185 (4.7%) | 118 (3.7%) |
| $22,500 to $24,999 | 151 (3.9%) | 247 (7.8%) |
| $25,000 to $29,999 | 337 (8.6%) | 282 (8.9%) |
| $30,000 to $34,999 | 152 (3.9%) | 304 (9.6%) |
| $35,000 to $39,999 | 291 (7.4%) | 179 (5.6%) |
| $40,000 to $44,999 | 260 (6.6%) | 235 (7.4%) |
| $45,000 to $49,999 | 194 (5.0%) | 66 (2.1%) |
| $50,000 to $54,999 | 237 (6.1%) | 161 (5.1%) |
| $55,000 to $64,999 | 254 (6.5%) | 209 (6.6%) |
| $65,000 to $74,999 | 165 (4.2%) | 114 (3.6%) |
| $75,000 to $99,999 | 421 (10.8%) | 113 (3.5%) |
| $100,000+ | 398 (10.2%) | 95 (3.0%) |
| Total | 3,913 (100.0%) | 3,183 (100.0%) |
Earnings by Sex by Educational Attainment in Mingo County
Average earnings in Mingo County are $42,845 for men and $31,336 for women, a difference of 26.9%. Men with an educational attainment of graduate degree enjoy the highest average annual earnings of $130,536, while those with less than high school education earn the least with $36,154. Women with an educational attainment of graduate degree earn the most with the average annual earnings of $63,750, while those with less than high school education have the smallest earnings of $20,375.
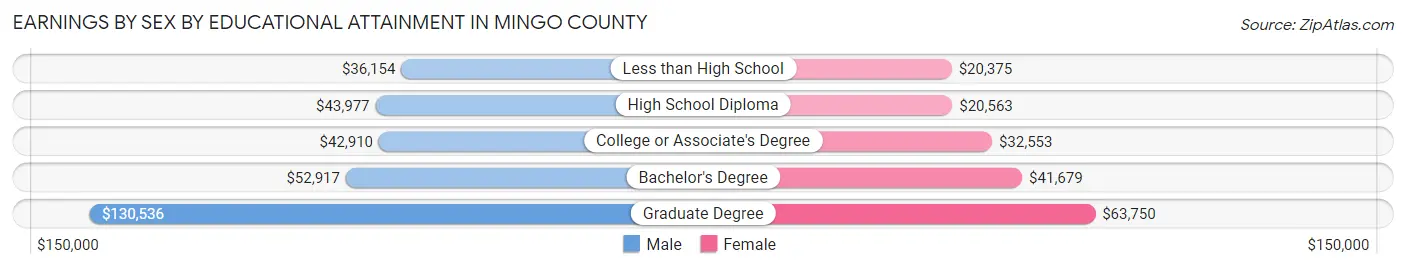
| Educational Attainment | Male Income | Female Income |
| Less than High School | $36,154 | $20,375 |
| High School Diploma | $43,977 | $20,563 |
| College or Associate's Degree | $42,910 | $32,553 |
| Bachelor's Degree | $52,917 | $41,679 |
| Graduate Degree | $130,536 | $63,750 |
| Total | $42,845 | $31,336 |
Family Income in Mingo County
Family Income Brackets in Mingo County
According to the Mingo County family income data, there are 1,209 families falling into the $50,000 to $74,999 income range, which is the most common income bracket and makes up 19.3% of all families. Conversely, the $200,000+ income bracket is the least frequent group with only 88 families (1.4%) belonging to this category.
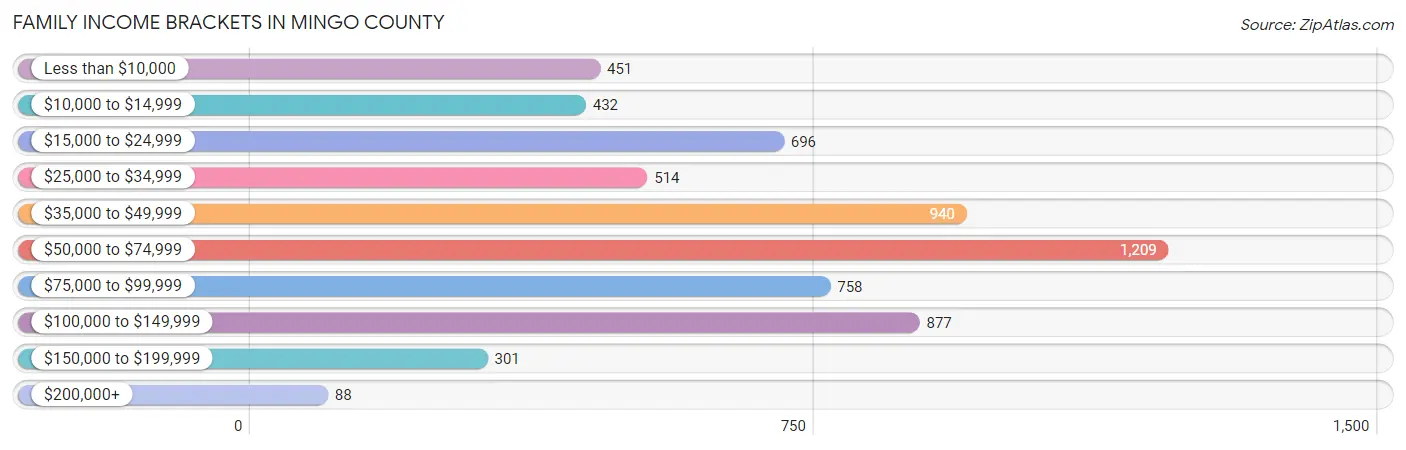
| Income Bracket | # Families | % Families |
| Less than $10,000 | 451 | 7.2% |
| $10,000 to $14,999 | 432 | 6.9% |
| $15,000 to $24,999 | 696 | 11.1% |
| $25,000 to $34,999 | 514 | 8.2% |
| $35,000 to $49,999 | 940 | 15.0% |
| $50,000 to $74,999 | 1,209 | 19.3% |
| $75,000 to $99,999 | 758 | 12.1% |
| $100,000 to $149,999 | 877 | 14.0% |
| $150,000 to $199,999 | 301 | 4.8% |
| $200,000+ | 88 | 1.4% |
Family Income by Famaliy Size in Mingo County
7+ person families (37 | 0.6%) account for the highest median family income in Mingo County with $103,583 per family, while 2-person families (3,341 | 53.3%) have the highest median income of $23,898 per family member.
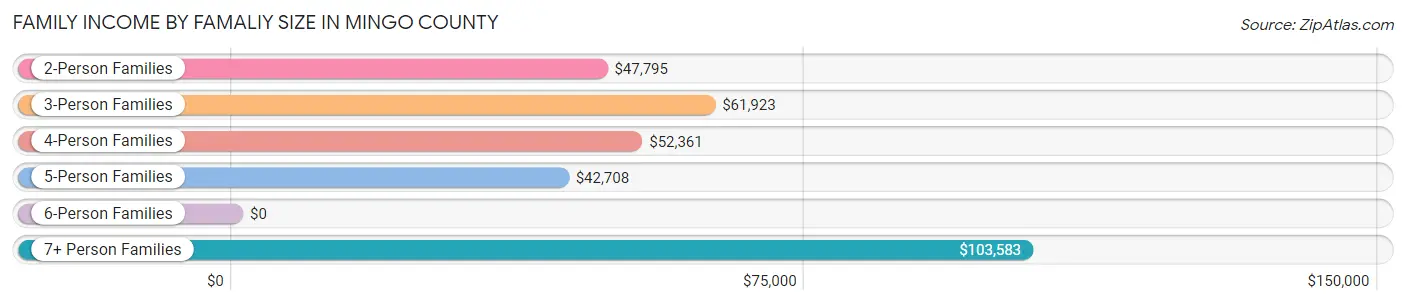
| Income Bracket | # Families | Median Income |
| 2-Person Families | 3,341 (53.3%) | $47,795 |
| 3-Person Families | 1,366 (21.8%) | $61,923 |
| 4-Person Families | 951 (15.2%) | $52,361 |
| 5-Person Families | 537 (8.6%) | $42,708 |
| 6-Person Families | 34 (0.5%) | $0 |
| 7+ Person Families | 37 (0.6%) | $103,583 |
| Total | 6,266 (100.0%) | $51,270 |
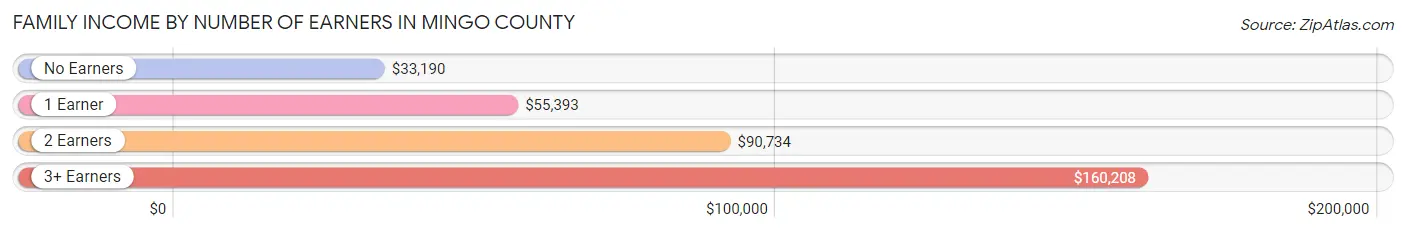
Family Income by Number of Earners in Mingo County
The median family income in Mingo County is $51,270, with families comprising 3+ earners (156) having the highest median family income of $160,208, while families with no earners (2,305) have the lowest median family income of $33,190, accounting for 2.5% and 36.8% of families, respectively.
| Number of Earners | # Families | Median Income |
| No Earners | 2,305 (36.8%) | $33,190 |
| 1 Earner | 2,396 (38.2%) | $55,393 |
| 2 Earners | 1,409 (22.5%) | $90,734 |
| 3+ Earners | 156 (2.5%) | $160,208 |
| Total | 6,266 (100.0%) | $51,270 |
Household Income in Mingo County
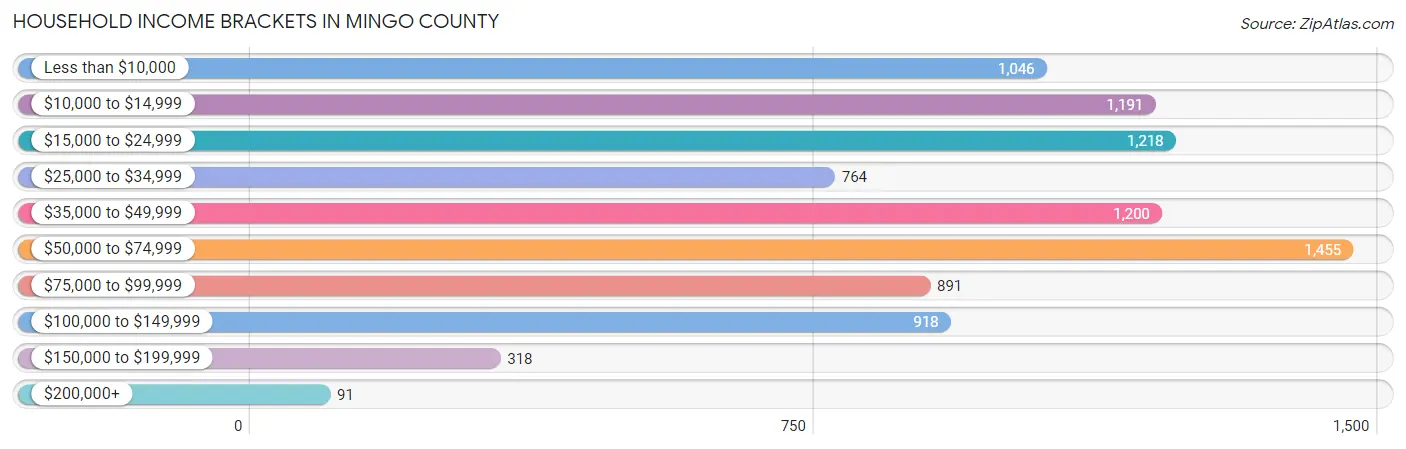
Household Income Brackets in Mingo County
With 1,455 households falling in the category, the $50,000 to $74,999 income range is the most frequent in Mingo County, accounting for 16.0% of all households. In contrast, only 91 households (1.0%) fall into the $200,000+ income bracket, making it the least populous group.
| Income Bracket | # Households | % Households |
| Less than $10,000 | 1,046 | 11.5% |
| $10,000 to $14,999 | 1,191 | 13.1% |
| $15,000 to $24,999 | 1,218 | 13.4% |
| $25,000 to $34,999 | 764 | 8.4% |
| $35,000 to $49,999 | 1,200 | 13.2% |
| $50,000 to $74,999 | 1,455 | 16.0% |
| $75,000 to $99,999 | 891 | 9.8% |
| $100,000 to $149,999 | 918 | 10.1% |
| $150,000 to $199,999 | 318 | 3.5% |
| $200,000+ | 91 | 1.0% |
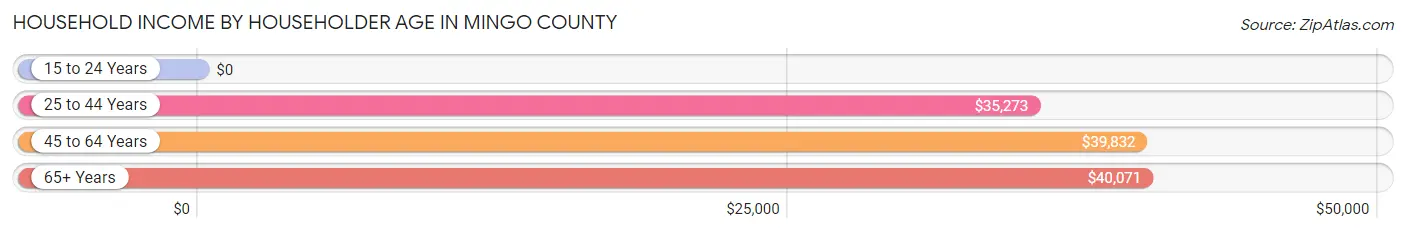
Household Income by Householder Age in Mingo County
The median household income in Mingo County is $38,305, with the highest median household income of $40,071 found in the 65+ years age bracket for the primary householder. A total of 3,156 households (34.7%) fall into this category. Meanwhile, the 15 to 24 years age bracket for the primary householder has the lowest median household income of $0, with 176 households (1.9%) in this group.
| Income Bracket | # Households | Median Income |
| 15 to 24 Years | 176 (1.9%) | $0 |
| 25 to 44 Years | 2,097 (23.1%) | $35,273 |
| 45 to 64 Years | 3,664 (40.3%) | $39,832 |
| 65+ Years | 3,156 (34.7%) | $40,071 |
| Total | 9,093 (100.0%) | $38,305 |
Poverty in Mingo County
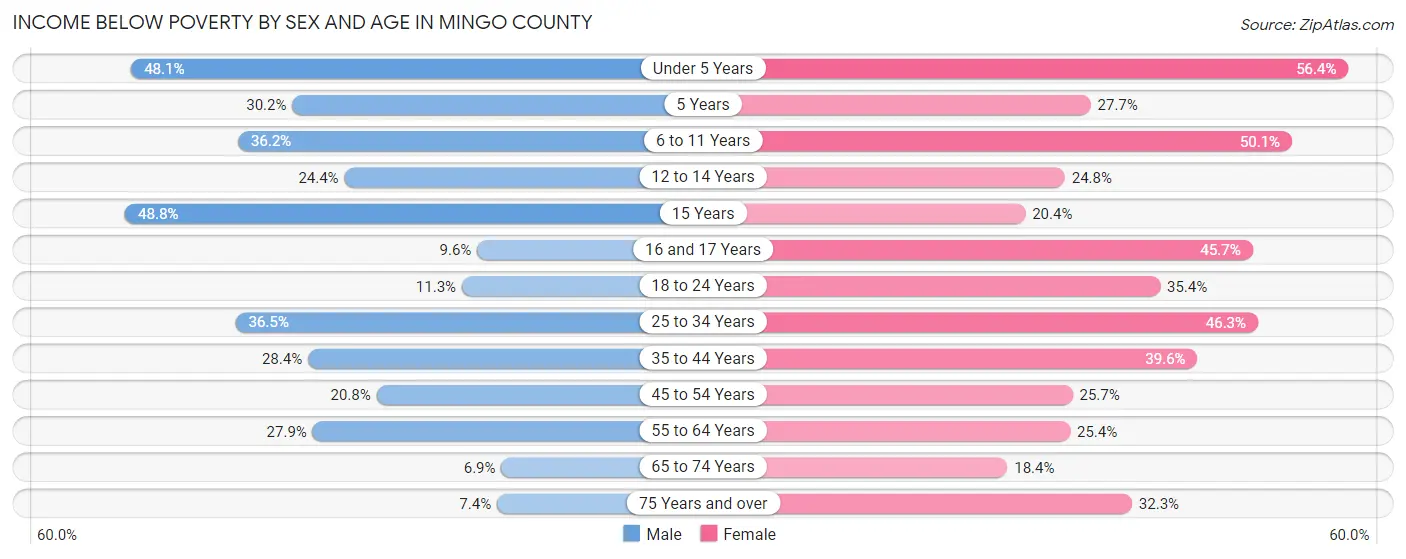
Income Below Poverty by Sex and Age in Mingo County
With 23.8% poverty level for males and 33.3% for females among the residents of Mingo County, 15 year old males and under 5 year old females are the most vulnerable to poverty, with 61 males (48.8%) and 370 females (56.4%) in their respective age groups living below the poverty level.
| Age Bracket | Male | Female |
| Under 5 Years | 333 (48.1%) | 370 (56.4%) |
| 5 Years | 48 (30.2%) | 23 (27.7%) |
| 6 to 11 Years | 245 (36.2%) | 384 (50.1%) |
| 12 to 14 Years | 156 (24.4%) | 118 (24.8%) |
| 15 Years | 61 (48.8%) | 19 (20.4%) |
| 16 and 17 Years | 46 (9.6%) | 161 (45.7%) |
| 18 to 24 Years | 94 (11.3%) | 258 (35.4%) |
| 25 to 34 Years | 433 (36.5%) | 574 (46.3%) |
| 35 to 44 Years | 399 (28.4%) | 558 (39.6%) |
| 45 to 54 Years | 312 (20.8%) | 404 (25.7%) |
| 55 to 64 Years | 464 (27.9%) | 459 (25.4%) |
| 65 to 74 Years | 104 (6.9%) | 324 (18.4%) |
| 75 Years and over | 49 (7.4%) | 283 (32.3%) |
| Total | 2,744 (23.8%) | 3,935 (33.3%) |
Income Above Poverty by Sex and Age in Mingo County
According to the poverty statistics in Mingo County, males aged 65 to 74 years and females aged 65 to 74 years are the age groups that are most secure financially, with 93.1% of males and 81.6% of females in these age groups living above the poverty line.
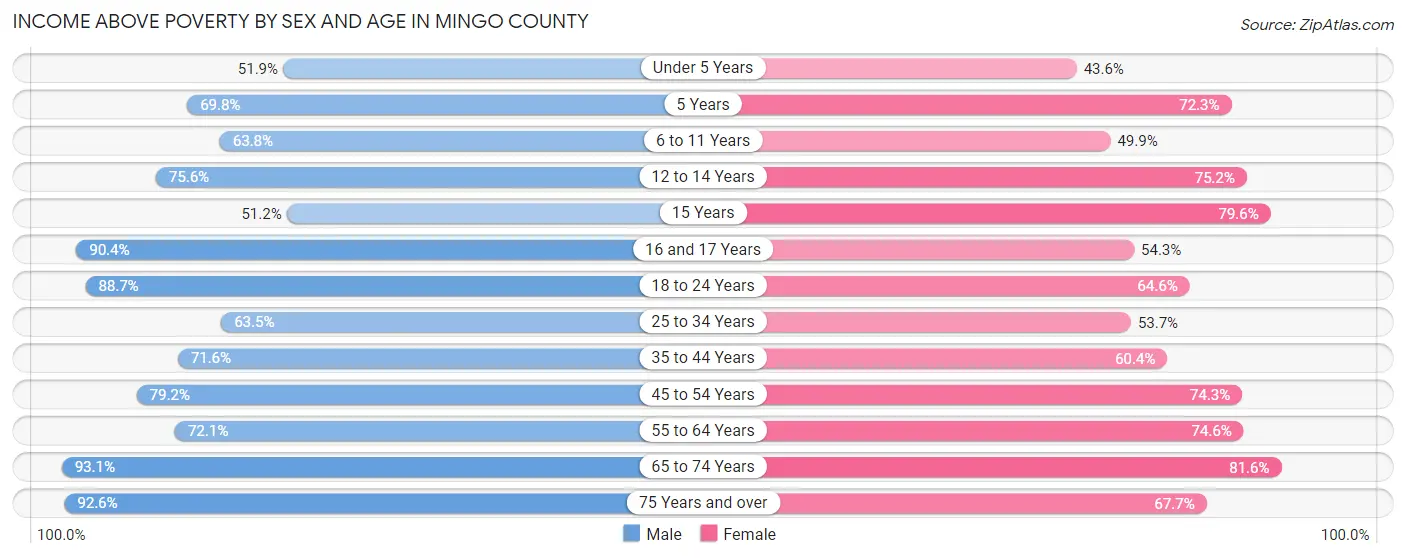
| Age Bracket | Male | Female |
| Under 5 Years | 359 (51.9%) | 286 (43.6%) |
| 5 Years | 111 (69.8%) | 60 (72.3%) |
| 6 to 11 Years | 431 (63.8%) | 382 (49.9%) |
| 12 to 14 Years | 484 (75.6%) | 357 (75.2%) |
| 15 Years | 64 (51.2%) | 74 (79.6%) |
| 16 and 17 Years | 433 (90.4%) | 191 (54.3%) |
| 18 to 24 Years | 738 (88.7%) | 470 (64.6%) |
| 25 to 34 Years | 753 (63.5%) | 665 (53.7%) |
| 35 to 44 Years | 1,004 (71.6%) | 851 (60.4%) |
| 45 to 54 Years | 1,188 (79.2%) | 1,168 (74.3%) |
| 55 to 64 Years | 1,198 (72.1%) | 1,347 (74.6%) |
| 65 to 74 Years | 1,404 (93.1%) | 1,434 (81.6%) |
| 75 Years and over | 614 (92.6%) | 593 (67.7%) |
| Total | 8,781 (76.2%) | 7,878 (66.7%) |
Income Below Poverty Among Married-Couple Families in Mingo County
The poverty statistics for married-couple families in Mingo County show that 17.4% or 791 of the total 4,552 families live below the poverty line. Families with 3 or 4 children have the highest poverty rate of 35.0%, comprising of 90 families. On the other hand, families with 5 or more children have the lowest poverty rate of 0.0%, which includes 0 families.
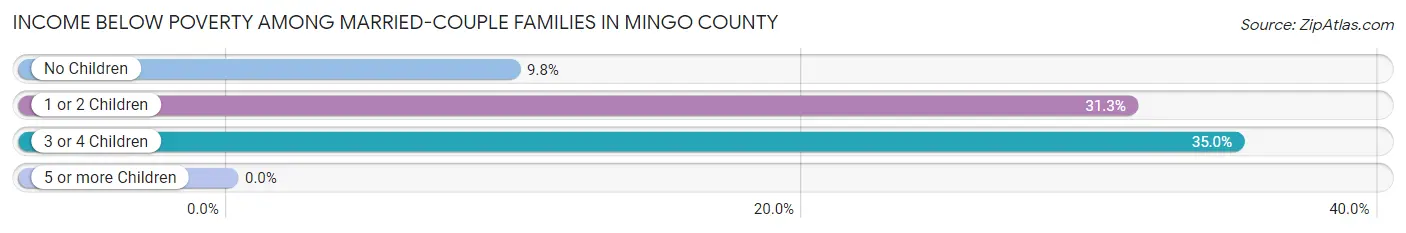
| Children | Above Poverty | Below Poverty |
| No Children | 2,682 (90.2%) | 292 (9.8%) |
| 1 or 2 Children | 897 (68.7%) | 409 (31.3%) |
| 3 or 4 Children | 167 (65.0%) | 90 (35.0%) |
| 5 or more Children | 15 (100.0%) | 0 (0.0%) |
| Total | 3,761 (82.6%) | 791 (17.4%) |
Income Below Poverty Among Single-Parent Households in Mingo County
According to the poverty data in Mingo County, 27.7% or 147 single-father households and 46.2% or 547 single-mother households are living below the poverty line. Among single-father households, those with 3 or 4 children have the highest poverty rate, with 14 households (43.8%) experiencing poverty. Likewise, among single-mother households, those with 1 or 2 children have the highest poverty rate, with 310 households (78.5%) falling below the poverty line.
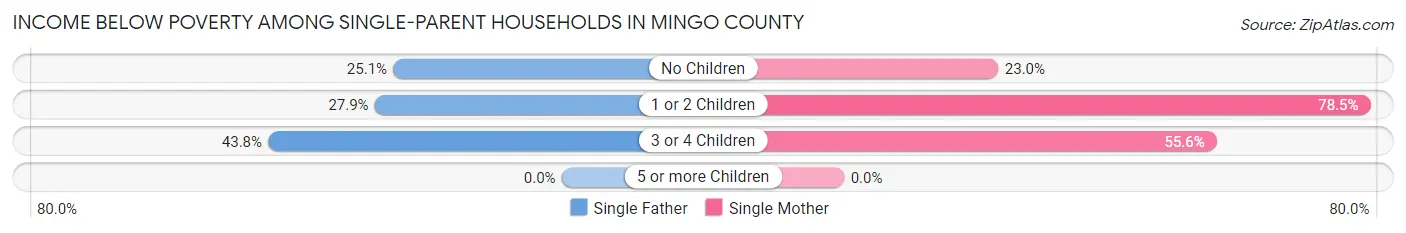
| Children | Single Father | Single Mother |
| No Children | 53 (25.1%) | 142 (23.0%) |
| 1 or 2 Children | 80 (27.9%) | 310 (78.5%) |
| 3 or 4 Children | 14 (43.8%) | 95 (55.6%) |
| 5 or more Children | 0 (0.0%) | 0 (0.0%) |
| Total | 147 (27.7%) | 547 (46.2%) |
Income Below Poverty Among Married-Couple vs Single-Parent Households in Mingo County
The poverty data for Mingo County shows that 791 of the married-couple family households (17.4%) and 694 of the single-parent households (40.5%) are living below the poverty level. Within the married-couple family households, those with 3 or 4 children have the highest poverty rate, with 90 households (35.0%) falling below the poverty line. Among the single-parent households, those with 1 or 2 children have the highest poverty rate, with 390 household (57.2%) living below poverty.
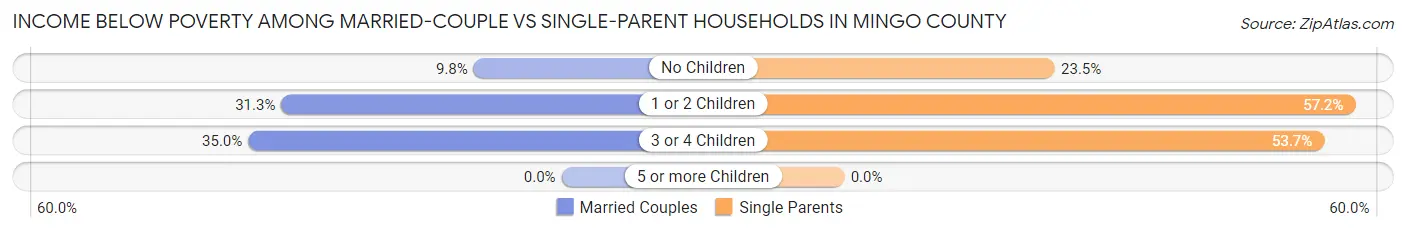
| Children | Married-Couple Families | Single-Parent Households |
| No Children | 292 (9.8%) | 195 (23.5%) |
| 1 or 2 Children | 409 (31.3%) | 390 (57.2%) |
| 3 or 4 Children | 90 (35.0%) | 109 (53.7%) |
| 5 or more Children | 0 (0.0%) | 0 (0.0%) |
| Total | 791 (17.4%) | 694 (40.5%) |
Employment Characteristics in Mingo County
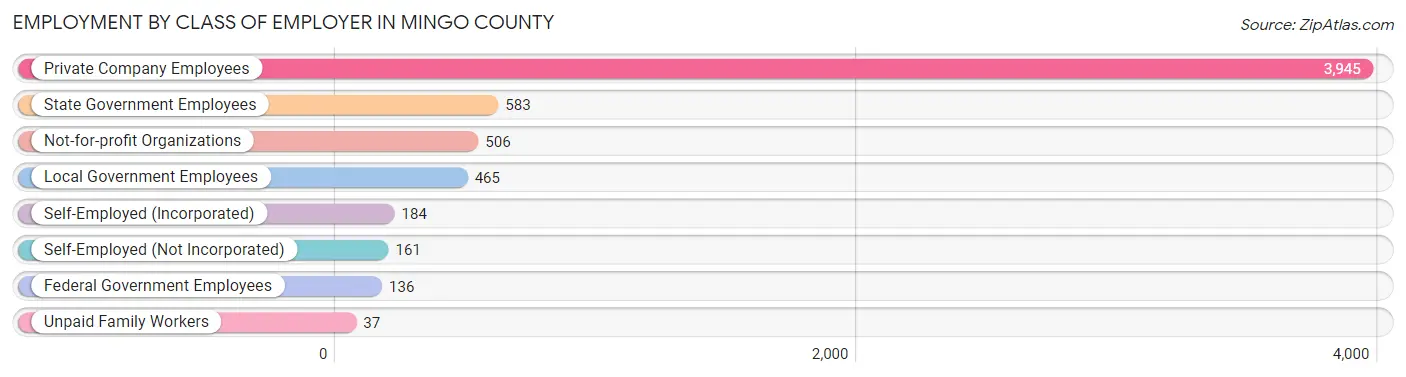
Employment by Class of Employer in Mingo County
Among the 6,017 employed individuals in Mingo County, private company employees (3,945 | 65.6%), state government employees (583 | 9.7%), and not-for-profit organizations (506 | 8.4%) make up the most common classes of employment.
| Employer Class | # Employees | % Employees |
| Private Company Employees | 3,945 | 65.6% |
| Self-Employed (Incorporated) | 184 | 3.1% |
| Self-Employed (Not Incorporated) | 161 | 2.7% |
| Not-for-profit Organizations | 506 | 8.4% |
| Local Government Employees | 465 | 7.7% |
| State Government Employees | 583 | 9.7% |
| Federal Government Employees | 136 | 2.3% |
| Unpaid Family Workers | 37 | 0.6% |
| Total | 6,017 | 100.0% |
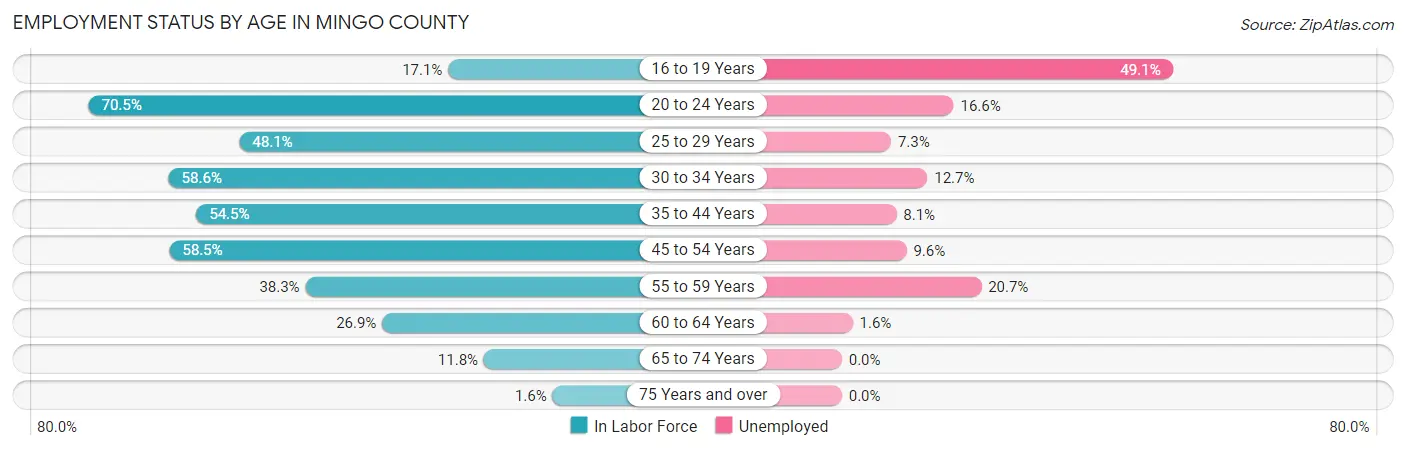
Employment Status by Age in Mingo County
According to the labor force statistics for Mingo County, out of the total population over 16 years of age (19,054), 37.6% or 7,164 individuals are in the labor force, with 11.2% or 802 of them unemployed. The age group with the highest labor force participation rate is 20 to 24 years, with 70.5% or 785 individuals in the labor force. Within the labor force, the 16 to 19 years age range has the highest percentage of unemployed individuals, with 49.1% or 107 of them being unemployed.
| Age Bracket | In Labor Force | Unemployed |
| 16 to 19 Years | 218 (17.1%) | 107 (49.1%) |
| 20 to 24 Years | 785 (70.5%) | 130 (16.6%) |
| 25 to 29 Years | 579 (48.1%) | 42 (7.3%) |
| 30 to 34 Years | 716 (58.6%) | 91 (12.7%) |
| 35 to 44 Years | 1,533 (54.5%) | 124 (8.1%) |
| 45 to 54 Years | 1,804 (58.5%) | 173 (9.6%) |
| 55 to 59 Years | 609 (38.3%) | 126 (20.7%) |
| 60 to 64 Years | 507 (26.9%) | 8 (1.6%) |
| 65 to 74 Years | 386 (11.8%) | 0 (0.0%) |
| 75 Years and over | 25 (1.6%) | 0 (0.0%) |
| Total | 7,164 (37.6%) | 802 (11.2%) |
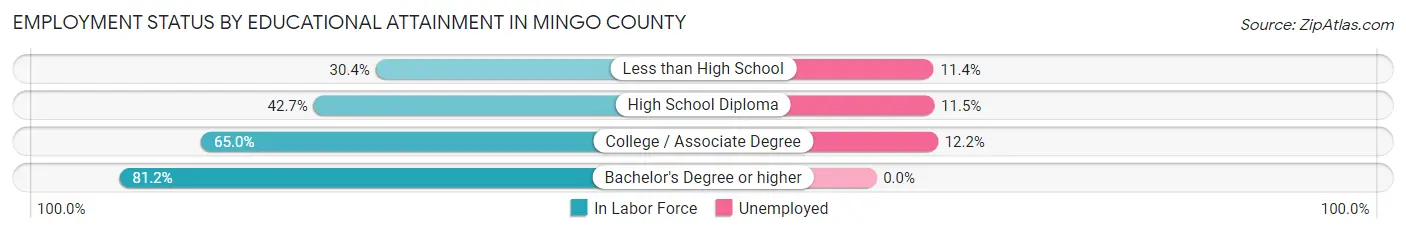
Employment Status by Educational Attainment in Mingo County
According to labor force statistics for Mingo County, 48.7% of individuals (5,744) out of the total population between 25 and 64 years of age (11,795) are in the labor force, with 9.8% or 563 of them being unemployed. The group with the highest labor force participation rate are those with the educational attainment of bachelor's degree or higher, with 81.2% or 943 individuals in the labor force. Within the labor force, individuals with college / associate degree education have the highest percentage of unemployment, with 12.2% or 213 of them being unemployed.
| Educational Attainment | In Labor Force | Unemployed |
| Less than High School | 837 (30.4%) | 314 (11.4%) |
| High School Diploma | 2,217 (42.7%) | 597 (11.5%) |
| College / Associate Degree | 1,748 (65.0%) | 328 (12.2%) |
| Bachelor's Degree or higher | 943 (81.2%) | 0 (0.0%) |
| Total | 5,744 (48.7%) | 1,156 (9.8%) |
Employment Occupations by Sex in Mingo County
Management, Business, Science and Arts Occupations
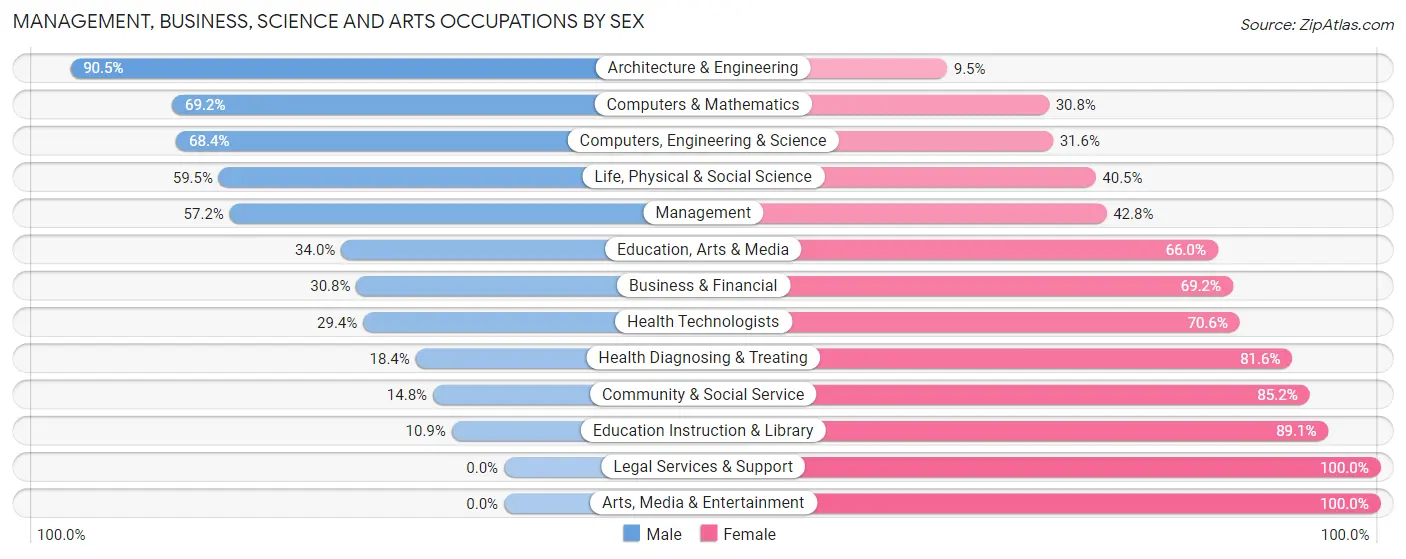
The most common Management, Business, Science and Arts occupations in Mingo County are Community & Social Service (661 | 10.4%), Health Diagnosing & Treating (407 | 6.4%), Education Instruction & Library (403 | 6.3%), Management (360 | 5.7%), and Computers, Engineering & Science (234 | 3.7%).
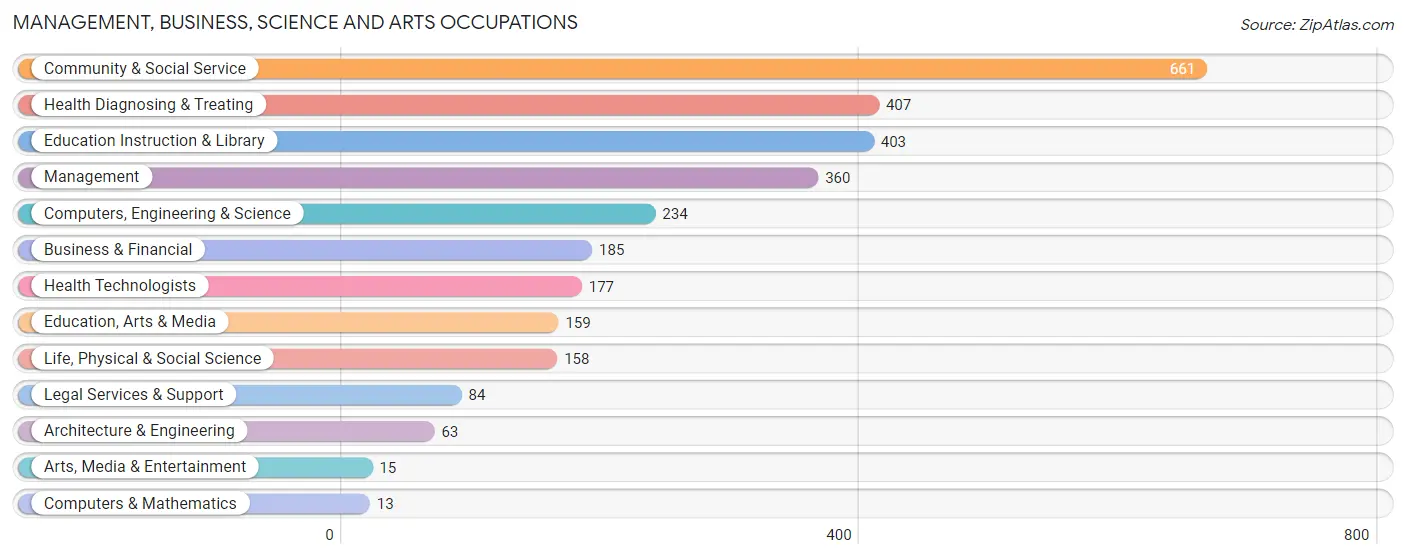
Management, Business, Science and Arts Occupations by Sex
Within the Management, Business, Science and Arts occupations in Mingo County, the most male-oriented occupations are Architecture & Engineering (90.5%), Computers & Mathematics (69.2%), and Computers, Engineering & Science (68.4%), while the most female-oriented occupations are Legal Services & Support (100.0%), Arts, Media & Entertainment (100.0%), and Education Instruction & Library (89.1%).
| Occupation | Male | Female |
| Management | 206 (57.2%) | 154 (42.8%) |
| Business & Financial | 57 (30.8%) | 128 (69.2%) |
| Computers, Engineering & Science | 160 (68.4%) | 74 (31.6%) |
| Computers & Mathematics | 9 (69.2%) | 4 (30.8%) |
| Architecture & Engineering | 57 (90.5%) | 6 (9.5%) |
| Life, Physical & Social Science | 94 (59.5%) | 64 (40.5%) |
| Community & Social Service | 98 (14.8%) | 563 (85.2%) |
| Education, Arts & Media | 54 (34.0%) | 105 (66.0%) |
| Legal Services & Support | 0 (0.0%) | 84 (100.0%) |
| Education Instruction & Library | 44 (10.9%) | 359 (89.1%) |
| Arts, Media & Entertainment | 0 (0.0%) | 15 (100.0%) |
| Health Diagnosing & Treating | 75 (18.4%) | 332 (81.6%) |
| Health Technologists | 52 (29.4%) | 125 (70.6%) |
| Total (Category) | 596 (32.3%) | 1,251 (67.7%) |
| Total (Overall) | 3,452 (54.3%) | 2,908 (45.7%) |
Services Occupations
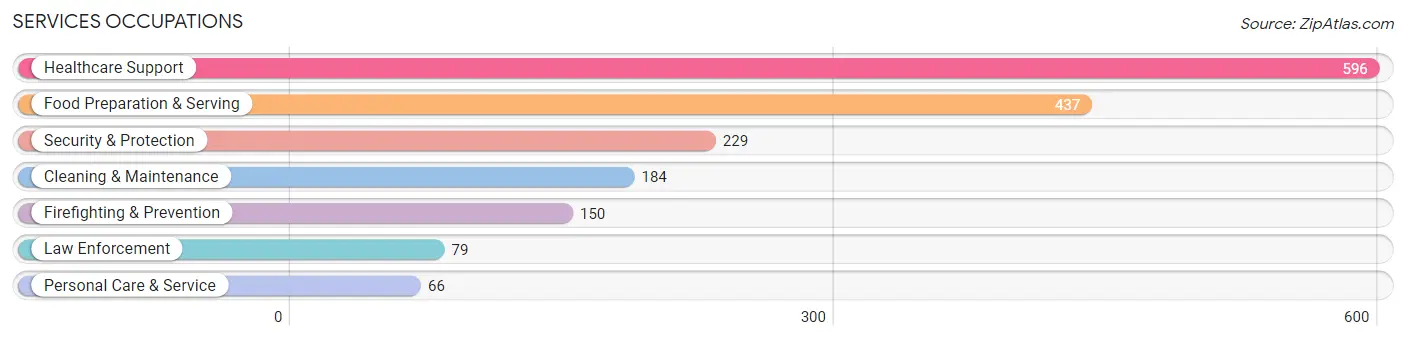
The most common Services occupations in Mingo County are Healthcare Support (596 | 9.4%), Food Preparation & Serving (437 | 6.9%), Security & Protection (229 | 3.6%), Cleaning & Maintenance (184 | 2.9%), and Firefighting & Prevention (150 | 2.4%).
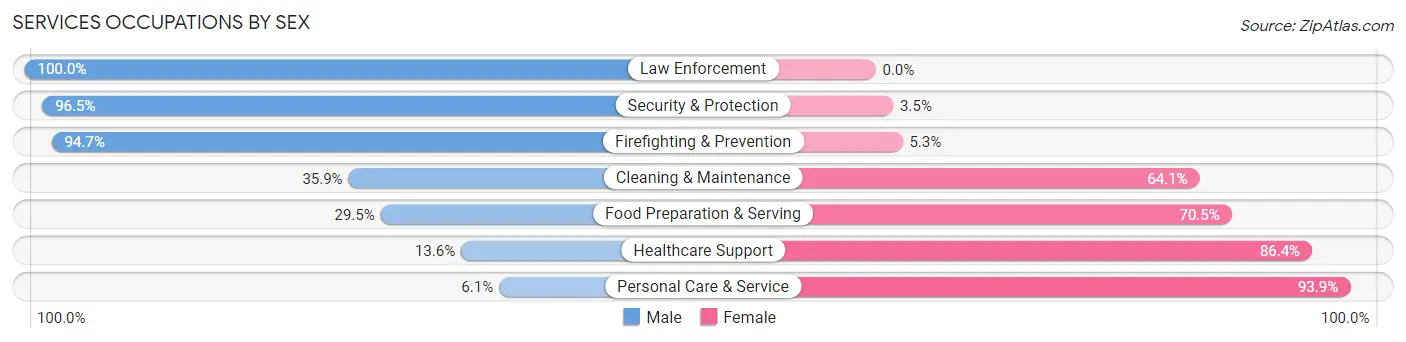
Services Occupations by Sex
Within the Services occupations in Mingo County, the most male-oriented occupations are Law Enforcement (100.0%), Security & Protection (96.5%), and Firefighting & Prevention (94.7%), while the most female-oriented occupations are Personal Care & Service (93.9%), Healthcare Support (86.4%), and Food Preparation & Serving (70.5%).
| Occupation | Male | Female |
| Healthcare Support | 81 (13.6%) | 515 (86.4%) |
| Security & Protection | 221 (96.5%) | 8 (3.5%) |
| Firefighting & Prevention | 142 (94.7%) | 8 (5.3%) |
| Law Enforcement | 79 (100.0%) | 0 (0.0%) |
| Food Preparation & Serving | 129 (29.5%) | 308 (70.5%) |
| Cleaning & Maintenance | 66 (35.9%) | 118 (64.1%) |
| Personal Care & Service | 4 (6.1%) | 62 (93.9%) |
| Total (Category) | 501 (33.1%) | 1,011 (66.9%) |
| Total (Overall) | 3,452 (54.3%) | 2,908 (45.7%) |
Sales and Office Occupations
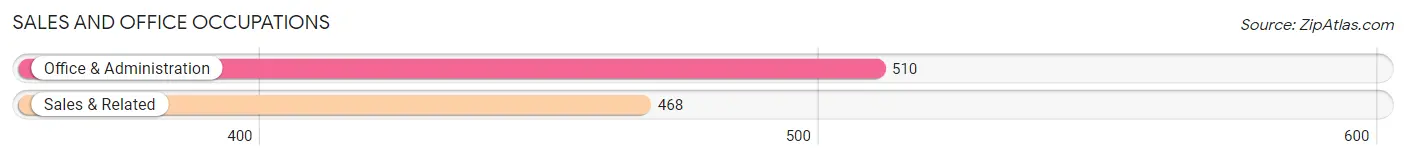
The most common Sales and Office occupations in Mingo County are Office & Administration (510 | 8.0%), and Sales & Related (468 | 7.4%).
Sales and Office Occupations by Sex
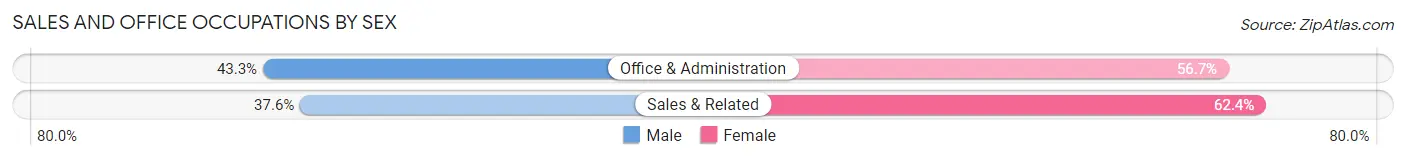
| Occupation | Male | Female |
| Sales & Related | 176 (37.6%) | 292 (62.4%) |
| Office & Administration | 221 (43.3%) | 289 (56.7%) |
| Total (Category) | 397 (40.6%) | 581 (59.4%) |
| Total (Overall) | 3,452 (54.3%) | 2,908 (45.7%) |
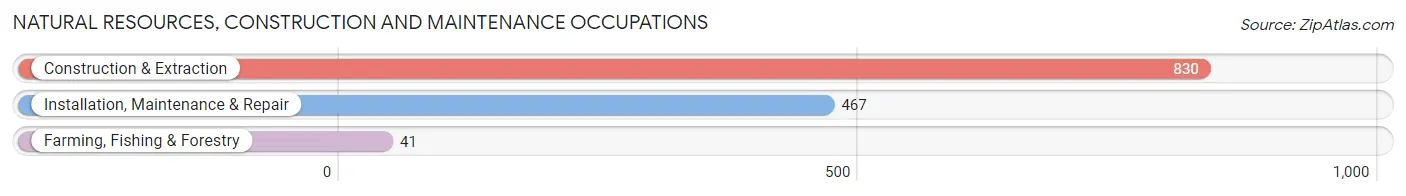
Natural Resources, Construction and Maintenance Occupations
The most common Natural Resources, Construction and Maintenance occupations in Mingo County are Construction & Extraction (830 | 13.1%), Installation, Maintenance & Repair (467 | 7.3%), and Farming, Fishing & Forestry (41 | 0.6%).
Natural Resources, Construction and Maintenance Occupations by Sex
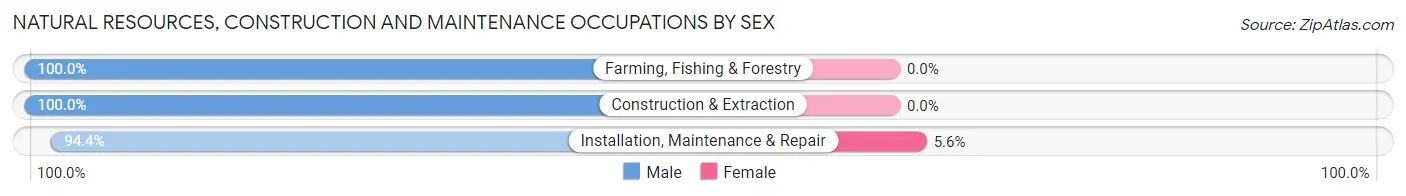
| Occupation | Male | Female |
| Farming, Fishing & Forestry | 41 (100.0%) | 0 (0.0%) |
| Construction & Extraction | 830 (100.0%) | 0 (0.0%) |
| Installation, Maintenance & Repair | 441 (94.4%) | 26 (5.6%) |
| Total (Category) | 1,312 (98.1%) | 26 (1.9%) |
| Total (Overall) | 3,452 (54.3%) | 2,908 (45.7%) |
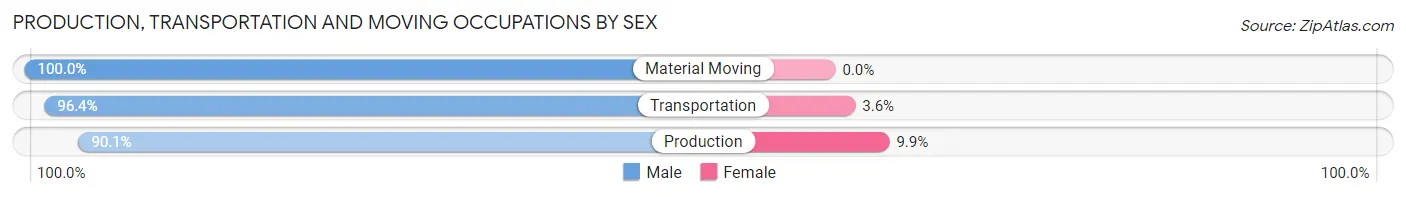
Production, Transportation and Moving Occupations
The most common Production, Transportation and Moving occupations in Mingo County are Transportation (303 | 4.8%), Production (283 | 4.4%), and Material Moving (99 | 1.6%).
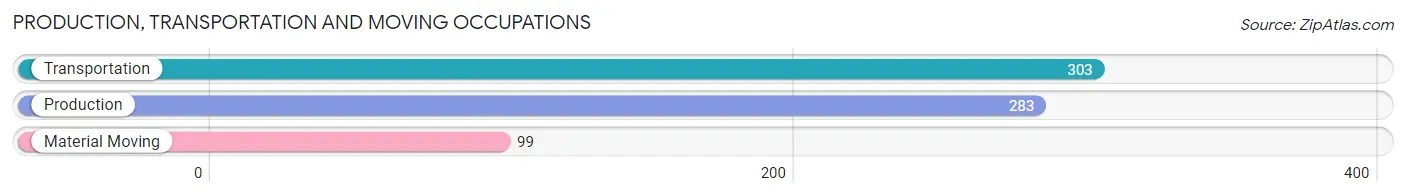
Production, Transportation and Moving Occupations by Sex
| Occupation | Male | Female |
| Production | 255 (90.1%) | 28 (9.9%) |
| Transportation | 292 (96.4%) | 11 (3.6%) |
| Material Moving | 99 (100.0%) | 0 (0.0%) |
| Total (Category) | 646 (94.3%) | 39 (5.7%) |
| Total (Overall) | 3,452 (54.3%) | 2,908 (45.7%) |
Employment Industries by Sex in Mingo County
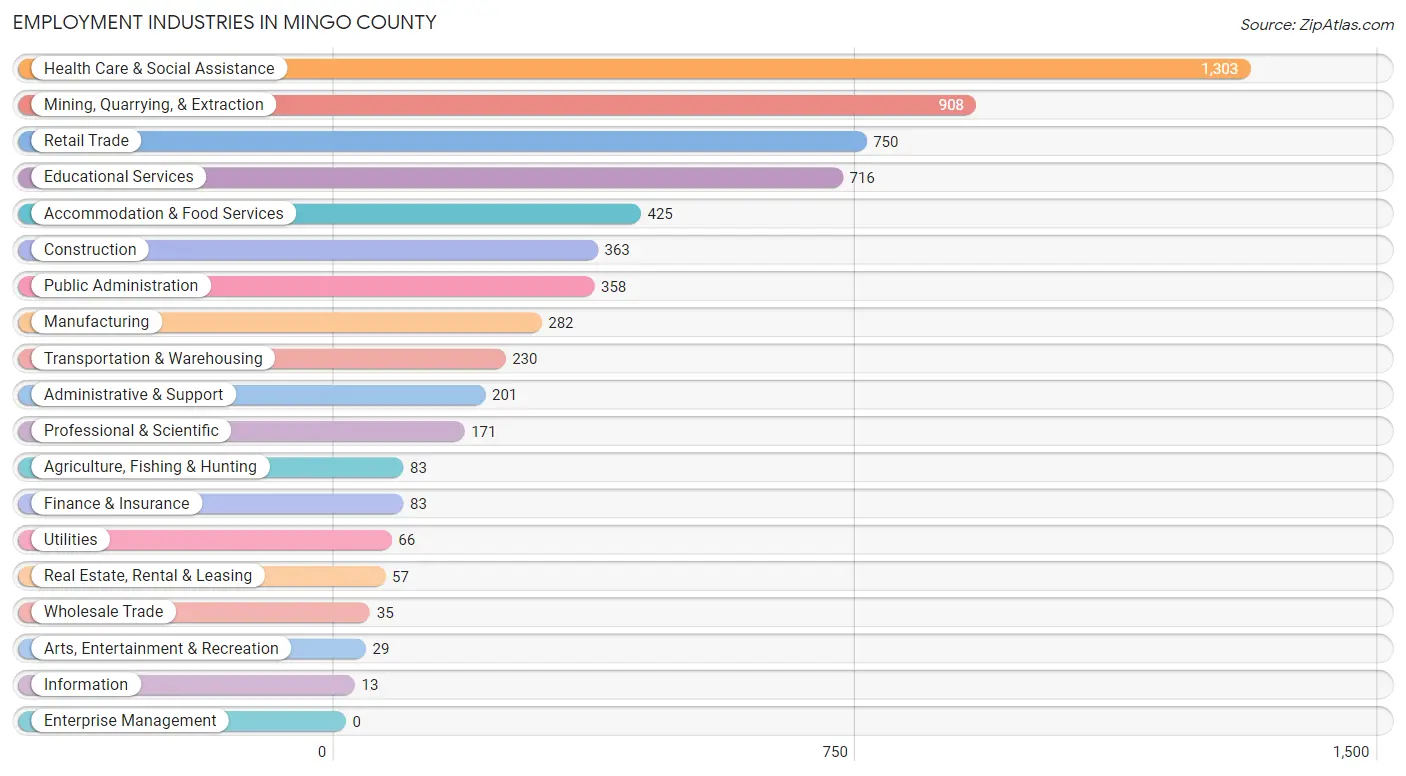
Employment Industries in Mingo County
The major employment industries in Mingo County include Health Care & Social Assistance (1,303 | 20.5%), Mining, Quarrying, & Extraction (908 | 14.3%), Retail Trade (750 | 11.8%), Educational Services (716 | 11.3%), and Accommodation & Food Services (425 | 6.7%).
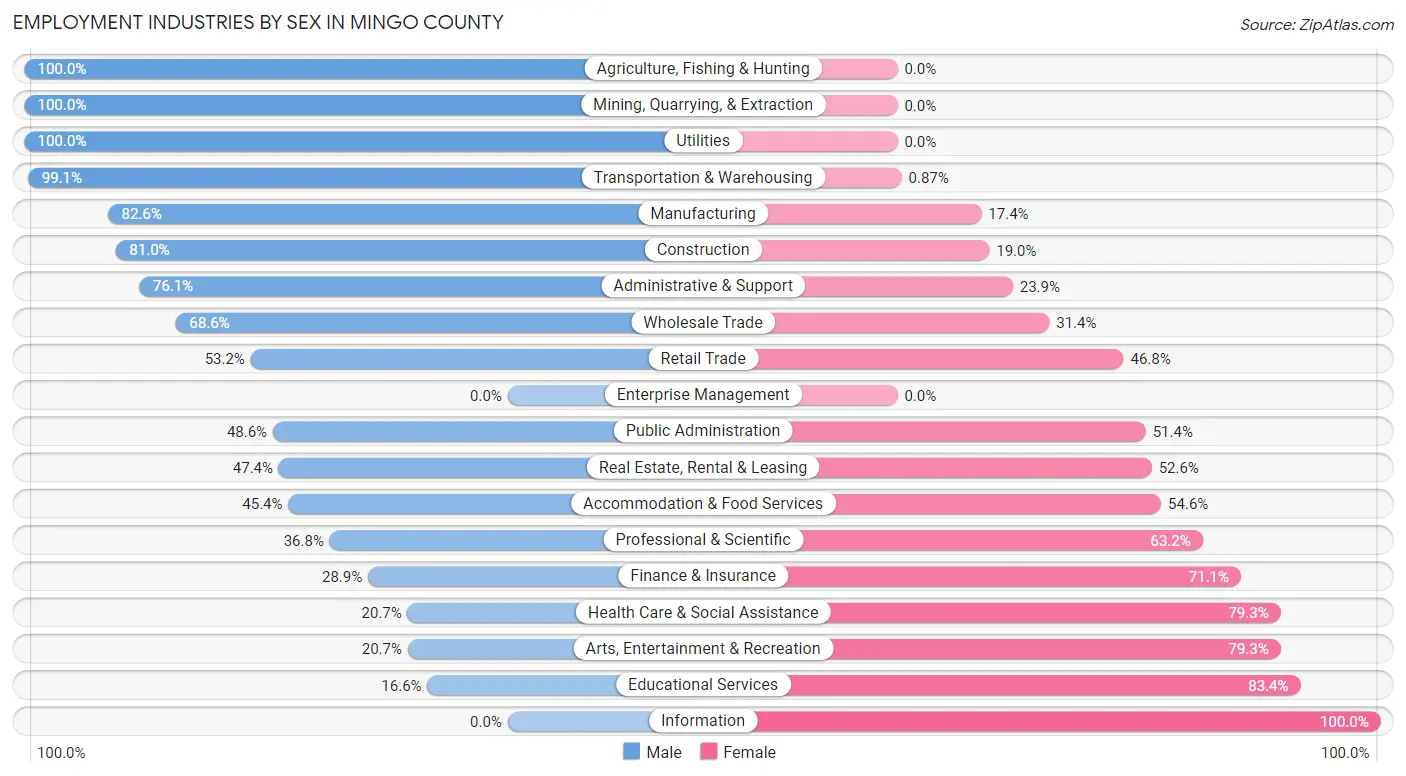
Employment Industries by Sex in Mingo County
The Mingo County industries that see more men than women are Agriculture, Fishing & Hunting (100.0%), Mining, Quarrying, & Extraction (100.0%), and Utilities (100.0%), whereas the industries that tend to have a higher number of women are Information (100.0%), Educational Services (83.4%), and Arts, Entertainment & Recreation (79.3%).
| Industry | Male | Female |
| Agriculture, Fishing & Hunting | 83 (100.0%) | 0 (0.0%) |
| Mining, Quarrying, & Extraction | 908 (100.0%) | 0 (0.0%) |
| Construction | 294 (81.0%) | 69 (19.0%) |
| Manufacturing | 233 (82.6%) | 49 (17.4%) |
| Wholesale Trade | 24 (68.6%) | 11 (31.4%) |
| Retail Trade | 399 (53.2%) | 351 (46.8%) |
| Transportation & Warehousing | 228 (99.1%) | 2 (0.9%) |
| Utilities | 66 (100.0%) | 0 (0.0%) |
| Information | 0 (0.0%) | 13 (100.0%) |
| Finance & Insurance | 24 (28.9%) | 59 (71.1%) |
| Real Estate, Rental & Leasing | 27 (47.4%) | 30 (52.6%) |
| Professional & Scientific | 63 (36.8%) | 108 (63.2%) |
| Enterprise Management | 0 (0.0%) | 0 (0.0%) |
| Administrative & Support | 153 (76.1%) | 48 (23.9%) |
| Educational Services | 119 (16.6%) | 597 (83.4%) |
| Health Care & Social Assistance | 270 (20.7%) | 1,033 (79.3%) |
| Arts, Entertainment & Recreation | 6 (20.7%) | 23 (79.3%) |
| Accommodation & Food Services | 193 (45.4%) | 232 (54.6%) |
| Public Administration | 174 (48.6%) | 184 (51.4%) |
| Total | 3,452 (54.3%) | 2,908 (45.7%) |
Education in Mingo County
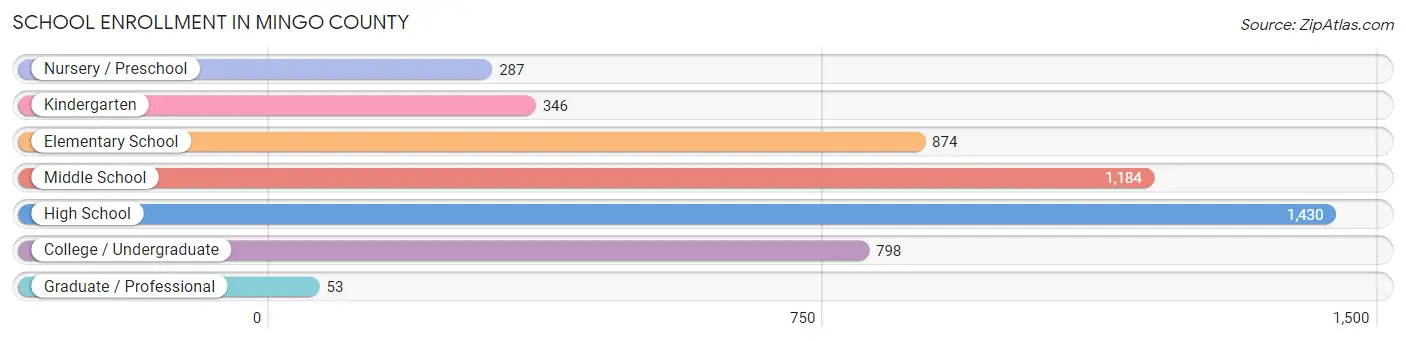
School Enrollment in Mingo County
The most common levels of schooling among the 4,972 students in Mingo County are high school (1,430 | 28.8%), middle school (1,184 | 23.8%), and elementary school (874 | 17.6%).
| School Level | # Students | % Students |
| Nursery / Preschool | 287 | 5.8% |
| Kindergarten | 346 | 7.0% |
| Elementary School | 874 | 17.6% |
| Middle School | 1,184 | 23.8% |
| High School | 1,430 | 28.8% |
| College / Undergraduate | 798 | 16.1% |
| Graduate / Professional | 53 | 1.1% |
| Total | 4,972 | 100.0% |
School Enrollment by Age by Funding Source in Mingo County
Out of a total of 4,972 students who are enrolled in schools in Mingo County, 472 (9.5%) attend a private institution, while the remaining 4,500 (90.5%) are enrolled in public schools. The age group of 35 years and over has the highest likelihood of being enrolled in private schools, with 32 (20.6% in the age bracket) enrolled. Conversely, the age group of 18 to 19 year olds has the lowest likelihood of being enrolled in a private school, with 346 (97.2% in the age bracket) attending a public institution.
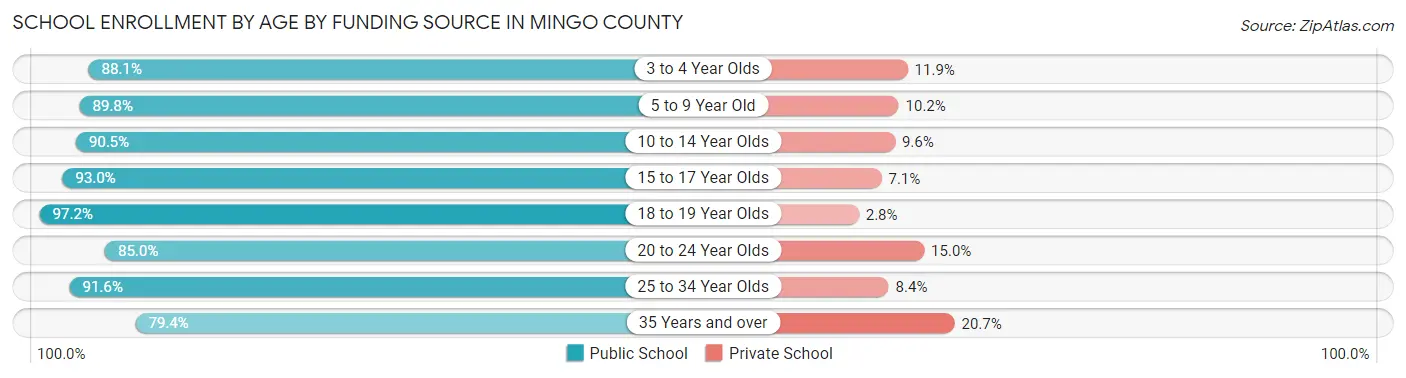
| Age Bracket | Public School | Private School |
| 3 to 4 Year Olds | 229 (88.1%) | 31 (11.9%) |
| 5 to 9 Year Old | 948 (89.8%) | 108 (10.2%) |
| 10 to 14 Year Olds | 1,420 (90.4%) | 150 (9.6%) |
| 15 to 17 Year Olds | 975 (92.9%) | 74 (7.0%) |
| 18 to 19 Year Olds | 346 (97.2%) | 10 (2.8%) |
| 20 to 24 Year Olds | 295 (85.0%) | 52 (15.0%) |
| 25 to 34 Year Olds | 164 (91.6%) | 15 (8.4%) |
| 35 Years and over | 123 (79.3%) | 32 (20.6%) |
| Total | 4,500 (90.5%) | 472 (9.5%) |
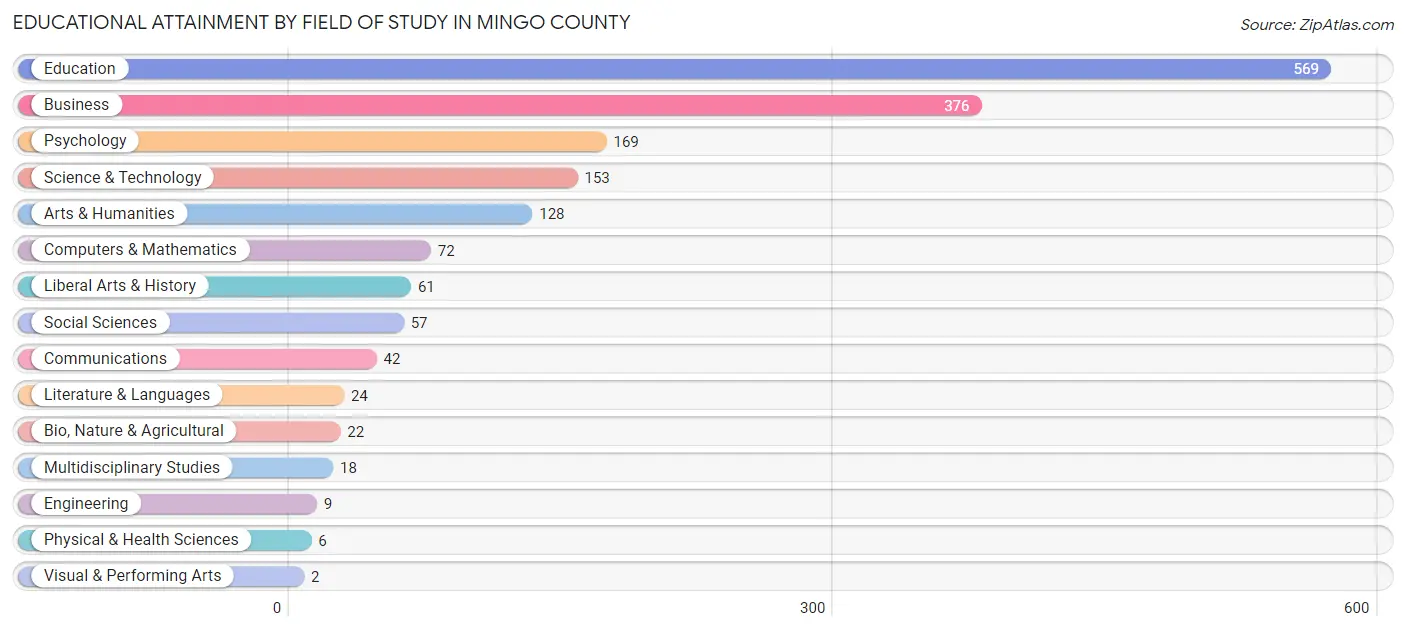
Educational Attainment by Field of Study in Mingo County
Education (569 | 33.3%), business (376 | 22.0%), psychology (169 | 9.9%), science & technology (153 | 9.0%), and arts & humanities (128 | 7.5%) are the most common fields of study among 1,708 individuals in Mingo County who have obtained a bachelor's degree or higher.
| Field of Study | # Graduates | % Graduates |
| Computers & Mathematics | 72 | 4.2% |
| Bio, Nature & Agricultural | 22 | 1.3% |
| Physical & Health Sciences | 6 | 0.4% |
| Psychology | 169 | 9.9% |
| Social Sciences | 57 | 3.3% |
| Engineering | 9 | 0.5% |
| Multidisciplinary Studies | 18 | 1.1% |
| Science & Technology | 153 | 9.0% |
| Business | 376 | 22.0% |
| Education | 569 | 33.3% |
| Literature & Languages | 24 | 1.4% |
| Liberal Arts & History | 61 | 3.6% |
| Visual & Performing Arts | 2 | 0.1% |
| Communications | 42 | 2.5% |
| Arts & Humanities | 128 | 7.5% |
| Total | 1,708 | 100.0% |
Transportation & Commute in Mingo County
Vehicle Availability by Sex in Mingo County
The most prevalent vehicle ownership categories in Mingo County are males with 2 vehicles (1,227, accounting for 37.7%) and females with 2 vehicles (1,050, making up 44.5%).
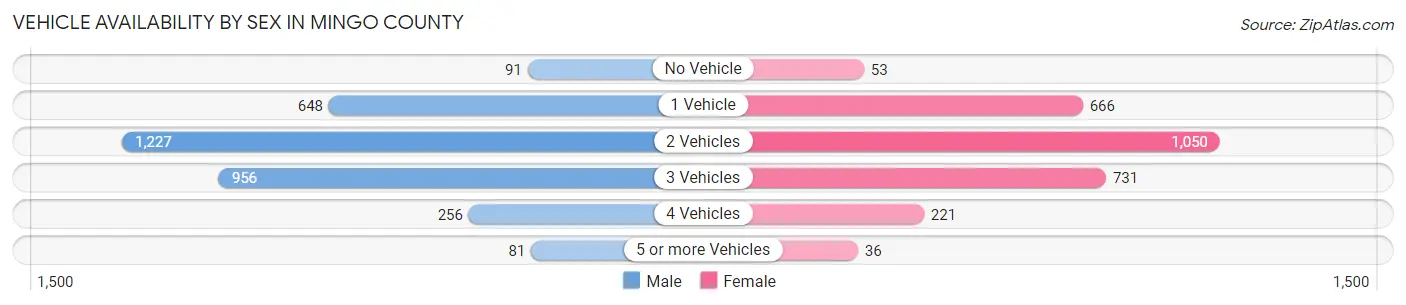
| Vehicles Available | Male | Female |
| No Vehicle | 91 (2.8%) | 53 (1.9%) |
| 1 Vehicle | 648 (19.9%) | 666 (24.2%) |
| 2 Vehicles | 1,227 (37.7%) | 1,050 (38.1%) |
| 3 Vehicles | 956 (29.3%) | 731 (26.5%) |
| 4 Vehicles | 256 (7.9%) | 221 (8.0%) |
| 5 or more Vehicles | 81 (2.5%) | 36 (1.3%) |
| Total | 3,259 (100.0%) | 2,757 (100.0%) |
Commute Time in Mingo County
The most frequently occuring commute durations in Mingo County are 30 to 34 minutes (737 commuters, 12.9%), 45 to 59 minutes (653 commuters, 11.4%), and 15 to 19 minutes (606 commuters, 10.6%).
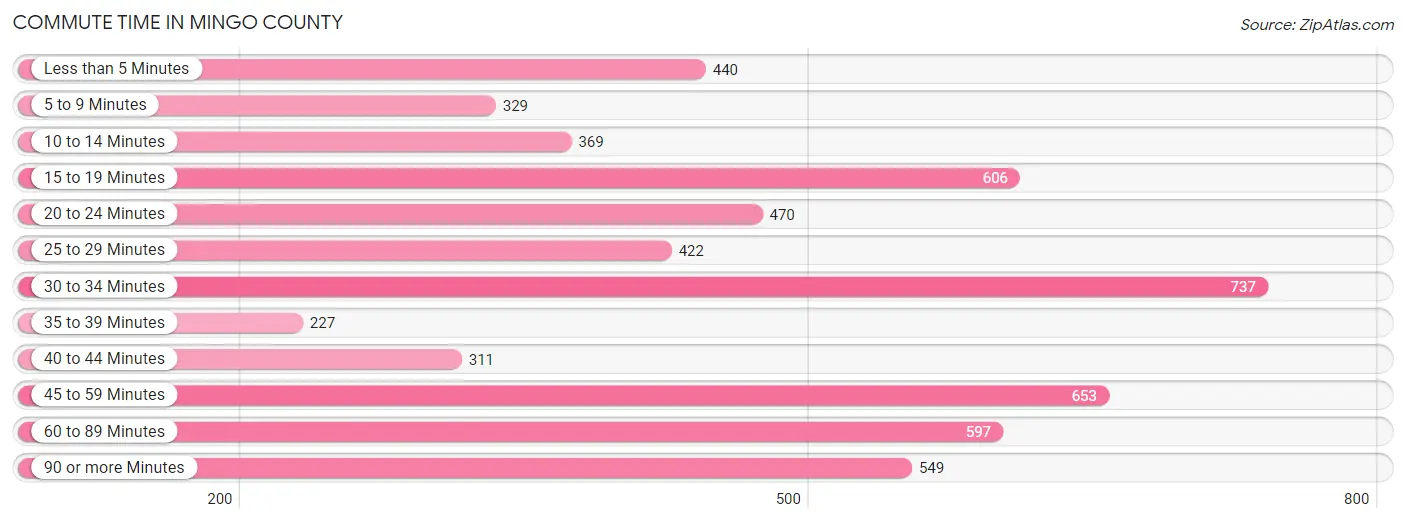
| Commute Time | # Commuters | % Commuters |
| Less than 5 Minutes | 440 | 7.7% |
| 5 to 9 Minutes | 329 | 5.8% |
| 10 to 14 Minutes | 369 | 6.5% |
| 15 to 19 Minutes | 606 | 10.6% |
| 20 to 24 Minutes | 470 | 8.2% |
| 25 to 29 Minutes | 422 | 7.4% |
| 30 to 34 Minutes | 737 | 12.9% |
| 35 to 39 Minutes | 227 | 4.0% |
| 40 to 44 Minutes | 311 | 5.4% |
| 45 to 59 Minutes | 653 | 11.4% |
| 60 to 89 Minutes | 597 | 10.5% |
| 90 or more Minutes | 549 | 9.6% |
Commute Time by Sex in Mingo County
The most common commute times in Mingo County are 60 to 89 minutes (488 commuters, 15.3%) for males and 45 to 59 minutes (336 commuters, 13.3%) for females.
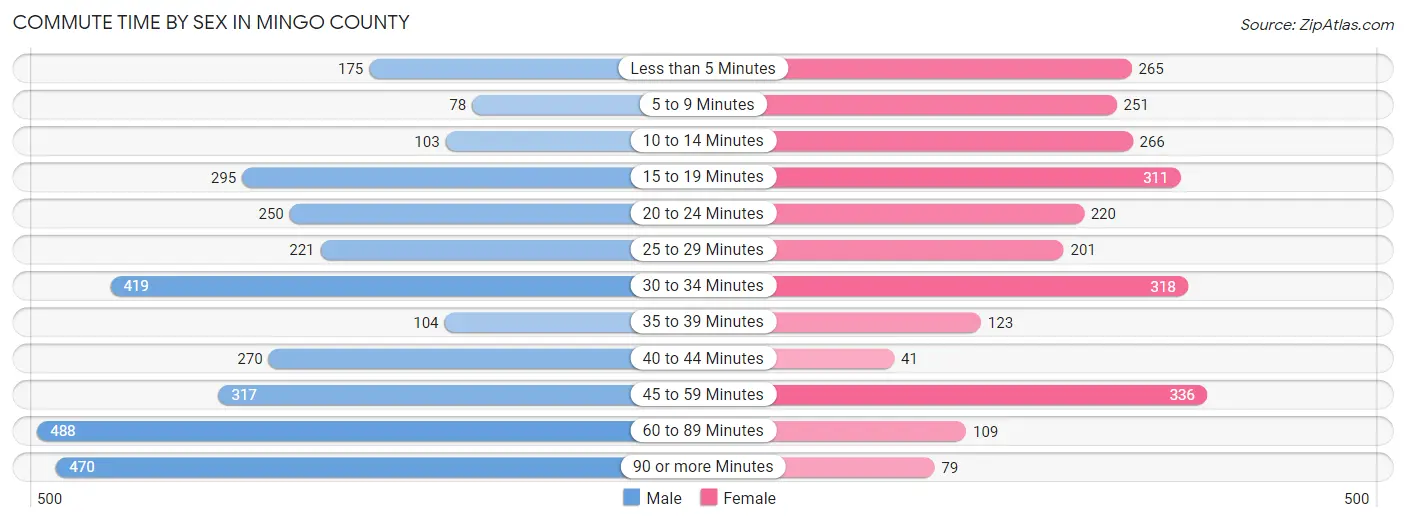
| Commute Time | Male | Female |
| Less than 5 Minutes | 175 (5.5%) | 265 (10.5%) |
| 5 to 9 Minutes | 78 (2.5%) | 251 (10.0%) |
| 10 to 14 Minutes | 103 (3.2%) | 266 (10.6%) |
| 15 to 19 Minutes | 295 (9.2%) | 311 (12.3%) |
| 20 to 24 Minutes | 250 (7.8%) | 220 (8.7%) |
| 25 to 29 Minutes | 221 (6.9%) | 201 (8.0%) |
| 30 to 34 Minutes | 419 (13.1%) | 318 (12.6%) |
| 35 to 39 Minutes | 104 (3.3%) | 123 (4.9%) |
| 40 to 44 Minutes | 270 (8.5%) | 41 (1.6%) |
| 45 to 59 Minutes | 317 (9.9%) | 336 (13.3%) |
| 60 to 89 Minutes | 488 (15.3%) | 109 (4.3%) |
| 90 or more Minutes | 470 (14.7%) | 79 (3.1%) |
Time of Departure to Work by Sex in Mingo County
The most frequent times of departure to work in Mingo County are 12:00 PM to 3:59 PM (471, 14.8%) for males and 8:00 AM to 8:29 AM (354, 14.1%) for females.
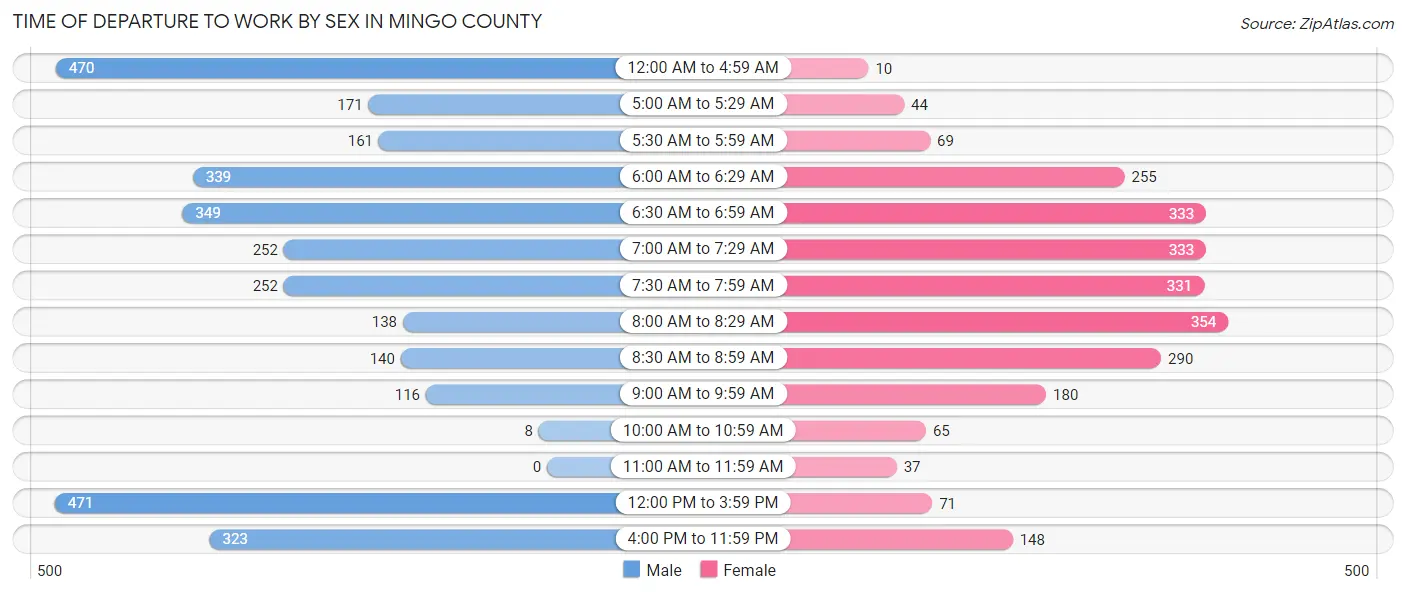
| Time of Departure | Male | Female |
| 12:00 AM to 4:59 AM | 470 (14.7%) | 10 (0.4%) |
| 5:00 AM to 5:29 AM | 171 (5.4%) | 44 (1.8%) |
| 5:30 AM to 5:59 AM | 161 (5.1%) | 69 (2.7%) |
| 6:00 AM to 6:29 AM | 339 (10.6%) | 255 (10.1%) |
| 6:30 AM to 6:59 AM | 349 (10.9%) | 333 (13.2%) |
| 7:00 AM to 7:29 AM | 252 (7.9%) | 333 (13.2%) |
| 7:30 AM to 7:59 AM | 252 (7.9%) | 331 (13.1%) |
| 8:00 AM to 8:29 AM | 138 (4.3%) | 354 (14.1%) |
| 8:30 AM to 8:59 AM | 140 (4.4%) | 290 (11.5%) |
| 9:00 AM to 9:59 AM | 116 (3.6%) | 180 (7.1%) |
| 10:00 AM to 10:59 AM | 8 (0.3%) | 65 (2.6%) |
| 11:00 AM to 11:59 AM | 0 (0.0%) | 37 (1.5%) |
| 12:00 PM to 3:59 PM | 471 (14.8%) | 71 (2.8%) |
| 4:00 PM to 11:59 PM | 323 (10.1%) | 148 (5.9%) |
| Total | 3,190 (100.0%) | 2,520 (100.0%) |
Housing Occupancy in Mingo County
Occupancy by Ownership in Mingo County
Of the total 9,093 dwellings in Mingo County, owner-occupied units account for 6,597 (72.6%), while renter-occupied units make up 2,496 (27.5%).
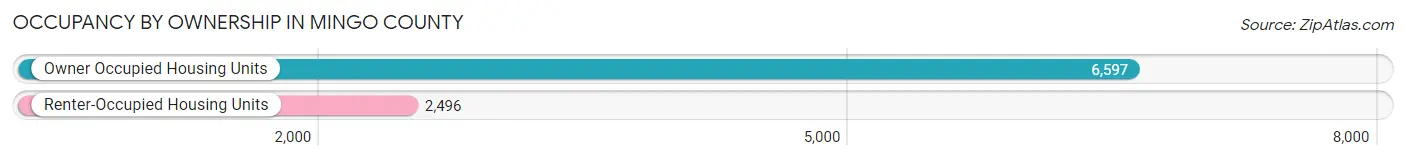
| Occupancy | # Housing Units | % Housing Units |
| Owner Occupied Housing Units | 6,597 | 72.6% |
| Renter-Occupied Housing Units | 2,496 | 27.5% |
| Total Occupied Housing Units | 9,093 | 100.0% |
Occupancy by Household Size in Mingo County
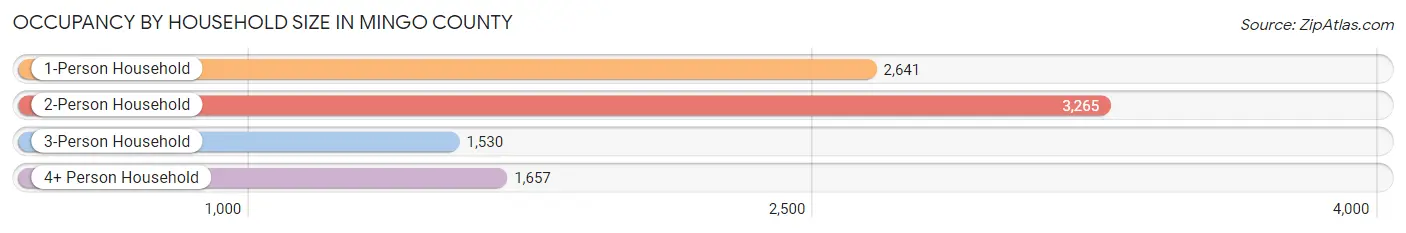
| Household Size | # Housing Units | % Housing Units |
| 1-Person Household | 2,641 | 29.0% |
| 2-Person Household | 3,265 | 35.9% |
| 3-Person Household | 1,530 | 16.8% |
| 4+ Person Household | 1,657 | 18.2% |
| Total Housing Units | 9,093 | 100.0% |
Occupancy by Ownership by Household Size in Mingo County
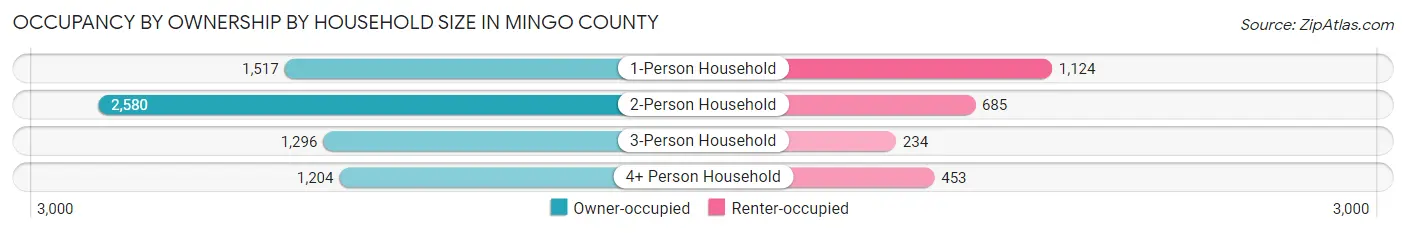
| Household Size | Owner-occupied | Renter-occupied |
| 1-Person Household | 1,517 (57.4%) | 1,124 (42.6%) |
| 2-Person Household | 2,580 (79.0%) | 685 (21.0%) |
| 3-Person Household | 1,296 (84.7%) | 234 (15.3%) |
| 4+ Person Household | 1,204 (72.7%) | 453 (27.3%) |
| Total Housing Units | 6,597 (72.6%) | 2,496 (27.5%) |
Occupancy by Educational Attainment in Mingo County
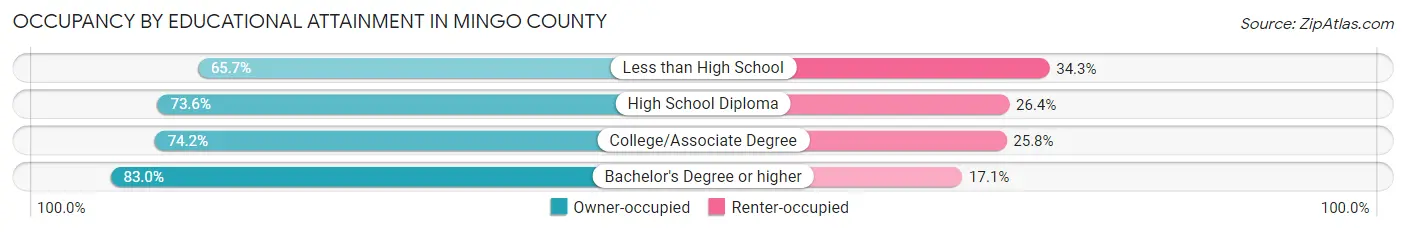
| Household Size | Owner-occupied | Renter-occupied |
| Less than High School | 1,580 (65.7%) | 826 (34.3%) |
| High School Diploma | 2,699 (73.6%) | 966 (26.4%) |
| College/Associate Degree | 1,598 (74.2%) | 556 (25.8%) |
| Bachelor's Degree or higher | 720 (83.0%) | 148 (17.1%) |
Occupancy by Age of Householder in Mingo County
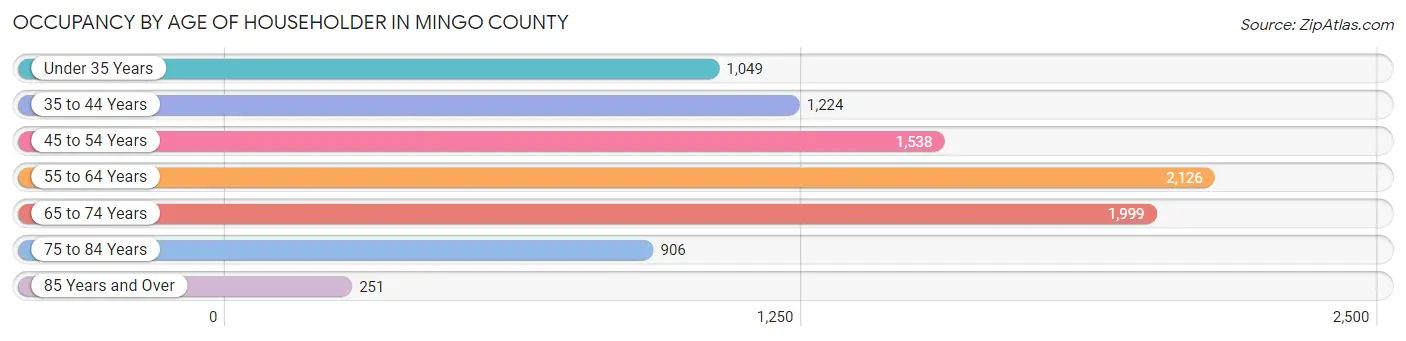
| Age Bracket | # Households | % Households |
| Under 35 Years | 1,049 | 11.5% |
| 35 to 44 Years | 1,224 | 13.5% |
| 45 to 54 Years | 1,538 | 16.9% |
| 55 to 64 Years | 2,126 | 23.4% |
| 65 to 74 Years | 1,999 | 22.0% |
| 75 to 84 Years | 906 | 10.0% |
| 85 Years and Over | 251 | 2.8% |
| Total | 9,093 | 100.0% |
Housing Finances in Mingo County
Median Income by Occupancy in Mingo County
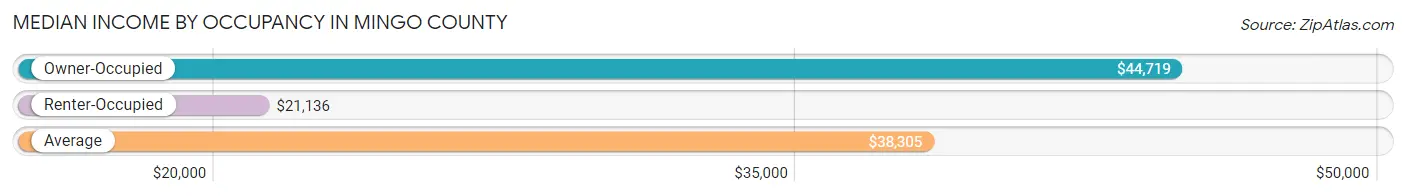
| Occupancy Type | # Households | Median Income |
| Owner-Occupied | 6,597 (72.6%) | $44,719 |
| Renter-Occupied | 2,496 (27.5%) | $21,136 |
| Average | 9,093 (100.0%) | $38,305 |
Occupancy by Householder Income Bracket in Mingo County
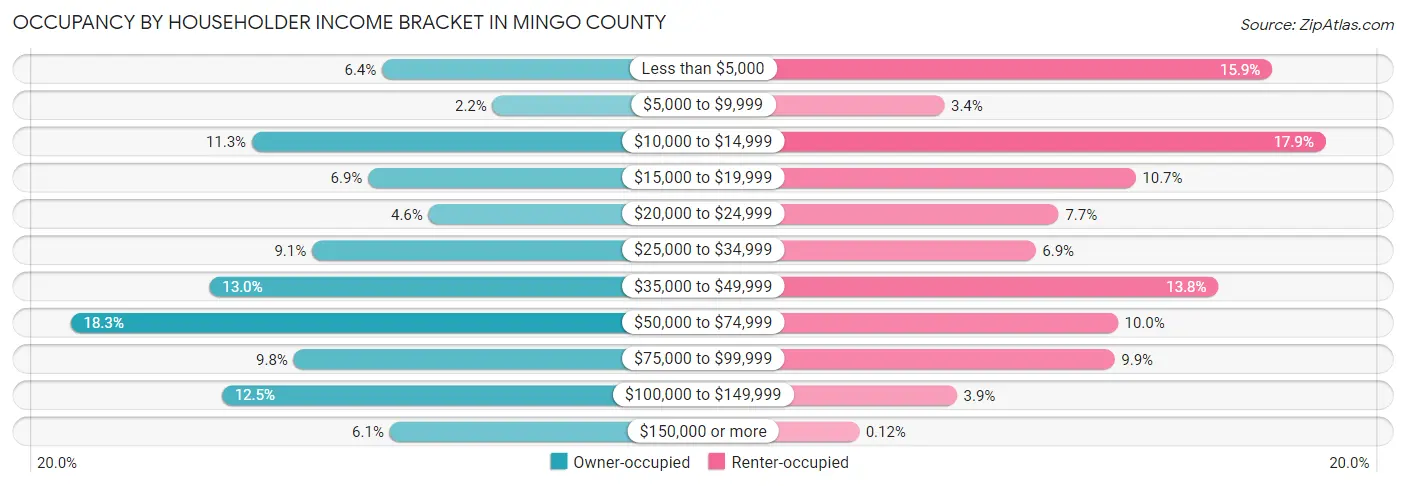
| Income Bracket | Owner-occupied | Renter-occupied |
| Less than $5,000 | 421 (6.4%) | 396 (15.9%) |
| $5,000 to $9,999 | 143 (2.2%) | 84 (3.4%) |
| $10,000 to $14,999 | 748 (11.3%) | 447 (17.9%) |
| $15,000 to $19,999 | 456 (6.9%) | 266 (10.7%) |
| $20,000 to $24,999 | 304 (4.6%) | 193 (7.7%) |
| $25,000 to $34,999 | 597 (9.0%) | 171 (6.9%) |
| $35,000 to $49,999 | 855 (13.0%) | 345 (13.8%) |
| $50,000 to $74,999 | 1,204 (18.2%) | 249 (10.0%) |
| $75,000 to $99,999 | 643 (9.8%) | 246 (9.9%) |
| $100,000 to $149,999 | 824 (12.5%) | 96 (3.8%) |
| $150,000 or more | 402 (6.1%) | 3 (0.1%) |
| Total | 6,597 (100.0%) | 2,496 (100.0%) |
Monthly Housing Cost Tiers in Mingo County
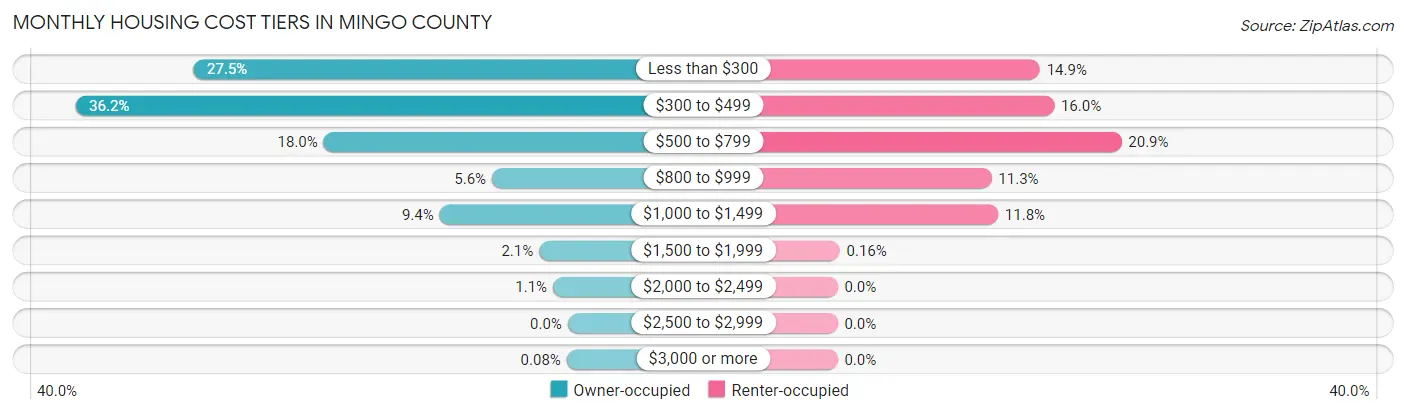
| Monthly Cost | Owner-occupied | Renter-occupied |
| Less than $300 | 1,816 (27.5%) | 372 (14.9%) |
| $300 to $499 | 2,388 (36.2%) | 398 (16.0%) |
| $500 to $799 | 1,186 (18.0%) | 522 (20.9%) |
| $800 to $999 | 368 (5.6%) | 283 (11.3%) |
| $1,000 to $1,499 | 623 (9.4%) | 295 (11.8%) |
| $1,500 to $1,999 | 139 (2.1%) | 4 (0.2%) |
| $2,000 to $2,499 | 72 (1.1%) | 0 (0.0%) |
| $2,500 to $2,999 | 0 (0.0%) | 0 (0.0%) |
| $3,000 or more | 5 (0.1%) | 0 (0.0%) |
| Total | 6,597 (100.0%) | 2,496 (100.0%) |
Physical Housing Characteristics in Mingo County
Housing Structures in Mingo County
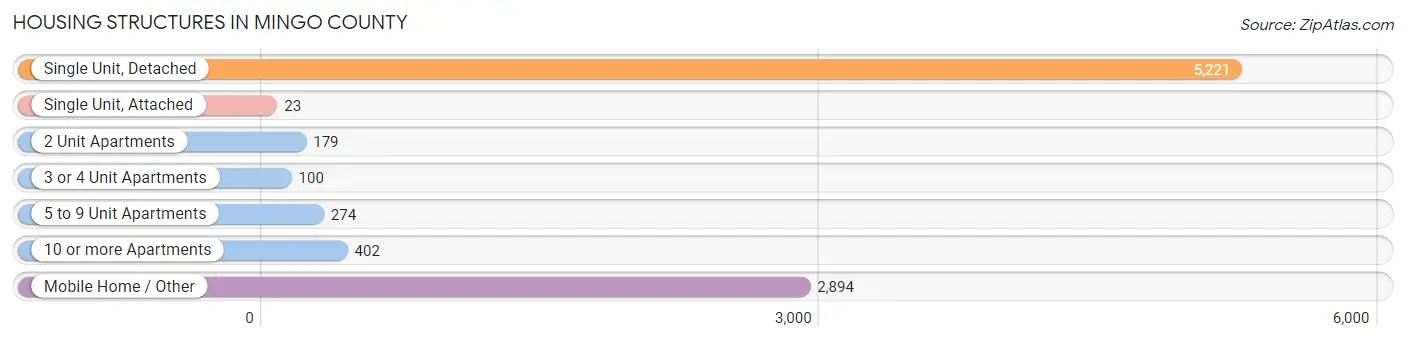
| Structure Type | # Housing Units | % Housing Units |
| Single Unit, Detached | 5,221 | 57.4% |
| Single Unit, Attached | 23 | 0.3% |
| 2 Unit Apartments | 179 | 2.0% |
| 3 or 4 Unit Apartments | 100 | 1.1% |
| 5 to 9 Unit Apartments | 274 | 3.0% |
| 10 or more Apartments | 402 | 4.4% |
| Mobile Home / Other | 2,894 | 31.8% |
| Total | 9,093 | 100.0% |
Housing Structures by Occupancy in Mingo County
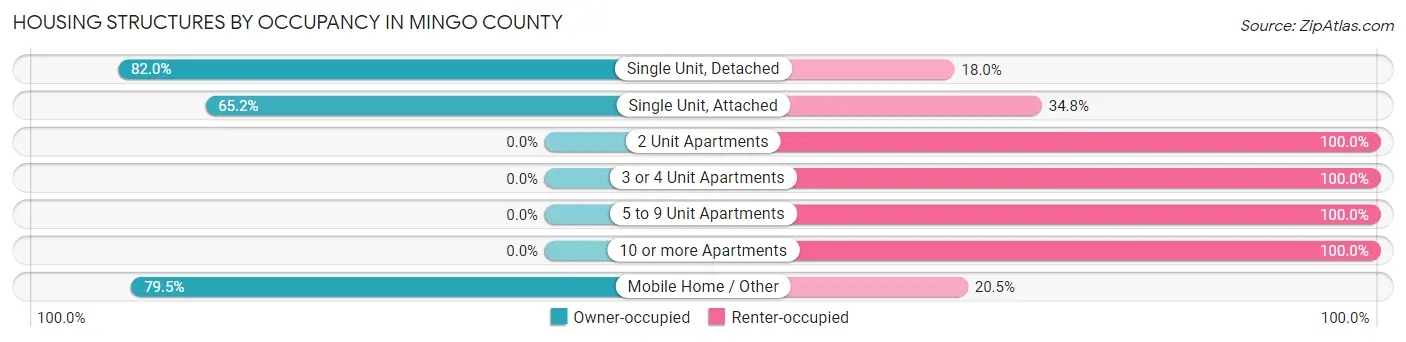
| Structure Type | Owner-occupied | Renter-occupied |
| Single Unit, Detached | 4,282 (82.0%) | 939 (18.0%) |
| Single Unit, Attached | 15 (65.2%) | 8 (34.8%) |
| 2 Unit Apartments | 0 (0.0%) | 179 (100.0%) |
| 3 or 4 Unit Apartments | 0 (0.0%) | 100 (100.0%) |
| 5 to 9 Unit Apartments | 0 (0.0%) | 274 (100.0%) |
| 10 or more Apartments | 0 (0.0%) | 402 (100.0%) |
| Mobile Home / Other | 2,300 (79.5%) | 594 (20.5%) |
| Total | 6,597 (72.6%) | 2,496 (27.5%) |
Housing Structures by Number of Rooms in Mingo County
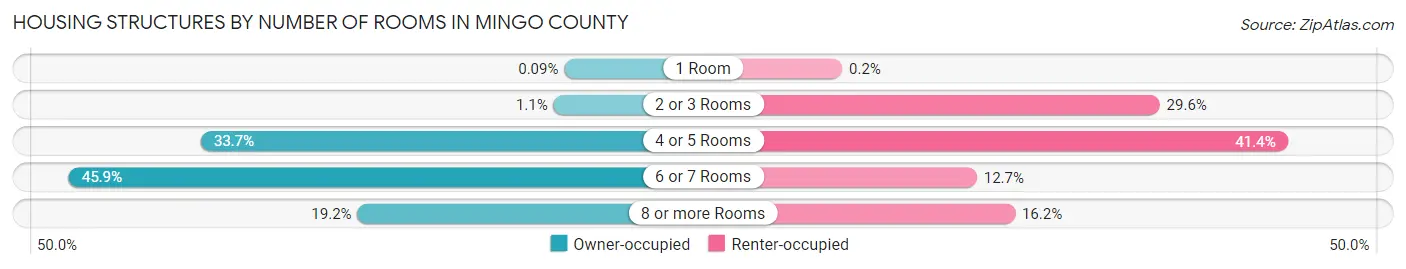
| Number of Rooms | Owner-occupied | Renter-occupied |
| 1 Room | 6 (0.1%) | 5 (0.2%) |
| 2 or 3 Rooms | 71 (1.1%) | 738 (29.6%) |
| 4 or 5 Rooms | 2,223 (33.7%) | 1,033 (41.4%) |
| 6 or 7 Rooms | 3,029 (45.9%) | 316 (12.7%) |
| 8 or more Rooms | 1,268 (19.2%) | 404 (16.2%) |
| Total | 6,597 (100.0%) | 2,496 (100.0%) |
Housing Structure by Heating Type in Mingo County
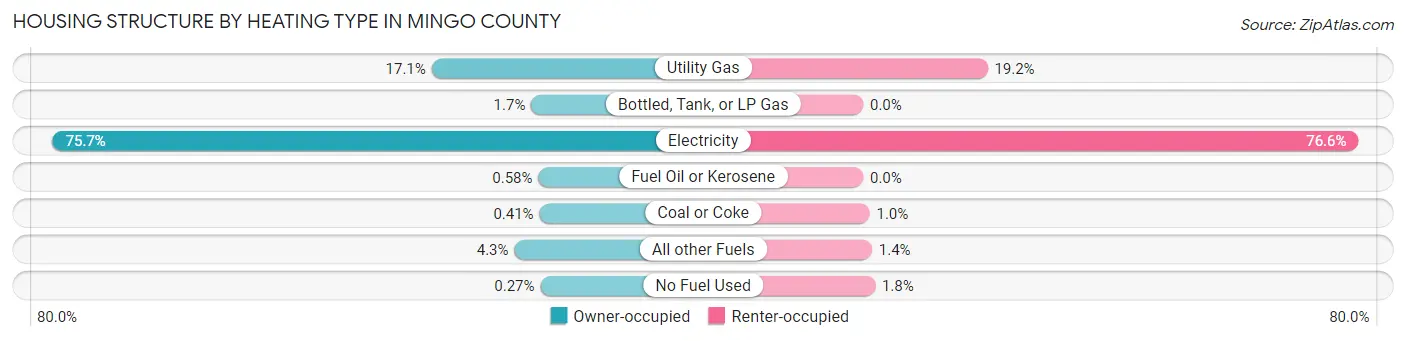
| Heating Type | Owner-occupied | Renter-occupied |
| Utility Gas | 1,127 (17.1%) | 480 (19.2%) |
| Bottled, Tank, or LP Gas | 111 (1.7%) | 0 (0.0%) |
| Electricity | 4,993 (75.7%) | 1,911 (76.6%) |
| Fuel Oil or Kerosene | 38 (0.6%) | 0 (0.0%) |
| Coal or Coke | 27 (0.4%) | 25 (1.0%) |
| All other Fuels | 283 (4.3%) | 34 (1.4%) |
| No Fuel Used | 18 (0.3%) | 46 (1.8%) |
| Total | 6,597 (100.0%) | 2,496 (100.0%) |
Household Vehicle Usage in Mingo County
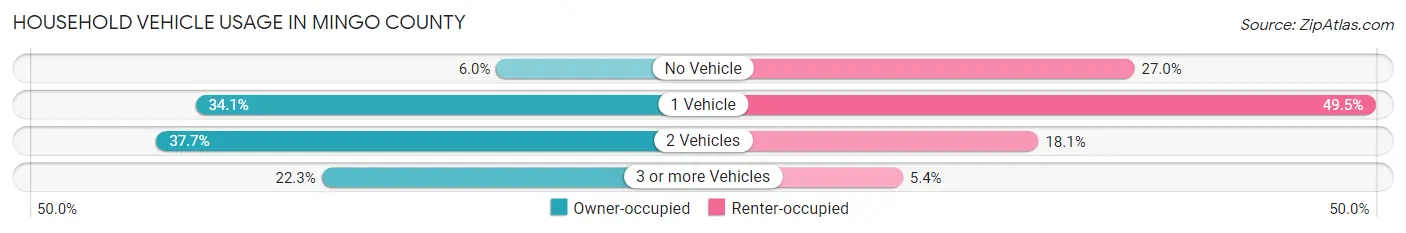
| Vehicles per Household | Owner-occupied | Renter-occupied |
| No Vehicle | 394 (6.0%) | 675 (27.0%) |
| 1 Vehicle | 2,246 (34.1%) | 1,235 (49.5%) |
| 2 Vehicles | 2,487 (37.7%) | 451 (18.1%) |
| 3 or more Vehicles | 1,470 (22.3%) | 135 (5.4%) |
| Total | 6,597 (100.0%) | 2,496 (100.0%) |
Real Estate & Mortgages in Mingo County
Real Estate and Mortgage Overview in Mingo County
| Characteristic | Without Mortgage | With Mortgage |
| Housing Units | 5,272 | 1,325 |
| Median Property Value | $84,700 | $112,100 |
| Median Household Income | $41,278 | $149 |
| Monthly Housing Costs | $366 | $5 |
| Real Estate Taxes | $358 | $180 |
Property Value by Mortgage Status in Mingo County
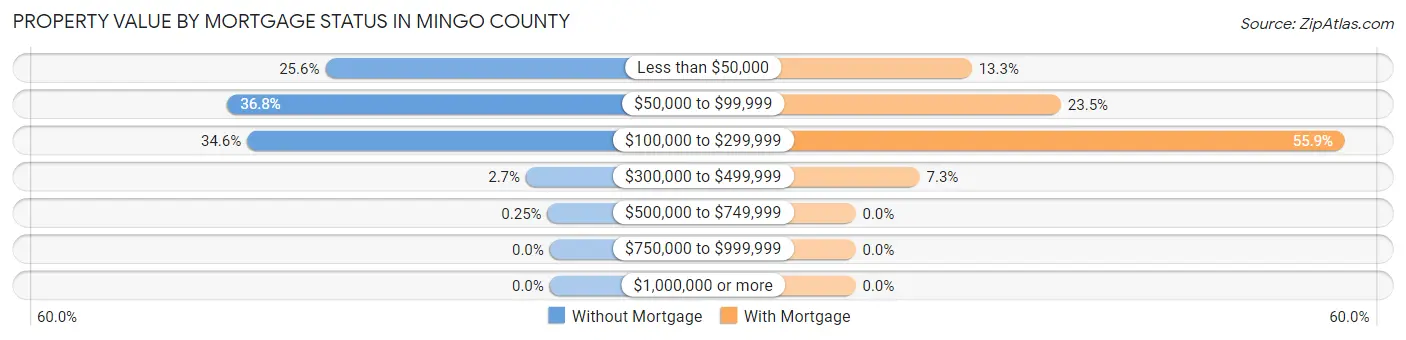
| Property Value | Without Mortgage | With Mortgage |
| Less than $50,000 | 1,352 (25.6%) | 176 (13.3%) |
| $50,000 to $99,999 | 1,941 (36.8%) | 311 (23.5%) |
| $100,000 to $299,999 | 1,823 (34.6%) | 741 (55.9%) |
| $300,000 to $499,999 | 143 (2.7%) | 97 (7.3%) |
| $500,000 to $749,999 | 13 (0.3%) | 0 (0.0%) |
| $750,000 to $999,999 | 0 (0.0%) | 0 (0.0%) |
| $1,000,000 or more | 0 (0.0%) | 0 (0.0%) |
| Total | 5,272 (100.0%) | 1,325 (100.0%) |
Household Income by Mortgage Status in Mingo County
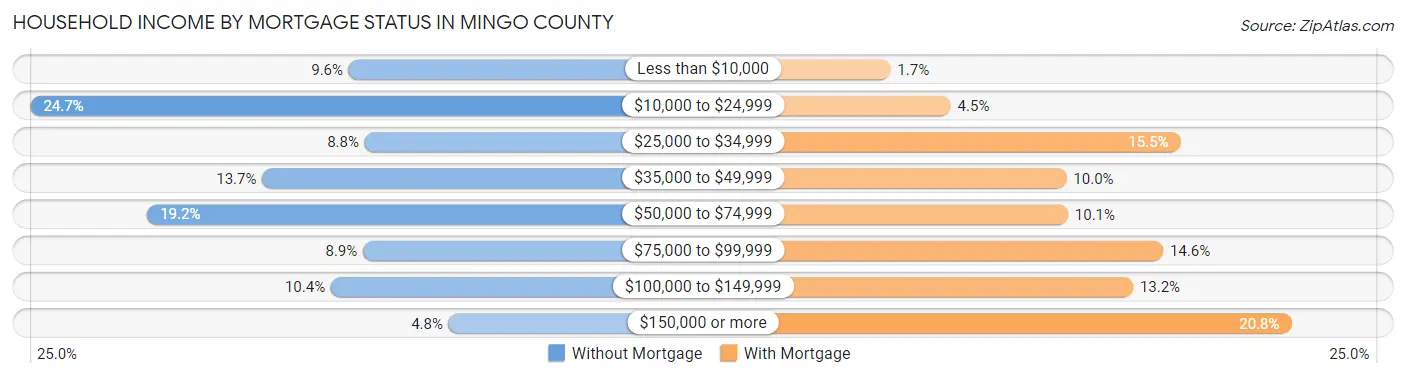
| Household Income | Without Mortgage | With Mortgage |
| Less than $10,000 | 504 (9.6%) | 22 (1.7%) |
| $10,000 to $24,999 | 1,303 (24.7%) | 60 (4.5%) |
| $25,000 to $34,999 | 464 (8.8%) | 205 (15.5%) |
| $35,000 to $49,999 | 721 (13.7%) | 133 (10.0%) |
| $50,000 to $74,999 | 1,010 (19.2%) | 134 (10.1%) |
| $75,000 to $99,999 | 468 (8.9%) | 194 (14.6%) |
| $100,000 to $149,999 | 549 (10.4%) | 175 (13.2%) |
| $150,000 or more | 253 (4.8%) | 275 (20.7%) |
| Total | 5,272 (100.0%) | 1,325 (100.0%) |
Property Value to Household Income Ratio in Mingo County
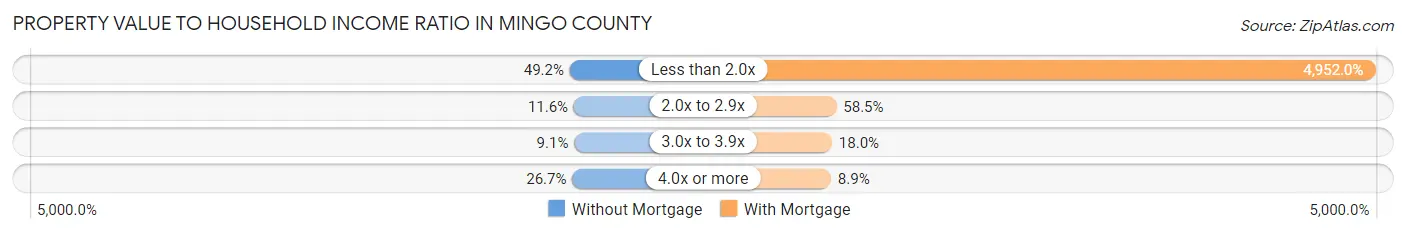
| Value-to-Income Ratio | Without Mortgage | With Mortgage |
| Less than 2.0x | 2,596 (49.2%) | 65,614 (4,952.0%) |
| 2.0x to 2.9x | 611 (11.6%) | 775 (58.5%) |
| 3.0x to 3.9x | 481 (9.1%) | 239 (18.0%) |
| 4.0x or more | 1,408 (26.7%) | 118 (8.9%) |
| Total | 5,272 (100.0%) | 1,325 (100.0%) |
Real Estate Taxes by Mortgage Status in Mingo County
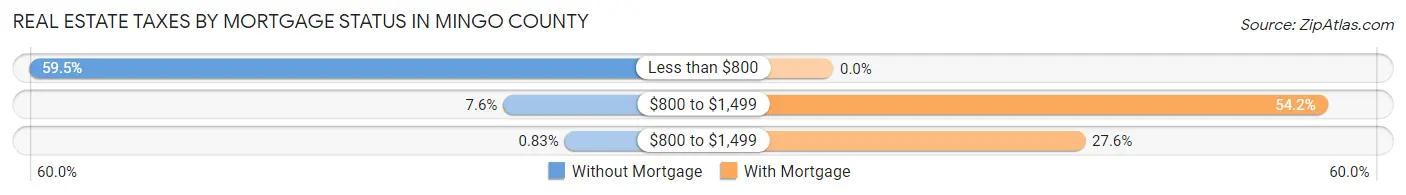
| Property Taxes | Without Mortgage | With Mortgage |
| Less than $800 | 3,138 (59.5%) | 0 (0.0%) |
| $800 to $1,499 | 398 (7.5%) | 718 (54.2%) |
| $800 to $1,499 | 44 (0.8%) | 366 (27.6%) |
| Total | 5,272 (100.0%) | 1,325 (100.0%) |
Health & Disability in Mingo County
Health Insurance Coverage by Age in Mingo County
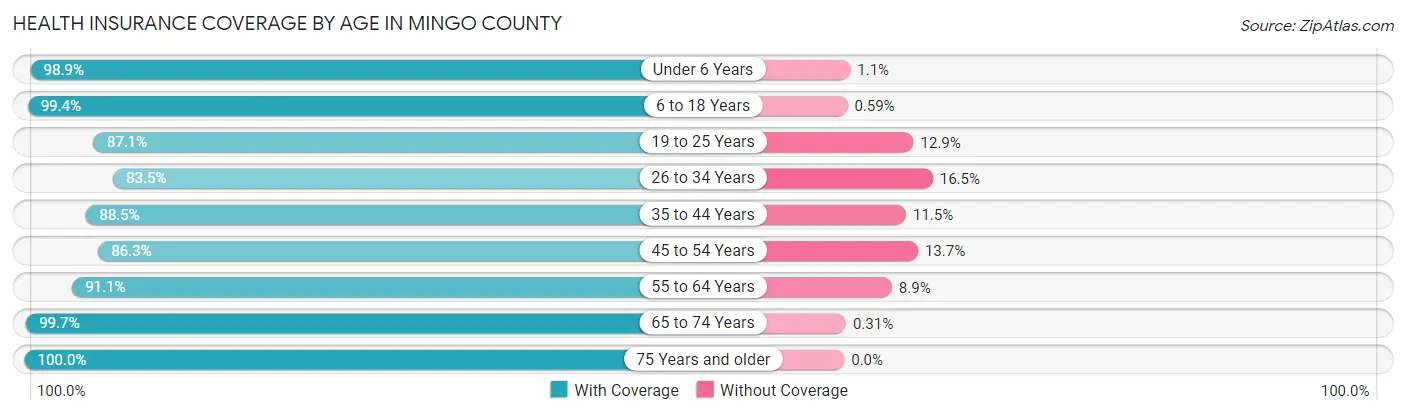
| Age Bracket | With Coverage | Without Coverage |
| Under 6 Years | 1,572 (98.9%) | 18 (1.1%) |
| 6 to 18 Years | 3,905 (99.4%) | 23 (0.6%) |
| 19 to 25 Years | 1,220 (87.1%) | 181 (12.9%) |
| 26 to 34 Years | 1,928 (83.5%) | 381 (16.5%) |
| 35 to 44 Years | 2,488 (88.5%) | 324 (11.5%) |
| 45 to 54 Years | 2,650 (86.3%) | 422 (13.7%) |
| 55 to 64 Years | 3,160 (91.1%) | 308 (8.9%) |
| 65 to 74 Years | 3,256 (99.7%) | 10 (0.3%) |
| 75 Years and older | 1,539 (100.0%) | 0 (0.0%) |
| Total | 21,718 (92.9%) | 1,667 (7.1%) |
Health Insurance Coverage by Citizenship Status in Mingo County
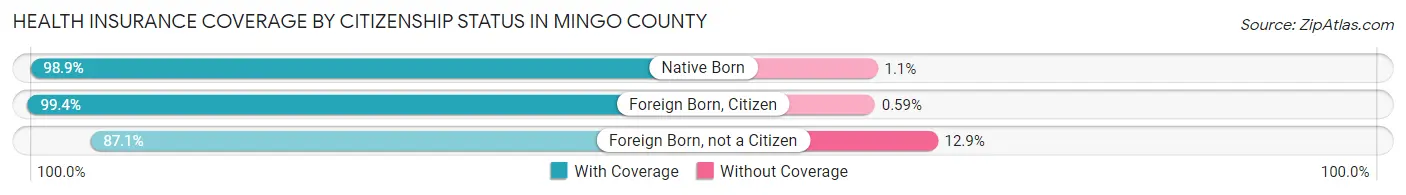
| Citizenship Status | With Coverage | Without Coverage |
| Native Born | 1,572 (98.9%) | 18 (1.1%) |
| Foreign Born, Citizen | 3,905 (99.4%) | 23 (0.6%) |
| Foreign Born, not a Citizen | 1,220 (87.1%) | 181 (12.9%) |
Health Insurance Coverage by Household Income in Mingo County
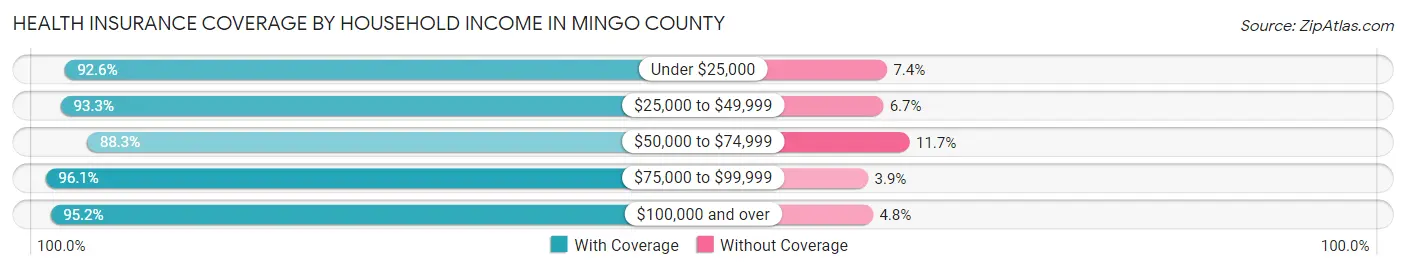
| Household Income | With Coverage | Without Coverage |
| Under $25,000 | 6,114 (92.6%) | 491 (7.4%) |
| $25,000 to $49,999 | 4,724 (93.3%) | 341 (6.7%) |
| $50,000 to $74,999 | 3,849 (88.3%) | 508 (11.7%) |
| $75,000 to $99,999 | 2,742 (96.1%) | 111 (3.9%) |
| $100,000 and over | 4,279 (95.2%) | 216 (4.8%) |
Public vs Private Health Insurance Coverage by Age in Mingo County
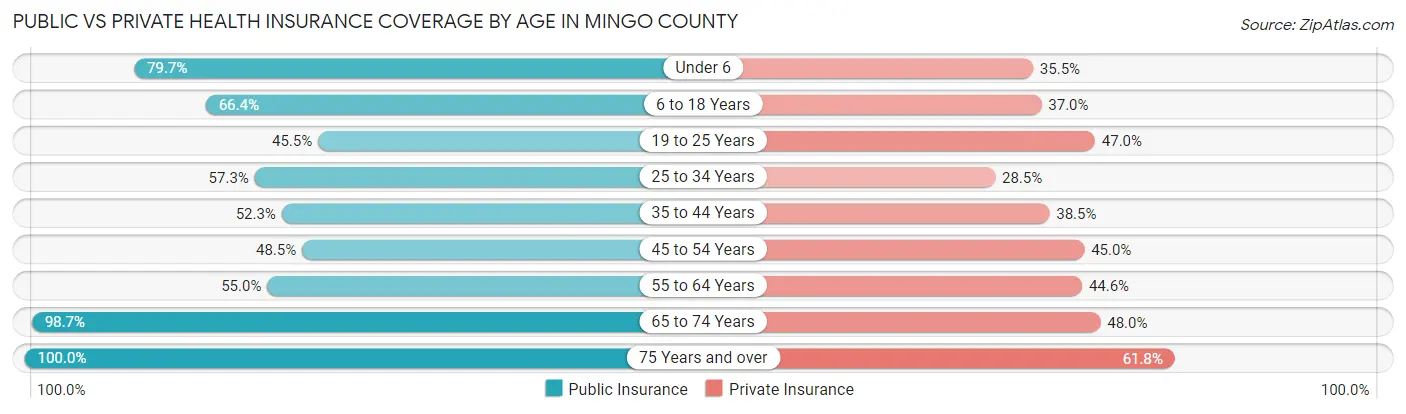
| Age Bracket | Public Insurance | Private Insurance |
| Under 6 | 1,267 (79.7%) | 564 (35.5%) |
| 6 to 18 Years | 2,607 (66.4%) | 1,455 (37.0%) |
| 19 to 25 Years | 638 (45.5%) | 658 (47.0%) |
| 25 to 34 Years | 1,323 (57.3%) | 657 (28.4%) |
| 35 to 44 Years | 1,470 (52.3%) | 1,083 (38.5%) |
| 45 to 54 Years | 1,490 (48.5%) | 1,382 (45.0%) |
| 55 to 64 Years | 1,906 (55.0%) | 1,546 (44.6%) |
| 65 to 74 Years | 3,223 (98.7%) | 1,567 (48.0%) |
| 75 Years and over | 1,539 (100.0%) | 951 (61.8%) |
| Total | 15,463 (66.1%) | 9,863 (42.2%) |
Disability Status by Sex by Age in Mingo County
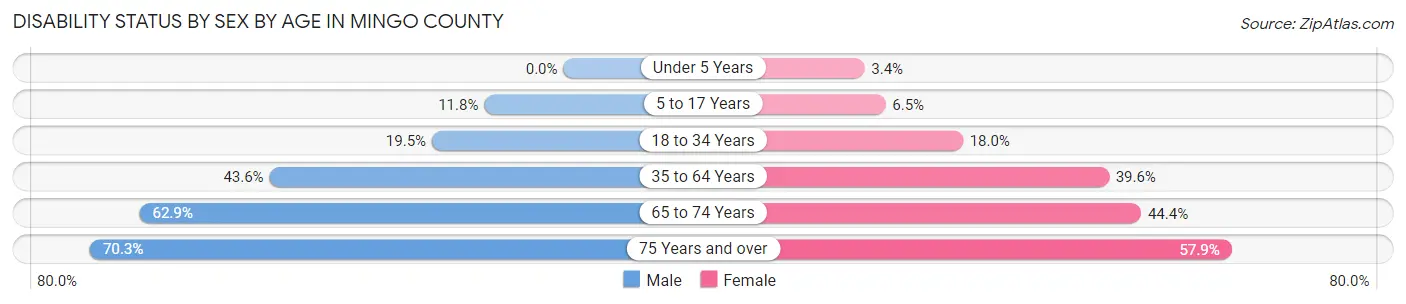
| Age Bracket | Male | Female |
| Under 5 Years | 0 (0.0%) | 22 (3.4%) |
| 5 to 17 Years | 247 (11.7%) | 116 (6.5%) |
| 18 to 34 Years | 394 (19.5%) | 353 (17.9%) |
| 35 to 64 Years | 1,992 (43.6%) | 1,897 (39.6%) |
| 65 to 74 Years | 949 (62.9%) | 781 (44.4%) |
| 75 Years and over | 466 (70.3%) | 507 (57.9%) |
Disability Class by Sex by Age in Mingo County
Disability Class: Hearing Difficulty
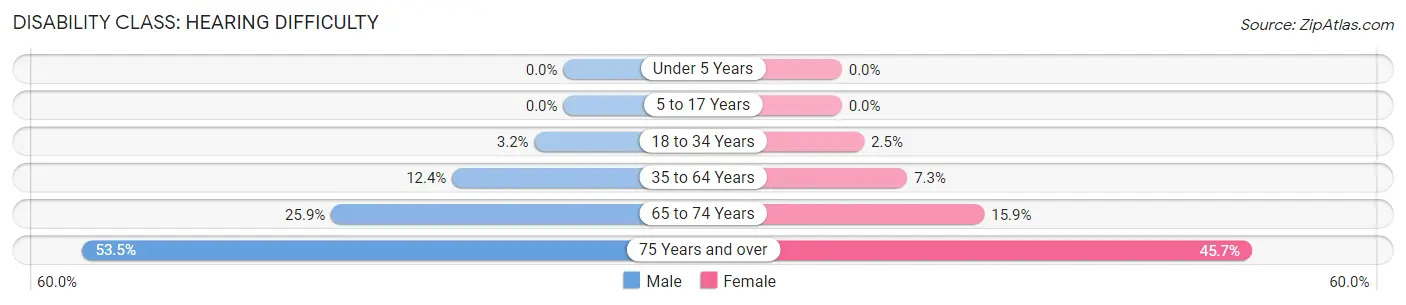
| Age Bracket | Male | Female |
| Under 5 Years | 0 (0.0%) | 0 (0.0%) |
| 5 to 17 Years | 0 (0.0%) | 0 (0.0%) |
| 18 to 34 Years | 65 (3.2%) | 49 (2.5%) |
| 35 to 64 Years | 565 (12.4%) | 349 (7.3%) |
| 65 to 74 Years | 390 (25.9%) | 279 (15.9%) |
| 75 Years and over | 355 (53.5%) | 400 (45.7%) |
Disability Class: Vision Difficulty
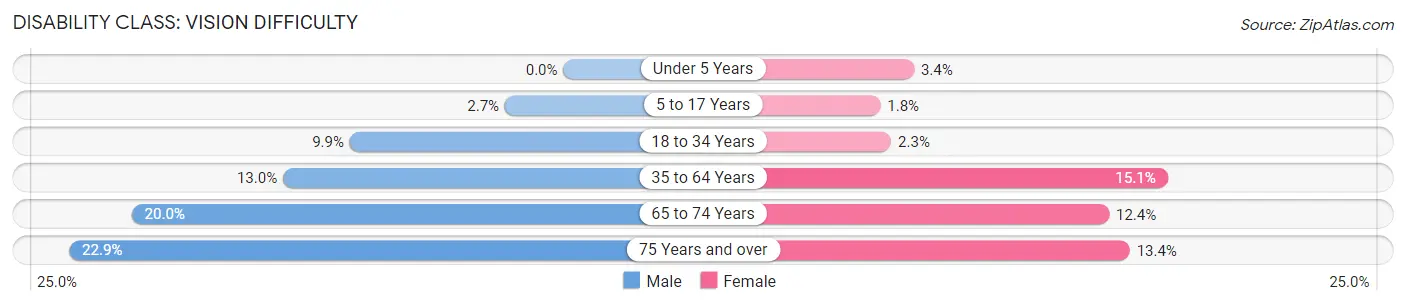
| Age Bracket | Male | Female |
| Under 5 Years | 0 (0.0%) | 22 (3.4%) |
| 5 to 17 Years | 57 (2.7%) | 32 (1.8%) |
| 18 to 34 Years | 200 (9.9%) | 45 (2.3%) |
| 35 to 64 Years | 594 (13.0%) | 724 (15.1%) |
| 65 to 74 Years | 302 (20.0%) | 218 (12.4%) |
| 75 Years and over | 152 (22.9%) | 117 (13.4%) |
Disability Class: Cognitive Difficulty
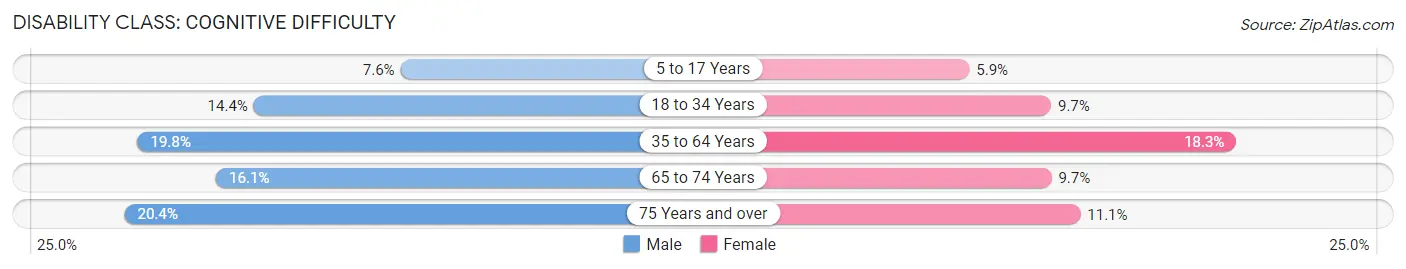
| Age Bracket | Male | Female |
| 5 to 17 Years | 159 (7.6%) | 106 (5.9%) |
| 18 to 34 Years | 290 (14.4%) | 191 (9.7%) |
| 35 to 64 Years | 902 (19.8%) | 876 (18.3%) |
| 65 to 74 Years | 243 (16.1%) | 171 (9.7%) |
| 75 Years and over | 135 (20.4%) | 97 (11.1%) |
Disability Class: Ambulatory Difficulty
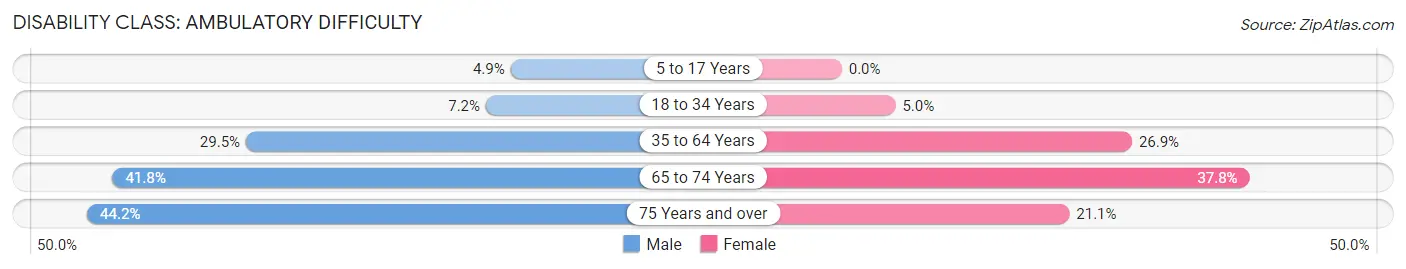
| Age Bracket | Male | Female |
| 5 to 17 Years | 103 (4.9%) | 0 (0.0%) |
| 18 to 34 Years | 145 (7.2%) | 98 (5.0%) |
| 35 to 64 Years | 1,345 (29.5%) | 1,289 (26.9%) |
| 65 to 74 Years | 631 (41.8%) | 665 (37.8%) |
| 75 Years and over | 293 (44.2%) | 185 (21.1%) |
Disability Class: Self-Care Difficulty
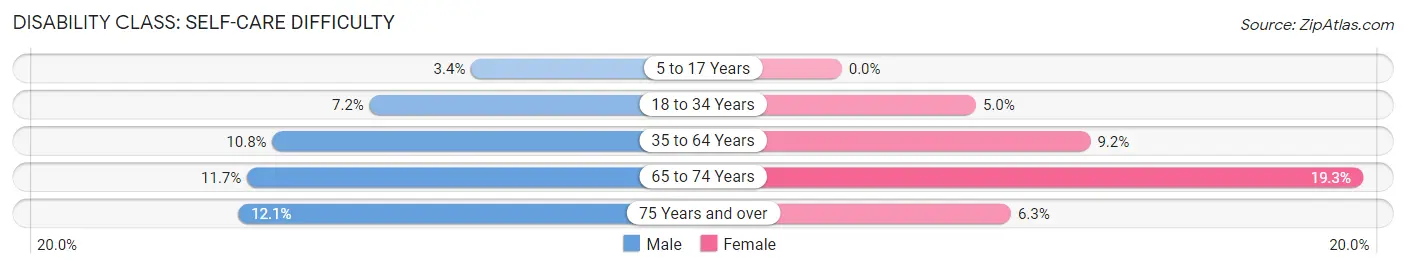
| Age Bracket | Male | Female |
| 5 to 17 Years | 72 (3.4%) | 0 (0.0%) |
| 18 to 34 Years | 145 (7.2%) | 98 (5.0%) |
| 35 to 64 Years | 493 (10.8%) | 442 (9.2%) |
| 65 to 74 Years | 177 (11.7%) | 340 (19.3%) |
| 75 Years and over | 80 (12.1%) | 55 (6.3%) |
Technology Access in Mingo County
Computing Device Access in Mingo County
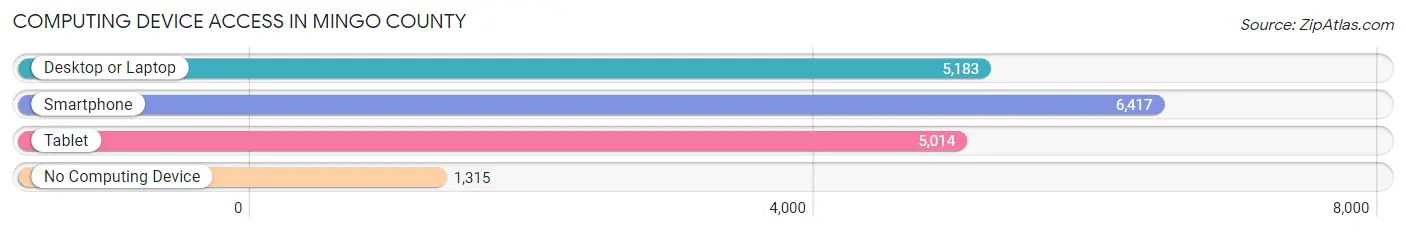
| Device Type | # Households | % Households |
| Desktop or Laptop | 5,183 | 57.0% |
| Smartphone | 6,417 | 70.6% |
| Tablet | 5,014 | 55.1% |
| No Computing Device | 1,315 | 14.5% |
| Total | 9,093 | 100.0% |
Internet Access in Mingo County
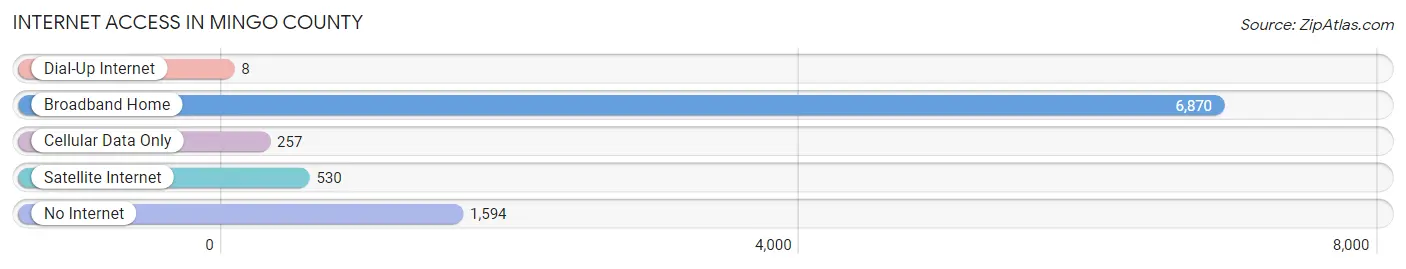
| Internet Type | # Households | % Households |
| Dial-Up Internet | 8 | 0.1% |
| Broadband Home | 6,870 | 75.5% |
| Cellular Data Only | 257 | 2.8% |
| Satellite Internet | 530 | 5.8% |
| No Internet | 1,594 | 17.5% |
| Total | 9,093 | 100.0% |
Mingo County Summary
Mingo County, West Virginia is located in the southwestern part of the state and is part of the Appalachian region. It is bordered by Logan County to the north, Wyoming County to the east, McDowell County to the south, and Kentucky to the west. The county seat is Williamson, and the largest city is Delbarton. The county was formed in 1895 from parts of Logan and Wyoming counties and is named for the Native American tribe that once inhabited the area.
Geography
Mingo County has an area of 441 square miles, of which 439 square miles is land and 2 square miles is water. The county is located in the Appalachian Mountains and is part of the Coal Fields region of West Virginia. The terrain is mostly hilly and forested, with some flat areas in the valleys. The highest point in the county is Big Sandy Mountain, at an elevation of 2,845 feet. The county is drained by the Tug Fork and Big Sandy rivers.
Climate
Mingo County has a humid continental climate, with hot, humid summers and cold, snowy winters. The average annual temperature is 54°F, and the average annual precipitation is 44 inches.
Demographics
As of the 2010 census, there were 26,839 people, 10,845 households, and 7,541 families living in the county. The population density was 61 people per square mile. The racial makeup of the county was 97.2% White, 0.9% African American, 0.2% Native American, 0.2% Asian, 0.1% Pacific Islander, 0.3% from other races, and 0.9% from two or more races. Hispanic or Latino of any race were 0.7% of the population.
The median income for a household in the county was $25,945, and the median income for a family was $31,945. The per capita income for the county was $14,845. About 20.2% of families and 24.2% of the population were below the poverty line, including 33.2% of those under age 18 and 16.2% of those age 65 or over.
Economy
Mingo County is largely rural and has a largely agricultural economy. The county is known for its coal mining industry, which has been a major source of employment for many years. Other industries in the county include timber, natural gas, and tourism. The county is also home to several small businesses, including restaurants, retail stores, and service providers.
Education
Mingo County is served by the Mingo County Schools system, which includes seven elementary schools, two middle schools, and two high schools. The county also has several private schools, including Mingo Central Catholic High School and Williamson Christian Academy. The county is home to Southern West Virginia Community and Technical College, which offers associate degrees and certificate programs.
Conclusion
Mingo County, West Virginia is a rural county located in the Appalachian Mountains. It has a humid continental climate, with hot, humid summers and cold, snowy winters. The county has a largely agricultural economy, with coal mining, timber, natural gas, and tourism being major industries. The county is served by the Mingo County Schools system, as well as several private schools. Southern West Virginia Community and Technical College is also located in the county.
Common Questions
What is the Total Population of Mingo County?
Total Population of Mingo County is 23,466.
What is the Total Male Population of Mingo County?
Total Male Population of Mingo County is 11,577.
What is the Total Female Population of Mingo County?
Total Female Population of Mingo County is 11,889.
What is the Ratio of Males per 100 Females in Mingo County?
There are 97.38 Males per 100 Females in Mingo County.
What is the Ratio of Females per 100 Males in Mingo County?
There are 102.69 Females per 100 Males in Mingo County.
What is the Median Population Age in Mingo County?
Median Population Age in Mingo County is 44.3 Years.
What is the Average Family Size in Mingo County
Average Family Size in Mingo County is 3.1 People.
What is the Average Household Size in Mingo County
Average Household Size in Mingo County is 2.6 People.
What is Per Capita Income in Mingo County?
Per Capita income in Mingo County is $21,342.
What is the Median Family Income in Mingo County?
Median Family Income in Mingo County is $51,270.
What is the Median Household income in Mingo County?
Median Household Income in Mingo County is $38,305.
What is Income or Wage Gap in Mingo County?
Income or Wage Gap in Mingo County is 27.9%.
Women in Mingo County earn 72.1 cents for every dollar earned by a man.
What is Family Income Deficit in Mingo County?
Family Income Deficit in Mingo County is $11,124.
Families that are below poverty line in Mingo County earn $11,124 less on average than the poverty threshold level.
What is Inequality or Gini Index in Mingo County?
Inequality or Gini Index in Mingo County is 0.50.
How Large is the Labor Force in Mingo County?
There are 7,164 People in the Labor Forcein in Mingo County.
What is the Percentage of People in the Labor Force in Mingo County?
37.6% of People are in the Labor Force in Mingo County.
What is the Unemployment Rate in Mingo County?
Unemployment Rate in Mingo County is 11.2%.