Mineral County, WV
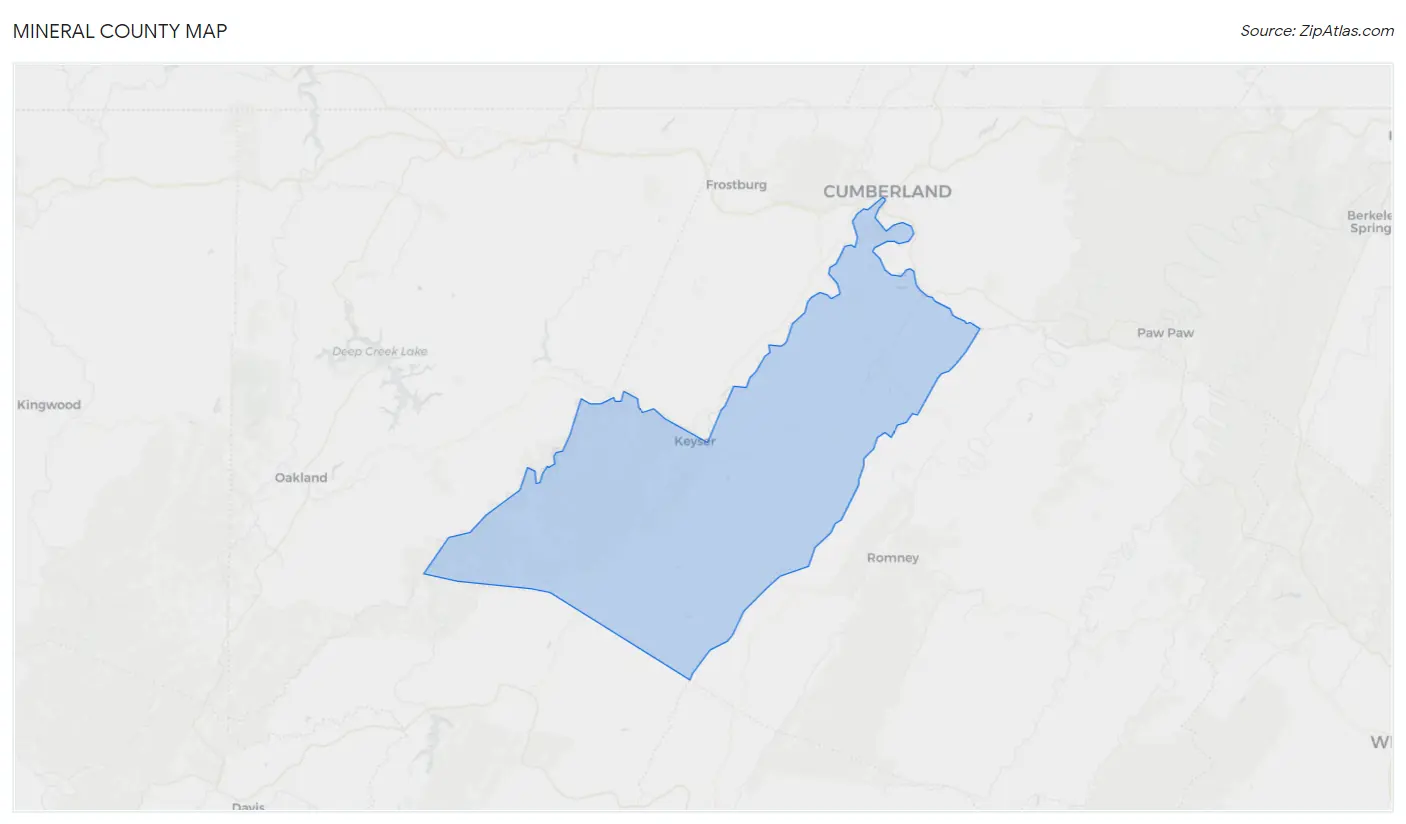
Mineral County Map
Mineral County Overview
26,957
TOTAL POPULATION
13,393
MALE POPULATION
13,564
FEMALE POPULATION
98.74
MALES / 100 FEMALES
101.28
FEMALES / 100 MALES
44.6
MEDIAN AGE
3.1
AVG FAMILY SIZE
2.5
AVG HOUSEHOLD SIZE
$33,580
PER CAPITA INCOME
$84,081
AVG FAMILY INCOME
$64,728
AVG HOUSEHOLD INCOME
36.4%
WAGE / INCOME GAP [ % ]
63.6¢/ $1
WAGE / INCOME GAP [ $ ]
$9,892
FAMILY INCOME DEFICIT
0.44
INEQUALITY / GINI INDEX
12,454
LABOR FORCE [ PEOPLE ]
55.6%
PERCENT IN LABOR FORCE
5.8%
UNEMPLOYMENT RATE
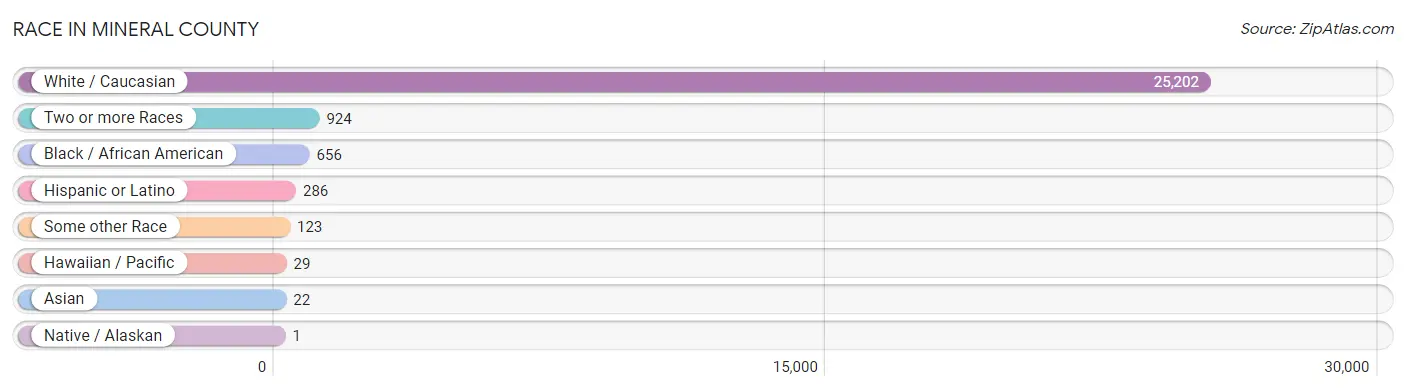
Race in Mineral County
The most populous races in Mineral County are White / Caucasian (25,202 | 93.5%), Two or more Races (924 | 3.4%), and Black / African American (656 | 2.4%).
| Race | # Population | % Population |
| Asian | 22 | 0.1% |
| Black / African American | 656 | 2.4% |
| Hawaiian / Pacific | 29 | 0.1% |
| Hispanic or Latino | 286 | 1.1% |
| Native / Alaskan | 1 | 0.0% |
| White / Caucasian | 25,202 | 93.5% |
| Two or more Races | 924 | 3.4% |
| Some other Race | 123 | 0.5% |
| Total | 26,957 | 100.0% |
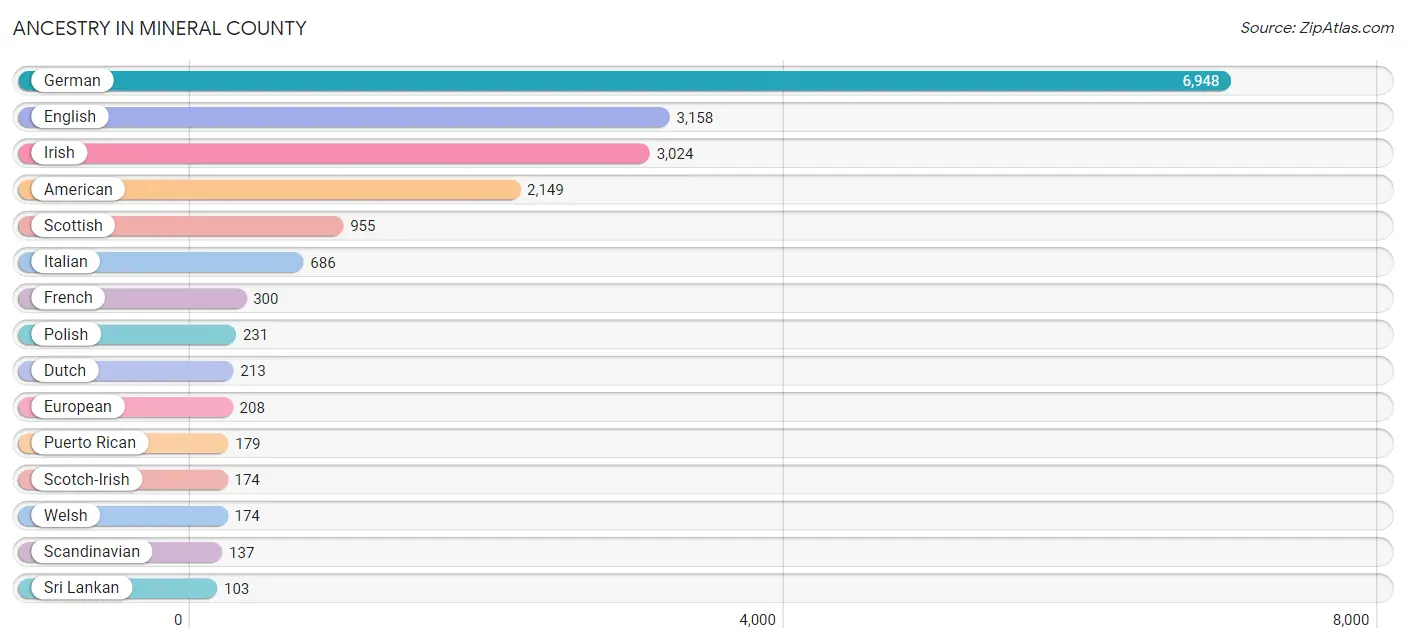
Ancestry in Mineral County
The most populous ancestries reported in Mineral County are German (6,948 | 25.8%), English (3,158 | 11.7%), Irish (3,024 | 11.2%), American (2,149 | 8.0%), and Scottish (955 | 3.5%), together accounting for 60.2% of all Mineral County residents.
| Ancestry | # Population | % Population |
| African | 32 | 0.1% |
| Aleut | 1 | 0.0% |
| American | 2,149 | 8.0% |
| Apache | 2 | 0.0% |
| Arab | 2 | 0.0% |
| Bhutanese | 22 | 0.1% |
| Blackfeet | 2 | 0.0% |
| British | 67 | 0.3% |
| Canadian | 29 | 0.1% |
| Central American | 24 | 0.1% |
| Czech | 9 | 0.0% |
| Czechoslovakian | 27 | 0.1% |
| Dominican | 1 | 0.0% |
| Dutch | 213 | 0.8% |
| Eastern European | 18 | 0.1% |
| English | 3,158 | 11.7% |
| European | 208 | 0.8% |
| French | 300 | 1.1% |
| French Canadian | 38 | 0.1% |
| German | 6,948 | 25.8% |
| Honduran | 8 | 0.0% |
| Hungarian | 28 | 0.1% |
| Irish | 3,024 | 11.2% |
| Italian | 686 | 2.5% |
| Lebanese | 2 | 0.0% |
| Mexican | 32 | 0.1% |
| Northern European | 8 | 0.0% |
| Norwegian | 2 | 0.0% |
| Panamanian | 11 | 0.0% |
| Pennsylvania German | 19 | 0.1% |
| Polish | 231 | 0.9% |
| Portuguese | 5 | 0.0% |
| Puerto Rican | 179 | 0.7% |
| Russian | 22 | 0.1% |
| Salvadoran | 5 | 0.0% |
| Scandinavian | 137 | 0.5% |
| Scotch-Irish | 174 | 0.6% |
| Scottish | 955 | 3.5% |
| Slovak | 71 | 0.3% |
| South American | 42 | 0.2% |
| Sri Lankan | 103 | 0.4% |
| Subsaharan African | 32 | 0.1% |
| Swedish | 94 | 0.4% |
| Swiss | 7 | 0.0% |
| Venezuelan | 42 | 0.2% |
| Welsh | 174 | 0.6% |
| Yugoslavian | 7 | 0.0% | View All 47 Rows |
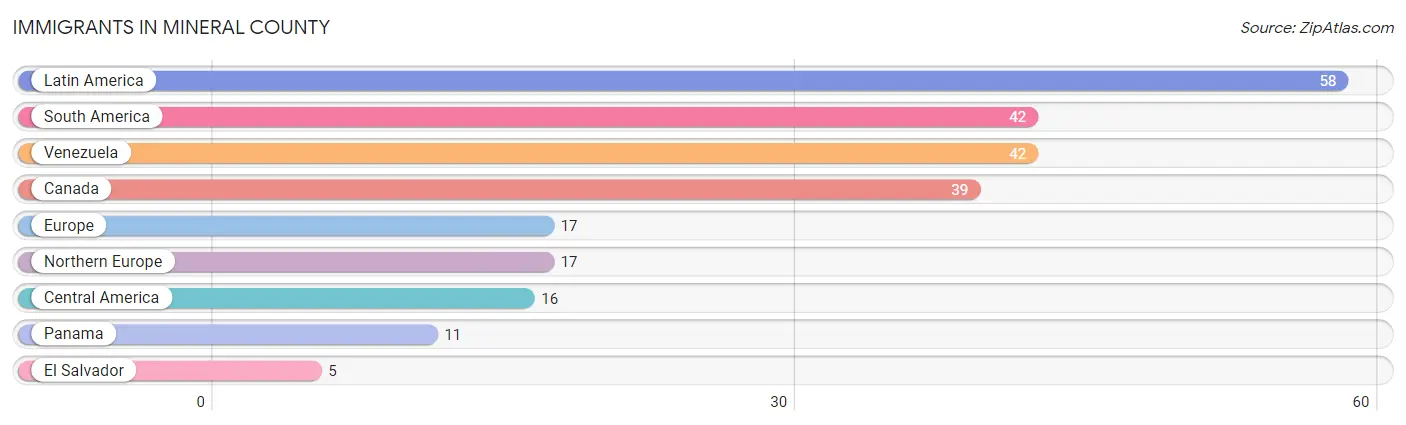
Immigrants in Mineral County
The most numerous immigrant groups reported in Mineral County came from Latin America (58 | 0.2%), South America (42 | 0.2%), Venezuela (42 | 0.2%), Canada (39 | 0.1%), and Europe (17 | 0.1%), together accounting for 0.7% of all Mineral County residents.
| Immigration Origin | # Population | % Population |
| Canada | 39 | 0.1% |
| Central America | 16 | 0.1% |
| El Salvador | 5 | 0.0% |
| Europe | 17 | 0.1% |
| Latin America | 58 | 0.2% |
| Northern Europe | 17 | 0.1% |
| Panama | 11 | 0.0% |
| South America | 42 | 0.2% |
| Venezuela | 42 | 0.2% | View All 9 Rows |
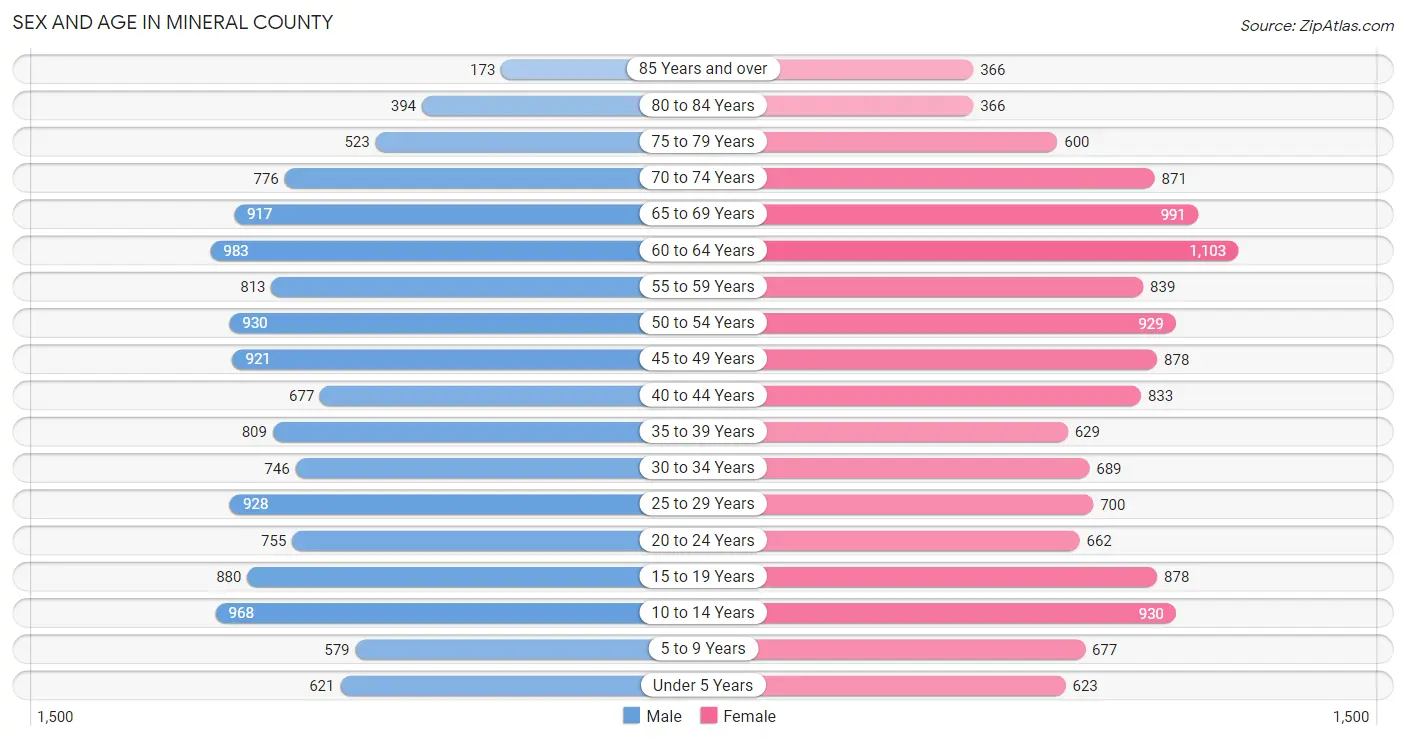
Sex and Age in Mineral County
Sex and Age in Mineral County
The most populous age groups in Mineral County are 60 to 64 Years (983 | 7.3%) for men and 60 to 64 Years (1,103 | 8.1%) for women.
| Age Bracket | Male | Female |
| Under 5 Years | 621 (4.6%) | 623 (4.6%) |
| 5 to 9 Years | 579 (4.3%) | 677 (5.0%) |
| 10 to 14 Years | 968 (7.2%) | 930 (6.9%) |
| 15 to 19 Years | 880 (6.6%) | 878 (6.5%) |
| 20 to 24 Years | 755 (5.6%) | 662 (4.9%) |
| 25 to 29 Years | 928 (6.9%) | 700 (5.2%) |
| 30 to 34 Years | 746 (5.6%) | 689 (5.1%) |
| 35 to 39 Years | 809 (6.0%) | 629 (4.6%) |
| 40 to 44 Years | 677 (5.1%) | 833 (6.1%) |
| 45 to 49 Years | 921 (6.9%) | 878 (6.5%) |
| 50 to 54 Years | 930 (6.9%) | 929 (6.9%) |
| 55 to 59 Years | 813 (6.1%) | 839 (6.2%) |
| 60 to 64 Years | 983 (7.3%) | 1,103 (8.1%) |
| 65 to 69 Years | 917 (6.9%) | 991 (7.3%) |
| 70 to 74 Years | 776 (5.8%) | 871 (6.4%) |
| 75 to 79 Years | 523 (3.9%) | 600 (4.4%) |
| 80 to 84 Years | 394 (2.9%) | 366 (2.7%) |
| 85 Years and over | 173 (1.3%) | 366 (2.7%) |
| Total | 13,393 (100.0%) | 13,564 (100.0%) |
Families and Households in Mineral County
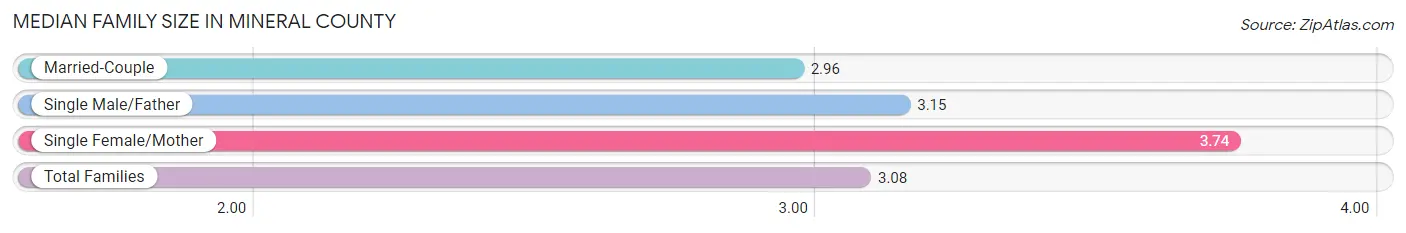
Median Family Size in Mineral County
The median family size in Mineral County is 3.08 persons per family, with single female/mother families (958 | 13.9%) accounting for the largest median family size of 3.74 persons per family. On the other hand, married-couple families (5,482 | 79.3%) represent the smallest median family size with 2.96 persons per family.
| Family Type | # Families | Family Size |
| Married-Couple | 5,482 (79.3%) | 2.96 |
| Single Male/Father | 476 (6.9%) | 3.15 |
| Single Female/Mother | 958 (13.9%) | 3.74 |
| Total Families | 6,916 (100.0%) | 3.08 |
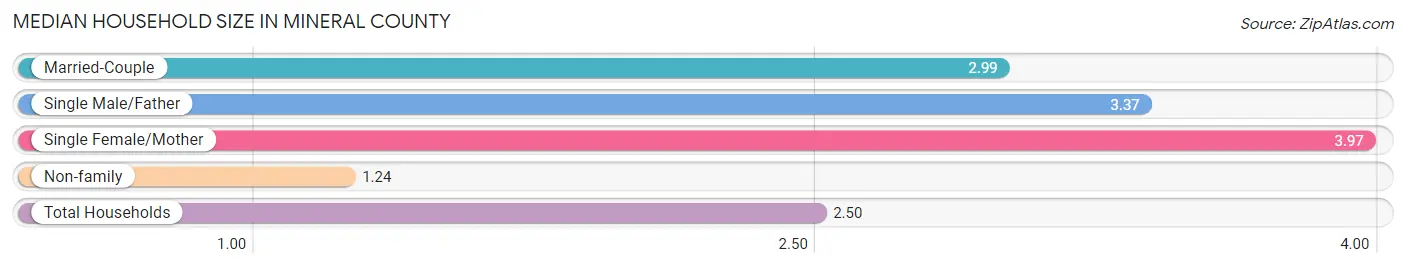
Median Household Size in Mineral County
The median household size in Mineral County is 2.50 persons per household, with single female/mother households (958 | 9.1%) accounting for the largest median household size of 3.97 persons per household. non-family households (3,616 | 34.3%) represent the smallest median household size with 1.24 persons per household.
| Household Type | # Households | Household Size |
| Married-Couple | 5,482 (52.0%) | 2.99 |
| Single Male/Father | 476 (4.5%) | 3.37 |
| Single Female/Mother | 958 (9.1%) | 3.97 |
| Non-family | 3,616 (34.3%) | 1.24 |
| Total Households | 10,532 (100.0%) | 2.50 |
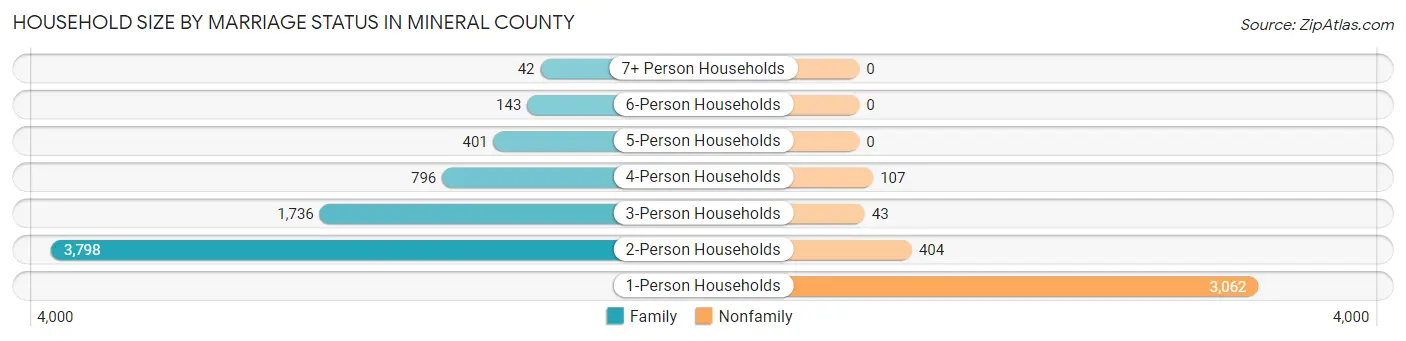
Household Size by Marriage Status in Mineral County
Out of a total of 10,532 households in Mineral County, 6,916 (65.7%) are family households, while 3,616 (34.3%) are nonfamily households. The most numerous type of family households are 2-person households, comprising 3,798, and the most common type of nonfamily households are 1-person households, comprising 3,062.
| Household Size | Family Households | Nonfamily Households |
| 1-Person Households | - | 3,062 (29.1%) |
| 2-Person Households | 3,798 (36.1%) | 404 (3.8%) |
| 3-Person Households | 1,736 (16.5%) | 43 (0.4%) |
| 4-Person Households | 796 (7.6%) | 107 (1.0%) |
| 5-Person Households | 401 (3.8%) | 0 (0.0%) |
| 6-Person Households | 143 (1.4%) | 0 (0.0%) |
| 7+ Person Households | 42 (0.4%) | 0 (0.0%) |
| Total | 6,916 (65.7%) | 3,616 (34.3%) |
Female Fertility in Mineral County
Fertility by Age in Mineral County
Average fertility rate in Mineral County is 45.0 births per 1,000 women. Women in the age bracket of 20 to 34 years have the highest fertility rate with 62.0 births per 1,000 women. Women in the age bracket of 20 to 34 years acount for 52.0% of all women with births.
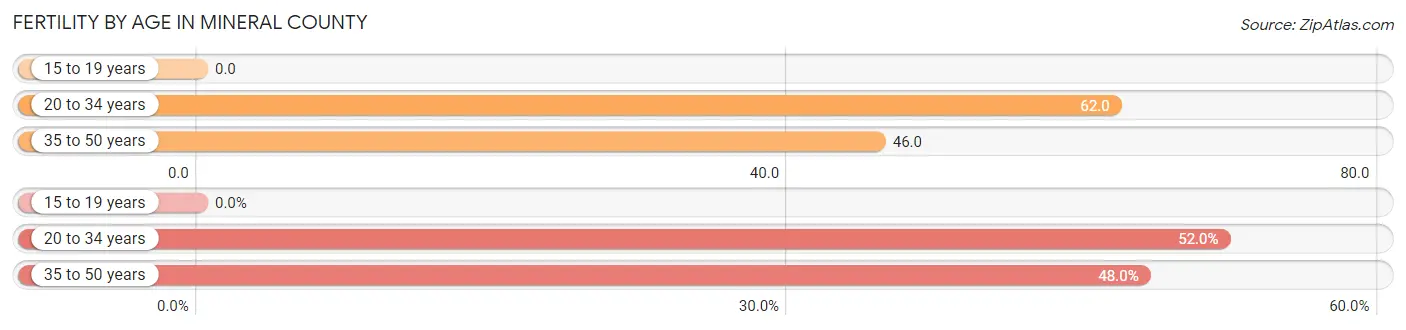
| Age Bracket | Women with Births | Births / 1,000 Women |
| 15 to 19 years | 0 (0.0%) | 0.0 |
| 20 to 34 years | 128 (52.0%) | 62.0 |
| 35 to 50 years | 118 (48.0%) | 46.0 |
| Total | 246 (100.0%) | 45.0 |
Fertility by Age by Marriage Status in Mineral County
56.9% of women with births (246) in Mineral County are married. The highest percentage of unmarried women with births falls into 20 to 34 years age bracket with 53.9% of them unmarried at the time of birth, while the lowest percentage of unmarried women with births belong to 35 to 50 years age bracket with 31.4% of them unmarried.
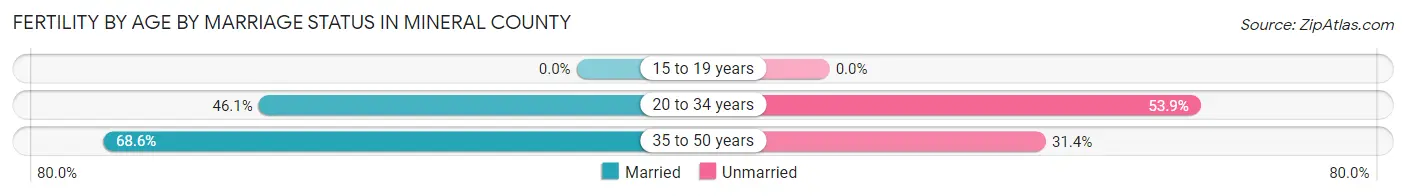
| Age Bracket | Married | Unmarried |
| 15 to 19 years | 0 (0.0%) | 0 (0.0%) |
| 20 to 34 years | 59 (46.1%) | 69 (53.9%) |
| 35 to 50 years | 81 (68.6%) | 37 (31.4%) |
| Total | 140 (56.9%) | 106 (43.1%) |
Fertility by Education in Mineral County
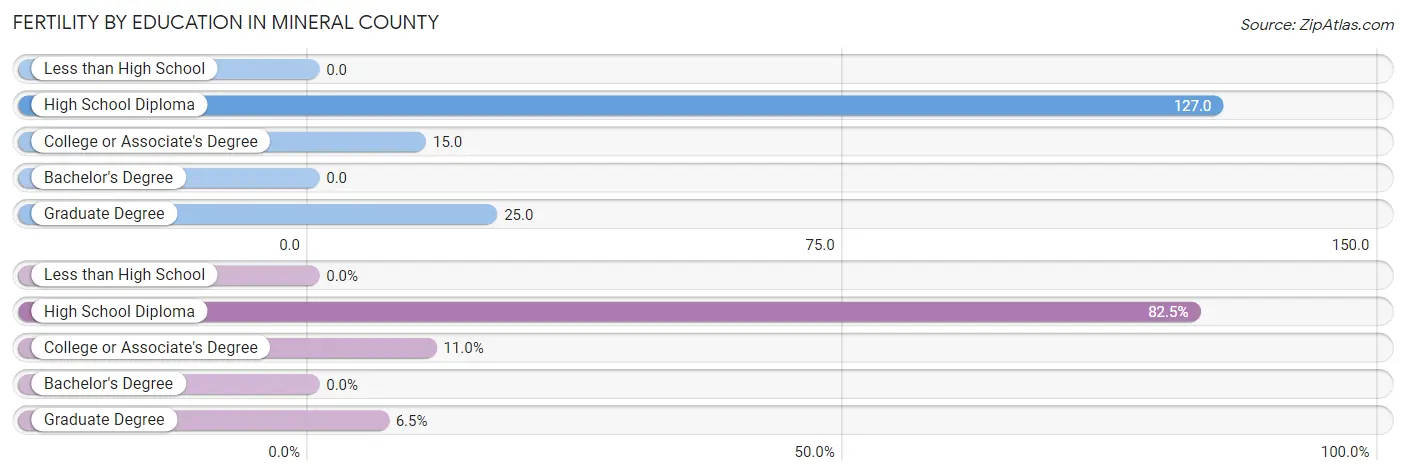
| Educational Attainment | Women with Births | Births / 1,000 Women |
| Less than High School | 0 (0.0%) | 0.0 |
| High School Diploma | 203 (82.5%) | 127.0 |
| College or Associate's Degree | 27 (11.0%) | 15.0 |
| Bachelor's Degree | 0 (0.0%) | 0.0 |
| Graduate Degree | 16 (6.5%) | 25.0 |
| Total | 246 (100.0%) | 45.0 |
Fertility by Education by Marriage Status in Mineral County
43.1% of women with births in Mineral County are unmarried. Women with the educational attainment of graduate degree are most likely to be married with 100.0% of them married at childbirth, while women with the educational attainment of high school diploma are least likely to be married with 48.8% of them unmarried at childbirth.
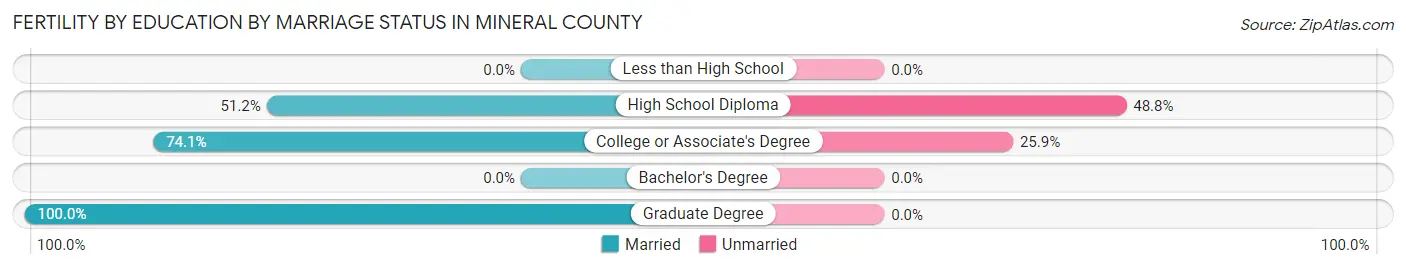
| Educational Attainment | Married | Unmarried |
| Less than High School | 0 (0.0%) | 0 (0.0%) |
| High School Diploma | 104 (51.2%) | 99 (48.8%) |
| College or Associate's Degree | 20 (74.1%) | 7 (25.9%) |
| Bachelor's Degree | 0 (0.0%) | 0 (0.0%) |
| Graduate Degree | 16 (100.0%) | 0 (0.0%) |
| Total | 140 (56.9%) | 106 (43.1%) |
Income in Mineral County
Income Overview in Mineral County
Per Capita Income in Mineral County is $33,580, while median incomes of families and households are $84,081 and $64,728 respectively.
| Characteristic | Number | Measure |
| Per Capita Income | 26,957 | $33,580 |
| Median Family Income | 6,916 | $84,081 |
| Mean Family Income | 6,916 | $98,387 |
| Median Household Income | 10,532 | $64,728 |
| Mean Household Income | 10,532 | $81,555 |
| Income Deficit | 6,916 | $9,892 |
| Wage / Income Gap (%) | 26,957 | 36.36% |
| Wage / Income Gap ($) | 26,957 | 63.64¢ per $1 |
| Gini / Inequality Index | 26,957 | 0.44 |
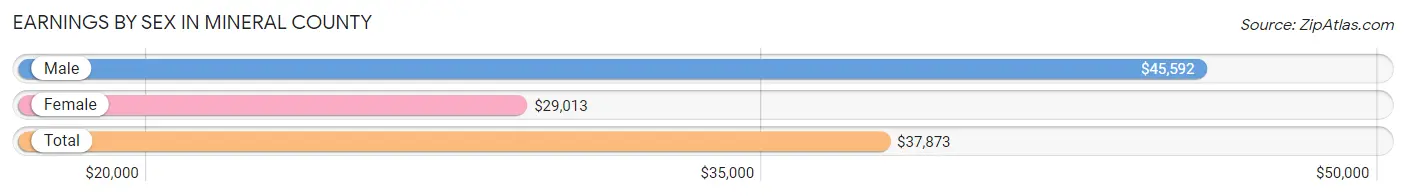
Earnings by Sex in Mineral County
Average Earnings in Mineral County are $37,873, $45,592 for men and $29,013 for women, a difference of 36.4%.
| Sex | Number | Average Earnings |
| Male | 6,867 (52.9%) | $45,592 |
| Female | 6,125 (47.1%) | $29,013 |
| Total | 12,992 (100.0%) | $37,873 |
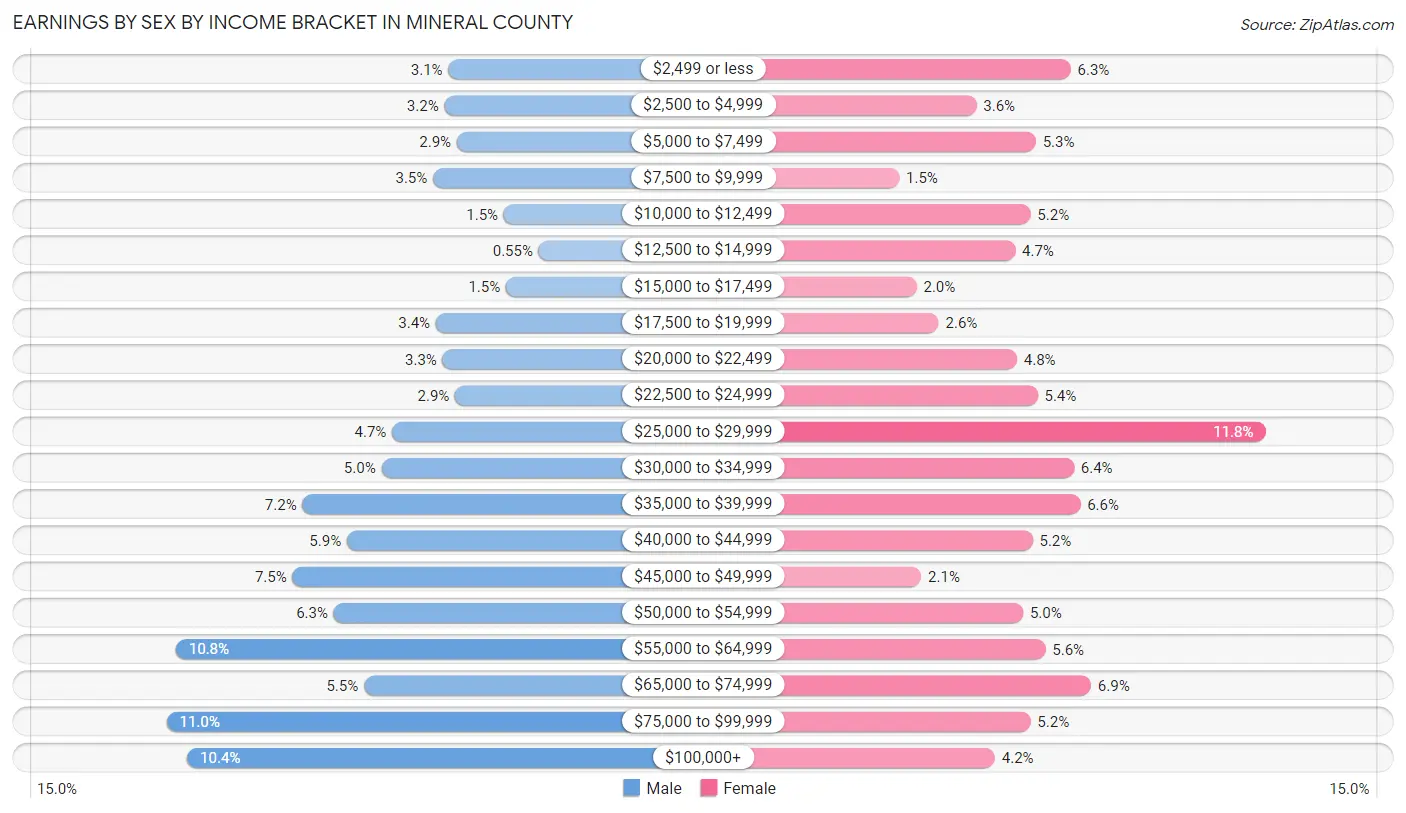
Earnings by Sex by Income Bracket in Mineral County
The most common earnings brackets in Mineral County are $75,000 to $99,999 for men (756 | 11.0%) and $25,000 to $29,999 for women (720 | 11.8%).
| Income | Male | Female |
| $2,499 or less | 212 (3.1%) | 385 (6.3%) |
| $2,500 to $4,999 | 220 (3.2%) | 223 (3.6%) |
| $5,000 to $7,499 | 196 (2.9%) | 325 (5.3%) |
| $7,500 to $9,999 | 242 (3.5%) | 90 (1.5%) |
| $10,000 to $12,499 | 105 (1.5%) | 316 (5.2%) |
| $12,500 to $14,999 | 38 (0.5%) | 290 (4.7%) |
| $15,000 to $17,499 | 101 (1.5%) | 120 (2.0%) |
| $17,500 to $19,999 | 236 (3.4%) | 158 (2.6%) |
| $20,000 to $22,499 | 223 (3.3%) | 293 (4.8%) |
| $22,500 to $24,999 | 199 (2.9%) | 328 (5.4%) |
| $25,000 to $29,999 | 321 (4.7%) | 720 (11.8%) |
| $30,000 to $34,999 | 341 (5.0%) | 391 (6.4%) |
| $35,000 to $39,999 | 494 (7.2%) | 402 (6.6%) |
| $40,000 to $44,999 | 408 (5.9%) | 320 (5.2%) |
| $45,000 to $49,999 | 513 (7.5%) | 128 (2.1%) |
| $50,000 to $54,999 | 433 (6.3%) | 303 (5.0%) |
| $55,000 to $64,999 | 738 (10.7%) | 342 (5.6%) |
| $65,000 to $74,999 | 375 (5.5%) | 420 (6.9%) |
| $75,000 to $99,999 | 756 (11.0%) | 316 (5.2%) |
| $100,000+ | 716 (10.4%) | 255 (4.2%) |
| Total | 6,867 (100.0%) | 6,125 (100.0%) |
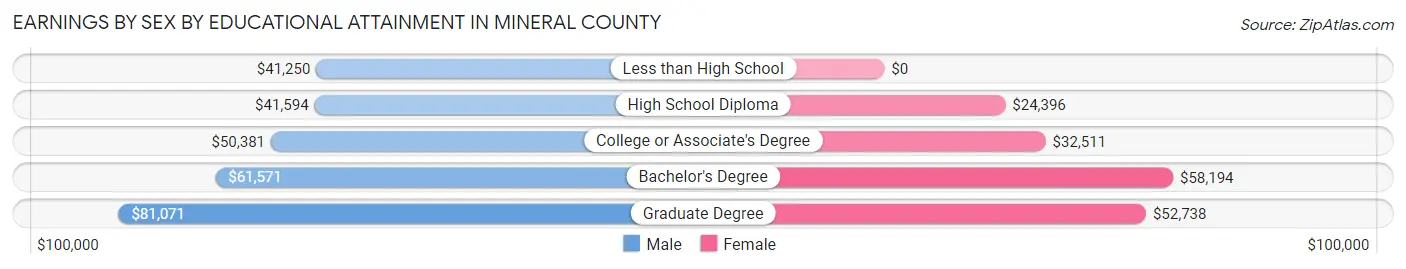
Earnings by Sex by Educational Attainment in Mineral County
Average earnings in Mineral County are $48,069 for men and $32,596 for women, a difference of 32.2%. Men with an educational attainment of graduate degree enjoy the highest average annual earnings of $81,071, while those with less than high school education earn the least with $41,250. Women with an educational attainment of bachelor's degree earn the most with the average annual earnings of $58,194, while those with high school diploma education have the smallest earnings of $24,396.
| Educational Attainment | Male Income | Female Income |
| Less than High School | $41,250 | $0 |
| High School Diploma | $41,594 | $24,396 |
| College or Associate's Degree | $50,381 | $32,511 |
| Bachelor's Degree | $61,571 | $58,194 |
| Graduate Degree | $81,071 | $52,738 |
| Total | $48,069 | $32,596 |
Family Income in Mineral County
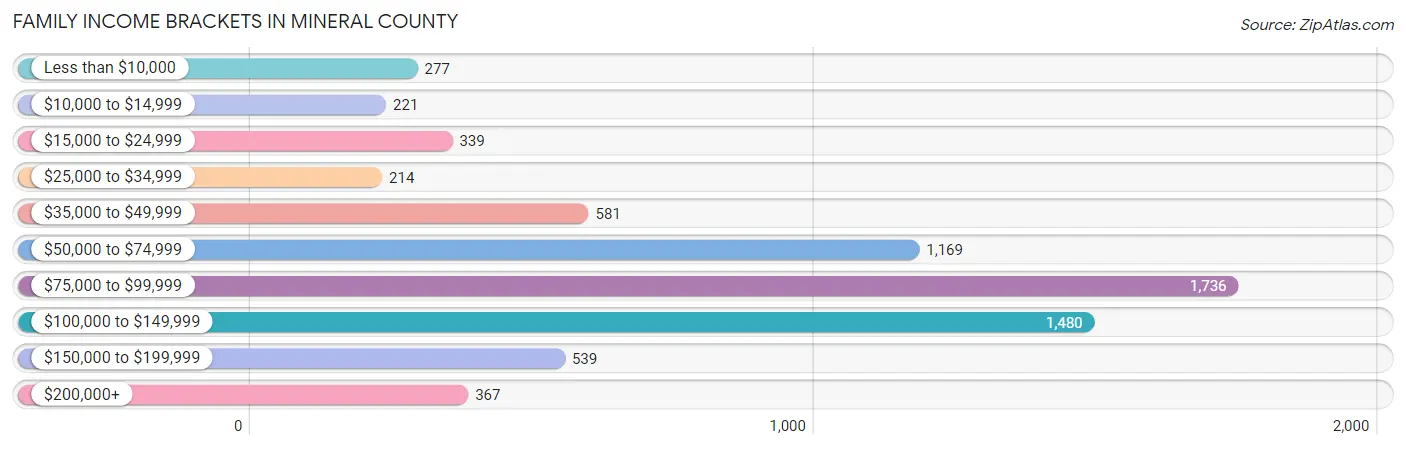
Family Income Brackets in Mineral County
According to the Mineral County family income data, there are 1,736 families falling into the $75,000 to $99,999 income range, which is the most common income bracket and makes up 25.1% of all families. Conversely, the $25,000 to $34,999 income bracket is the least frequent group with only 214 families (3.1%) belonging to this category.
| Income Bracket | # Families | % Families |
| Less than $10,000 | 277 | 4.0% |
| $10,000 to $14,999 | 221 | 3.2% |
| $15,000 to $24,999 | 339 | 4.9% |
| $25,000 to $34,999 | 214 | 3.1% |
| $35,000 to $49,999 | 581 | 8.4% |
| $50,000 to $74,999 | 1,169 | 16.9% |
| $75,000 to $99,999 | 1,736 | 25.1% |
| $100,000 to $149,999 | 1,480 | 21.4% |
| $150,000 to $199,999 | 539 | 7.8% |
| $200,000+ | 367 | 5.3% |
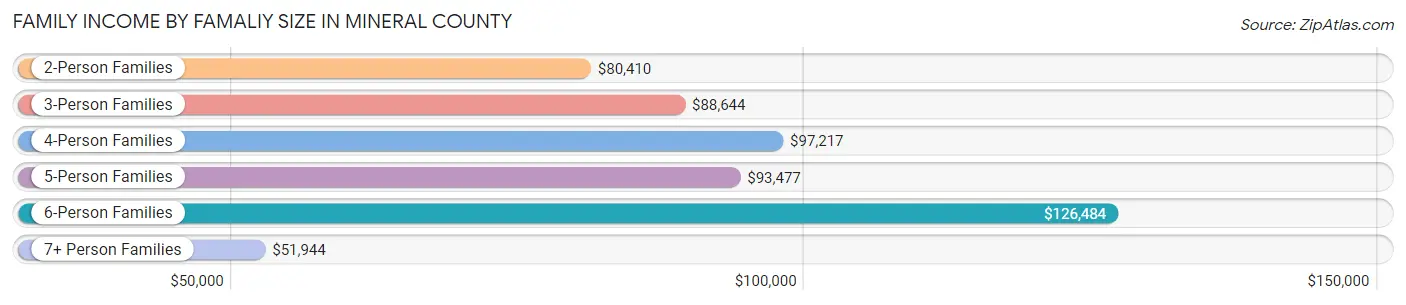
Family Income by Famaliy Size in Mineral County
6-person families (99 | 1.4%) account for the highest median family income in Mineral County with $126,484 per family, while 2-person families (3,950 | 57.1%) have the highest median income of $40,205 per family member.
| Income Bracket | # Families | Median Income |
| 2-Person Families | 3,950 (57.1%) | $80,410 |
| 3-Person Families | 1,689 (24.4%) | $88,644 |
| 4-Person Families | 733 (10.6%) | $97,217 |
| 5-Person Families | 403 (5.8%) | $93,477 |
| 6-Person Families | 99 (1.4%) | $126,484 |
| 7+ Person Families | 42 (0.6%) | $51,944 |
| Total | 6,916 (100.0%) | $84,081 |
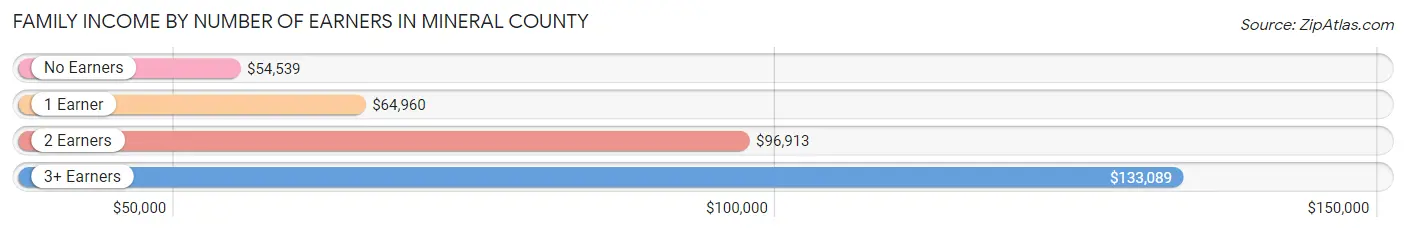
Family Income by Number of Earners in Mineral County
The median family income in Mineral County is $84,081, with families comprising 3+ earners (453) having the highest median family income of $133,089, while families with no earners (1,601) have the lowest median family income of $54,539, accounting for 6.6% and 23.2% of families, respectively.
| Number of Earners | # Families | Median Income |
| No Earners | 1,601 (23.2%) | $54,539 |
| 1 Earner | 2,022 (29.2%) | $64,960 |
| 2 Earners | 2,840 (41.1%) | $96,913 |
| 3+ Earners | 453 (6.6%) | $133,089 |
| Total | 6,916 (100.0%) | $84,081 |
Household Income in Mineral County
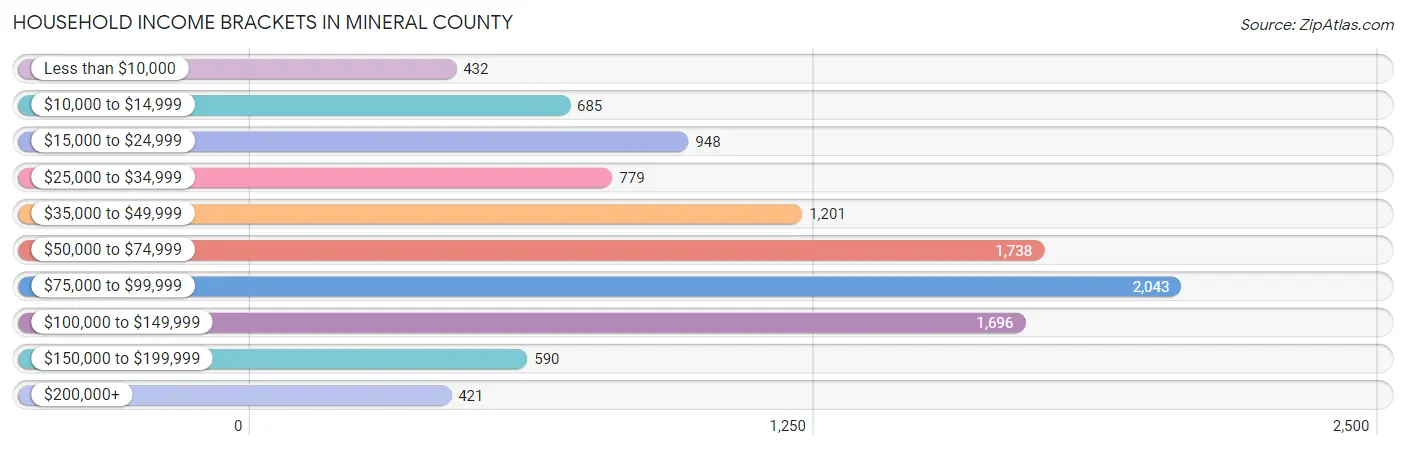
Household Income Brackets in Mineral County
With 2,043 households falling in the category, the $75,000 to $99,999 income range is the most frequent in Mineral County, accounting for 19.4% of all households. In contrast, only 421 households (4.0%) fall into the $200,000+ income bracket, making it the least populous group.
| Income Bracket | # Households | % Households |
| Less than $10,000 | 432 | 4.1% |
| $10,000 to $14,999 | 685 | 6.5% |
| $15,000 to $24,999 | 948 | 9.0% |
| $25,000 to $34,999 | 779 | 7.4% |
| $35,000 to $49,999 | 1,201 | 11.4% |
| $50,000 to $74,999 | 1,738 | 16.5% |
| $75,000 to $99,999 | 2,043 | 19.4% |
| $100,000 to $149,999 | 1,696 | 16.1% |
| $150,000 to $199,999 | 590 | 5.6% |
| $200,000+ | 421 | 4.0% |
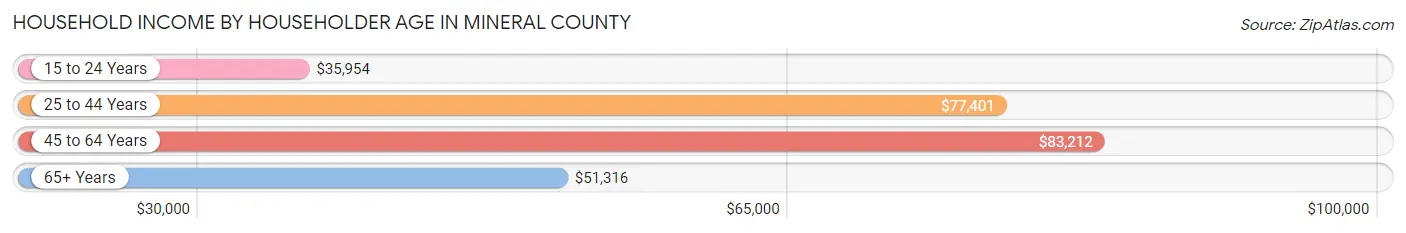
Household Income by Householder Age in Mineral County
The median household income in Mineral County is $64,728, with the highest median household income of $83,212 found in the 45 to 64 years age bracket for the primary householder. A total of 4,393 households (41.7%) fall into this category. Meanwhile, the 15 to 24 years age bracket for the primary householder has the lowest median household income of $35,954, with 276 households (2.6%) in this group.
| Income Bracket | # Households | Median Income |
| 15 to 24 Years | 276 (2.6%) | $35,954 |
| 25 to 44 Years | 2,215 (21.0%) | $77,401 |
| 45 to 64 Years | 4,393 (41.7%) | $83,212 |
| 65+ Years | 3,648 (34.6%) | $51,316 |
| Total | 10,532 (100.0%) | $64,728 |
Poverty in Mineral County
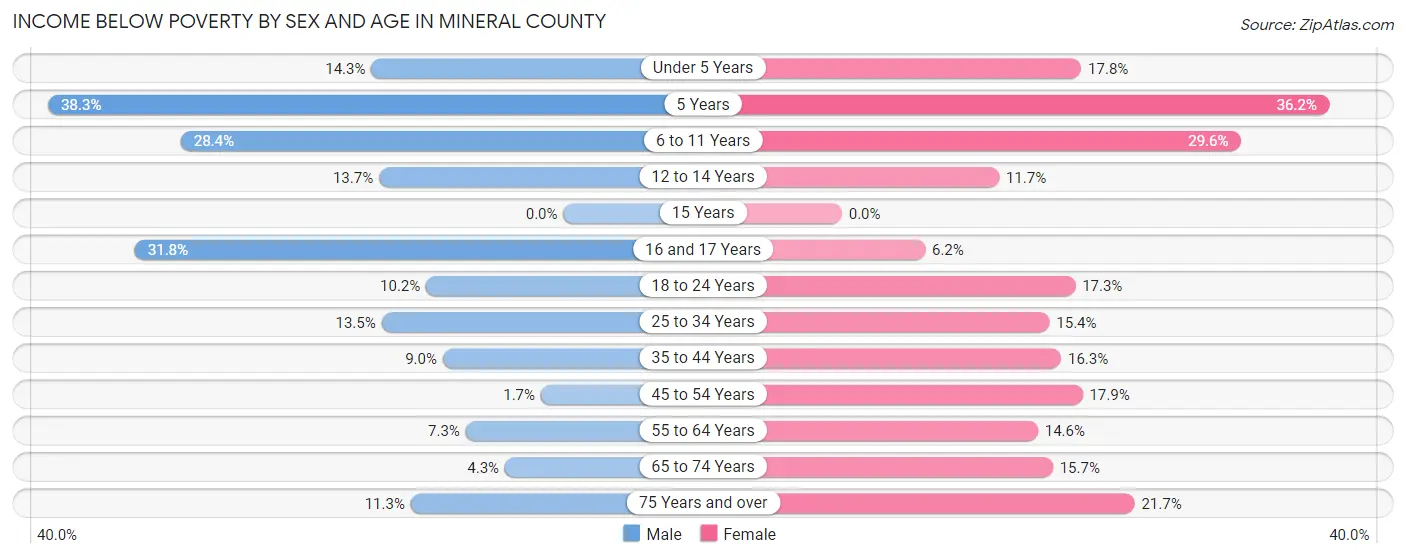
Income Below Poverty by Sex and Age in Mineral County
With 10.6% poverty level for males and 17.1% for females among the residents of Mineral County, 5 year old males and 5 year old females are the most vulnerable to poverty, with 57 males (38.3%) and 47 females (36.1%) in their respective age groups living below the poverty level.
| Age Bracket | Male | Female |
| Under 5 Years | 84 (14.3%) | 105 (17.8%) |
| 5 Years | 57 (38.3%) | 47 (36.1%) |
| 6 to 11 Years | 217 (28.4%) | 240 (29.6%) |
| 12 to 14 Years | 76 (13.7%) | 76 (11.7%) |
| 15 Years | 0 (0.0%) | 0 (0.0%) |
| 16 and 17 Years | 139 (31.8%) | 22 (6.2%) |
| 18 to 24 Years | 90 (10.2%) | 156 (17.3%) |
| 25 to 34 Years | 226 (13.5%) | 214 (15.4%) |
| 35 to 44 Years | 133 (8.9%) | 238 (16.3%) |
| 45 to 54 Years | 31 (1.7%) | 323 (17.9%) |
| 55 to 64 Years | 130 (7.2%) | 279 (14.5%) |
| 65 to 74 Years | 73 (4.3%) | 289 (15.7%) |
| 75 Years and over | 120 (11.3%) | 266 (21.7%) |
| Total | 1,376 (10.6%) | 2,255 (17.1%) |
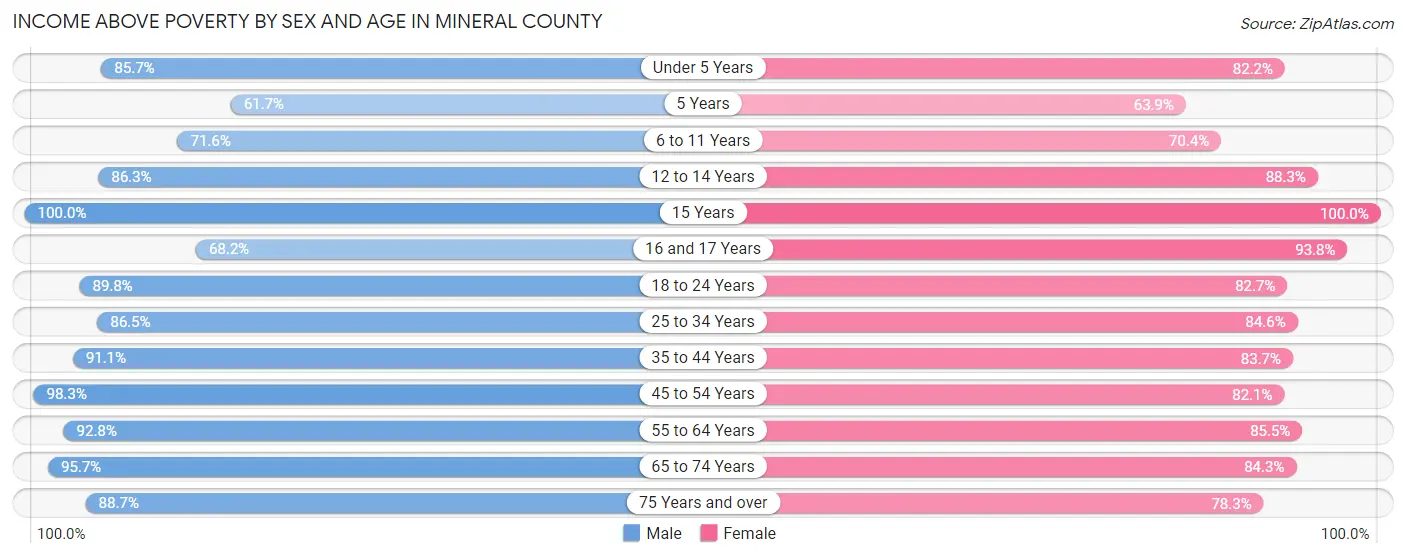
Income Above Poverty by Sex and Age in Mineral County
According to the poverty statistics in Mineral County, males aged 15 years and females aged 15 years are the age groups that are most secure financially, with 100.0% of males and 100.0% of females in these age groups living above the poverty line.
| Age Bracket | Male | Female |
| Under 5 Years | 505 (85.7%) | 486 (82.2%) |
| 5 Years | 92 (61.7%) | 83 (63.8%) |
| 6 to 11 Years | 547 (71.6%) | 571 (70.4%) |
| 12 to 14 Years | 479 (86.3%) | 575 (88.3%) |
| 15 Years | 41 (100.0%) | 116 (100.0%) |
| 16 and 17 Years | 298 (68.2%) | 334 (93.8%) |
| 18 to 24 Years | 793 (89.8%) | 744 (82.7%) |
| 25 to 34 Years | 1,448 (86.5%) | 1,175 (84.6%) |
| 35 to 44 Years | 1,353 (91.0%) | 1,224 (83.7%) |
| 45 to 54 Years | 1,820 (98.3%) | 1,484 (82.1%) |
| 55 to 64 Years | 1,662 (92.7%) | 1,639 (85.5%) |
| 65 to 74 Years | 1,609 (95.7%) | 1,556 (84.3%) |
| 75 Years and over | 939 (88.7%) | 958 (78.3%) |
| Total | 11,586 (89.4%) | 10,945 (82.9%) |
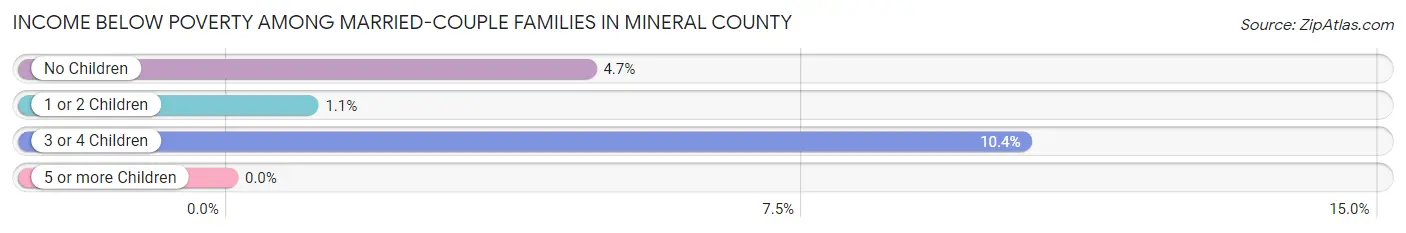
Income Below Poverty Among Married-Couple Families in Mineral County
The poverty statistics for married-couple families in Mineral County show that 4.0% or 220 of the total 5,482 families live below the poverty line. Families with 3 or 4 children have the highest poverty rate of 10.4%, comprising of 25 families. On the other hand, families with 5 or more children have the lowest poverty rate of 0.0%, which includes 0 families.
| Children | Above Poverty | Below Poverty |
| No Children | 3,685 (95.3%) | 181 (4.7%) |
| 1 or 2 Children | 1,319 (99.0%) | 14 (1.1%) |
| 3 or 4 Children | 216 (89.6%) | 25 (10.4%) |
| 5 or more Children | 42 (100.0%) | 0 (0.0%) |
| Total | 5,262 (96.0%) | 220 (4.0%) |
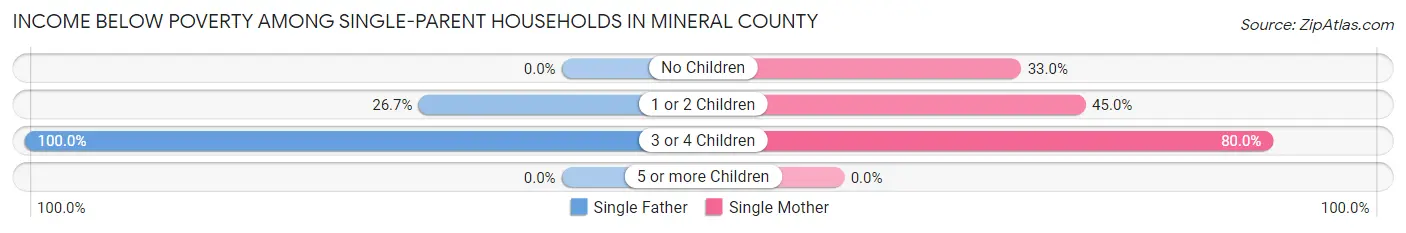
Income Below Poverty Among Single-Parent Households in Mineral County
According to the poverty data in Mineral County, 16.2% or 77 single-father households and 42.7% or 409 single-mother households are living below the poverty line. Among single-father households, those with 3 or 4 children have the highest poverty rate, with 9 households (100.0%) experiencing poverty. Likewise, among single-mother households, those with 3 or 4 children have the highest poverty rate, with 28 households (80.0%) falling below the poverty line.
| Children | Single Father | Single Mother |
| No Children | 0 (0.0%) | 94 (33.0%) |
| 1 or 2 Children | 68 (26.7%) | 287 (45.0%) |
| 3 or 4 Children | 9 (100.0%) | 28 (80.0%) |
| 5 or more Children | 0 (0.0%) | 0 (0.0%) |
| Total | 77 (16.2%) | 409 (42.7%) |
Income Below Poverty Among Married-Couple vs Single-Parent Households in Mineral County
The poverty data for Mineral County shows that 220 of the married-couple family households (4.0%) and 486 of the single-parent households (33.9%) are living below the poverty level. Within the married-couple family households, those with 3 or 4 children have the highest poverty rate, with 25 households (10.4%) falling below the poverty line. Among the single-parent households, those with 3 or 4 children have the highest poverty rate, with 37 household (84.1%) living below poverty.
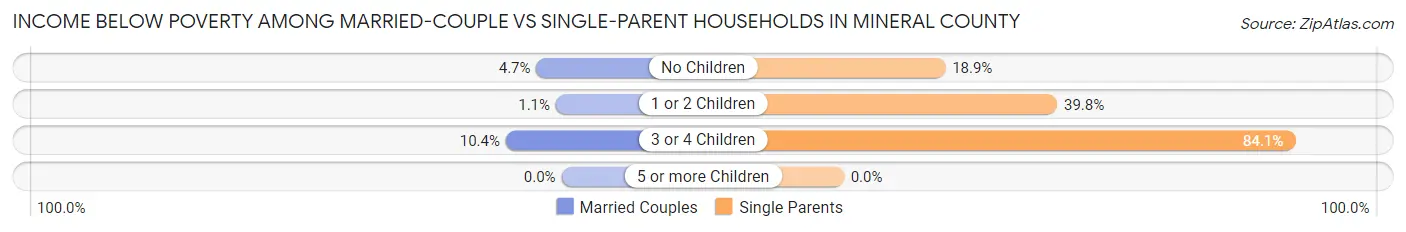
| Children | Married-Couple Families | Single-Parent Households |
| No Children | 181 (4.7%) | 94 (18.9%) |
| 1 or 2 Children | 14 (1.1%) | 355 (39.8%) |
| 3 or 4 Children | 25 (10.4%) | 37 (84.1%) |
| 5 or more Children | 0 (0.0%) | 0 (0.0%) |
| Total | 220 (4.0%) | 486 (33.9%) |
Employment Characteristics in Mineral County
Employment by Class of Employer in Mineral County
Among the 11,553 employed individuals in Mineral County, private company employees (7,963 | 68.9%), state government employees (1,181 | 10.2%), and not-for-profit organizations (659 | 5.7%) make up the most common classes of employment.
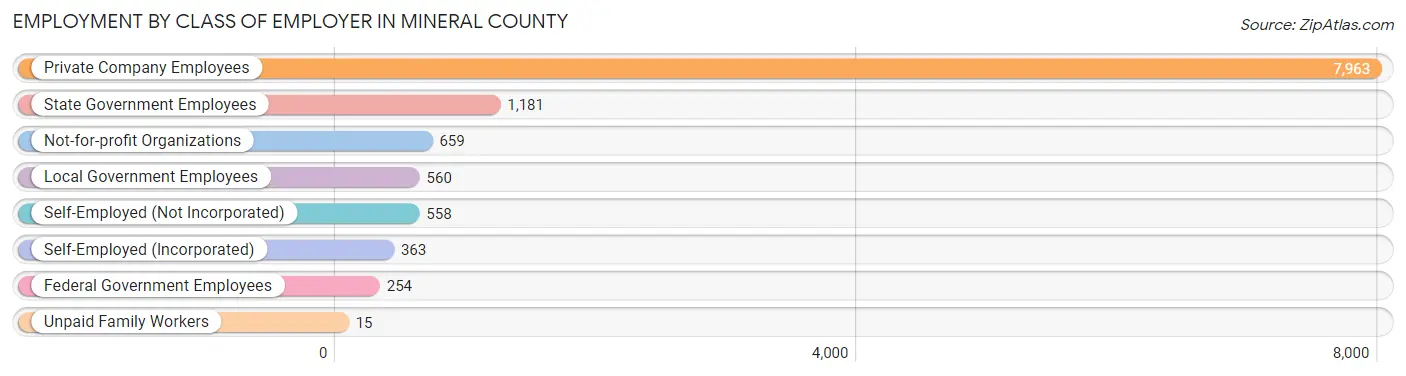
| Employer Class | # Employees | % Employees |
| Private Company Employees | 7,963 | 68.9% |
| Self-Employed (Incorporated) | 363 | 3.1% |
| Self-Employed (Not Incorporated) | 558 | 4.8% |
| Not-for-profit Organizations | 659 | 5.7% |
| Local Government Employees | 560 | 4.9% |
| State Government Employees | 1,181 | 10.2% |
| Federal Government Employees | 254 | 2.2% |
| Unpaid Family Workers | 15 | 0.1% |
| Total | 11,553 | 100.0% |
Employment Status by Age in Mineral County
According to the labor force statistics for Mineral County, out of the total population over 16 years of age (22,399), 55.6% or 12,454 individuals are in the labor force, with 5.8% or 722 of them unemployed. The age group with the highest labor force participation rate is 35 to 44 years, with 87.4% or 2,577 individuals in the labor force. Within the labor force, the 16 to 19 years age range has the highest percentage of unemployed individuals, with 36.9% or 181 of them being unemployed.
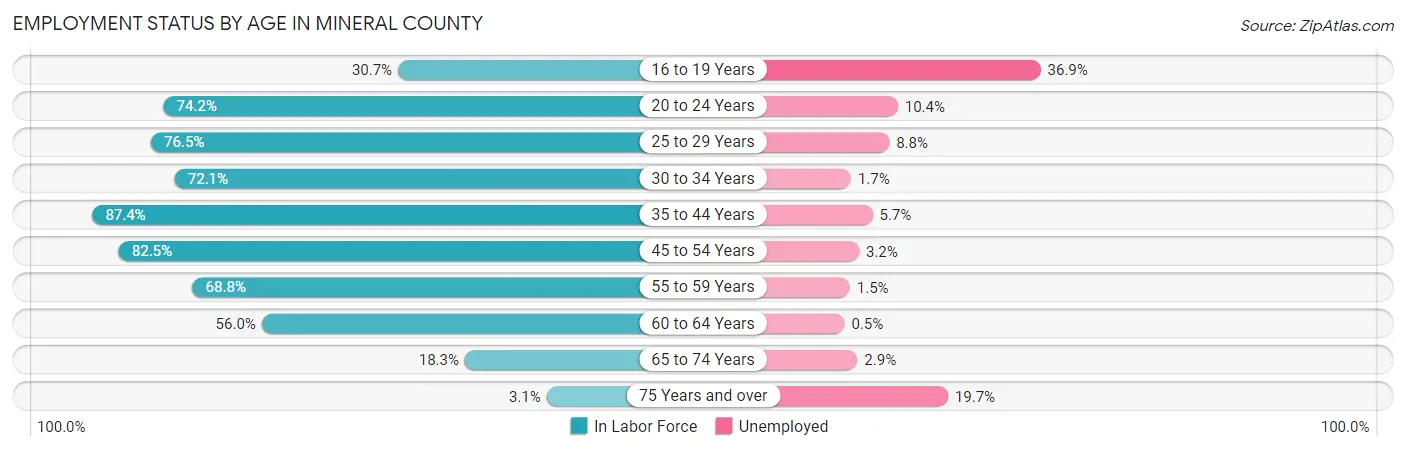
| Age Bracket | In Labor Force | Unemployed |
| 16 to 19 Years | 491 (30.7%) | 181 (36.9%) |
| 20 to 24 Years | 1,051 (74.2%) | 109 (10.4%) |
| 25 to 29 Years | 1,245 (76.5%) | 110 (8.8%) |
| 30 to 34 Years | 1,035 (72.1%) | 18 (1.7%) |
| 35 to 44 Years | 2,577 (87.4%) | 147 (5.7%) |
| 45 to 54 Years | 3,018 (82.5%) | 97 (3.2%) |
| 55 to 59 Years | 1,137 (68.8%) | 17 (1.5%) |
| 60 to 64 Years | 1,168 (56.0%) | 6 (0.5%) |
| 65 to 74 Years | 651 (18.3%) | 19 (2.9%) |
| 75 Years and over | 75 (3.1%) | 15 (19.7%) |
| Total | 12,454 (55.6%) | 722 (5.8%) |
Employment Status by Educational Attainment in Mineral County
According to labor force statistics for Mineral County, 75.9% of individuals (10,176) out of the total population between 25 and 64 years of age (13,407) are in the labor force, with 3.9% or 397 of them being unemployed. The group with the highest labor force participation rate are those with the educational attainment of bachelor's degree or higher, with 92.1% or 2,784 individuals in the labor force. Within the labor force, individuals with less than high school education have the highest percentage of unemployment, with 36.6% or 101 of them being unemployed.
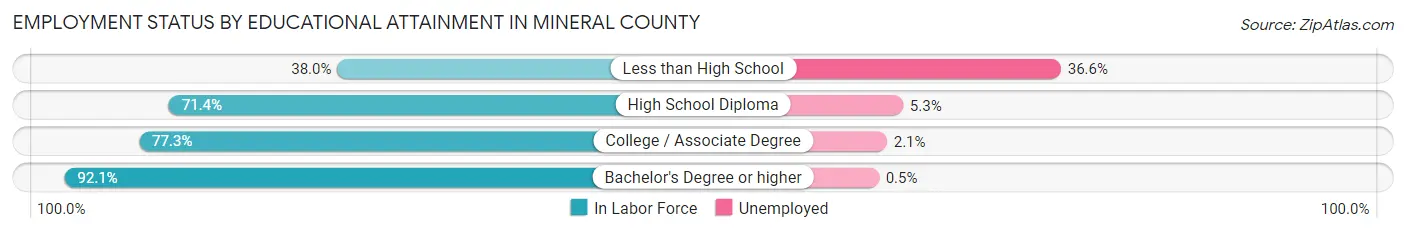
| Educational Attainment | In Labor Force | Unemployed |
| Less than High School | 276 (38.0%) | 266 (36.6%) |
| High School Diploma | 4,155 (71.4%) | 308 (5.3%) |
| College / Associate Degree | 2,968 (77.3%) | 81 (2.1%) |
| Bachelor's Degree or higher | 2,784 (92.1%) | 15 (0.5%) |
| Total | 10,176 (75.9%) | 523 (3.9%) |
Employment Occupations by Sex in Mineral County
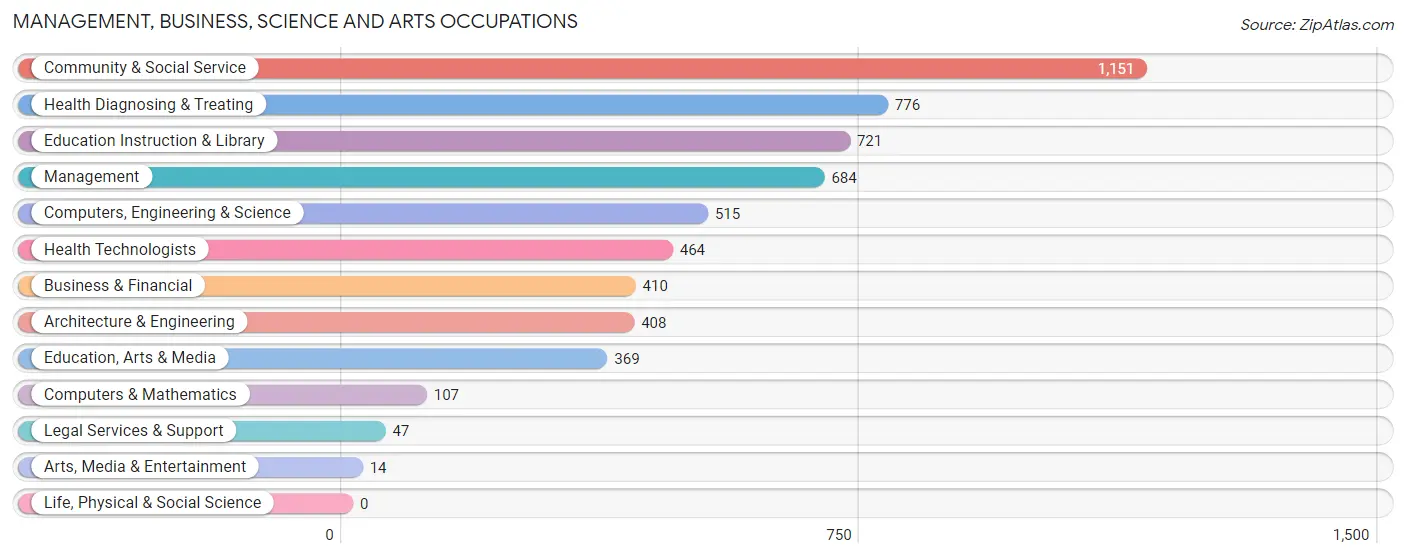
Management, Business, Science and Arts Occupations
The most common Management, Business, Science and Arts occupations in Mineral County are Community & Social Service (1,151 | 9.8%), Health Diagnosing & Treating (776 | 6.6%), Education Instruction & Library (721 | 6.1%), Management (684 | 5.8%), and Computers, Engineering & Science (515 | 4.4%).
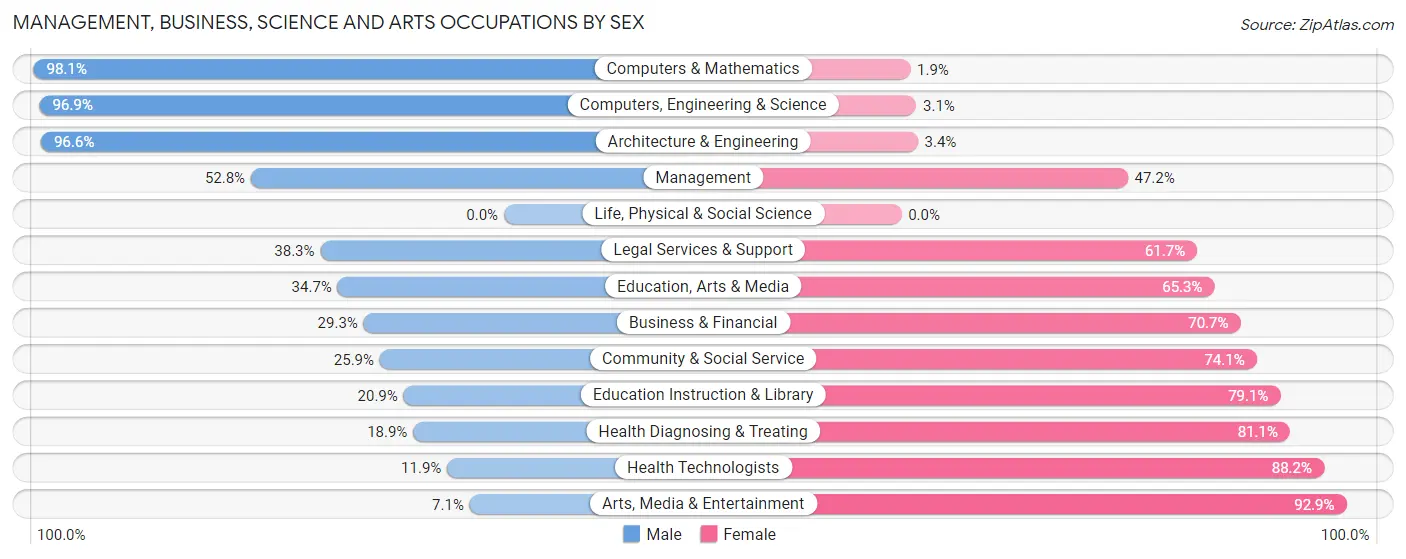
Management, Business, Science and Arts Occupations by Sex
Within the Management, Business, Science and Arts occupations in Mineral County, the most male-oriented occupations are Computers & Mathematics (98.1%), Computers, Engineering & Science (96.9%), and Architecture & Engineering (96.6%), while the most female-oriented occupations are Arts, Media & Entertainment (92.9%), Health Technologists (88.1%), and Health Diagnosing & Treating (81.1%).
| Occupation | Male | Female |
| Management | 361 (52.8%) | 323 (47.2%) |
| Business & Financial | 120 (29.3%) | 290 (70.7%) |
| Computers, Engineering & Science | 499 (96.9%) | 16 (3.1%) |
| Computers & Mathematics | 105 (98.1%) | 2 (1.9%) |
| Architecture & Engineering | 394 (96.6%) | 14 (3.4%) |
| Life, Physical & Social Science | 0 (0.0%) | 0 (0.0%) |
| Community & Social Service | 298 (25.9%) | 853 (74.1%) |
| Education, Arts & Media | 128 (34.7%) | 241 (65.3%) |
| Legal Services & Support | 18 (38.3%) | 29 (61.7%) |
| Education Instruction & Library | 151 (20.9%) | 570 (79.1%) |
| Arts, Media & Entertainment | 1 (7.1%) | 13 (92.9%) |
| Health Diagnosing & Treating | 147 (18.9%) | 629 (81.1%) |
| Health Technologists | 55 (11.8%) | 409 (88.1%) |
| Total (Category) | 1,425 (40.3%) | 2,111 (59.7%) |
| Total (Overall) | 6,144 (52.4%) | 5,586 (47.6%) |
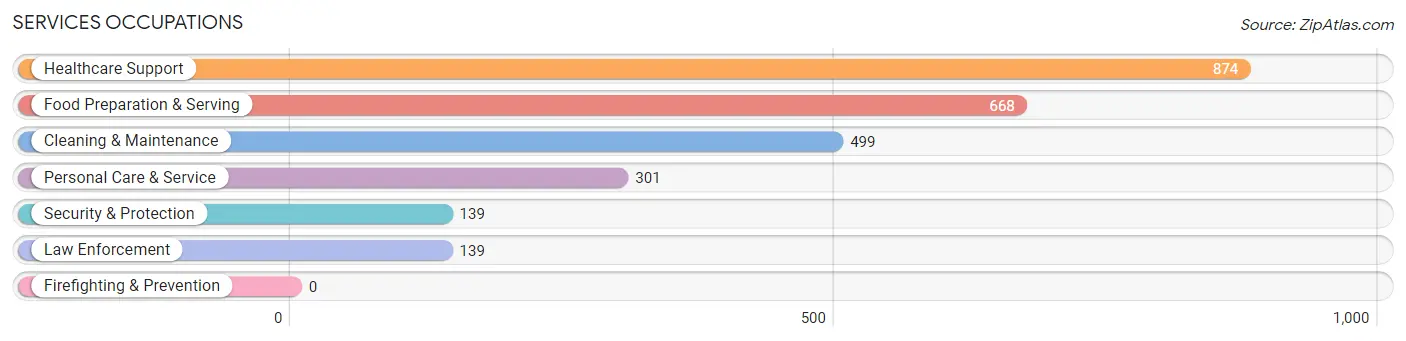
Services Occupations
The most common Services occupations in Mineral County are Healthcare Support (874 | 7.4%), Food Preparation & Serving (668 | 5.7%), Cleaning & Maintenance (499 | 4.3%), Personal Care & Service (301 | 2.6%), and Security & Protection (139 | 1.2%).
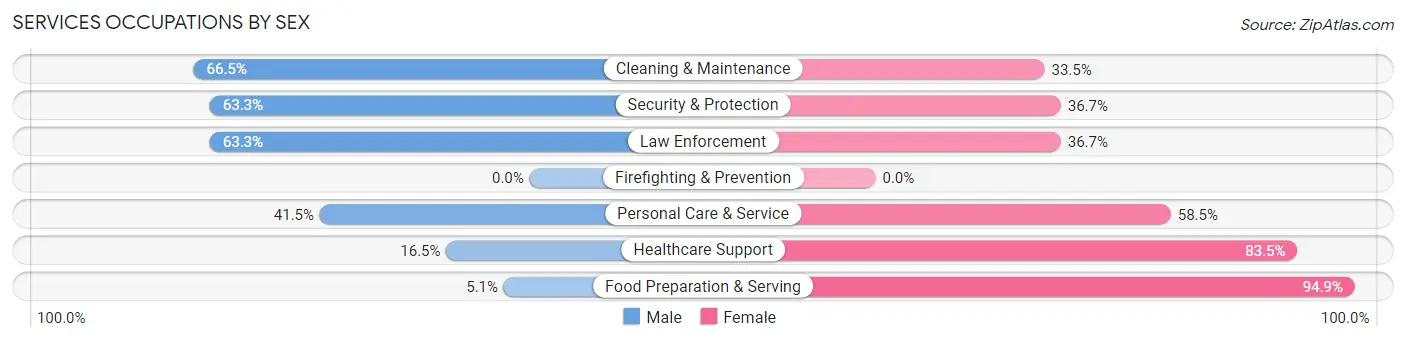
Services Occupations by Sex
Within the Services occupations in Mineral County, the most male-oriented occupations are Cleaning & Maintenance (66.5%), Security & Protection (63.3%), and Law Enforcement (63.3%), while the most female-oriented occupations are Food Preparation & Serving (94.9%), Healthcare Support (83.5%), and Personal Care & Service (58.5%).
| Occupation | Male | Female |
| Healthcare Support | 144 (16.5%) | 730 (83.5%) |
| Security & Protection | 88 (63.3%) | 51 (36.7%) |
| Firefighting & Prevention | 0 (0.0%) | 0 (0.0%) |
| Law Enforcement | 88 (63.3%) | 51 (36.7%) |
| Food Preparation & Serving | 34 (5.1%) | 634 (94.9%) |
| Cleaning & Maintenance | 332 (66.5%) | 167 (33.5%) |
| Personal Care & Service | 125 (41.5%) | 176 (58.5%) |
| Total (Category) | 723 (29.1%) | 1,758 (70.9%) |
| Total (Overall) | 6,144 (52.4%) | 5,586 (47.6%) |
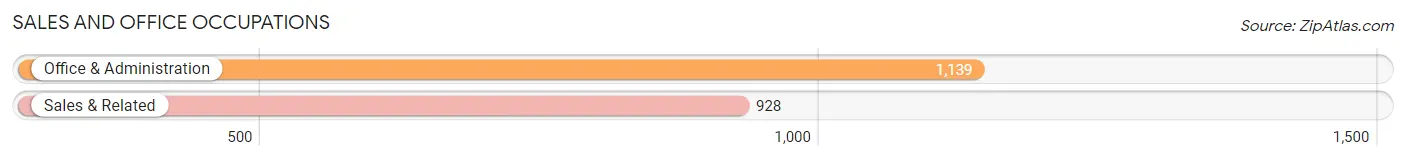
Sales and Office Occupations
The most common Sales and Office occupations in Mineral County are Office & Administration (1,139 | 9.7%), and Sales & Related (928 | 7.9%).
Sales and Office Occupations by Sex
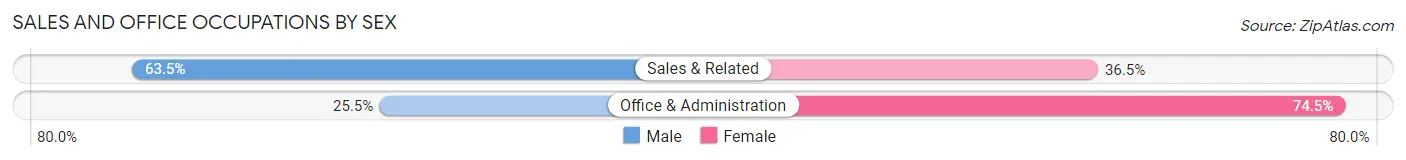
| Occupation | Male | Female |
| Sales & Related | 589 (63.5%) | 339 (36.5%) |
| Office & Administration | 290 (25.5%) | 849 (74.5%) |
| Total (Category) | 879 (42.5%) | 1,188 (57.5%) |
| Total (Overall) | 6,144 (52.4%) | 5,586 (47.6%) |
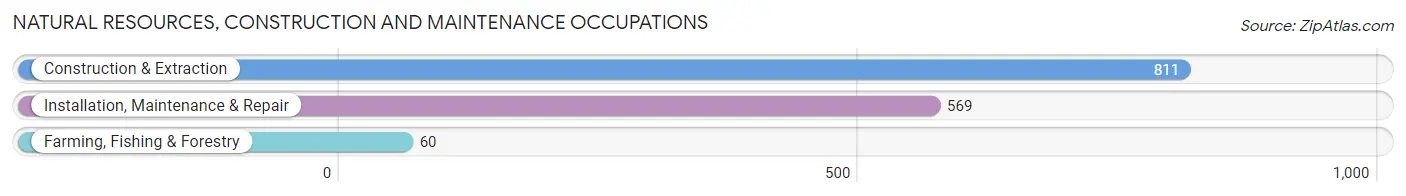
Natural Resources, Construction and Maintenance Occupations
The most common Natural Resources, Construction and Maintenance occupations in Mineral County are Construction & Extraction (811 | 6.9%), Installation, Maintenance & Repair (569 | 4.9%), and Farming, Fishing & Forestry (60 | 0.5%).
Natural Resources, Construction and Maintenance Occupations by Sex
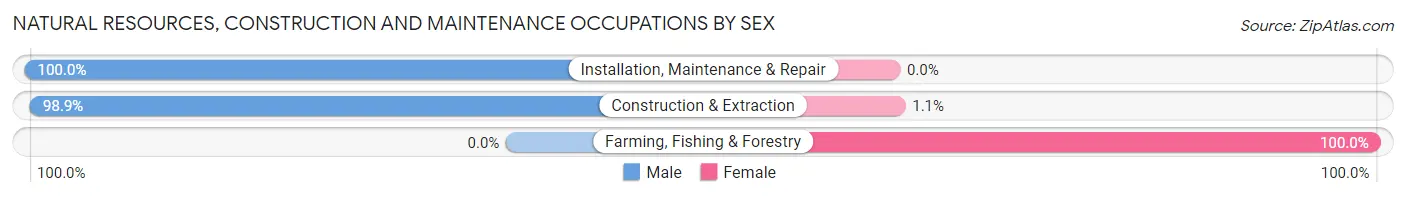
| Occupation | Male | Female |
| Farming, Fishing & Forestry | 0 (0.0%) | 60 (100.0%) |
| Construction & Extraction | 802 (98.9%) | 9 (1.1%) |
| Installation, Maintenance & Repair | 569 (100.0%) | 0 (0.0%) |
| Total (Category) | 1,371 (95.2%) | 69 (4.8%) |
| Total (Overall) | 6,144 (52.4%) | 5,586 (47.6%) |
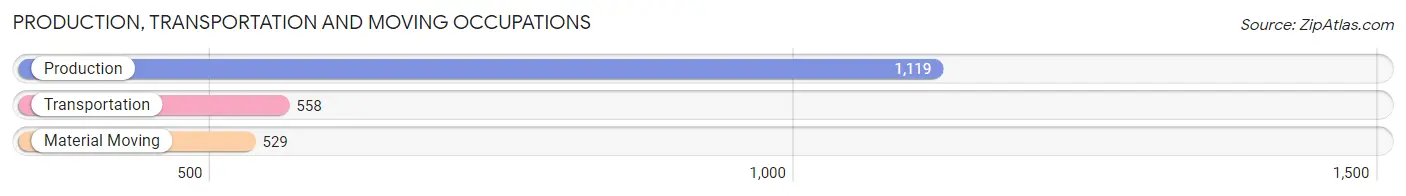
Production, Transportation and Moving Occupations
The most common Production, Transportation and Moving occupations in Mineral County are Production (1,119 | 9.5%), Transportation (558 | 4.8%), and Material Moving (529 | 4.5%).
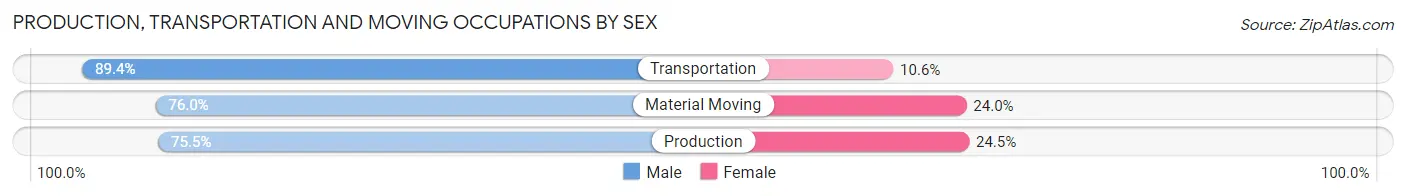
Production, Transportation and Moving Occupations by Sex
| Occupation | Male | Female |
| Production | 845 (75.5%) | 274 (24.5%) |
| Transportation | 499 (89.4%) | 59 (10.6%) |
| Material Moving | 402 (76.0%) | 127 (24.0%) |
| Total (Category) | 1,746 (79.1%) | 460 (20.8%) |
| Total (Overall) | 6,144 (52.4%) | 5,586 (47.6%) |
Employment Industries by Sex in Mineral County
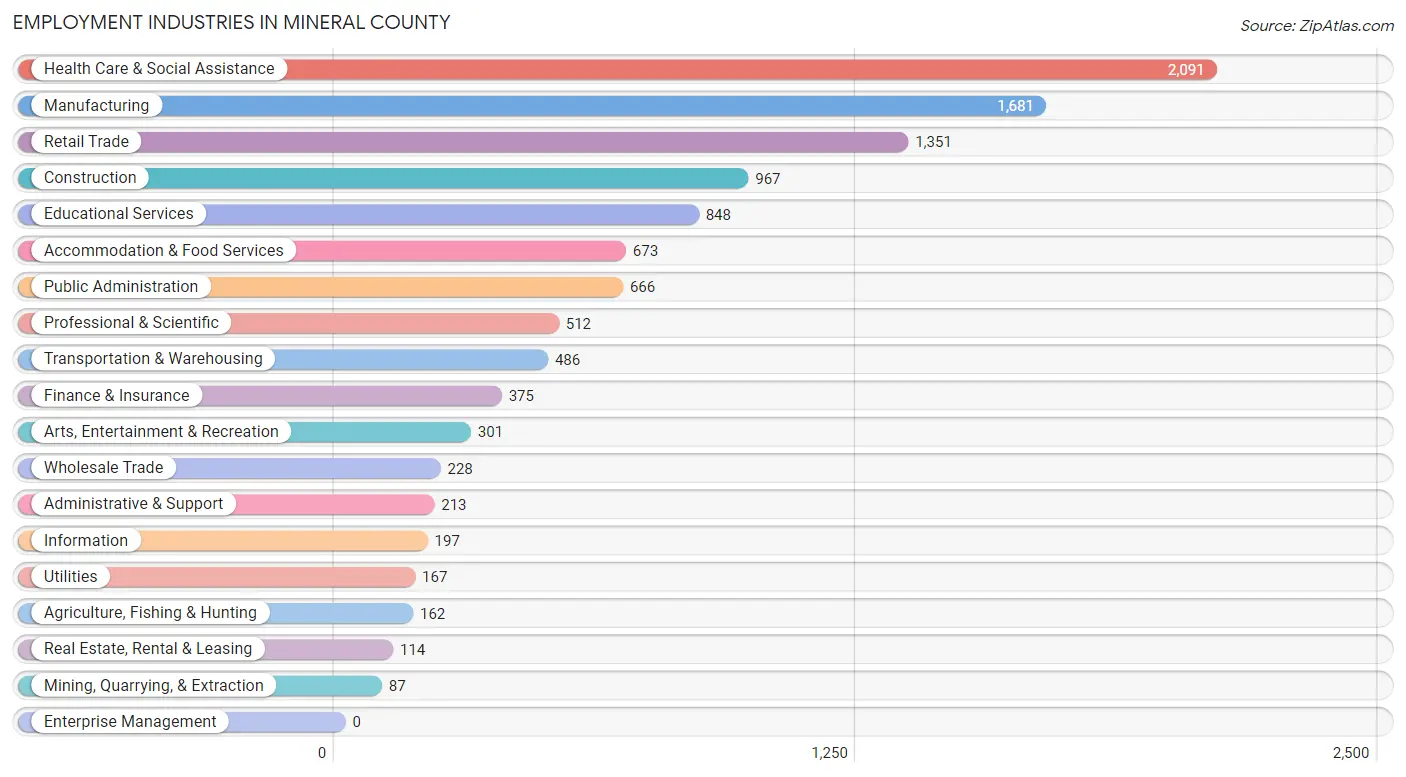
Employment Industries in Mineral County
The major employment industries in Mineral County include Health Care & Social Assistance (2,091 | 17.8%), Manufacturing (1,681 | 14.3%), Retail Trade (1,351 | 11.5%), Construction (967 | 8.2%), and Educational Services (848 | 7.2%).
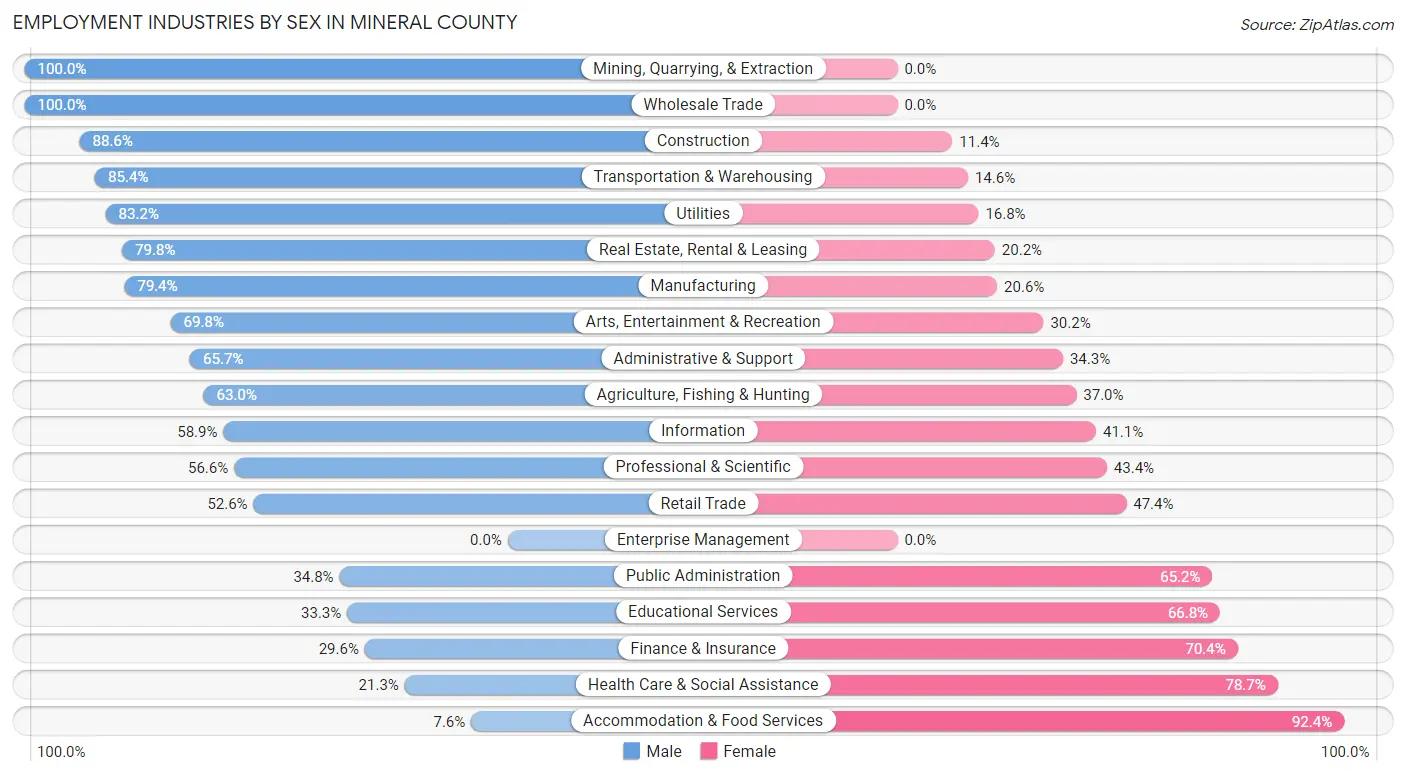
Employment Industries by Sex in Mineral County
The Mineral County industries that see more men than women are Mining, Quarrying, & Extraction (100.0%), Wholesale Trade (100.0%), and Construction (88.6%), whereas the industries that tend to have a higher number of women are Accommodation & Food Services (92.4%), Health Care & Social Assistance (78.7%), and Finance & Insurance (70.4%).
| Industry | Male | Female |
| Agriculture, Fishing & Hunting | 102 (63.0%) | 60 (37.0%) |
| Mining, Quarrying, & Extraction | 87 (100.0%) | 0 (0.0%) |
| Construction | 857 (88.6%) | 110 (11.4%) |
| Manufacturing | 1,334 (79.4%) | 347 (20.6%) |
| Wholesale Trade | 228 (100.0%) | 0 (0.0%) |
| Retail Trade | 711 (52.6%) | 640 (47.4%) |
| Transportation & Warehousing | 415 (85.4%) | 71 (14.6%) |
| Utilities | 139 (83.2%) | 28 (16.8%) |
| Information | 116 (58.9%) | 81 (41.1%) |
| Finance & Insurance | 111 (29.6%) | 264 (70.4%) |
| Real Estate, Rental & Leasing | 91 (79.8%) | 23 (20.2%) |
| Professional & Scientific | 290 (56.6%) | 222 (43.4%) |
| Enterprise Management | 0 (0.0%) | 0 (0.0%) |
| Administrative & Support | 140 (65.7%) | 73 (34.3%) |
| Educational Services | 282 (33.3%) | 566 (66.7%) |
| Health Care & Social Assistance | 446 (21.3%) | 1,645 (78.7%) |
| Arts, Entertainment & Recreation | 210 (69.8%) | 91 (30.2%) |
| Accommodation & Food Services | 51 (7.6%) | 622 (92.4%) |
| Public Administration | 232 (34.8%) | 434 (65.2%) |
| Total | 6,144 (52.4%) | 5,586 (47.6%) |
Education in Mineral County
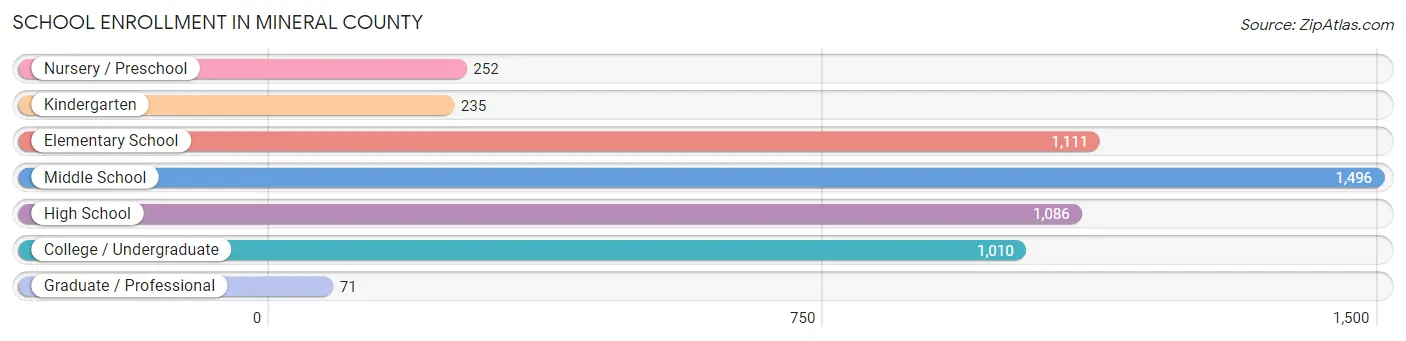
School Enrollment in Mineral County
The most common levels of schooling among the 5,261 students in Mineral County are middle school (1,496 | 28.4%), elementary school (1,111 | 21.1%), and high school (1,086 | 20.6%).
| School Level | # Students | % Students |
| Nursery / Preschool | 252 | 4.8% |
| Kindergarten | 235 | 4.5% |
| Elementary School | 1,111 | 21.1% |
| Middle School | 1,496 | 28.4% |
| High School | 1,086 | 20.6% |
| College / Undergraduate | 1,010 | 19.2% |
| Graduate / Professional | 71 | 1.3% |
| Total | 5,261 | 100.0% |
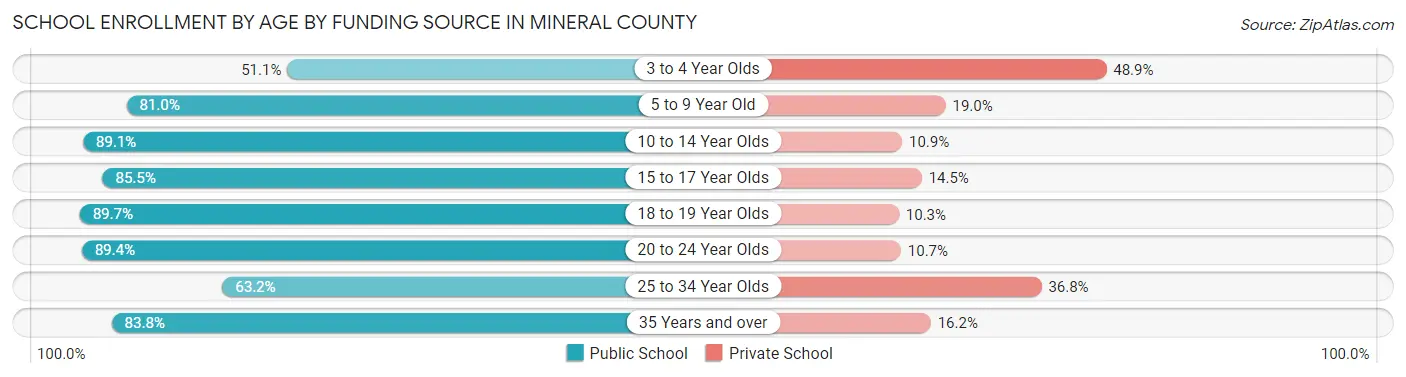
School Enrollment by Age by Funding Source in Mineral County
Out of a total of 5,261 students who are enrolled in schools in Mineral County, 800 (15.2%) attend a private institution, while the remaining 4,461 (84.8%) are enrolled in public schools. The age group of 3 to 4 year olds has the highest likelihood of being enrolled in private schools, with 68 (48.9% in the age bracket) enrolled. Conversely, the age group of 18 to 19 year olds has the lowest likelihood of being enrolled in a private school, with 515 (89.7% in the age bracket) attending a public institution.
| Age Bracket | Public School | Private School |
| 3 to 4 Year Olds | 71 (51.1%) | 68 (48.9%) |
| 5 to 9 Year Old | 986 (81.0%) | 231 (19.0%) |
| 10 to 14 Year Olds | 1,665 (89.1%) | 203 (10.9%) |
| 15 to 17 Year Olds | 712 (85.5%) | 121 (14.5%) |
| 18 to 19 Year Olds | 515 (89.7%) | 59 (10.3%) |
| 20 to 24 Year Olds | 344 (89.3%) | 41 (10.6%) |
| 25 to 34 Year Olds | 108 (63.2%) | 63 (36.8%) |
| 35 Years and over | 62 (83.8%) | 12 (16.2%) |
| Total | 4,461 (84.8%) | 800 (15.2%) |
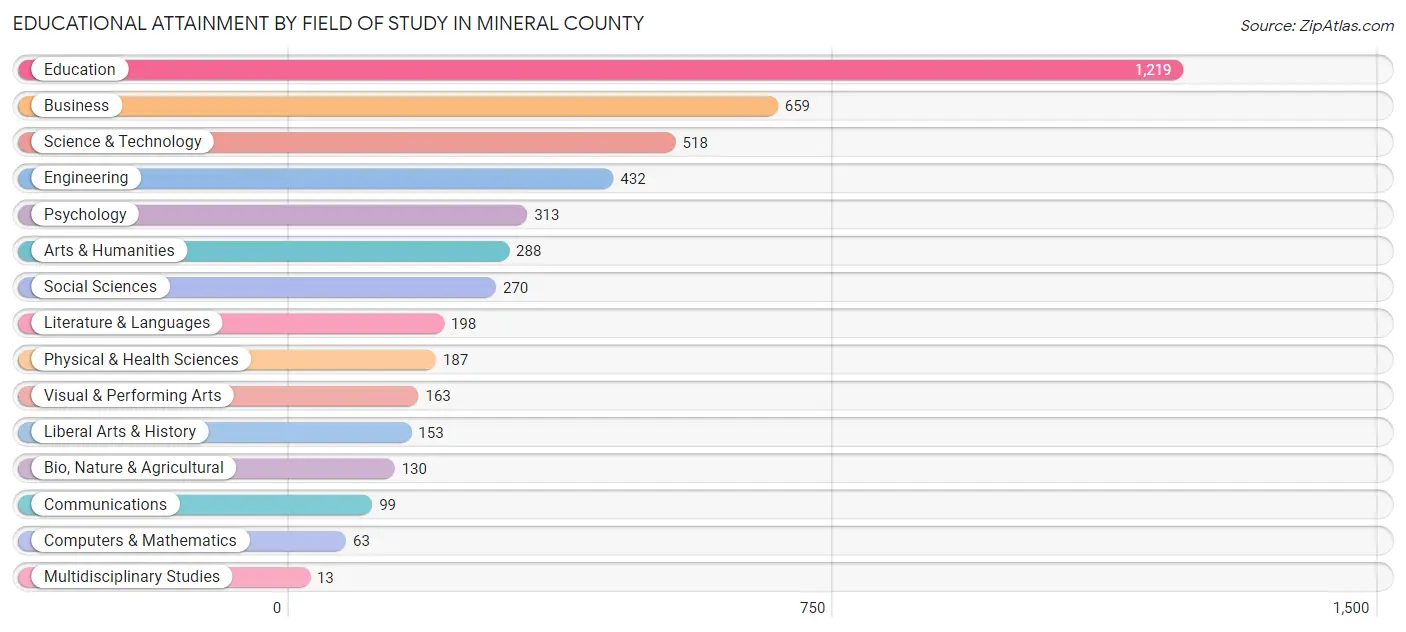
Educational Attainment by Field of Study in Mineral County
Education (1,219 | 25.9%), business (659 | 14.0%), science & technology (518 | 11.0%), engineering (432 | 9.2%), and psychology (313 | 6.7%) are the most common fields of study among 4,705 individuals in Mineral County who have obtained a bachelor's degree or higher.
| Field of Study | # Graduates | % Graduates |
| Computers & Mathematics | 63 | 1.3% |
| Bio, Nature & Agricultural | 130 | 2.8% |
| Physical & Health Sciences | 187 | 4.0% |
| Psychology | 313 | 6.7% |
| Social Sciences | 270 | 5.7% |
| Engineering | 432 | 9.2% |
| Multidisciplinary Studies | 13 | 0.3% |
| Science & Technology | 518 | 11.0% |
| Business | 659 | 14.0% |
| Education | 1,219 | 25.9% |
| Literature & Languages | 198 | 4.2% |
| Liberal Arts & History | 153 | 3.3% |
| Visual & Performing Arts | 163 | 3.5% |
| Communications | 99 | 2.1% |
| Arts & Humanities | 288 | 6.1% |
| Total | 4,705 | 100.0% |
Transportation & Commute in Mineral County
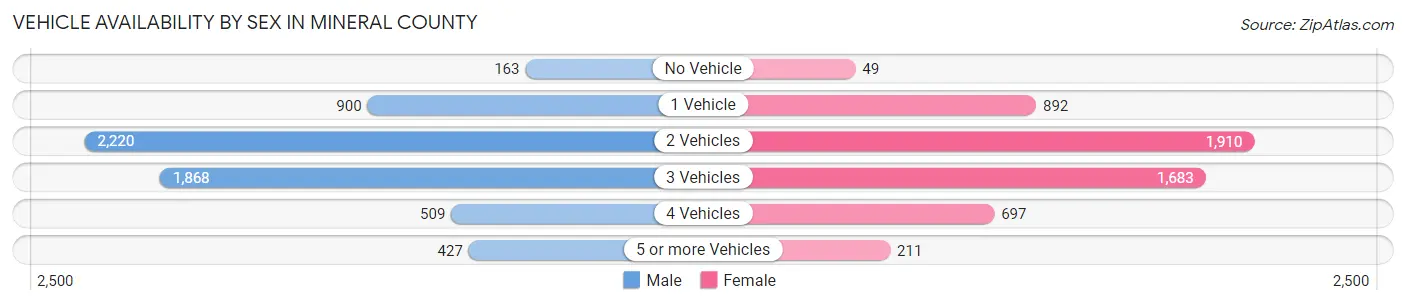
Vehicle Availability by Sex in Mineral County
The most prevalent vehicle ownership categories in Mineral County are males with 2 vehicles (2,220, accounting for 36.5%) and females with 2 vehicles (1,910, making up 40.8%).
| Vehicles Available | Male | Female |
| No Vehicle | 163 (2.7%) | 49 (0.9%) |
| 1 Vehicle | 900 (14.8%) | 892 (16.4%) |
| 2 Vehicles | 2,220 (36.5%) | 1,910 (35.1%) |
| 3 Vehicles | 1,868 (30.7%) | 1,683 (30.9%) |
| 4 Vehicles | 509 (8.4%) | 697 (12.8%) |
| 5 or more Vehicles | 427 (7.0%) | 211 (3.9%) |
| Total | 6,087 (100.0%) | 5,442 (100.0%) |
Commute Time in Mineral County
The most frequently occuring commute durations in Mineral County are 10 to 14 minutes (1,567 commuters, 14.6%), 15 to 19 minutes (1,554 commuters, 14.5%), and 20 to 24 minutes (1,551 commuters, 14.5%).
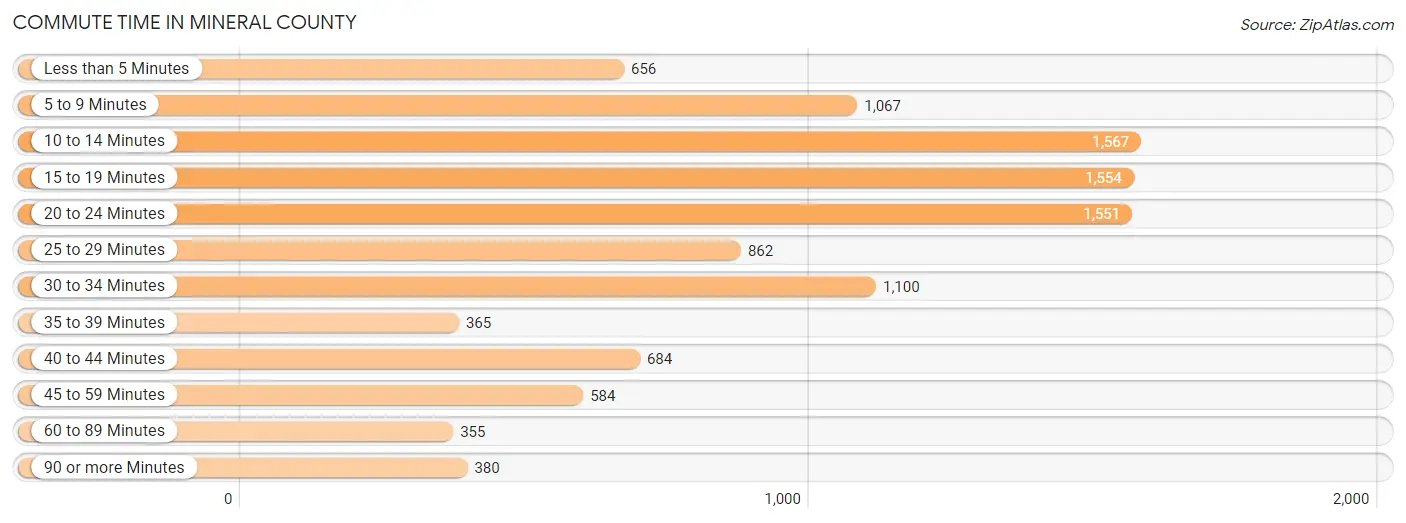
| Commute Time | # Commuters | % Commuters |
| Less than 5 Minutes | 656 | 6.1% |
| 5 to 9 Minutes | 1,067 | 10.0% |
| 10 to 14 Minutes | 1,567 | 14.6% |
| 15 to 19 Minutes | 1,554 | 14.5% |
| 20 to 24 Minutes | 1,551 | 14.5% |
| 25 to 29 Minutes | 862 | 8.0% |
| 30 to 34 Minutes | 1,100 | 10.3% |
| 35 to 39 Minutes | 365 | 3.4% |
| 40 to 44 Minutes | 684 | 6.4% |
| 45 to 59 Minutes | 584 | 5.4% |
| 60 to 89 Minutes | 355 | 3.3% |
| 90 or more Minutes | 380 | 3.5% |
Commute Time by Sex in Mineral County
The most common commute times in Mineral County are 10 to 14 minutes (933 commuters, 16.4%) for males and 15 to 19 minutes (792 commuters, 15.8%) for females.
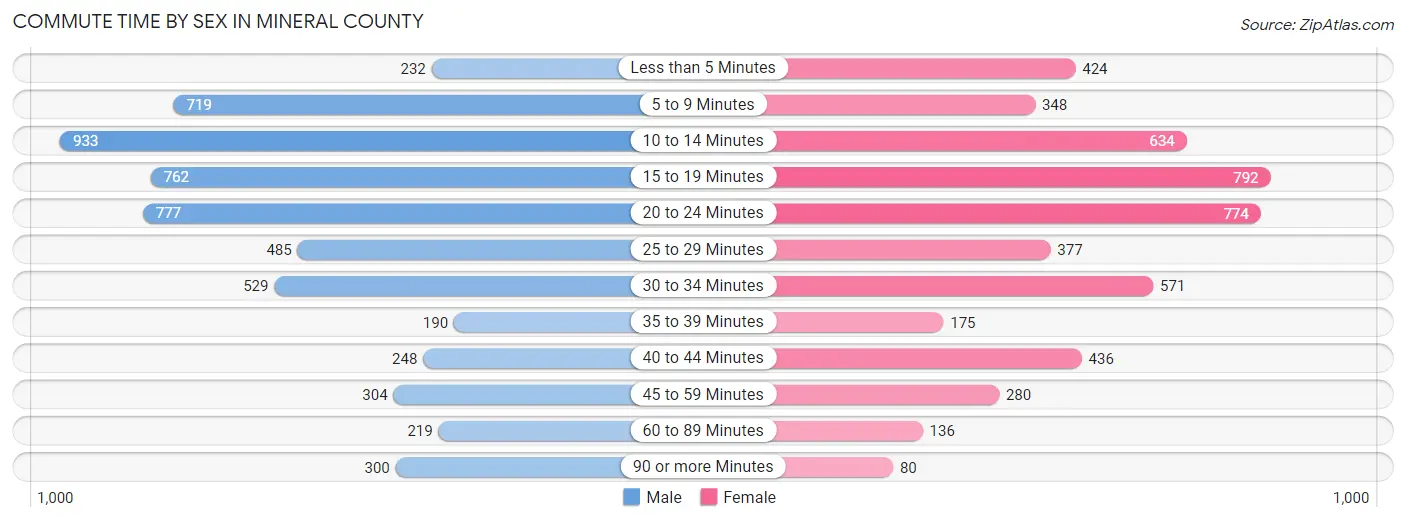
| Commute Time | Male | Female |
| Less than 5 Minutes | 232 (4.1%) | 424 (8.4%) |
| 5 to 9 Minutes | 719 (12.6%) | 348 (6.9%) |
| 10 to 14 Minutes | 933 (16.4%) | 634 (12.6%) |
| 15 to 19 Minutes | 762 (13.4%) | 792 (15.8%) |
| 20 to 24 Minutes | 777 (13.6%) | 774 (15.4%) |
| 25 to 29 Minutes | 485 (8.5%) | 377 (7.5%) |
| 30 to 34 Minutes | 529 (9.3%) | 571 (11.4%) |
| 35 to 39 Minutes | 190 (3.3%) | 175 (3.5%) |
| 40 to 44 Minutes | 248 (4.3%) | 436 (8.7%) |
| 45 to 59 Minutes | 304 (5.3%) | 280 (5.6%) |
| 60 to 89 Minutes | 219 (3.8%) | 136 (2.7%) |
| 90 or more Minutes | 300 (5.3%) | 80 (1.6%) |
Time of Departure to Work by Sex in Mineral County
The most frequent times of departure to work in Mineral County are 7:00 AM to 7:29 AM (870, 15.3%) for males and 7:00 AM to 7:29 AM (790, 15.7%) for females.
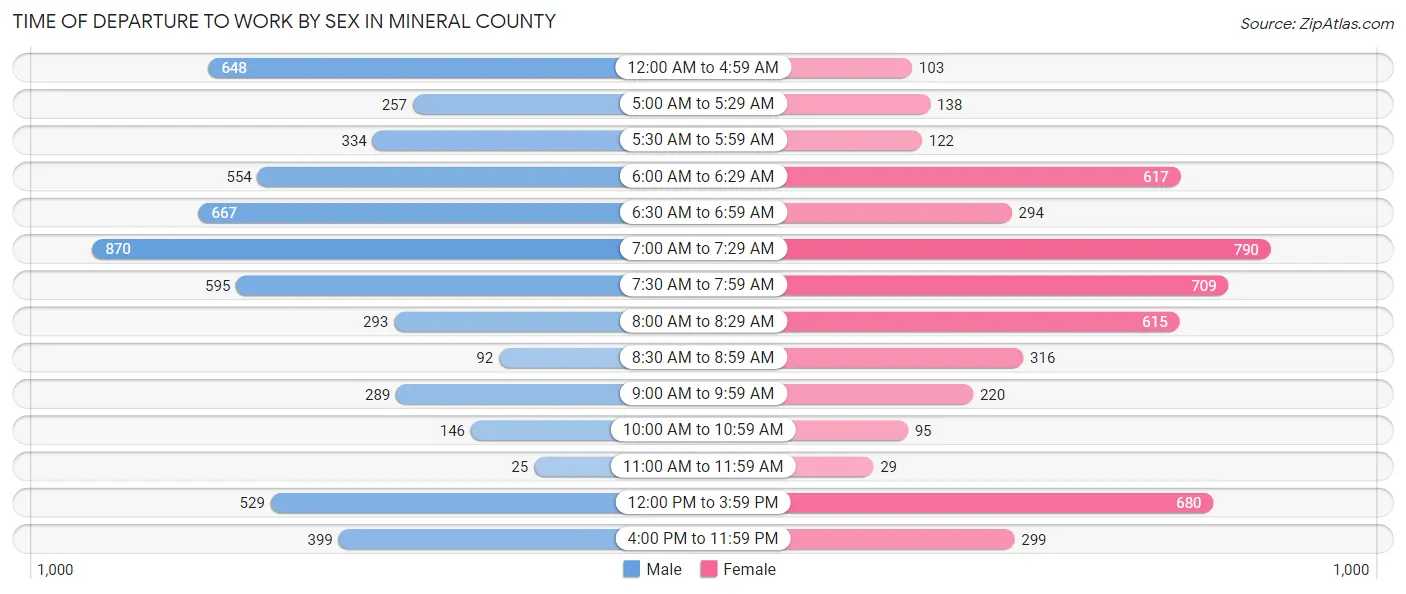
| Time of Departure | Male | Female |
| 12:00 AM to 4:59 AM | 648 (11.4%) | 103 (2.1%) |
| 5:00 AM to 5:29 AM | 257 (4.5%) | 138 (2.8%) |
| 5:30 AM to 5:59 AM | 334 (5.9%) | 122 (2.4%) |
| 6:00 AM to 6:29 AM | 554 (9.7%) | 617 (12.3%) |
| 6:30 AM to 6:59 AM | 667 (11.7%) | 294 (5.9%) |
| 7:00 AM to 7:29 AM | 870 (15.3%) | 790 (15.7%) |
| 7:30 AM to 7:59 AM | 595 (10.4%) | 709 (14.1%) |
| 8:00 AM to 8:29 AM | 293 (5.1%) | 615 (12.2%) |
| 8:30 AM to 8:59 AM | 92 (1.6%) | 316 (6.3%) |
| 9:00 AM to 9:59 AM | 289 (5.1%) | 220 (4.4%) |
| 10:00 AM to 10:59 AM | 146 (2.6%) | 95 (1.9%) |
| 11:00 AM to 11:59 AM | 25 (0.4%) | 29 (0.6%) |
| 12:00 PM to 3:59 PM | 529 (9.3%) | 680 (13.5%) |
| 4:00 PM to 11:59 PM | 399 (7.0%) | 299 (5.9%) |
| Total | 5,698 (100.0%) | 5,027 (100.0%) |
Housing Occupancy in Mineral County
Occupancy by Ownership in Mineral County
Of the total 10,532 dwellings in Mineral County, owner-occupied units account for 8,533 (81.0%), while renter-occupied units make up 1,999 (19.0%).
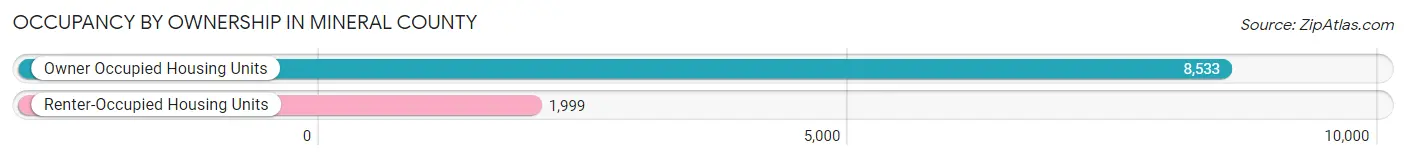
| Occupancy | # Housing Units | % Housing Units |
| Owner Occupied Housing Units | 8,533 | 81.0% |
| Renter-Occupied Housing Units | 1,999 | 19.0% |
| Total Occupied Housing Units | 10,532 | 100.0% |
Occupancy by Household Size in Mineral County
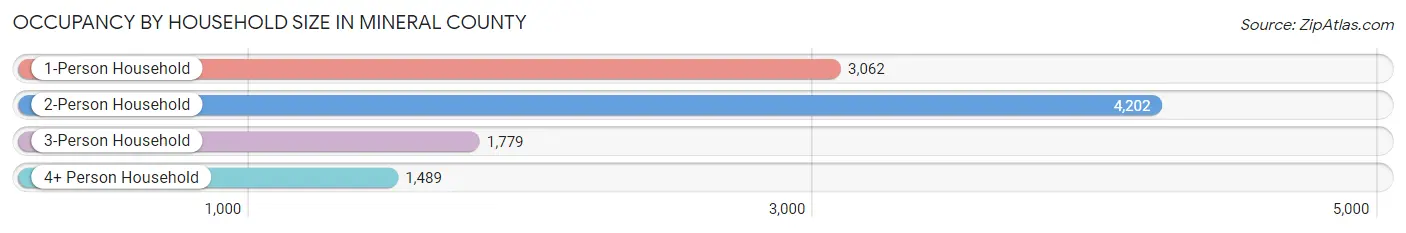
| Household Size | # Housing Units | % Housing Units |
| 1-Person Household | 3,062 | 29.1% |
| 2-Person Household | 4,202 | 39.9% |
| 3-Person Household | 1,779 | 16.9% |
| 4+ Person Household | 1,489 | 14.1% |
| Total Housing Units | 10,532 | 100.0% |
Occupancy by Ownership by Household Size in Mineral County
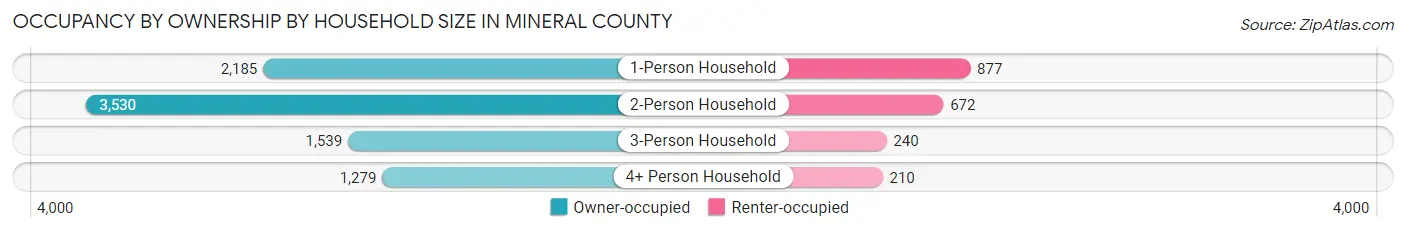
| Household Size | Owner-occupied | Renter-occupied |
| 1-Person Household | 2,185 (71.4%) | 877 (28.6%) |
| 2-Person Household | 3,530 (84.0%) | 672 (16.0%) |
| 3-Person Household | 1,539 (86.5%) | 240 (13.5%) |
| 4+ Person Household | 1,279 (85.9%) | 210 (14.1%) |
| Total Housing Units | 8,533 (81.0%) | 1,999 (19.0%) |
Occupancy by Educational Attainment in Mineral County
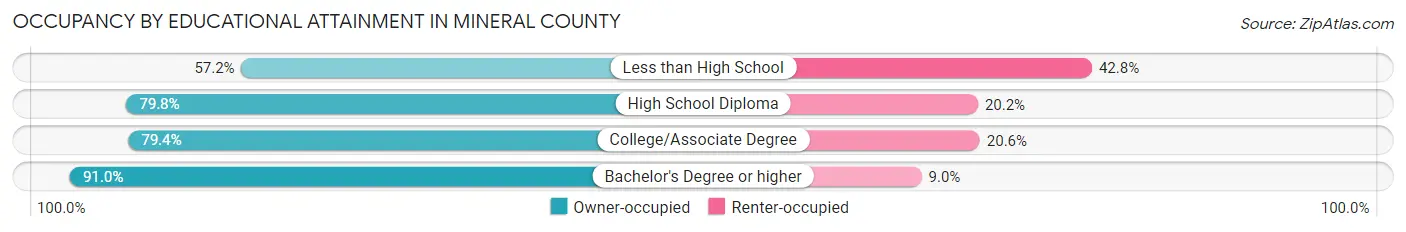
| Household Size | Owner-occupied | Renter-occupied |
| Less than High School | 341 (57.2%) | 255 (42.8%) |
| High School Diploma | 3,733 (79.8%) | 944 (20.2%) |
| College/Associate Degree | 2,245 (79.4%) | 581 (20.6%) |
| Bachelor's Degree or higher | 2,214 (91.0%) | 219 (9.0%) |
Occupancy by Age of Householder in Mineral County
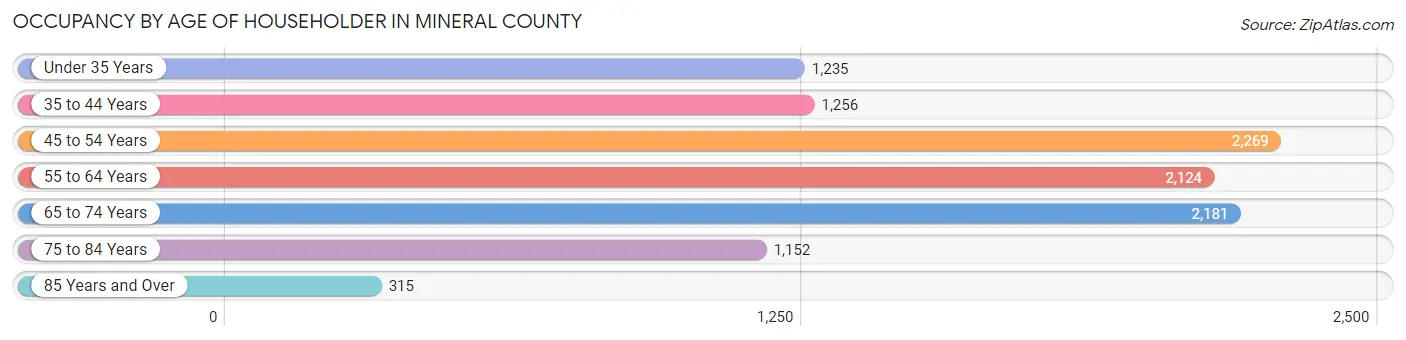
| Age Bracket | # Households | % Households |
| Under 35 Years | 1,235 | 11.7% |
| 35 to 44 Years | 1,256 | 11.9% |
| 45 to 54 Years | 2,269 | 21.5% |
| 55 to 64 Years | 2,124 | 20.2% |
| 65 to 74 Years | 2,181 | 20.7% |
| 75 to 84 Years | 1,152 | 10.9% |
| 85 Years and Over | 315 | 3.0% |
| Total | 10,532 | 100.0% |
Housing Finances in Mineral County
Median Income by Occupancy in Mineral County
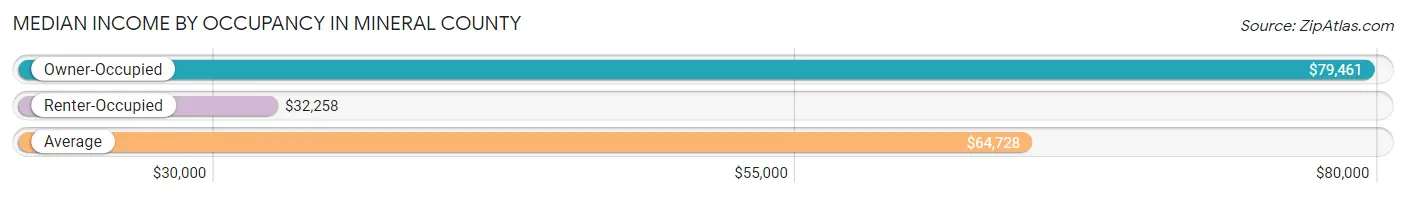
| Occupancy Type | # Households | Median Income |
| Owner-Occupied | 8,533 (81.0%) | $79,461 |
| Renter-Occupied | 1,999 (19.0%) | $32,258 |
| Average | 10,532 (100.0%) | $64,728 |
Occupancy by Householder Income Bracket in Mineral County
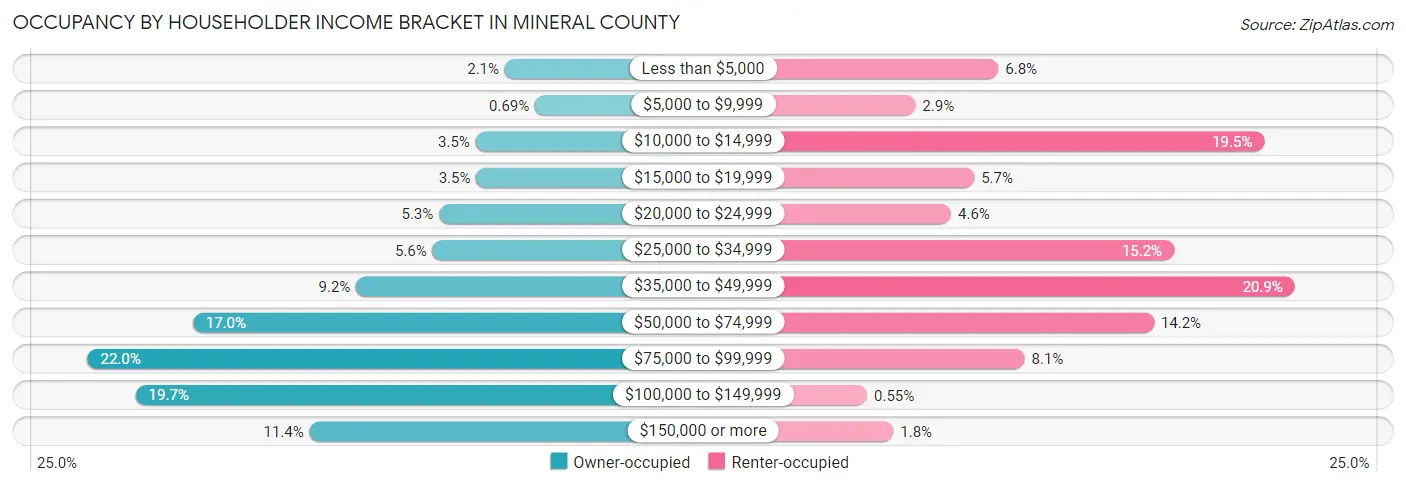
| Income Bracket | Owner-occupied | Renter-occupied |
| Less than $5,000 | 182 (2.1%) | 136 (6.8%) |
| $5,000 to $9,999 | 59 (0.7%) | 57 (2.9%) |
| $10,000 to $14,999 | 300 (3.5%) | 389 (19.5%) |
| $15,000 to $19,999 | 298 (3.5%) | 113 (5.7%) |
| $20,000 to $24,999 | 449 (5.3%) | 91 (4.5%) |
| $25,000 to $34,999 | 475 (5.6%) | 303 (15.2%) |
| $35,000 to $49,999 | 786 (9.2%) | 418 (20.9%) |
| $50,000 to $74,999 | 1,450 (17.0%) | 284 (14.2%) |
| $75,000 to $99,999 | 1,877 (22.0%) | 161 (8.1%) |
| $100,000 to $149,999 | 1,682 (19.7%) | 11 (0.5%) |
| $150,000 or more | 975 (11.4%) | 36 (1.8%) |
| Total | 8,533 (100.0%) | 1,999 (100.0%) |
Monthly Housing Cost Tiers in Mineral County
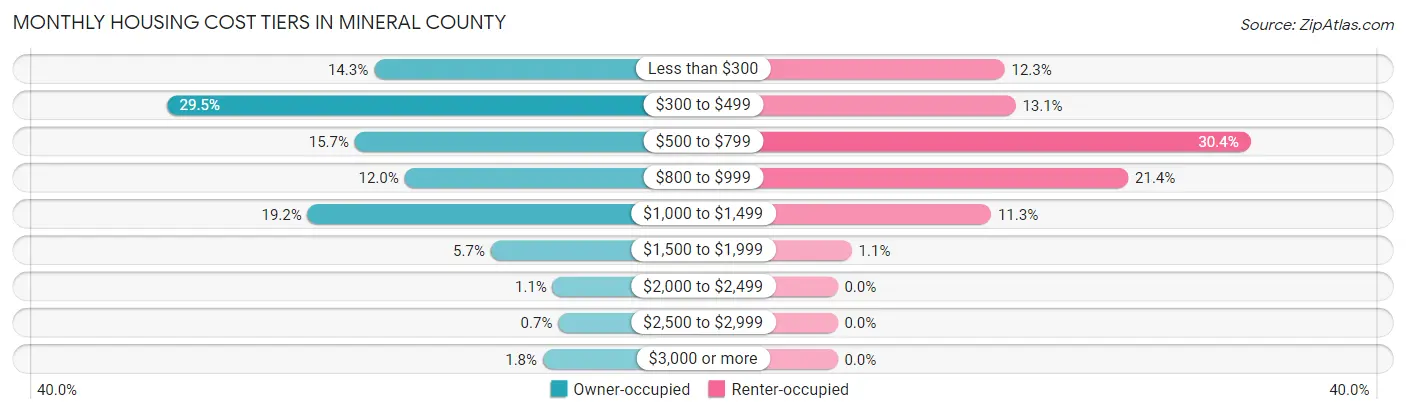
| Monthly Cost | Owner-occupied | Renter-occupied |
| Less than $300 | 1,218 (14.3%) | 246 (12.3%) |
| $300 to $499 | 2,521 (29.5%) | 262 (13.1%) |
| $500 to $799 | 1,338 (15.7%) | 608 (30.4%) |
| $800 to $999 | 1,026 (12.0%) | 428 (21.4%) |
| $1,000 to $1,499 | 1,635 (19.2%) | 226 (11.3%) |
| $1,500 to $1,999 | 484 (5.7%) | 21 (1.1%) |
| $2,000 to $2,499 | 95 (1.1%) | 0 (0.0%) |
| $2,500 to $2,999 | 60 (0.7%) | 0 (0.0%) |
| $3,000 or more | 156 (1.8%) | 0 (0.0%) |
| Total | 8,533 (100.0%) | 1,999 (100.0%) |
Physical Housing Characteristics in Mineral County
Housing Structures in Mineral County
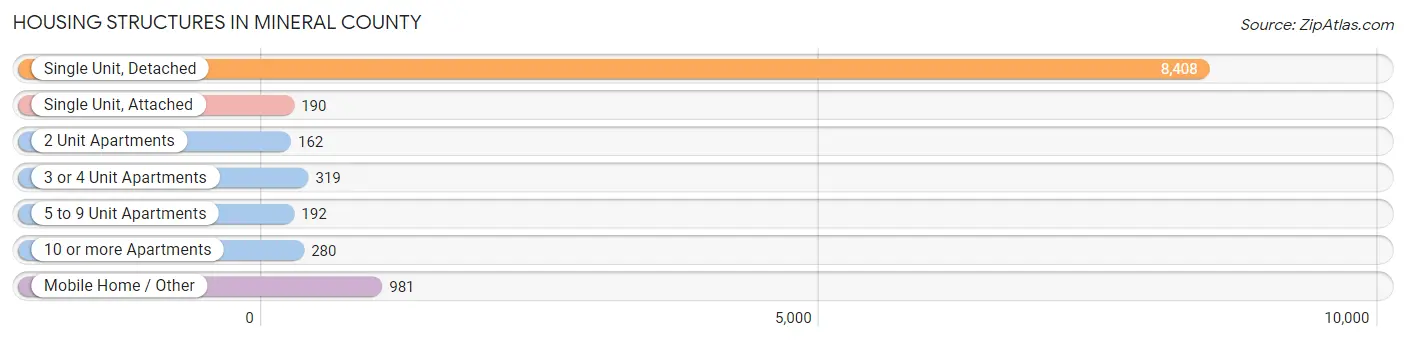
| Structure Type | # Housing Units | % Housing Units |
| Single Unit, Detached | 8,408 | 79.8% |
| Single Unit, Attached | 190 | 1.8% |
| 2 Unit Apartments | 162 | 1.5% |
| 3 or 4 Unit Apartments | 319 | 3.0% |
| 5 to 9 Unit Apartments | 192 | 1.8% |
| 10 or more Apartments | 280 | 2.7% |
| Mobile Home / Other | 981 | 9.3% |
| Total | 10,532 | 100.0% |
Housing Structures by Occupancy in Mineral County
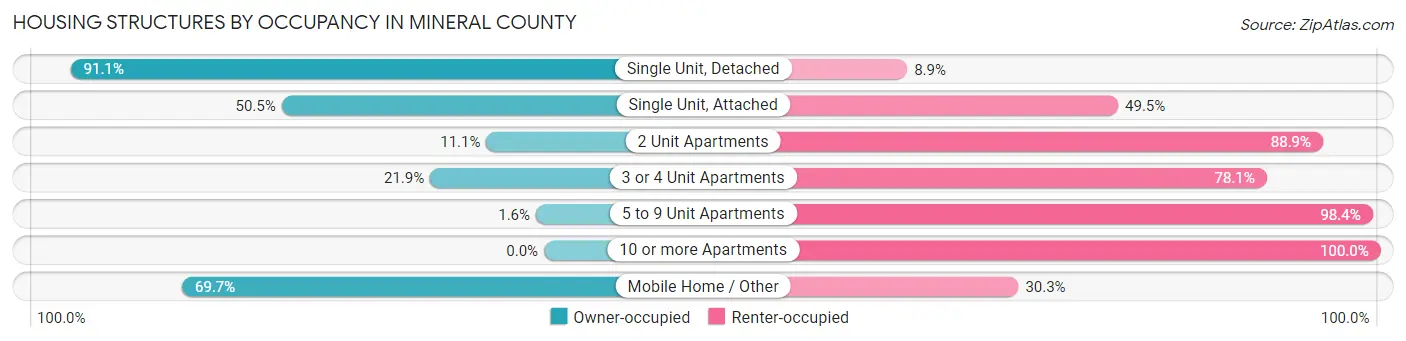
| Structure Type | Owner-occupied | Renter-occupied |
| Single Unit, Detached | 7,662 (91.1%) | 746 (8.9%) |
| Single Unit, Attached | 96 (50.5%) | 94 (49.5%) |
| 2 Unit Apartments | 18 (11.1%) | 144 (88.9%) |
| 3 or 4 Unit Apartments | 70 (21.9%) | 249 (78.1%) |
| 5 to 9 Unit Apartments | 3 (1.6%) | 189 (98.4%) |
| 10 or more Apartments | 0 (0.0%) | 280 (100.0%) |
| Mobile Home / Other | 684 (69.7%) | 297 (30.3%) |
| Total | 8,533 (81.0%) | 1,999 (19.0%) |
Housing Structures by Number of Rooms in Mineral County
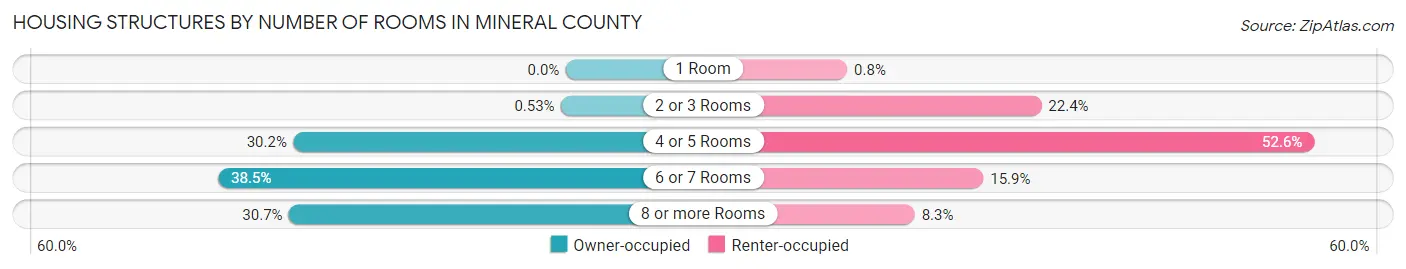
| Number of Rooms | Owner-occupied | Renter-occupied |
| 1 Room | 0 (0.0%) | 16 (0.8%) |
| 2 or 3 Rooms | 45 (0.5%) | 447 (22.4%) |
| 4 or 5 Rooms | 2,580 (30.2%) | 1,052 (52.6%) |
| 6 or 7 Rooms | 3,287 (38.5%) | 318 (15.9%) |
| 8 or more Rooms | 2,621 (30.7%) | 166 (8.3%) |
| Total | 8,533 (100.0%) | 1,999 (100.0%) |
Housing Structure by Heating Type in Mineral County
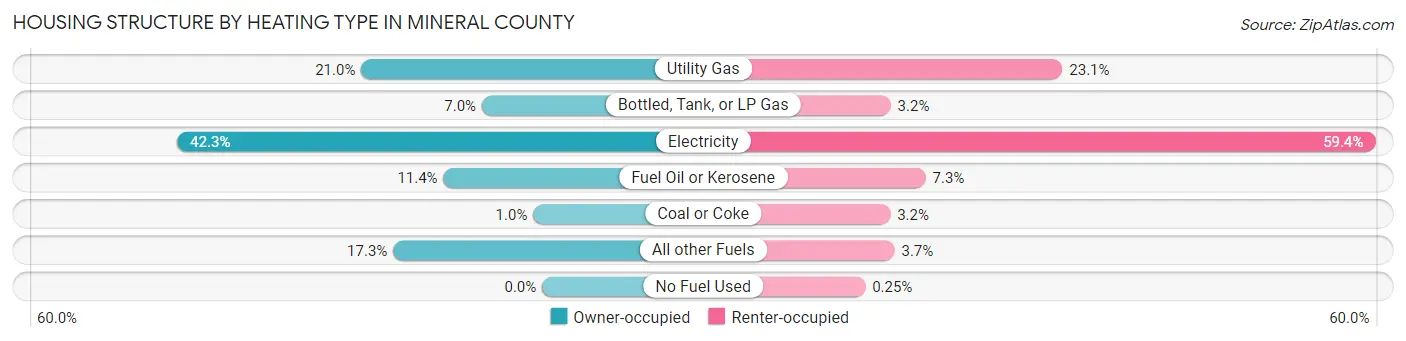
| Heating Type | Owner-occupied | Renter-occupied |
| Utility Gas | 1,789 (21.0%) | 462 (23.1%) |
| Bottled, Tank, or LP Gas | 596 (7.0%) | 64 (3.2%) |
| Electricity | 3,610 (42.3%) | 1,187 (59.4%) |
| Fuel Oil or Kerosene | 976 (11.4%) | 145 (7.2%) |
| Coal or Coke | 88 (1.0%) | 63 (3.2%) |
| All other Fuels | 1,474 (17.3%) | 73 (3.6%) |
| No Fuel Used | 0 (0.0%) | 5 (0.3%) |
| Total | 8,533 (100.0%) | 1,999 (100.0%) |
Household Vehicle Usage in Mineral County
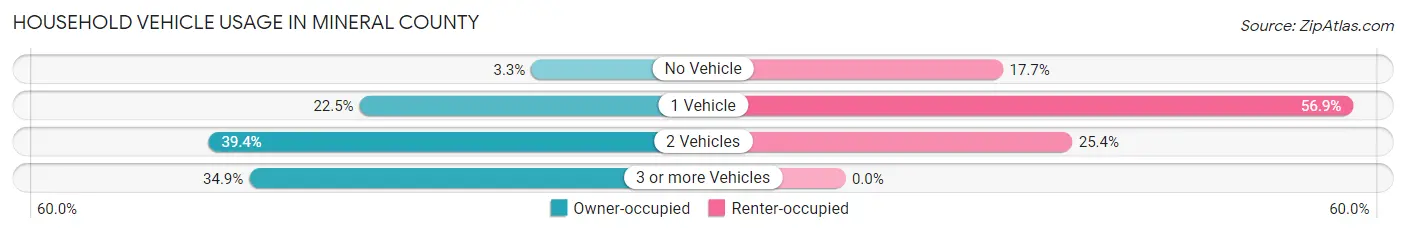
| Vehicles per Household | Owner-occupied | Renter-occupied |
| No Vehicle | 278 (3.3%) | 353 (17.7%) |
| 1 Vehicle | 1,919 (22.5%) | 1,138 (56.9%) |
| 2 Vehicles | 3,362 (39.4%) | 508 (25.4%) |
| 3 or more Vehicles | 2,974 (34.8%) | 0 (0.0%) |
| Total | 8,533 (100.0%) | 1,999 (100.0%) |
Real Estate & Mortgages in Mineral County
Real Estate and Mortgage Overview in Mineral County
| Characteristic | Without Mortgage | With Mortgage |
| Housing Units | 4,538 | 3,995 |
| Median Property Value | $155,100 | $167,800 |
| Median Household Income | $63,072 | $705 |
| Monthly Housing Costs | $370 | $156 |
| Real Estate Taxes | $732 | $45 |
Property Value by Mortgage Status in Mineral County
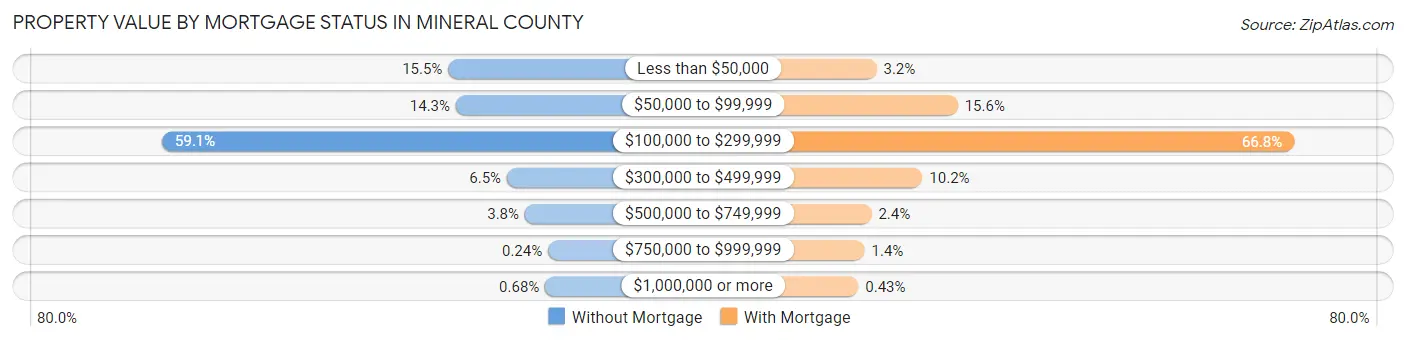
| Property Value | Without Mortgage | With Mortgage |
| Less than $50,000 | 701 (15.4%) | 128 (3.2%) |
| $50,000 to $99,999 | 648 (14.3%) | 622 (15.6%) |
| $100,000 to $299,999 | 2,681 (59.1%) | 2,669 (66.8%) |
| $300,000 to $499,999 | 295 (6.5%) | 407 (10.2%) |
| $500,000 to $749,999 | 171 (3.8%) | 97 (2.4%) |
| $750,000 to $999,999 | 11 (0.2%) | 55 (1.4%) |
| $1,000,000 or more | 31 (0.7%) | 17 (0.4%) |
| Total | 4,538 (100.0%) | 3,995 (100.0%) |
Household Income by Mortgage Status in Mineral County
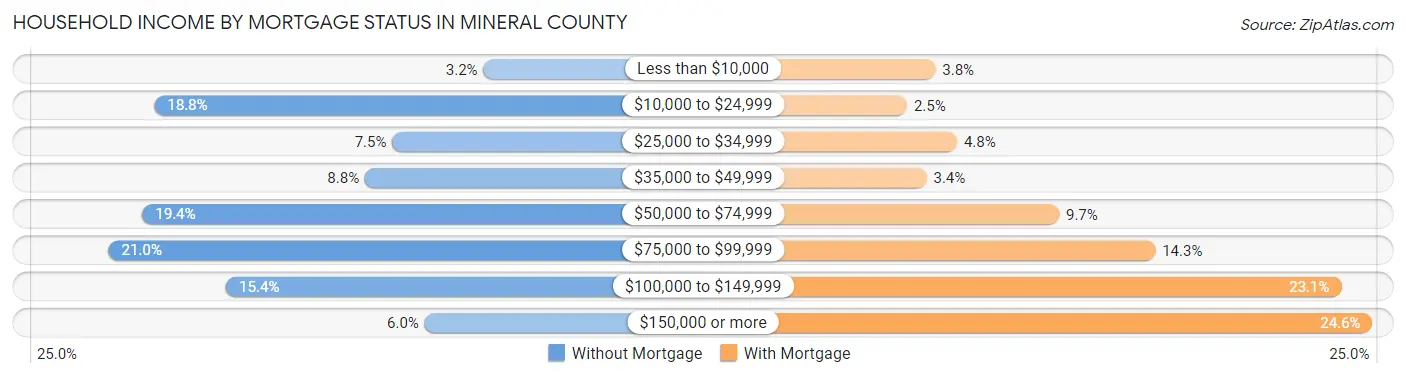
| Household Income | Without Mortgage | With Mortgage |
| Less than $10,000 | 143 (3.2%) | 152 (3.8%) |
| $10,000 to $24,999 | 854 (18.8%) | 98 (2.5%) |
| $25,000 to $34,999 | 340 (7.5%) | 193 (4.8%) |
| $35,000 to $49,999 | 399 (8.8%) | 135 (3.4%) |
| $50,000 to $74,999 | 880 (19.4%) | 387 (9.7%) |
| $75,000 to $99,999 | 953 (21.0%) | 570 (14.3%) |
| $100,000 to $149,999 | 699 (15.4%) | 924 (23.1%) |
| $150,000 or more | 270 (5.9%) | 983 (24.6%) |
| Total | 4,538 (100.0%) | 3,995 (100.0%) |
Property Value to Household Income Ratio in Mineral County
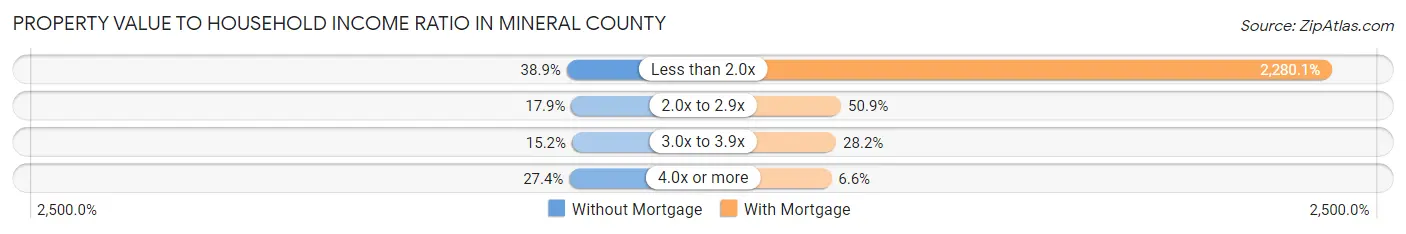
| Value-to-Income Ratio | Without Mortgage | With Mortgage |
| Less than 2.0x | 1,765 (38.9%) | 91,090 (2,280.1%) |
| 2.0x to 2.9x | 812 (17.9%) | 2,034 (50.9%) |
| 3.0x to 3.9x | 689 (15.2%) | 1,127 (28.2%) |
| 4.0x or more | 1,243 (27.4%) | 262 (6.6%) |
| Total | 4,538 (100.0%) | 3,995 (100.0%) |
Real Estate Taxes by Mortgage Status in Mineral County
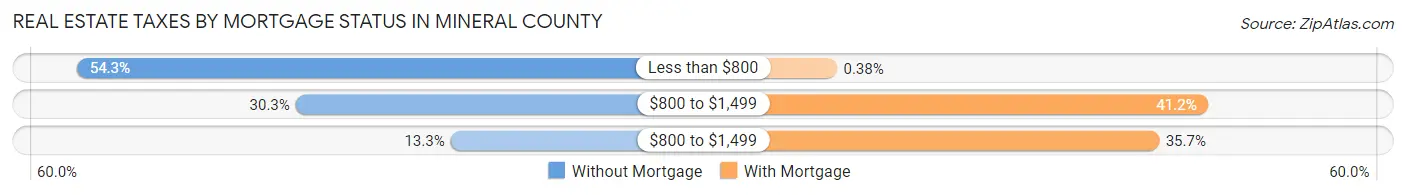
| Property Taxes | Without Mortgage | With Mortgage |
| Less than $800 | 2,463 (54.3%) | 15 (0.4%) |
| $800 to $1,499 | 1,375 (30.3%) | 1,644 (41.1%) |
| $800 to $1,499 | 605 (13.3%) | 1,426 (35.7%) |
| Total | 4,538 (100.0%) | 3,995 (100.0%) |
Health & Disability in Mineral County
Health Insurance Coverage by Age in Mineral County
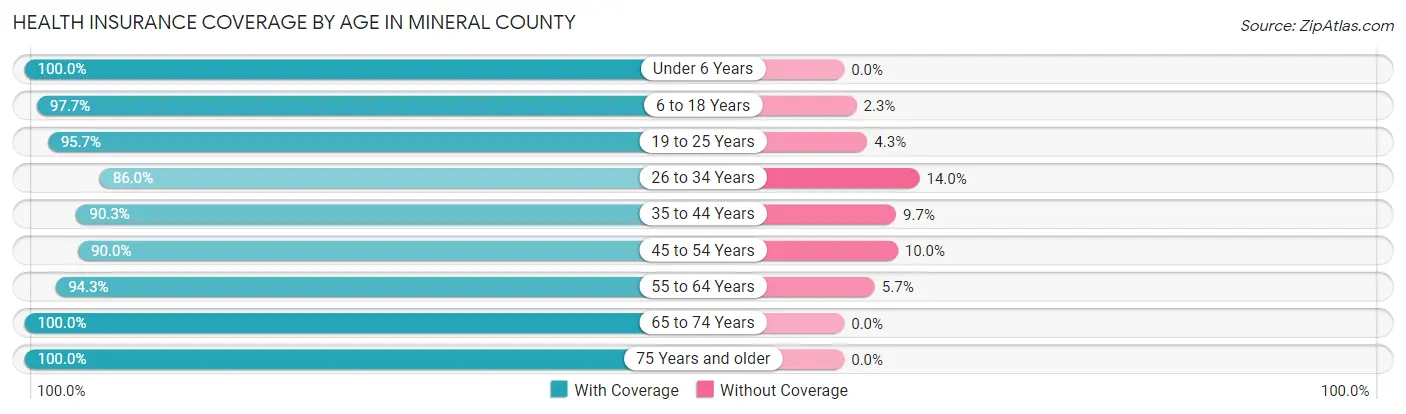
| Age Bracket | With Coverage | Without Coverage |
| Under 6 Years | 1,523 (100.0%) | 0 (0.0%) |
| 6 to 18 Years | 4,186 (97.7%) | 98 (2.3%) |
| 19 to 25 Years | 1,863 (95.7%) | 84 (4.3%) |
| 26 to 34 Years | 2,456 (86.0%) | 401 (14.0%) |
| 35 to 44 Years | 2,663 (90.3%) | 285 (9.7%) |
| 45 to 54 Years | 3,293 (90.0%) | 365 (10.0%) |
| 55 to 64 Years | 3,498 (94.3%) | 212 (5.7%) |
| 65 to 74 Years | 3,527 (100.0%) | 0 (0.0%) |
| 75 Years and older | 2,283 (100.0%) | 0 (0.0%) |
| Total | 25,292 (94.6%) | 1,445 (5.4%) |
Health Insurance Coverage by Citizenship Status in Mineral County
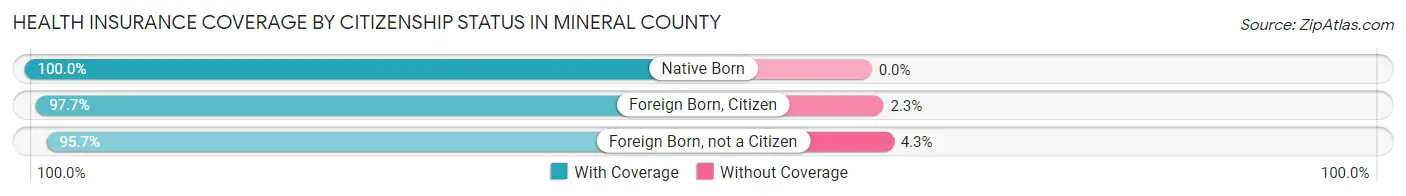
| Citizenship Status | With Coverage | Without Coverage |
| Native Born | 1,523 (100.0%) | 0 (0.0%) |
| Foreign Born, Citizen | 4,186 (97.7%) | 98 (2.3%) |
| Foreign Born, not a Citizen | 1,863 (95.7%) | 84 (4.3%) |
Health Insurance Coverage by Household Income in Mineral County
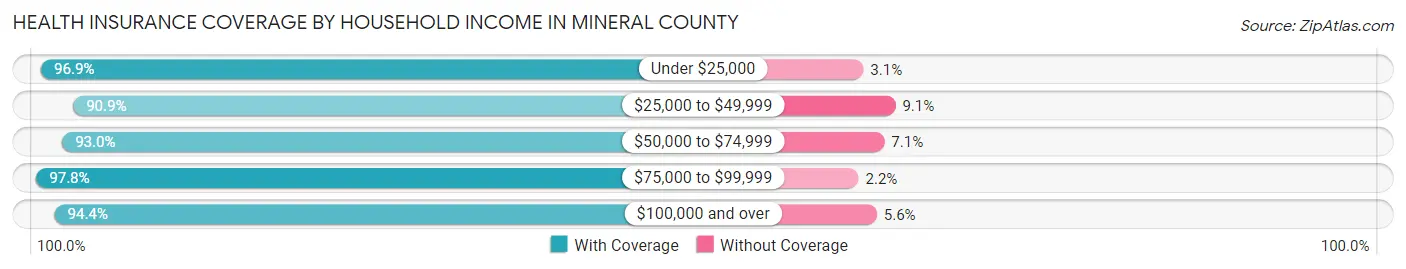
| Household Income | With Coverage | Without Coverage |
| Under $25,000 | 3,424 (96.9%) | 110 (3.1%) |
| $25,000 to $49,999 | 3,778 (90.9%) | 379 (9.1%) |
| $50,000 to $74,999 | 4,222 (92.9%) | 320 (7.0%) |
| $75,000 to $99,999 | 5,363 (97.8%) | 121 (2.2%) |
| $100,000 and over | 8,090 (94.4%) | 483 (5.6%) |
Public vs Private Health Insurance Coverage by Age in Mineral County
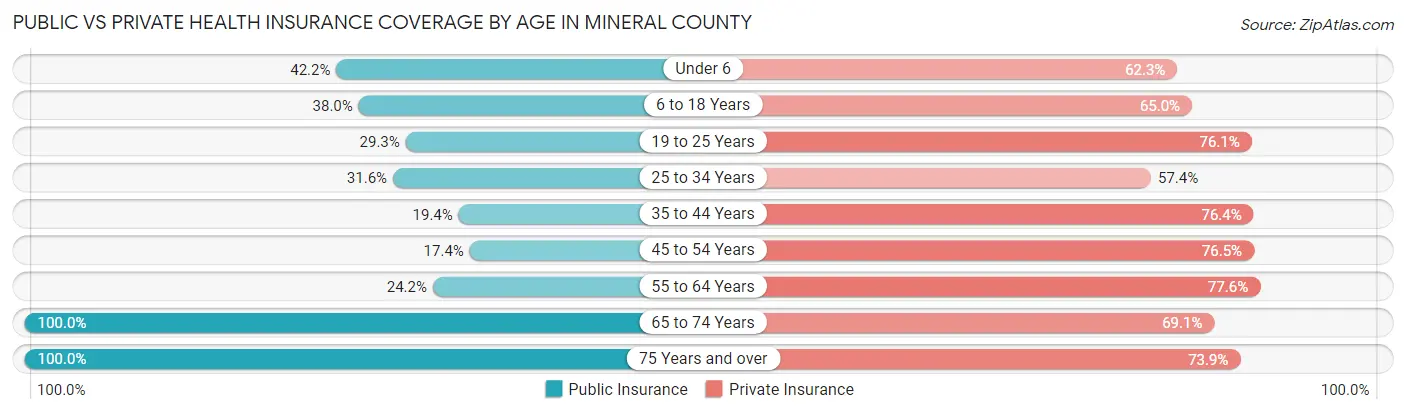
| Age Bracket | Public Insurance | Private Insurance |
| Under 6 | 642 (42.1%) | 948 (62.3%) |
| 6 to 18 Years | 1,628 (38.0%) | 2,784 (65.0%) |
| 19 to 25 Years | 570 (29.3%) | 1,481 (76.1%) |
| 25 to 34 Years | 904 (31.6%) | 1,640 (57.4%) |
| 35 to 44 Years | 573 (19.4%) | 2,253 (76.4%) |
| 45 to 54 Years | 636 (17.4%) | 2,798 (76.5%) |
| 55 to 64 Years | 899 (24.2%) | 2,880 (77.6%) |
| 65 to 74 Years | 3,527 (100.0%) | 2,438 (69.1%) |
| 75 Years and over | 2,283 (100.0%) | 1,688 (73.9%) |
| Total | 11,662 (43.6%) | 18,910 (70.7%) |
Disability Status by Sex by Age in Mineral County
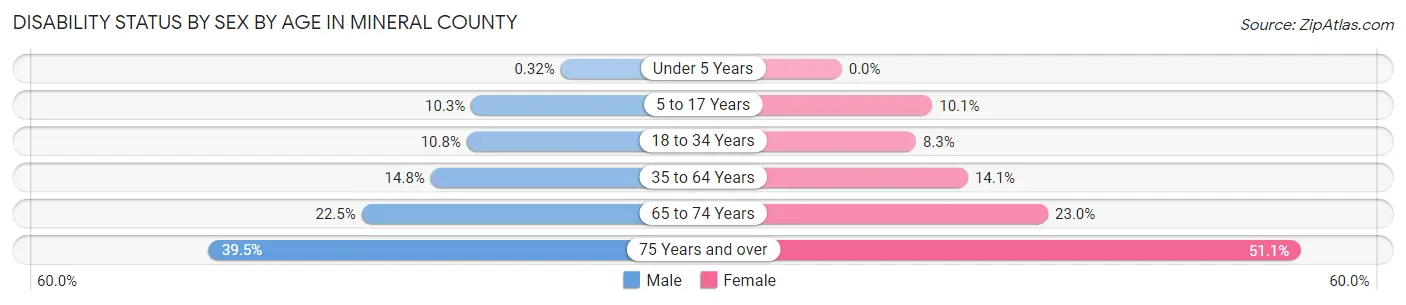
| Age Bracket | Male | Female |
| Under 5 Years | 2 (0.3%) | 0 (0.0%) |
| 5 to 17 Years | 207 (10.3%) | 209 (10.1%) |
| 18 to 34 Years | 304 (10.8%) | 203 (8.3%) |
| 35 to 64 Years | 758 (14.8%) | 729 (14.1%) |
| 65 to 74 Years | 378 (22.5%) | 424 (23.0%) |
| 75 Years and over | 418 (39.5%) | 626 (51.1%) |
Disability Class by Sex by Age in Mineral County
Disability Class: Hearing Difficulty
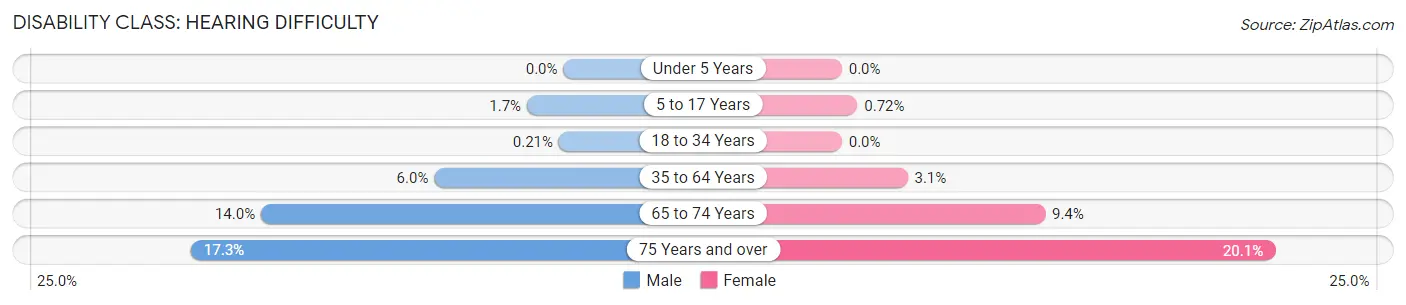
| Age Bracket | Male | Female |
| Under 5 Years | 0 (0.0%) | 0 (0.0%) |
| 5 to 17 Years | 34 (1.7%) | 15 (0.7%) |
| 18 to 34 Years | 6 (0.2%) | 0 (0.0%) |
| 35 to 64 Years | 307 (6.0%) | 158 (3.0%) |
| 65 to 74 Years | 236 (14.0%) | 174 (9.4%) |
| 75 Years and over | 183 (17.3%) | 246 (20.1%) |
Disability Class: Vision Difficulty
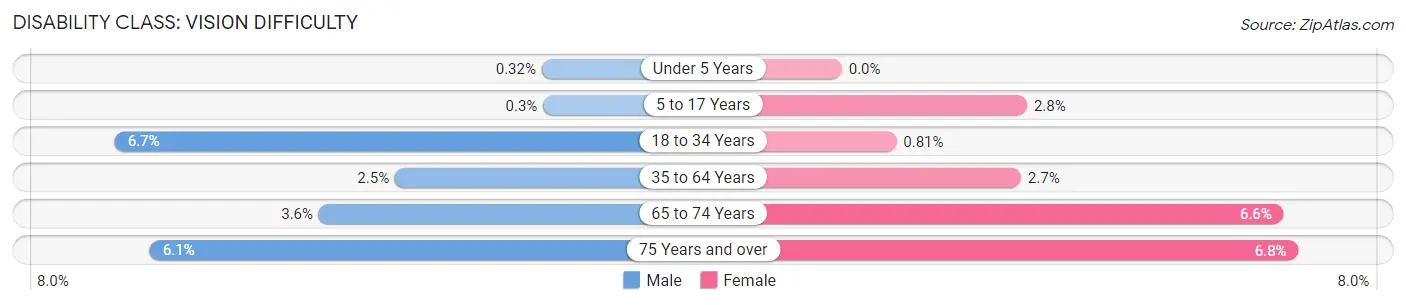
| Age Bracket | Male | Female |
| Under 5 Years | 2 (0.3%) | 0 (0.0%) |
| 5 to 17 Years | 6 (0.3%) | 57 (2.8%) |
| 18 to 34 Years | 188 (6.7%) | 20 (0.8%) |
| 35 to 64 Years | 128 (2.5%) | 138 (2.7%) |
| 65 to 74 Years | 61 (3.6%) | 121 (6.6%) |
| 75 Years and over | 65 (6.1%) | 83 (6.8%) |
Disability Class: Cognitive Difficulty
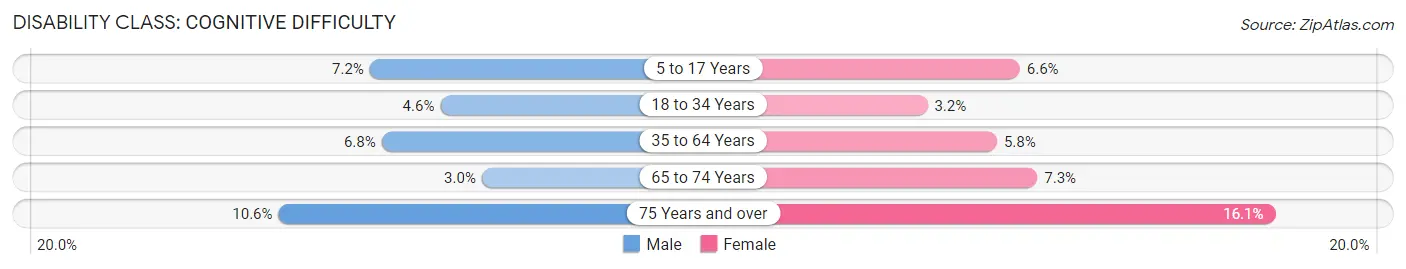
| Age Bracket | Male | Female |
| 5 to 17 Years | 145 (7.2%) | 137 (6.6%) |
| 18 to 34 Years | 129 (4.6%) | 78 (3.2%) |
| 35 to 64 Years | 346 (6.8%) | 299 (5.8%) |
| 65 to 74 Years | 51 (3.0%) | 134 (7.3%) |
| 75 Years and over | 112 (10.6%) | 197 (16.1%) |
Disability Class: Ambulatory Difficulty
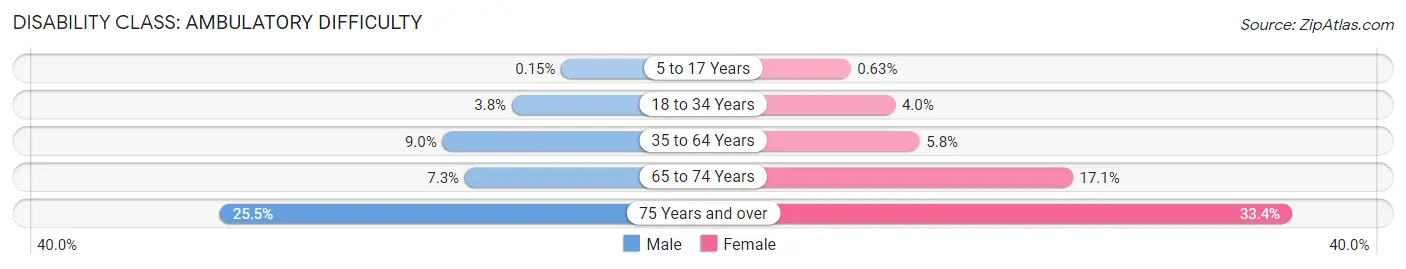
| Age Bracket | Male | Female |
| 5 to 17 Years | 3 (0.2%) | 13 (0.6%) |
| 18 to 34 Years | 108 (3.8%) | 97 (4.0%) |
| 35 to 64 Years | 460 (9.0%) | 299 (5.8%) |
| 65 to 74 Years | 123 (7.3%) | 316 (17.1%) |
| 75 Years and over | 270 (25.5%) | 409 (33.4%) |
Disability Class: Self-Care Difficulty
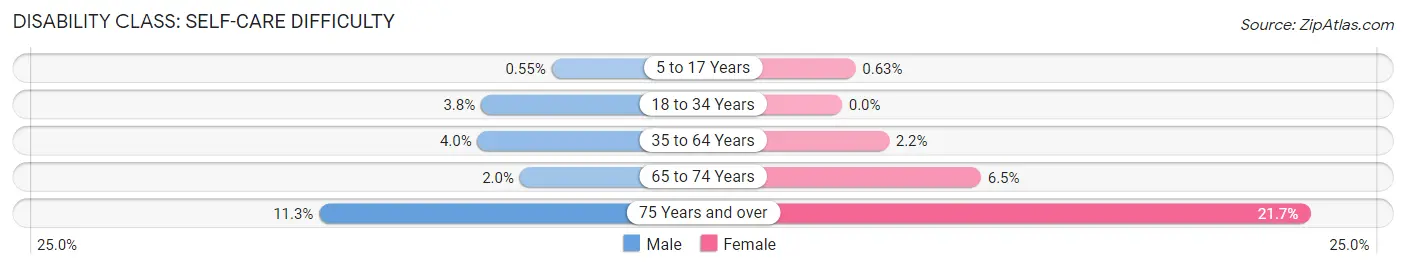
| Age Bracket | Male | Female |
| 5 to 17 Years | 11 (0.5%) | 13 (0.6%) |
| 18 to 34 Years | 108 (3.8%) | 0 (0.0%) |
| 35 to 64 Years | 204 (4.0%) | 113 (2.2%) |
| 65 to 74 Years | 34 (2.0%) | 119 (6.5%) |
| 75 Years and over | 120 (11.3%) | 266 (21.7%) |
Technology Access in Mineral County
Computing Device Access in Mineral County
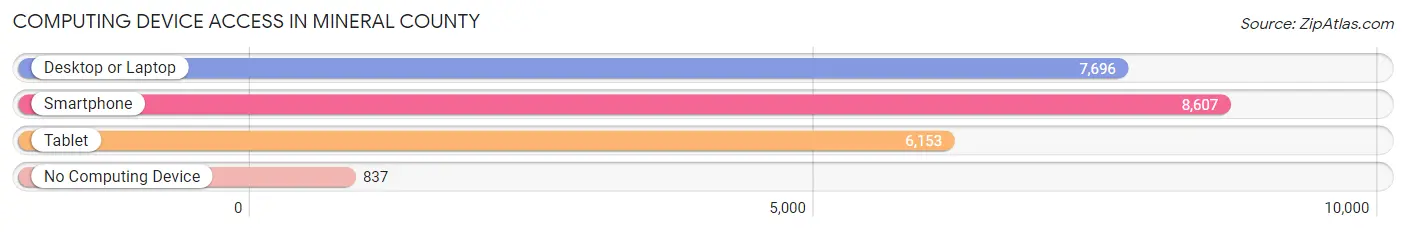
| Device Type | # Households | % Households |
| Desktop or Laptop | 7,696 | 73.1% |
| Smartphone | 8,607 | 81.7% |
| Tablet | 6,153 | 58.4% |
| No Computing Device | 837 | 8.0% |
| Total | 10,532 | 100.0% |
Internet Access in Mineral County
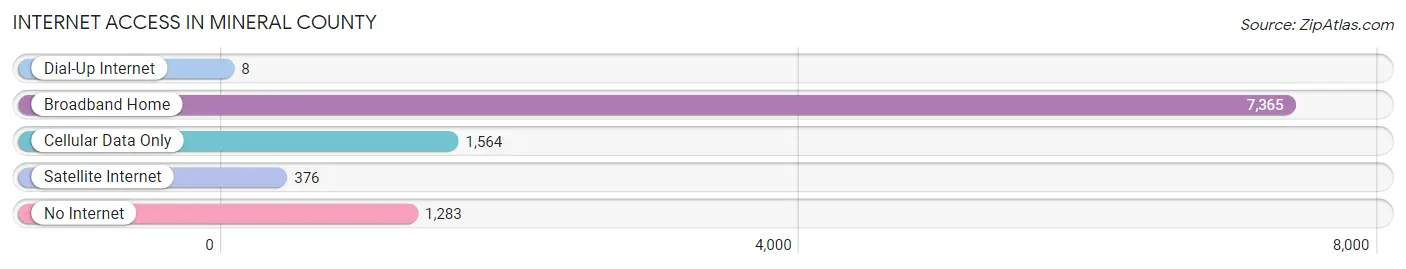
| Internet Type | # Households | % Households |
| Dial-Up Internet | 8 | 0.1% |
| Broadband Home | 7,365 | 69.9% |
| Cellular Data Only | 1,564 | 14.8% |
| Satellite Internet | 376 | 3.6% |
| No Internet | 1,283 | 12.2% |
| Total | 10,532 | 100.0% |
Mineral County Summary
Mineral County is located in the eastern panhandle of West Virginia, and is bordered by Hampshire County to the north, Grant County to the east, Pendleton County to the south, and Hardy County to the west. The county seat is Keyser, and the county was created in 1866 from Hampshire and Hardy counties. The county has a total area of 286 square miles, of which 285 square miles is land and 1 square mile is water.
The terrain of Mineral County is mostly mountainous, with the Allegheny Mountains running through the county. The highest point in the county is located at the summit of North Fork Mountain, at an elevation of 3,360 feet. The county is drained by the North Branch of the Potomac River, which forms the northern border of the county.
The population of Mineral County was 28,212 at the 2000 census. The population density was 99 people per square mile. The racial makeup of the county was 97.2% White, 1.2% African American, 0.2% Native American, 0.3% Asian, 0.1% Pacific Islander, 0.3% from other races, and 0.7% from two or more races. Hispanic or Latino of any race were 0.7% of the population.
The median income for a household in the county was $30,945, and the median income for a family was $37,945. Males had a median income of $30,945 versus $20,945 for females. The per capita income for the county was $15,945. About 11.2% of families and 14.2% of the population were below the poverty line, including 17.2% of those under age 18 and 11.2% of those age 65 or over.
The economy of Mineral County is largely based on agriculture and tourism. The county is home to several farms, which produce a variety of crops, including corn, soybeans, hay, and wheat. The county is also home to several wineries, which produce a variety of wines. Tourism is also an important part of the economy, with visitors coming to the county to enjoy the scenic beauty of the Allegheny Mountains, as well as to visit the many historical sites in the area.
Mineral County is home to several historical sites, including the Potomac Eagle Scenic Railroad, which offers scenic train rides through the county. The county is also home to the Fort Ashby Historic District, which includes the site of the original fort built by George Washington in 1755. The county is also home to the Keyser Historic District, which includes several buildings from the 19th century.
Mineral County is a beautiful and diverse county, with a rich history and a vibrant economy. The county is home to a variety of attractions, from historical sites to wineries, and offers visitors a unique and enjoyable experience.
Common Questions
What is the Total Population of Mineral County?
Total Population of Mineral County is 26,957.
What is the Total Male Population of Mineral County?
Total Male Population of Mineral County is 13,393.
What is the Total Female Population of Mineral County?
Total Female Population of Mineral County is 13,564.
What is the Ratio of Males per 100 Females in Mineral County?
There are 98.74 Males per 100 Females in Mineral County.
What is the Ratio of Females per 100 Males in Mineral County?
There are 101.28 Females per 100 Males in Mineral County.
What is the Median Population Age in Mineral County?
Median Population Age in Mineral County is 44.6 Years.
What is the Average Family Size in Mineral County
Average Family Size in Mineral County is 3.1 People.
What is the Average Household Size in Mineral County
Average Household Size in Mineral County is 2.5 People.
What is Per Capita Income in Mineral County?
Per Capita income in Mineral County is $33,580.
What is the Median Family Income in Mineral County?
Median Family Income in Mineral County is $84,081.
What is the Median Household income in Mineral County?
Median Household Income in Mineral County is $64,728.
What is Income or Wage Gap in Mineral County?
Income or Wage Gap in Mineral County is 36.4%.
Women in Mineral County earn 63.6 cents for every dollar earned by a man.
What is Family Income Deficit in Mineral County?
Family Income Deficit in Mineral County is $9,892.
Families that are below poverty line in Mineral County earn $9,892 less on average than the poverty threshold level.
What is Inequality or Gini Index in Mineral County?
Inequality or Gini Index in Mineral County is 0.44.
How Large is the Labor Force in Mineral County?
There are 12,454 People in the Labor Forcein in Mineral County.
What is the Percentage of People in the Labor Force in Mineral County?
55.6% of People are in the Labor Force in Mineral County.
What is the Unemployment Rate in Mineral County?
Unemployment Rate in Mineral County is 5.8%.