Mercer County, WV
Mercer County Map
Mercer County Overview
59,530
TOTAL POPULATION
28,719
MALE POPULATION
30,811
FEMALE POPULATION
93.21
MALES / 100 FEMALES
107.28
FEMALES / 100 MALES
43.3
MEDIAN AGE
2.9
AVG FAMILY SIZE
2.4
AVG HOUSEHOLD SIZE
$27,245
PER CAPITA INCOME
$63,142
AVG FAMILY INCOME
$46,409
AVG HOUSEHOLD INCOME
32.2%
WAGE / INCOME GAP [ % ]
67.8¢/ $1
WAGE / INCOME GAP [ $ ]
$8,770
FAMILY INCOME DEFICIT
0.46
INEQUALITY / GINI INDEX
24,147
LABOR FORCE [ PEOPLE ]
49.7%
PERCENT IN LABOR FORCE
4.2%
UNEMPLOYMENT RATE
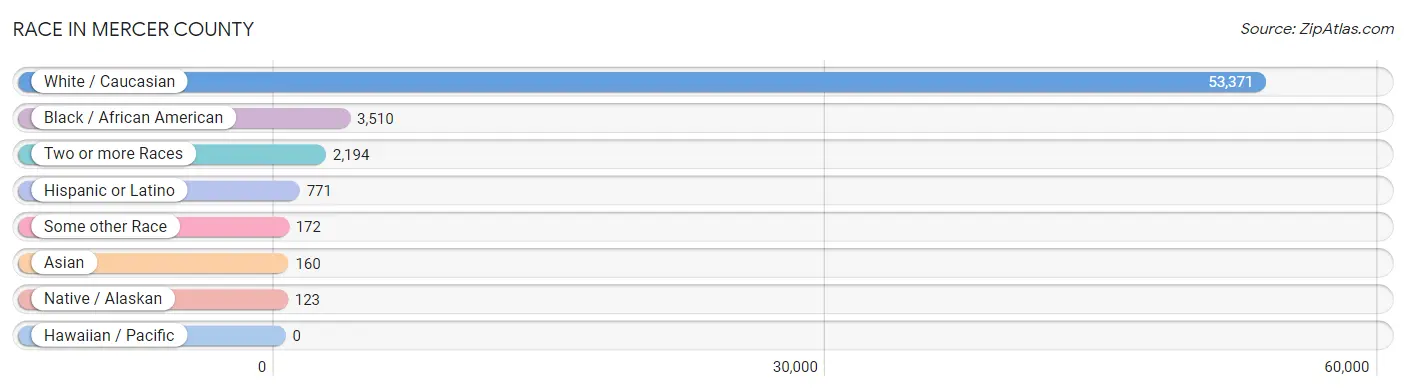
Race in Mercer County
The most populous races in Mercer County are White / Caucasian (53,371 | 89.6%), Black / African American (3,510 | 5.9%), and Two or more Races (2,194 | 3.7%).
| Race | # Population | % Population |
| Asian | 160 | 0.3% |
| Black / African American | 3,510 | 5.9% |
| Hawaiian / Pacific | 0 | 0.0% |
| Hispanic or Latino | 771 | 1.3% |
| Native / Alaskan | 123 | 0.2% |
| White / Caucasian | 53,371 | 89.6% |
| Two or more Races | 2,194 | 3.7% |
| Some other Race | 172 | 0.3% |
| Total | 59,530 | 100.0% |
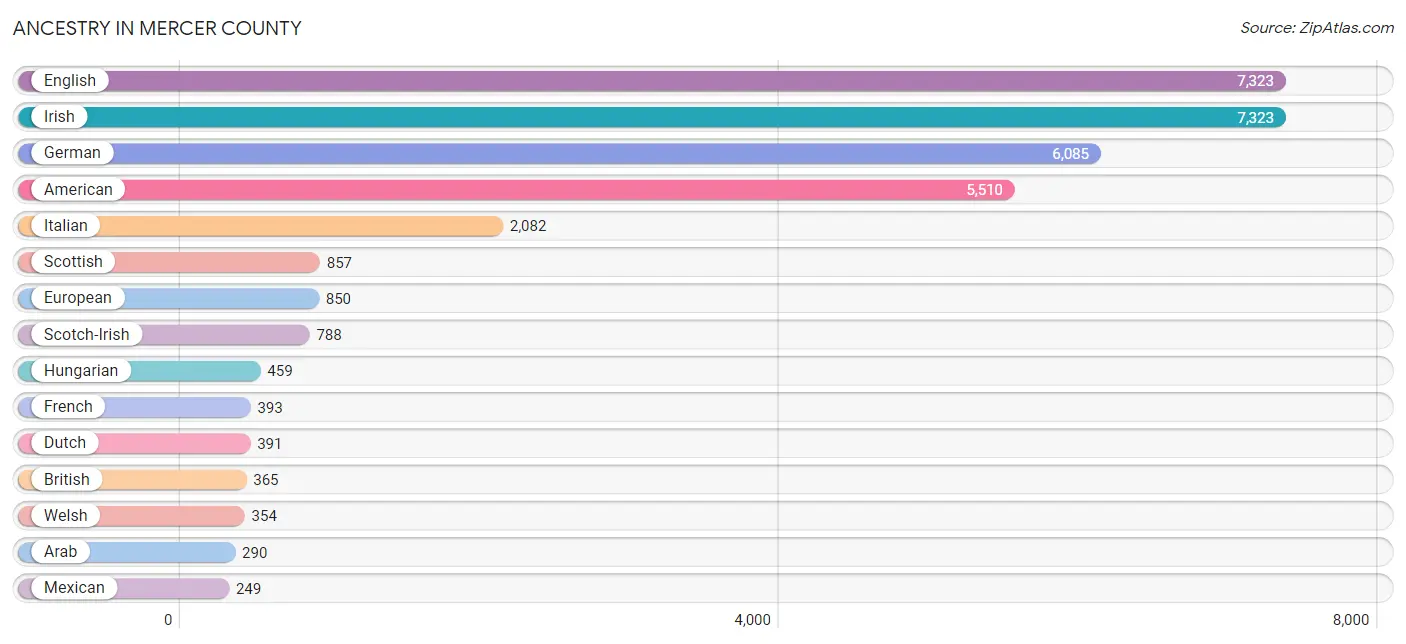
Ancestry in Mercer County
The most populous ancestries reported in Mercer County are English (7,323 | 12.3%), Irish (7,323 | 12.3%), German (6,085 | 10.2%), American (5,510 | 9.3%), and Italian (2,082 | 3.5%), together accounting for 47.6% of all Mercer County residents.
| Ancestry | # Population | % Population |
| African | 35 | 0.1% |
| American | 5,510 | 9.3% |
| Apache | 73 | 0.1% |
| Arab | 290 | 0.5% |
| Austrian | 117 | 0.2% |
| Belgian | 46 | 0.1% |
| Bhutanese | 44 | 0.1% |
| British | 365 | 0.6% |
| Burmese | 61 | 0.1% |
| Central American | 18 | 0.0% |
| Cherokee | 65 | 0.1% |
| Colombian | 20 | 0.0% |
| Croatian | 33 | 0.1% |
| Cuban | 31 | 0.1% |
| Czech | 79 | 0.1% |
| Czechoslovakian | 13 | 0.0% |
| Dutch | 391 | 0.7% |
| Eastern European | 21 | 0.0% |
| Egyptian | 9 | 0.0% |
| English | 7,323 | 12.3% |
| European | 850 | 1.4% |
| French | 393 | 0.7% |
| German | 6,085 | 10.2% |
| Greek | 26 | 0.0% |
| Guatemalan | 18 | 0.0% |
| Haitian | 2 | 0.0% |
| Houma | 5 | 0.0% |
| Hungarian | 459 | 0.8% |
| Indian (Asian) | 25 | 0.0% |
| Irish | 7,323 | 12.3% |
| Italian | 2,082 | 3.5% |
| Jamaican | 18 | 0.0% |
| Korean | 63 | 0.1% |
| Lebanese | 101 | 0.2% |
| Lithuanian | 5 | 0.0% |
| Mexican | 249 | 0.4% |
| Moroccan | 180 | 0.3% |
| Navajo | 81 | 0.1% |
| Nigerian | 28 | 0.1% |
| Northern European | 3 | 0.0% |
| Norwegian | 191 | 0.3% |
| Pakistani | 222 | 0.4% |
| Polish | 128 | 0.2% |
| Puerto Rican | 147 | 0.3% |
| Romanian | 6 | 0.0% |
| Russian | 157 | 0.3% |
| Scandinavian | 125 | 0.2% |
| Scotch-Irish | 788 | 1.3% |
| Scottish | 857 | 1.4% |
| Serbian | 11 | 0.0% |
| Slovak | 11 | 0.0% |
| South American | 20 | 0.0% |
| Spaniard | 122 | 0.2% |
| Spanish | 29 | 0.1% |
| Sri Lankan | 5 | 0.0% |
| Subsaharan African | 63 | 0.1% |
| Swedish | 218 | 0.4% |
| Swiss | 7 | 0.0% |
| Thai | 242 | 0.4% |
| Turkish | 25 | 0.0% |
| Welsh | 354 | 0.6% | View All 61 Rows |
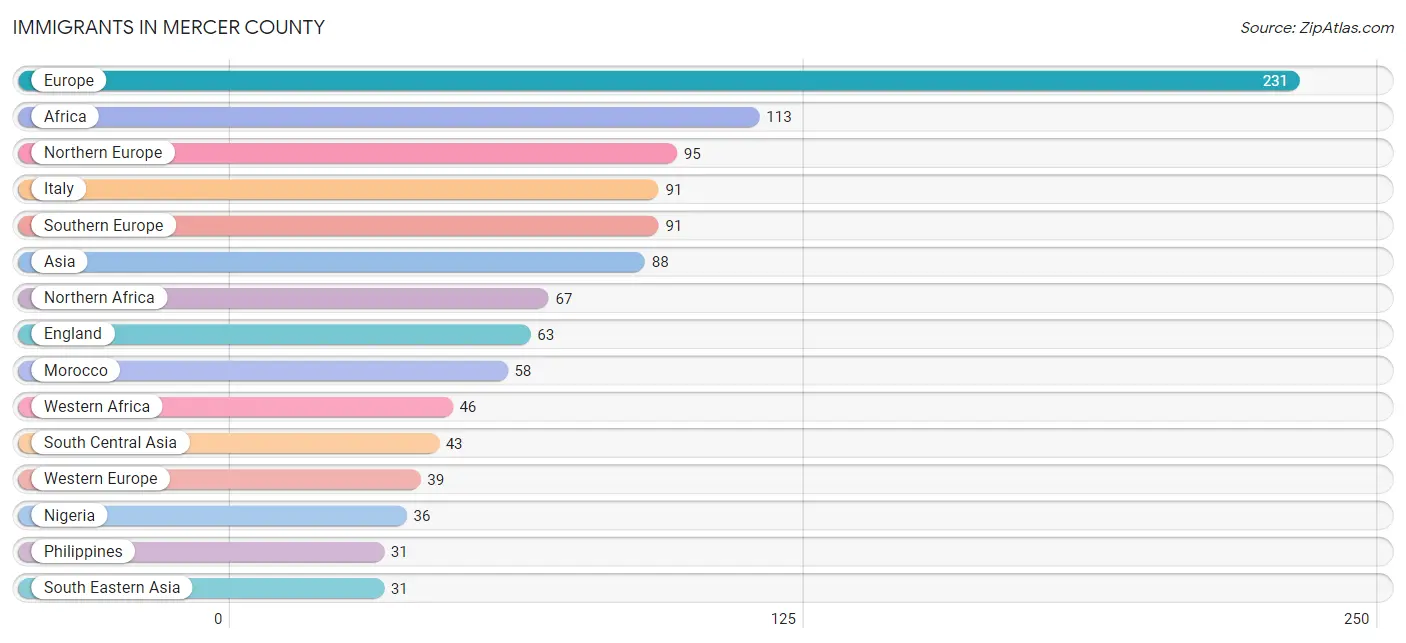
Immigrants in Mercer County
The most numerous immigrant groups reported in Mercer County came from Europe (231 | 0.4%), Africa (113 | 0.2%), Northern Europe (95 | 0.2%), Italy (91 | 0.2%), and Southern Europe (91 | 0.2%), together accounting for 1.0% of all Mercer County residents.
| Immigration Origin | # Population | % Population |
| Africa | 113 | 0.2% |
| Asia | 88 | 0.2% |
| Australia | 16 | 0.0% |
| Canada | 7 | 0.0% |
| China | 8 | 0.0% |
| Colombia | 20 | 0.0% |
| Eastern Asia | 14 | 0.0% |
| Eastern Europe | 6 | 0.0% |
| Egypt | 9 | 0.0% |
| England | 63 | 0.1% |
| Europe | 231 | 0.4% |
| Germany | 14 | 0.0% |
| India | 18 | 0.0% |
| Italy | 91 | 0.2% |
| Korea | 6 | 0.0% |
| Latin America | 20 | 0.0% |
| Morocco | 58 | 0.1% |
| Netherlands | 25 | 0.0% |
| Nigeria | 36 | 0.1% |
| Northern Africa | 67 | 0.1% |
| Northern Europe | 95 | 0.2% |
| Oceania | 16 | 0.0% |
| Pakistan | 25 | 0.0% |
| Philippines | 31 | 0.1% |
| Romania | 6 | 0.0% |
| South America | 20 | 0.0% |
| South Central Asia | 43 | 0.1% |
| South Eastern Asia | 31 | 0.1% |
| Southern Europe | 91 | 0.2% |
| Sweden | 7 | 0.0% |
| Western Africa | 46 | 0.1% |
| Western Europe | 39 | 0.1% | View All 32 Rows |
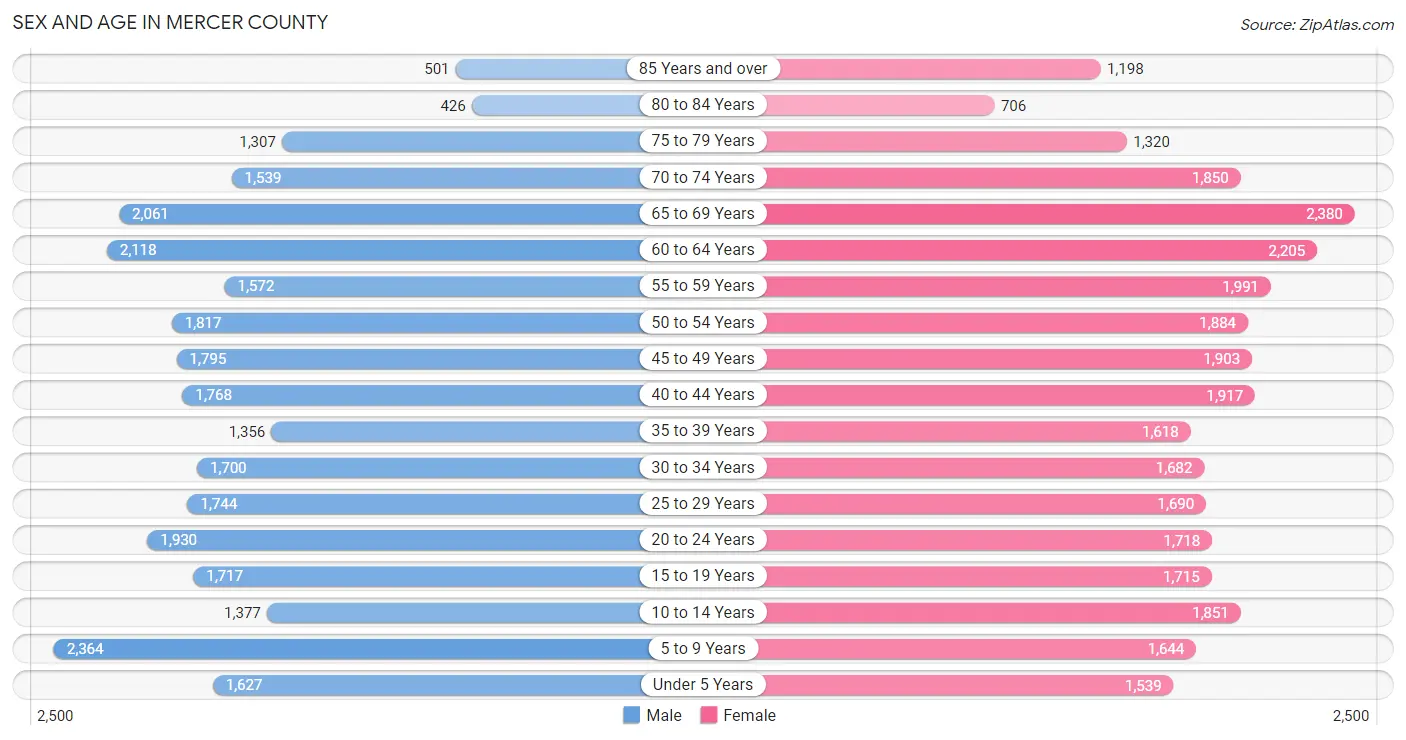
Sex and Age in Mercer County
Sex and Age in Mercer County
The most populous age groups in Mercer County are 5 to 9 Years (2,364 | 8.2%) for men and 65 to 69 Years (2,380 | 7.7%) for women.
| Age Bracket | Male | Female |
| Under 5 Years | 1,627 (5.7%) | 1,539 (5.0%) |
| 5 to 9 Years | 2,364 (8.2%) | 1,644 (5.3%) |
| 10 to 14 Years | 1,377 (4.8%) | 1,851 (6.0%) |
| 15 to 19 Years | 1,717 (6.0%) | 1,715 (5.6%) |
| 20 to 24 Years | 1,930 (6.7%) | 1,718 (5.6%) |
| 25 to 29 Years | 1,744 (6.1%) | 1,690 (5.5%) |
| 30 to 34 Years | 1,700 (5.9%) | 1,682 (5.5%) |
| 35 to 39 Years | 1,356 (4.7%) | 1,618 (5.2%) |
| 40 to 44 Years | 1,768 (6.2%) | 1,917 (6.2%) |
| 45 to 49 Years | 1,795 (6.2%) | 1,903 (6.2%) |
| 50 to 54 Years | 1,817 (6.3%) | 1,884 (6.1%) |
| 55 to 59 Years | 1,572 (5.5%) | 1,991 (6.5%) |
| 60 to 64 Years | 2,118 (7.4%) | 2,205 (7.2%) |
| 65 to 69 Years | 2,061 (7.2%) | 2,380 (7.7%) |
| 70 to 74 Years | 1,539 (5.4%) | 1,850 (6.0%) |
| 75 to 79 Years | 1,307 (4.5%) | 1,320 (4.3%) |
| 80 to 84 Years | 426 (1.5%) | 706 (2.3%) |
| 85 Years and over | 501 (1.7%) | 1,198 (3.9%) |
| Total | 28,719 (100.0%) | 30,811 (100.0%) |
Families and Households in Mercer County
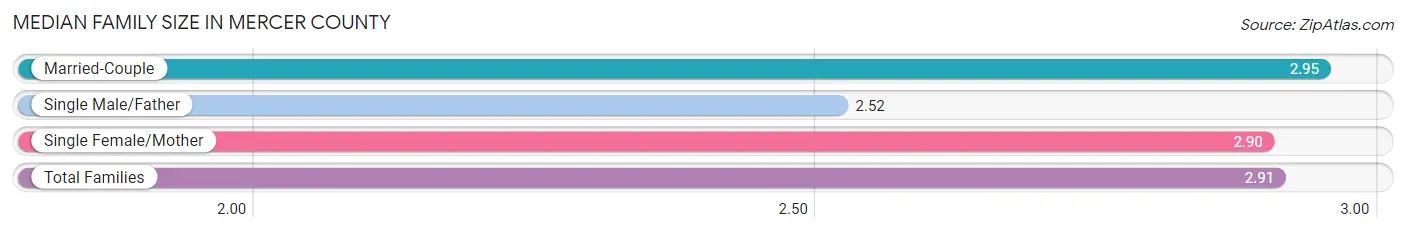
Median Family Size in Mercer County
The median family size in Mercer County is 2.91 persons per family, with married-couple families (11,150 | 71.1%) accounting for the largest median family size of 2.95 persons per family. On the other hand, single male/father families (1,063 | 6.8%) represent the smallest median family size with 2.52 persons per family.
| Family Type | # Families | Family Size |
| Married-Couple | 11,150 (71.1%) | 2.95 |
| Single Male/Father | 1,063 (6.8%) | 2.52 |
| Single Female/Mother | 3,468 (22.1%) | 2.90 |
| Total Families | 15,681 (100.0%) | 2.91 |
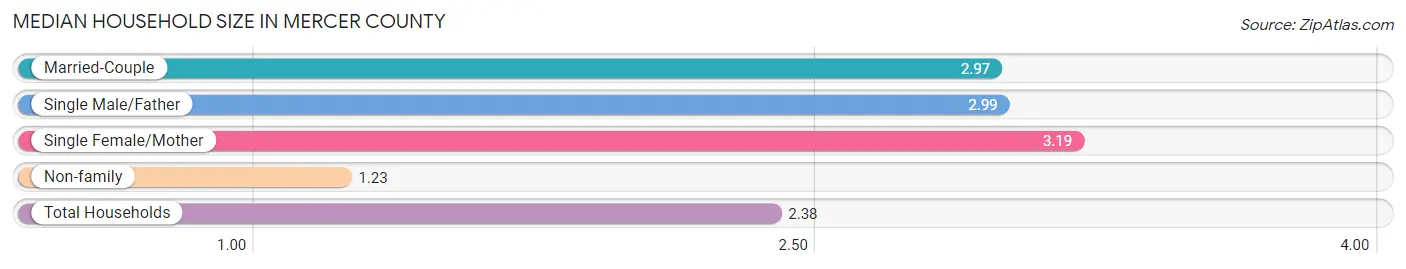
Median Household Size in Mercer County
The median household size in Mercer County is 2.38 persons per household, with single female/mother households (3,468 | 14.2%) accounting for the largest median household size of 3.19 persons per household. non-family households (8,790 | 35.9%) represent the smallest median household size with 1.23 persons per household.
| Household Type | # Households | Household Size |
| Married-Couple | 11,150 (45.6%) | 2.97 |
| Single Male/Father | 1,063 (4.3%) | 2.99 |
| Single Female/Mother | 3,468 (14.2%) | 3.19 |
| Non-family | 8,790 (35.9%) | 1.23 |
| Total Households | 24,471 (100.0%) | 2.38 |
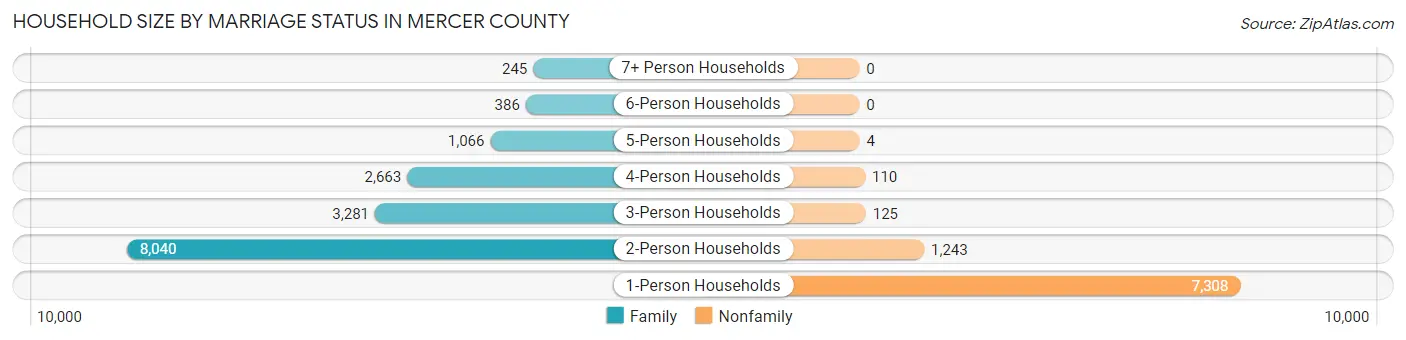
Household Size by Marriage Status in Mercer County
Out of a total of 24,471 households in Mercer County, 15,681 (64.1%) are family households, while 8,790 (35.9%) are nonfamily households. The most numerous type of family households are 2-person households, comprising 8,040, and the most common type of nonfamily households are 1-person households, comprising 7,308.
| Household Size | Family Households | Nonfamily Households |
| 1-Person Households | - | 7,308 (29.9%) |
| 2-Person Households | 8,040 (32.9%) | 1,243 (5.1%) |
| 3-Person Households | 3,281 (13.4%) | 125 (0.5%) |
| 4-Person Households | 2,663 (10.9%) | 110 (0.4%) |
| 5-Person Households | 1,066 (4.4%) | 4 (0.0%) |
| 6-Person Households | 386 (1.6%) | 0 (0.0%) |
| 7+ Person Households | 245 (1.0%) | 0 (0.0%) |
| Total | 15,681 (64.1%) | 8,790 (35.9%) |
Female Fertility in Mercer County
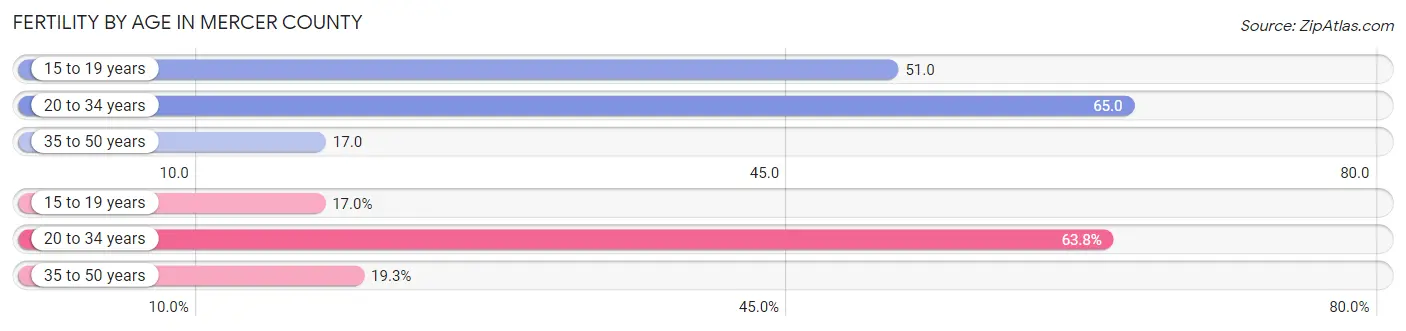
Fertility by Age in Mercer County
Average fertility rate in Mercer County is 40.0 births per 1,000 women. Women in the age bracket of 20 to 34 years have the highest fertility rate with 65.0 births per 1,000 women. Women in the age bracket of 20 to 34 years acount for 63.8% of all women with births.
| Age Bracket | Women with Births | Births / 1,000 Women |
| 15 to 19 years | 88 (17.0%) | 51.0 |
| 20 to 34 years | 331 (63.8%) | 65.0 |
| 35 to 50 years | 100 (19.3%) | 17.0 |
| Total | 519 (100.0%) | 40.0 |
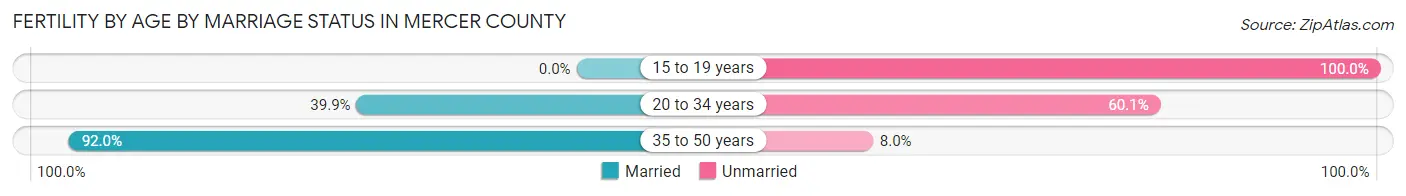
Fertility by Age by Marriage Status in Mercer County
43.2% of women with births (519) in Mercer County are married. The highest percentage of unmarried women with births falls into 15 to 19 years age bracket with 100.0% of them unmarried at the time of birth, while the lowest percentage of unmarried women with births belong to 35 to 50 years age bracket with 8.0% of them unmarried.
| Age Bracket | Married | Unmarried |
| 15 to 19 years | 0 (0.0%) | 88 (100.0%) |
| 20 to 34 years | 132 (39.9%) | 199 (60.1%) |
| 35 to 50 years | 92 (92.0%) | 8 (8.0%) |
| Total | 224 (43.2%) | 295 (56.8%) |
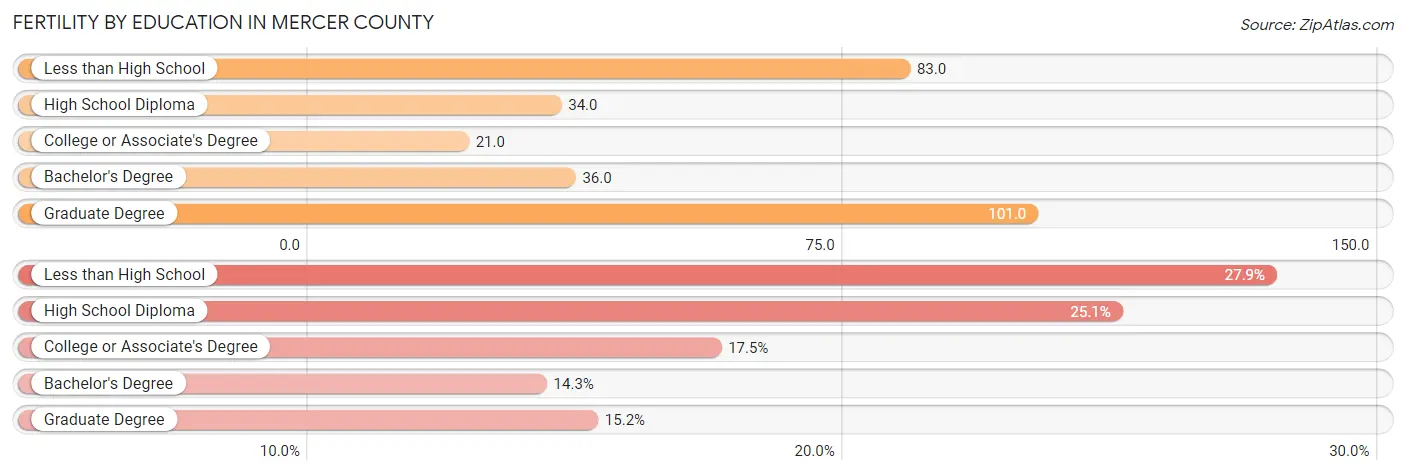
Fertility by Education in Mercer County
Average fertility rate in Mercer County is 40.0 births per 1,000 women. Women with the education attainment of graduate degree have the highest fertility rate of 101.0 births per 1,000 women, while women with the education attainment of college or associate's degree have the lowest fertility at 21.0 births per 1,000 women. Women with the education attainment of less than high school represent 27.9% of all women with births.
| Educational Attainment | Women with Births | Births / 1,000 Women |
| Less than High School | 145 (27.9%) | 83.0 |
| High School Diploma | 130 (25.1%) | 34.0 |
| College or Associate's Degree | 91 (17.5%) | 21.0 |
| Bachelor's Degree | 74 (14.3%) | 36.0 |
| Graduate Degree | 79 (15.2%) | 101.0 |
| Total | 519 (100.0%) | 40.0 |
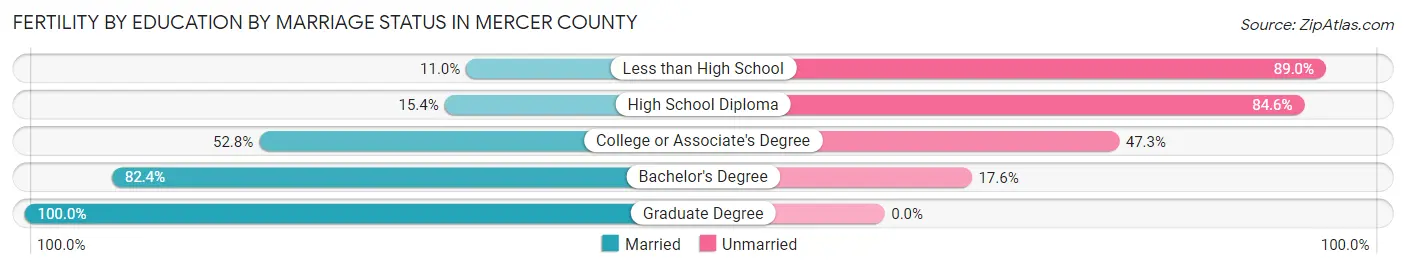
Fertility by Education by Marriage Status in Mercer County
56.8% of women with births in Mercer County are unmarried. Women with the educational attainment of graduate degree are most likely to be married with 100.0% of them married at childbirth, while women with the educational attainment of less than high school are least likely to be married with 89.0% of them unmarried at childbirth.
| Educational Attainment | Married | Unmarried |
| Less than High School | 16 (11.0%) | 129 (89.0%) |
| High School Diploma | 20 (15.4%) | 110 (84.6%) |
| College or Associate's Degree | 48 (52.7%) | 43 (47.2%) |
| Bachelor's Degree | 61 (82.4%) | 13 (17.6%) |
| Graduate Degree | 79 (100.0%) | 0 (0.0%) |
| Total | 224 (43.2%) | 295 (56.8%) |
Income in Mercer County
Income Overview in Mercer County
Per Capita Income in Mercer County is $27,245, while median incomes of families and households are $63,142 and $46,409 respectively.
| Characteristic | Number | Measure |
| Per Capita Income | 59,530 | $27,245 |
| Median Family Income | 15,681 | $63,142 |
| Mean Family Income | 15,681 | $75,822 |
| Median Household Income | 24,471 | $46,409 |
| Mean Household Income | 24,471 | $64,284 |
| Income Deficit | 15,681 | $8,770 |
| Wage / Income Gap (%) | 59,530 | 32.24% |
| Wage / Income Gap ($) | 59,530 | 67.76¢ per $1 |
| Gini / Inequality Index | 59,530 | 0.46 |
Earnings by Sex in Mercer County
Average Earnings in Mercer County are $34,346, $41,406 for men and $28,055 for women, a difference of 32.2%.
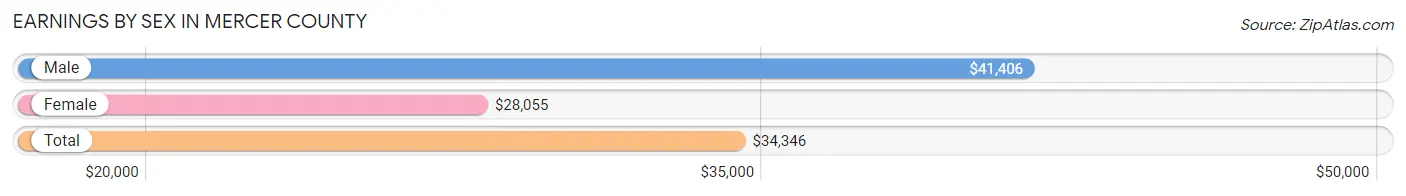
| Sex | Number | Average Earnings |
| Male | 12,815 (50.5%) | $41,406 |
| Female | 12,577 (49.5%) | $28,055 |
| Total | 25,392 (100.0%) | $34,346 |
Earnings by Sex by Income Bracket in Mercer County
The most common earnings brackets in Mercer County are $100,000+ for men (1,253 | 9.8%) and $40,000 to $44,999 for women (1,349 | 10.7%).
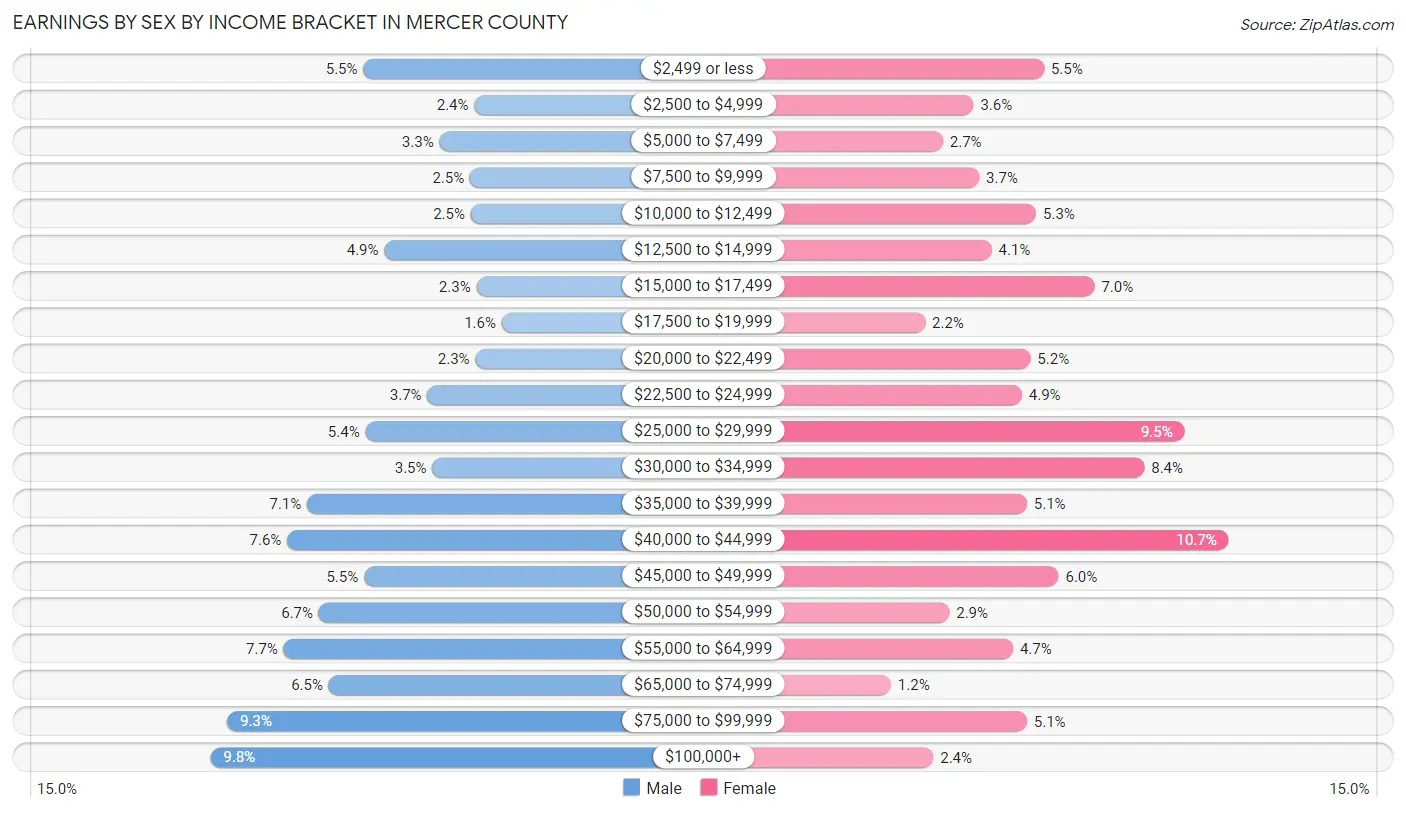
| Income | Male | Female |
| $2,499 or less | 702 (5.5%) | 697 (5.5%) |
| $2,500 to $4,999 | 302 (2.4%) | 448 (3.6%) |
| $5,000 to $7,499 | 428 (3.3%) | 339 (2.7%) |
| $7,500 to $9,999 | 318 (2.5%) | 468 (3.7%) |
| $10,000 to $12,499 | 315 (2.5%) | 669 (5.3%) |
| $12,500 to $14,999 | 627 (4.9%) | 512 (4.1%) |
| $15,000 to $17,499 | 295 (2.3%) | 875 (7.0%) |
| $17,500 to $19,999 | 204 (1.6%) | 277 (2.2%) |
| $20,000 to $22,499 | 299 (2.3%) | 649 (5.2%) |
| $22,500 to $24,999 | 472 (3.7%) | 619 (4.9%) |
| $25,000 to $29,999 | 694 (5.4%) | 1,193 (9.5%) |
| $30,000 to $34,999 | 454 (3.5%) | 1,052 (8.4%) |
| $35,000 to $39,999 | 905 (7.1%) | 636 (5.1%) |
| $40,000 to $44,999 | 977 (7.6%) | 1,349 (10.7%) |
| $45,000 to $49,999 | 700 (5.5%) | 748 (5.9%) |
| $50,000 to $54,999 | 862 (6.7%) | 362 (2.9%) |
| $55,000 to $64,999 | 989 (7.7%) | 587 (4.7%) |
| $65,000 to $74,999 | 826 (6.5%) | 156 (1.2%) |
| $75,000 to $99,999 | 1,193 (9.3%) | 636 (5.1%) |
| $100,000+ | 1,253 (9.8%) | 305 (2.4%) |
| Total | 12,815 (100.0%) | 12,577 (100.0%) |
Earnings by Sex by Educational Attainment in Mercer County
Average earnings in Mercer County are $46,605 for men and $31,697 for women, a difference of 32.0%. Men with an educational attainment of college or associate's degree enjoy the highest average annual earnings of $58,208, while those with less than high school education earn the least with $35,764. Women with an educational attainment of graduate degree earn the most with the average annual earnings of $48,056, while those with less than high school education have the smallest earnings of $14,522.
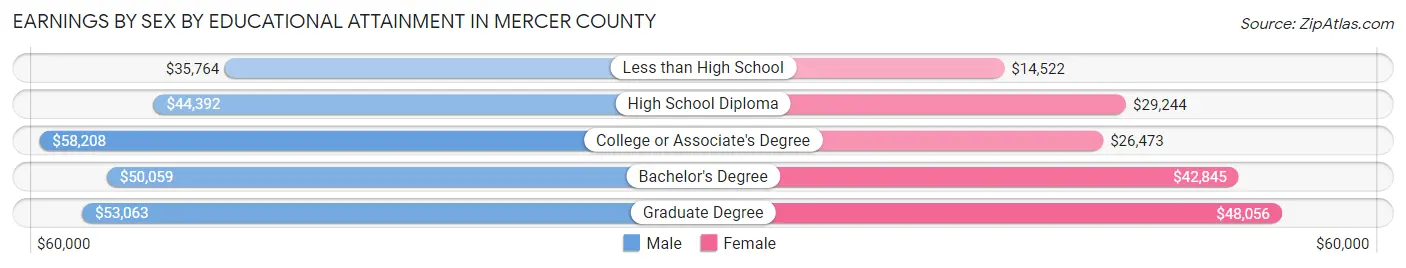
| Educational Attainment | Male Income | Female Income |
| Less than High School | $35,764 | $14,522 |
| High School Diploma | $44,392 | $29,244 |
| College or Associate's Degree | $58,208 | $26,473 |
| Bachelor's Degree | $50,059 | $42,845 |
| Graduate Degree | $53,063 | $48,056 |
| Total | $46,605 | $31,697 |
Family Income in Mercer County
Family Income Brackets in Mercer County
According to the Mercer County family income data, there are 3,199 families falling into the $50,000 to $74,999 income range, which is the most common income bracket and makes up 20.4% of all families. Conversely, the less than $10,000 income bracket is the least frequent group with only 314 families (2.0%) belonging to this category.
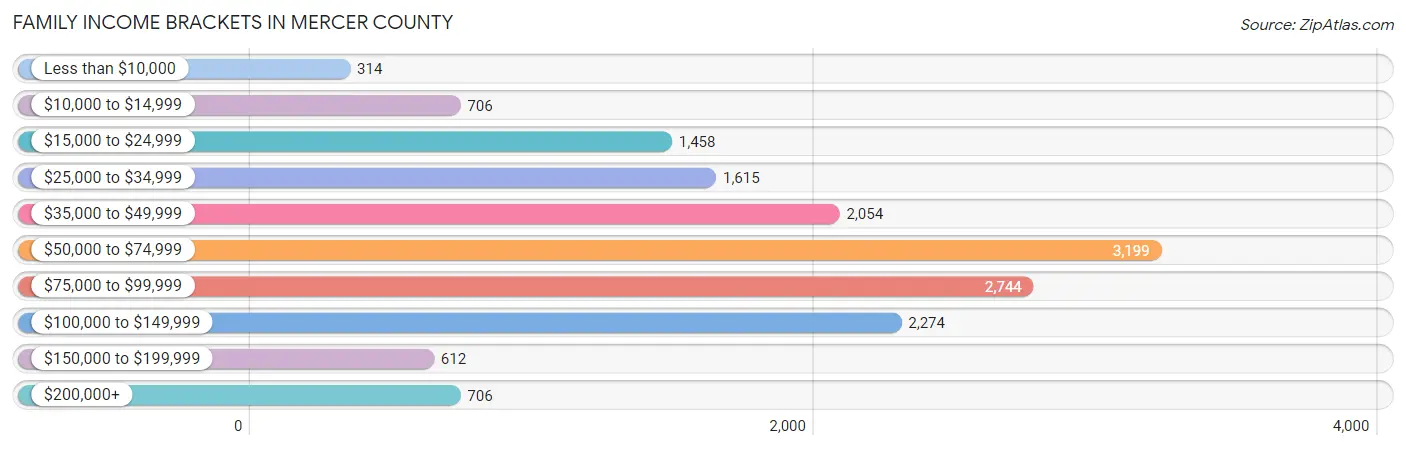
| Income Bracket | # Families | % Families |
| Less than $10,000 | 314 | 2.0% |
| $10,000 to $14,999 | 706 | 4.5% |
| $15,000 to $24,999 | 1,458 | 9.3% |
| $25,000 to $34,999 | 1,615 | 10.3% |
| $35,000 to $49,999 | 2,054 | 13.1% |
| $50,000 to $74,999 | 3,199 | 20.4% |
| $75,000 to $99,999 | 2,744 | 17.5% |
| $100,000 to $149,999 | 2,274 | 14.5% |
| $150,000 to $199,999 | 612 | 3.9% |
| $200,000+ | 706 | 4.5% |
Family Income by Famaliy Size in Mercer County
3-person families (3,191 | 20.3%) account for the highest median family income in Mercer County with $77,825 per family, while 2-person families (8,569 | 54.6%) have the highest median income of $27,559 per family member.
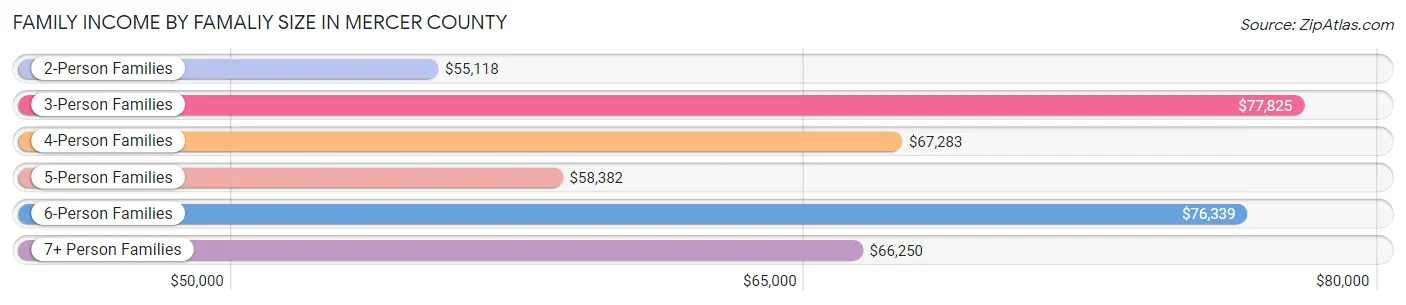
| Income Bracket | # Families | Median Income |
| 2-Person Families | 8,569 (54.6%) | $55,118 |
| 3-Person Families | 3,191 (20.3%) | $77,825 |
| 4-Person Families | 2,478 (15.8%) | $67,283 |
| 5-Person Families | 994 (6.3%) | $58,382 |
| 6-Person Families | 268 (1.7%) | $76,339 |
| 7+ Person Families | 181 (1.1%) | $66,250 |
| Total | 15,681 (100.0%) | $63,142 |
Family Income by Number of Earners in Mercer County
The median family income in Mercer County is $63,142, with families comprising 3+ earners (1,153) having the highest median family income of $110,320, while families with no earners (4,184) have the lowest median family income of $37,882, accounting for 7.3% and 26.7% of families, respectively.
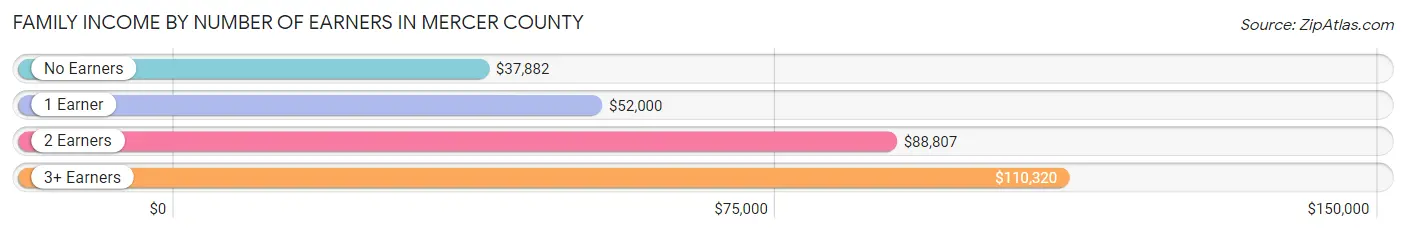
| Number of Earners | # Families | Median Income |
| No Earners | 4,184 (26.7%) | $37,882 |
| 1 Earner | 5,548 (35.4%) | $52,000 |
| 2 Earners | 4,796 (30.6%) | $88,807 |
| 3+ Earners | 1,153 (7.3%) | $110,320 |
| Total | 15,681 (100.0%) | $63,142 |
Household Income in Mercer County
Household Income Brackets in Mercer County
With 3,769 households falling in the category, the $50,000 to $74,999 income range is the most frequent in Mercer County, accounting for 15.4% of all households. In contrast, only 759 households (3.1%) fall into the $150,000 to $199,999 income bracket, making it the least populous group.
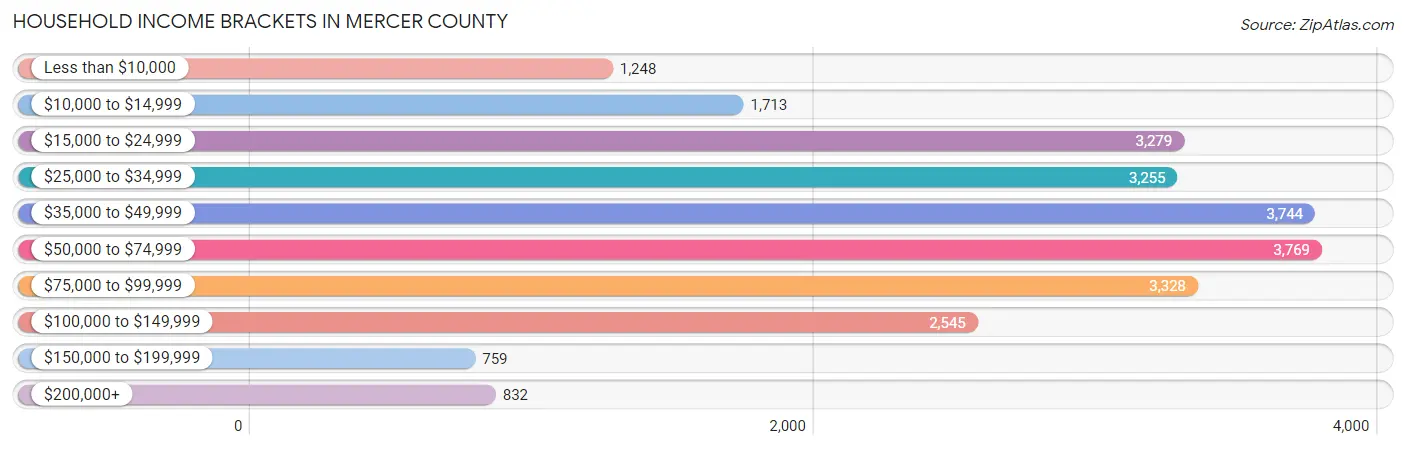
| Income Bracket | # Households | % Households |
| Less than $10,000 | 1,248 | 5.1% |
| $10,000 to $14,999 | 1,713 | 7.0% |
| $15,000 to $24,999 | 3,279 | 13.4% |
| $25,000 to $34,999 | 3,255 | 13.3% |
| $35,000 to $49,999 | 3,744 | 15.3% |
| $50,000 to $74,999 | 3,769 | 15.4% |
| $75,000 to $99,999 | 3,328 | 13.6% |
| $100,000 to $149,999 | 2,545 | 10.4% |
| $150,000 to $199,999 | 759 | 3.1% |
| $200,000+ | 832 | 3.4% |
Household Income by Householder Age in Mercer County
The median household income in Mercer County is $46,409, with the highest median household income of $51,208 found in the 25 to 44 years age bracket for the primary householder. A total of 6,471 households (26.4%) fall into this category. Meanwhile, the 15 to 24 years age bracket for the primary householder has the lowest median household income of $29,779, with 1,075 households (4.4%) in this group.
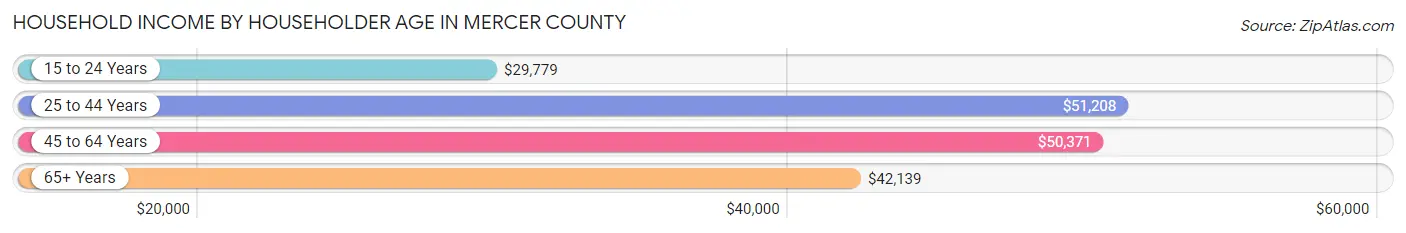
| Income Bracket | # Households | Median Income |
| 15 to 24 Years | 1,075 (4.4%) | $29,779 |
| 25 to 44 Years | 6,471 (26.4%) | $51,208 |
| 45 to 64 Years | 8,343 (34.1%) | $50,371 |
| 65+ Years | 8,582 (35.1%) | $42,139 |
| Total | 24,471 (100.0%) | $46,409 |
Poverty in Mercer County
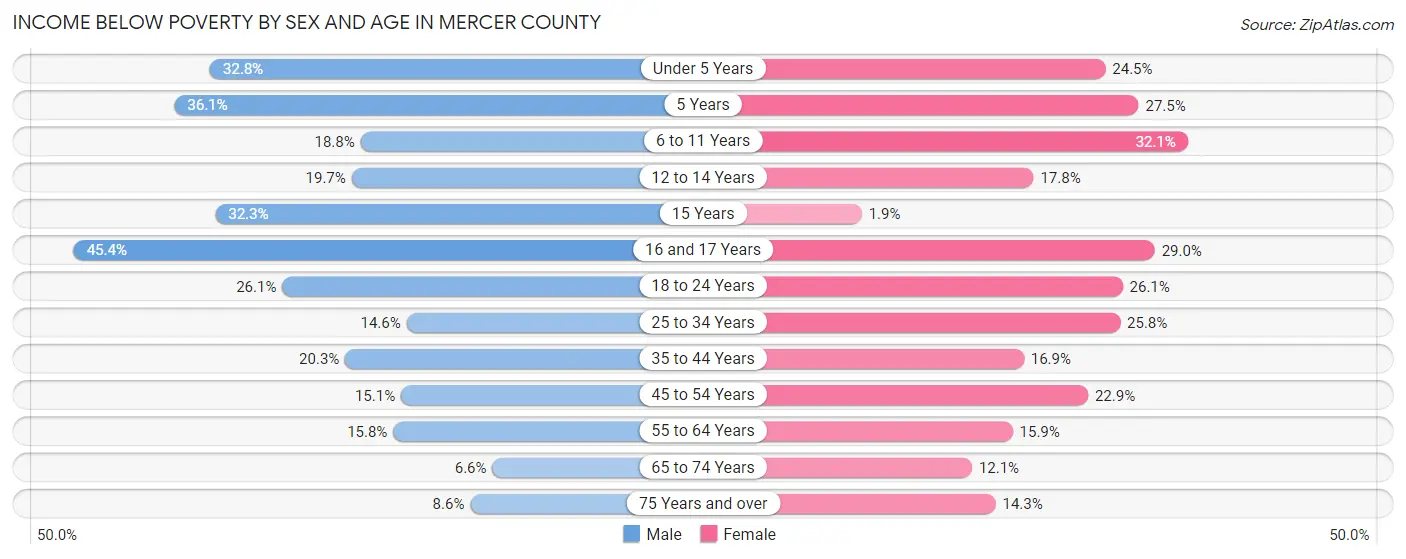
Income Below Poverty by Sex and Age in Mercer County
With 17.6% poverty level for males and 19.9% for females among the residents of Mercer County, 16 and 17 year old males and 6 to 11 year old females are the most vulnerable to poverty, with 304 males (45.4%) and 650 females (32.1%) in their respective age groups living below the poverty level.
| Age Bracket | Male | Female |
| Under 5 Years | 533 (32.8%) | 359 (24.5%) |
| 5 Years | 113 (36.1%) | 46 (27.5%) |
| 6 to 11 Years | 489 (18.8%) | 650 (32.1%) |
| 12 to 14 Years | 144 (19.7%) | 190 (17.8%) |
| 15 Years | 83 (32.3%) | 5 (1.8%) |
| 16 and 17 Years | 304 (45.4%) | 194 (29.0%) |
| 18 to 24 Years | 614 (26.1%) | 547 (26.1%) |
| 25 to 34 Years | 492 (14.5%) | 871 (25.8%) |
| 35 to 44 Years | 631 (20.3%) | 597 (16.9%) |
| 45 to 54 Years | 544 (15.1%) | 865 (22.9%) |
| 55 to 64 Years | 579 (15.8%) | 665 (15.9%) |
| 65 to 74 Years | 236 (6.6%) | 503 (12.1%) |
| 75 Years and over | 191 (8.6%) | 424 (14.3%) |
| Total | 4,953 (17.6%) | 5,916 (19.9%) |
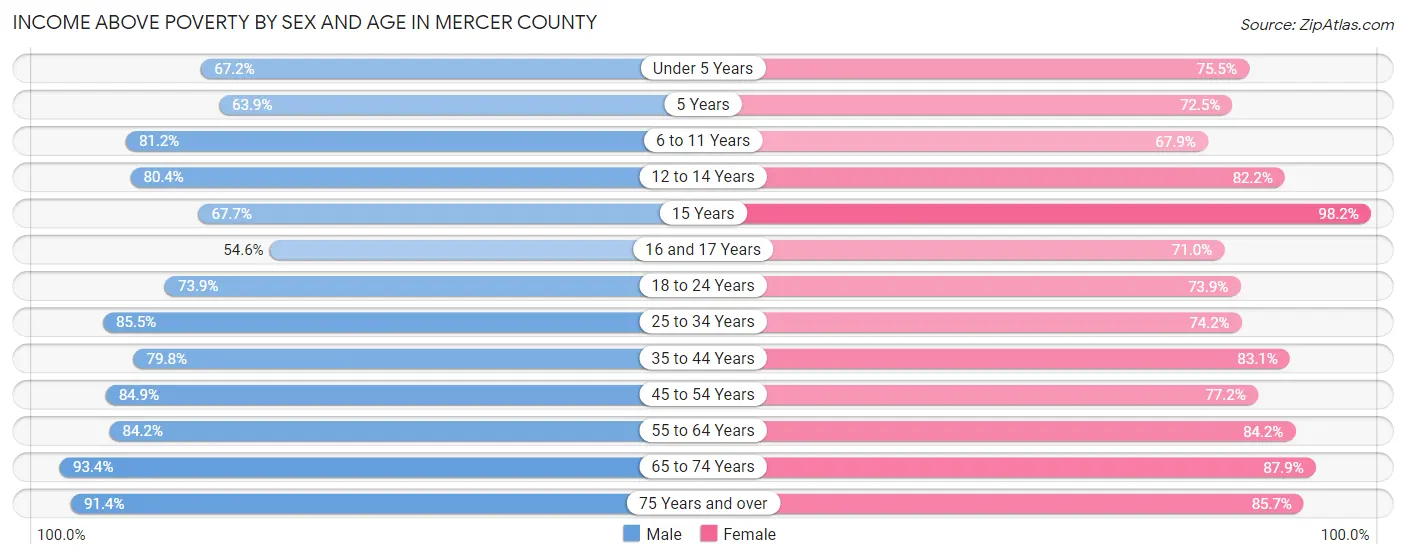
Income Above Poverty by Sex and Age in Mercer County
According to the poverty statistics in Mercer County, males aged 65 to 74 years and females aged 15 years are the age groups that are most secure financially, with 93.4% of males and 98.2% of females in these age groups living above the poverty line.
| Age Bracket | Male | Female |
| Under 5 Years | 1,092 (67.2%) | 1,109 (75.5%) |
| 5 Years | 200 (63.9%) | 121 (72.5%) |
| 6 to 11 Years | 2,109 (81.2%) | 1,375 (67.9%) |
| 12 to 14 Years | 589 (80.3%) | 878 (82.2%) |
| 15 Years | 174 (67.7%) | 265 (98.2%) |
| 16 and 17 Years | 365 (54.6%) | 474 (71.0%) |
| 18 to 24 Years | 1,739 (73.9%) | 1,552 (73.9%) |
| 25 to 34 Years | 2,890 (85.5%) | 2,501 (74.2%) |
| 35 to 44 Years | 2,485 (79.7%) | 2,937 (83.1%) |
| 45 to 54 Years | 3,065 (84.9%) | 2,920 (77.1%) |
| 55 to 64 Years | 3,088 (84.2%) | 3,530 (84.2%) |
| 65 to 74 Years | 3,344 (93.4%) | 3,660 (87.9%) |
| 75 Years and over | 2,019 (91.4%) | 2,548 (85.7%) |
| Total | 23,159 (82.4%) | 23,870 (80.1%) |
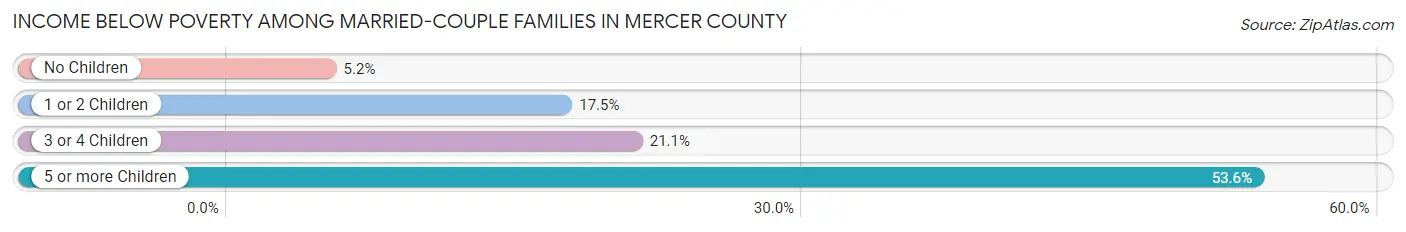
Income Below Poverty Among Married-Couple Families in Mercer County
The poverty statistics for married-couple families in Mercer County show that 9.6% or 1,072 of the total 11,150 families live below the poverty line. Families with 5 or more children have the highest poverty rate of 53.6%, comprising of 15 families. On the other hand, families with no children have the lowest poverty rate of 5.1%, which includes 381 families.
| Children | Above Poverty | Below Poverty |
| No Children | 7,010 (94.9%) | 381 (5.1%) |
| 1 or 2 Children | 2,529 (82.5%) | 535 (17.5%) |
| 3 or 4 Children | 526 (78.9%) | 141 (21.1%) |
| 5 or more Children | 13 (46.4%) | 15 (53.6%) |
| Total | 10,078 (90.4%) | 1,072 (9.6%) |
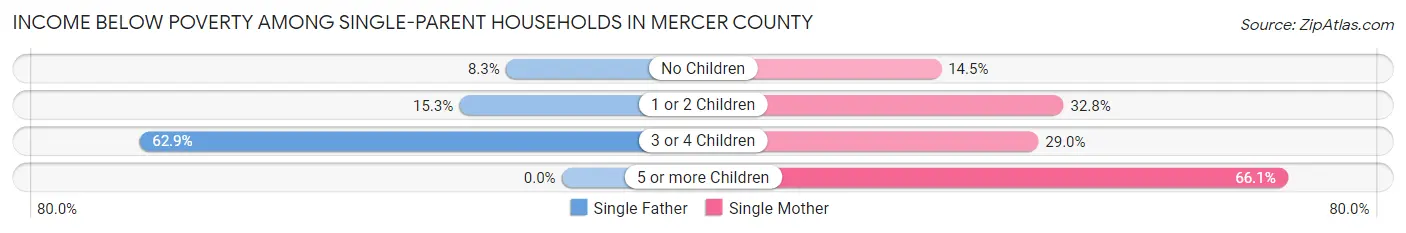
Income Below Poverty Among Single-Parent Households in Mercer County
According to the poverty data in Mercer County, 14.7% or 156 single-father households and 25.2% or 874 single-mother households are living below the poverty line. Among single-father households, those with 3 or 4 children have the highest poverty rate, with 39 households (62.9%) experiencing poverty. Likewise, among single-mother households, those with 5 or more children have the highest poverty rate, with 41 households (66.1%) falling below the poverty line.
| Children | Single Father | Single Mother |
| No Children | 43 (8.3%) | 213 (14.5%) |
| 1 or 2 Children | 74 (15.3%) | 497 (32.8%) |
| 3 or 4 Children | 39 (62.9%) | 123 (29.0%) |
| 5 or more Children | 0 (0.0%) | 41 (66.1%) |
| Total | 156 (14.7%) | 874 (25.2%) |
Income Below Poverty Among Married-Couple vs Single-Parent Households in Mercer County
The poverty data for Mercer County shows that 1,072 of the married-couple family households (9.6%) and 1,030 of the single-parent households (22.7%) are living below the poverty level. Within the married-couple family households, those with 5 or more children have the highest poverty rate, with 15 households (53.6%) falling below the poverty line. Among the single-parent households, those with 5 or more children have the highest poverty rate, with 41 household (66.1%) living below poverty.
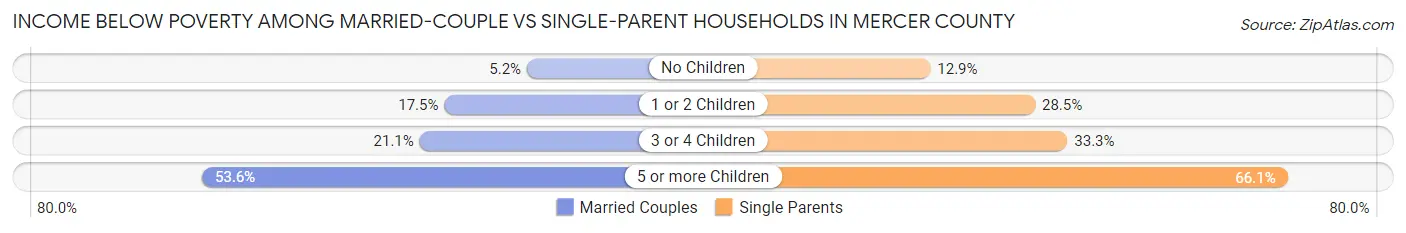
| Children | Married-Couple Families | Single-Parent Households |
| No Children | 381 (5.1%) | 256 (12.9%) |
| 1 or 2 Children | 535 (17.5%) | 571 (28.5%) |
| 3 or 4 Children | 141 (21.1%) | 162 (33.3%) |
| 5 or more Children | 15 (53.6%) | 41 (66.1%) |
| Total | 1,072 (9.6%) | 1,030 (22.7%) |
Employment Characteristics in Mercer County
Employment by Class of Employer in Mercer County
Among the 22,693 employed individuals in Mercer County, private company employees (14,843 | 65.4%), state government employees (2,374 | 10.5%), and local government employees (1,914 | 8.4%) make up the most common classes of employment.
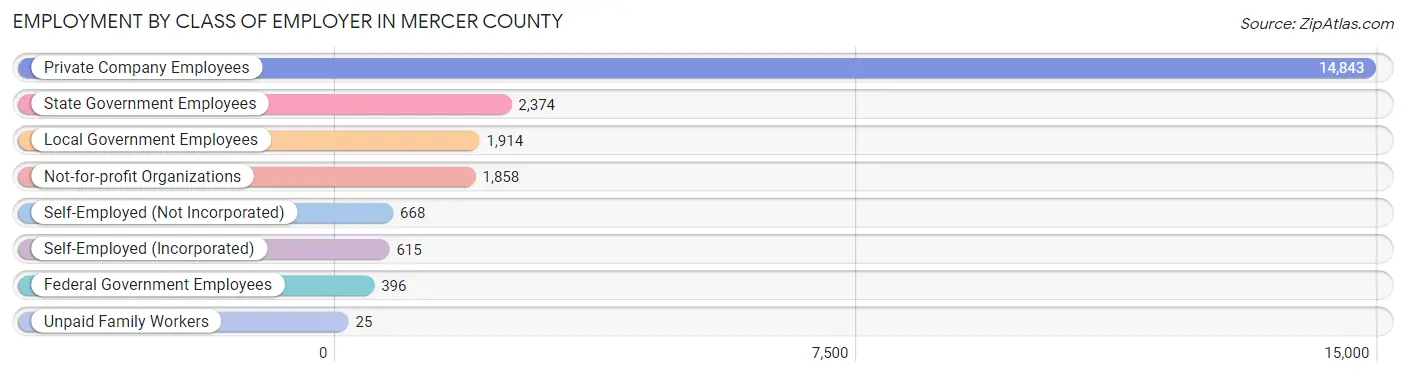
| Employer Class | # Employees | % Employees |
| Private Company Employees | 14,843 | 65.4% |
| Self-Employed (Incorporated) | 615 | 2.7% |
| Self-Employed (Not Incorporated) | 668 | 2.9% |
| Not-for-profit Organizations | 1,858 | 8.2% |
| Local Government Employees | 1,914 | 8.4% |
| State Government Employees | 2,374 | 10.5% |
| Federal Government Employees | 396 | 1.8% |
| Unpaid Family Workers | 25 | 0.1% |
| Total | 22,693 | 100.0% |
Employment Status by Age in Mercer County
According to the labor force statistics for Mercer County, out of the total population over 16 years of age (48,586), 49.7% or 24,147 individuals are in the labor force, with 4.2% or 1,014 of them unemployed. The age group with the highest labor force participation rate is 25 to 29 years, with 77.9% or 2,675 individuals in the labor force. Within the labor force, the 16 to 19 years age range has the highest percentage of unemployed individuals, with 12.3% or 142 of them being unemployed.
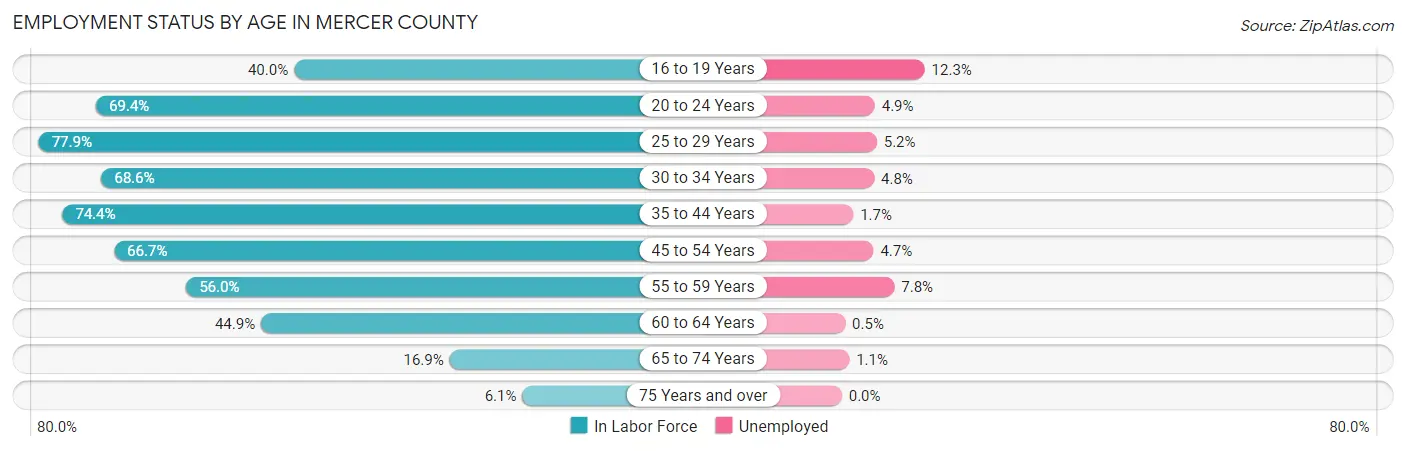
| Age Bracket | In Labor Force | Unemployed |
| 16 to 19 Years | 1,156 (40.0%) | 142 (12.3%) |
| 20 to 24 Years | 2,532 (69.4%) | 124 (4.9%) |
| 25 to 29 Years | 2,675 (77.9%) | 139 (5.2%) |
| 30 to 34 Years | 2,320 (68.6%) | 111 (4.8%) |
| 35 to 44 Years | 4,954 (74.4%) | 84 (1.7%) |
| 45 to 54 Years | 4,935 (66.7%) | 232 (4.7%) |
| 55 to 59 Years | 1,995 (56.0%) | 156 (7.8%) |
| 60 to 64 Years | 1,941 (44.9%) | 10 (0.5%) |
| 65 to 74 Years | 1,323 (16.9%) | 15 (1.1%) |
| 75 Years and over | 333 (6.1%) | 0 (0.0%) |
| Total | 24,147 (49.7%) | 1,014 (4.2%) |
Employment Status by Educational Attainment in Mercer County
According to labor force statistics for Mercer County, 65.4% of individuals (18,809) out of the total population between 25 and 64 years of age (28,760) are in the labor force, with 3.9% or 734 of them being unemployed. The group with the highest labor force participation rate are those with the educational attainment of bachelor's degree or higher, with 79.5% or 5,012 individuals in the labor force. Within the labor force, individuals with less than high school education have the highest percentage of unemployment, with 9.6% or 113 of them being unemployed.
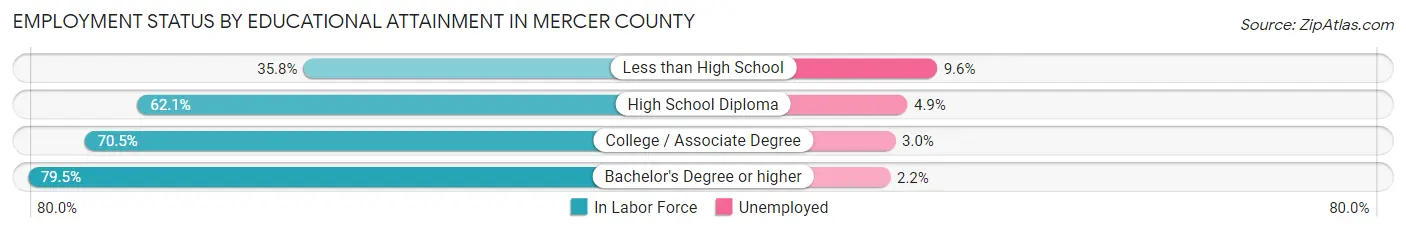
| Educational Attainment | In Labor Force | Unemployed |
| Less than High School | 1,175 (35.8%) | 315 (9.6%) |
| High School Diploma | 6,560 (62.1%) | 518 (4.9%) |
| College / Associate Degree | 6,069 (70.5%) | 258 (3.0%) |
| Bachelor's Degree or higher | 5,012 (79.5%) | 139 (2.2%) |
| Total | 18,809 (65.4%) | 1,122 (3.9%) |
Employment Occupations by Sex in Mercer County
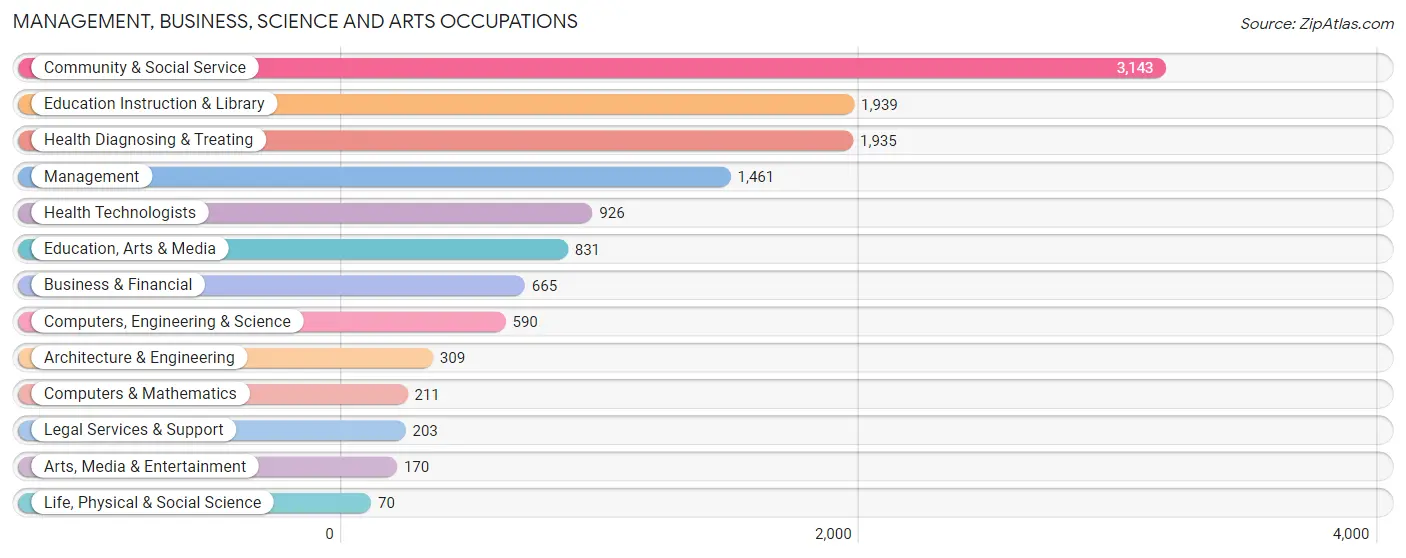
Management, Business, Science and Arts Occupations
The most common Management, Business, Science and Arts occupations in Mercer County are Community & Social Service (3,143 | 13.6%), Education Instruction & Library (1,939 | 8.4%), Health Diagnosing & Treating (1,935 | 8.4%), Management (1,461 | 6.3%), and Health Technologists (926 | 4.0%).
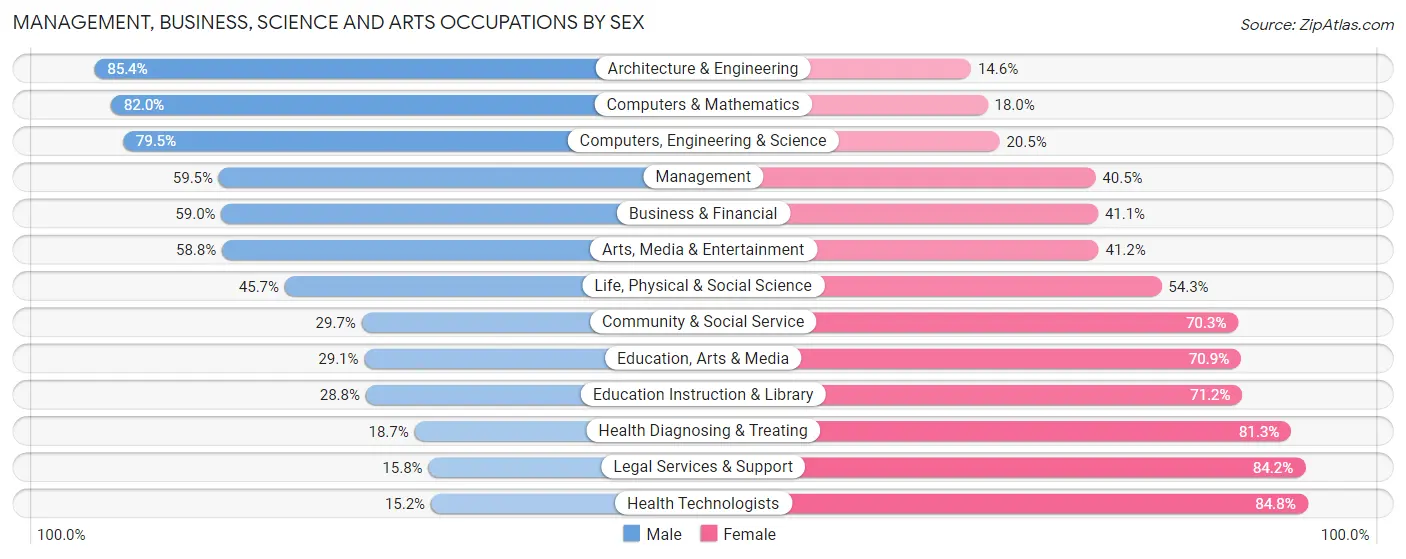
Management, Business, Science and Arts Occupations by Sex
Within the Management, Business, Science and Arts occupations in Mercer County, the most male-oriented occupations are Architecture & Engineering (85.4%), Computers & Mathematics (82.0%), and Computers, Engineering & Science (79.5%), while the most female-oriented occupations are Health Technologists (84.8%), Legal Services & Support (84.2%), and Health Diagnosing & Treating (81.3%).
| Occupation | Male | Female |
| Management | 869 (59.5%) | 592 (40.5%) |
| Business & Financial | 392 (59.0%) | 273 (41.0%) |
| Computers, Engineering & Science | 469 (79.5%) | 121 (20.5%) |
| Computers & Mathematics | 173 (82.0%) | 38 (18.0%) |
| Architecture & Engineering | 264 (85.4%) | 45 (14.6%) |
| Life, Physical & Social Science | 32 (45.7%) | 38 (54.3%) |
| Community & Social Service | 933 (29.7%) | 2,210 (70.3%) |
| Education, Arts & Media | 242 (29.1%) | 589 (70.9%) |
| Legal Services & Support | 32 (15.8%) | 171 (84.2%) |
| Education Instruction & Library | 559 (28.8%) | 1,380 (71.2%) |
| Arts, Media & Entertainment | 100 (58.8%) | 70 (41.2%) |
| Health Diagnosing & Treating | 361 (18.7%) | 1,574 (81.3%) |
| Health Technologists | 141 (15.2%) | 785 (84.8%) |
| Total (Category) | 3,024 (38.8%) | 4,770 (61.2%) |
| Total (Overall) | 11,828 (51.2%) | 11,291 (48.8%) |
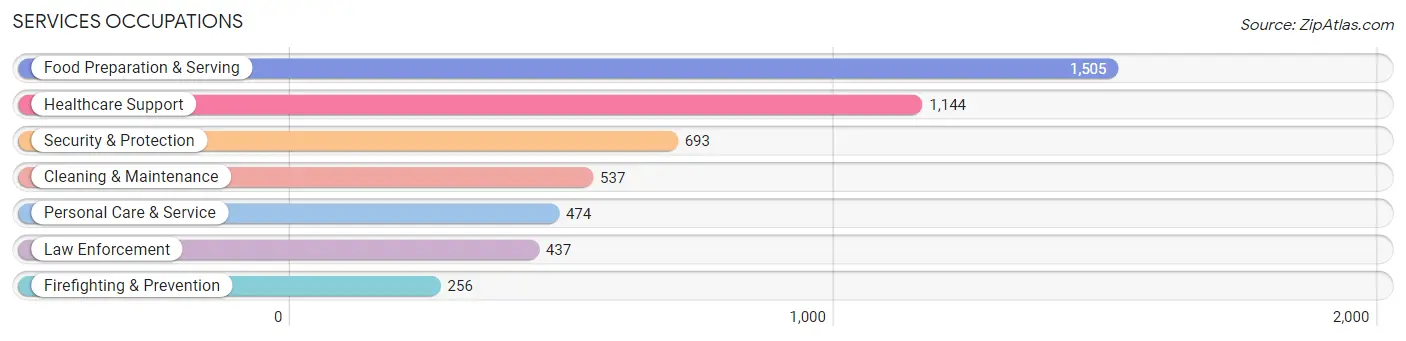
Services Occupations
The most common Services occupations in Mercer County are Food Preparation & Serving (1,505 | 6.5%), Healthcare Support (1,144 | 5.0%), Security & Protection (693 | 3.0%), Cleaning & Maintenance (537 | 2.3%), and Personal Care & Service (474 | 2.1%).
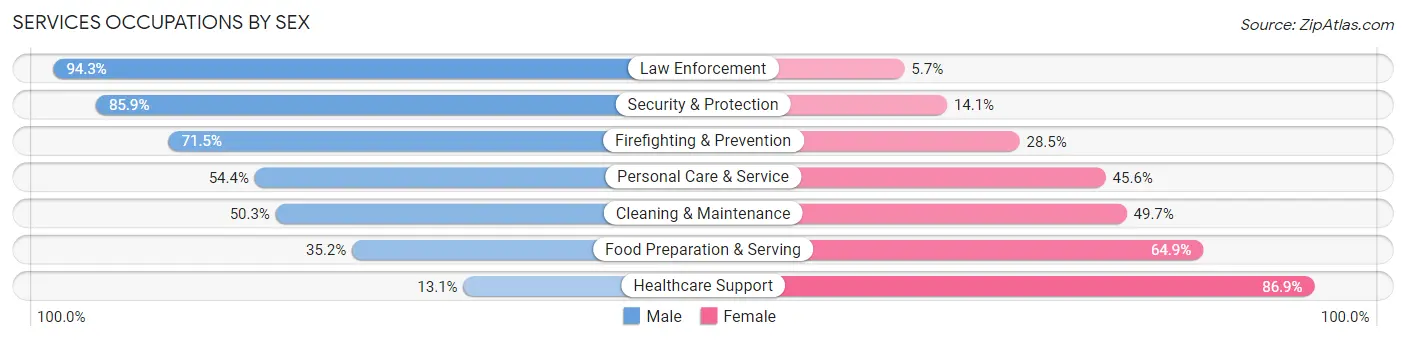
Services Occupations by Sex
Within the Services occupations in Mercer County, the most male-oriented occupations are Law Enforcement (94.3%), Security & Protection (85.9%), and Firefighting & Prevention (71.5%), while the most female-oriented occupations are Healthcare Support (86.9%), Food Preparation & Serving (64.8%), and Cleaning & Maintenance (49.7%).
| Occupation | Male | Female |
| Healthcare Support | 150 (13.1%) | 994 (86.9%) |
| Security & Protection | 595 (85.9%) | 98 (14.1%) |
| Firefighting & Prevention | 183 (71.5%) | 73 (28.5%) |
| Law Enforcement | 412 (94.3%) | 25 (5.7%) |
| Food Preparation & Serving | 529 (35.1%) | 976 (64.8%) |
| Cleaning & Maintenance | 270 (50.3%) | 267 (49.7%) |
| Personal Care & Service | 258 (54.4%) | 216 (45.6%) |
| Total (Category) | 1,802 (41.4%) | 2,551 (58.6%) |
| Total (Overall) | 11,828 (51.2%) | 11,291 (48.8%) |
Sales and Office Occupations
The most common Sales and Office occupations in Mercer County are Office & Administration (2,639 | 11.4%), and Sales & Related (1,994 | 8.6%).

Sales and Office Occupations by Sex

| Occupation | Male | Female |
| Sales & Related | 895 (44.9%) | 1,099 (55.1%) |
| Office & Administration | 520 (19.7%) | 2,119 (80.3%) |
| Total (Category) | 1,415 (30.5%) | 3,218 (69.5%) |
| Total (Overall) | 11,828 (51.2%) | 11,291 (48.8%) |
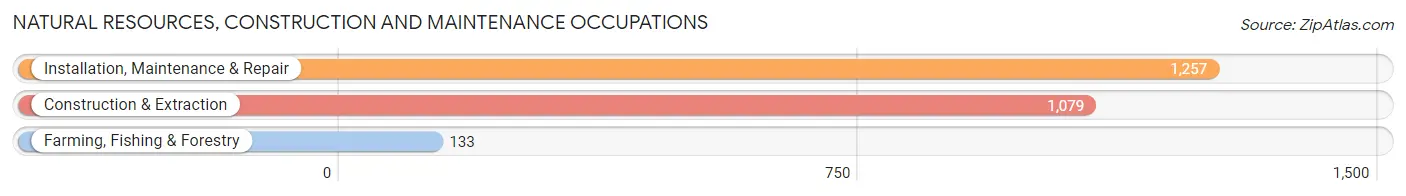
Natural Resources, Construction and Maintenance Occupations
The most common Natural Resources, Construction and Maintenance occupations in Mercer County are Installation, Maintenance & Repair (1,257 | 5.4%), Construction & Extraction (1,079 | 4.7%), and Farming, Fishing & Forestry (133 | 0.6%).
Natural Resources, Construction and Maintenance Occupations by Sex
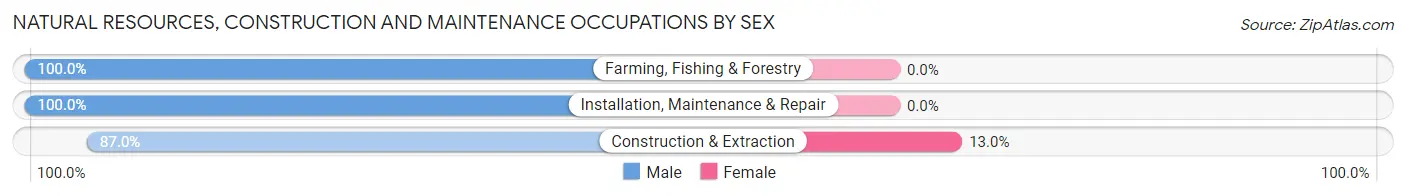
| Occupation | Male | Female |
| Farming, Fishing & Forestry | 133 (100.0%) | 0 (0.0%) |
| Construction & Extraction | 939 (87.0%) | 140 (13.0%) |
| Installation, Maintenance & Repair | 1,257 (100.0%) | 0 (0.0%) |
| Total (Category) | 2,329 (94.3%) | 140 (5.7%) |
| Total (Overall) | 11,828 (51.2%) | 11,291 (48.8%) |
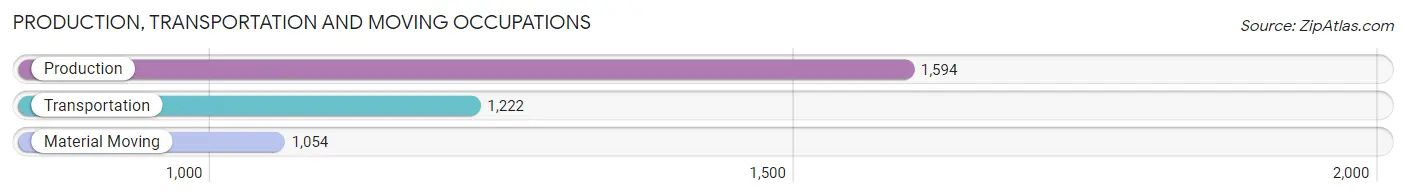
Production, Transportation and Moving Occupations
The most common Production, Transportation and Moving occupations in Mercer County are Production (1,594 | 6.9%), Transportation (1,222 | 5.3%), and Material Moving (1,054 | 4.6%).
Production, Transportation and Moving Occupations by Sex
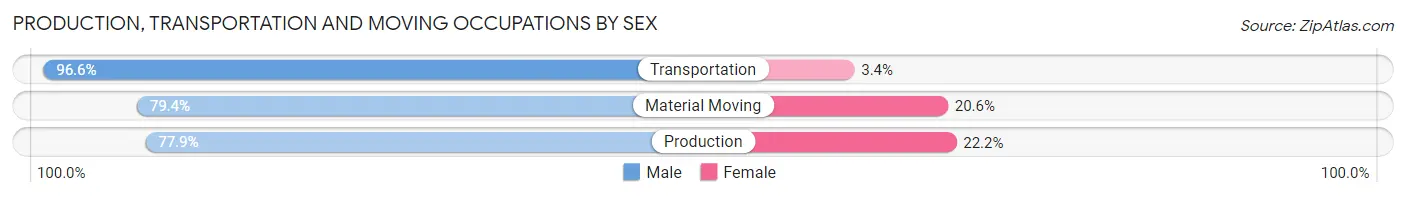
| Occupation | Male | Female |
| Production | 1,241 (77.8%) | 353 (22.2%) |
| Transportation | 1,180 (96.6%) | 42 (3.4%) |
| Material Moving | 837 (79.4%) | 217 (20.6%) |
| Total (Category) | 3,258 (84.2%) | 612 (15.8%) |
| Total (Overall) | 11,828 (51.2%) | 11,291 (48.8%) |
Employment Industries by Sex in Mercer County
Employment Industries in Mercer County
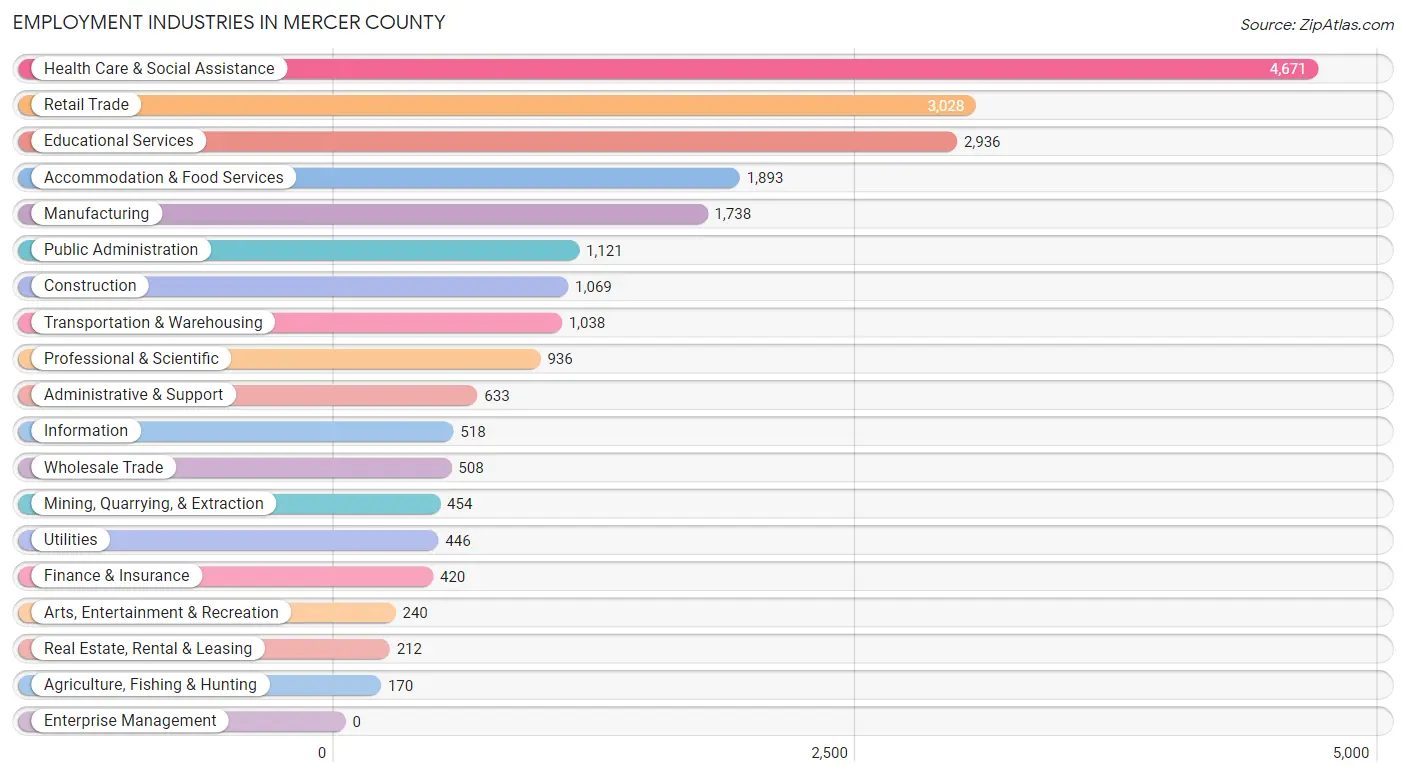
The major employment industries in Mercer County include Health Care & Social Assistance (4,671 | 20.2%), Retail Trade (3,028 | 13.1%), Educational Services (2,936 | 12.7%), Accommodation & Food Services (1,893 | 8.2%), and Manufacturing (1,738 | 7.5%).
Employment Industries by Sex in Mercer County
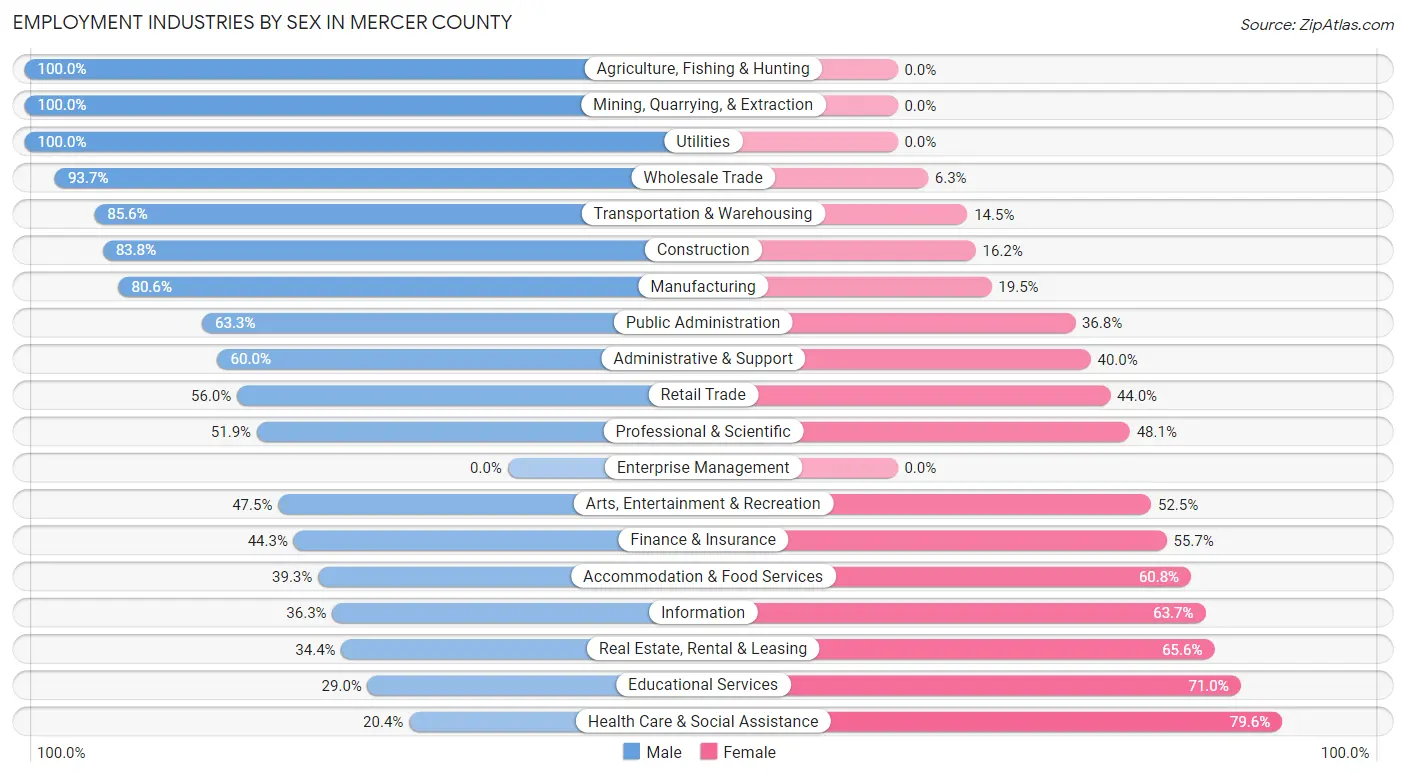
The Mercer County industries that see more men than women are Agriculture, Fishing & Hunting (100.0%), Mining, Quarrying, & Extraction (100.0%), and Utilities (100.0%), whereas the industries that tend to have a higher number of women are Health Care & Social Assistance (79.6%), Educational Services (71.0%), and Real Estate, Rental & Leasing (65.6%).
| Industry | Male | Female |
| Agriculture, Fishing & Hunting | 170 (100.0%) | 0 (0.0%) |
| Mining, Quarrying, & Extraction | 454 (100.0%) | 0 (0.0%) |
| Construction | 896 (83.8%) | 173 (16.2%) |
| Manufacturing | 1,400 (80.5%) | 338 (19.5%) |
| Wholesale Trade | 476 (93.7%) | 32 (6.3%) |
| Retail Trade | 1,696 (56.0%) | 1,332 (44.0%) |
| Transportation & Warehousing | 888 (85.6%) | 150 (14.4%) |
| Utilities | 446 (100.0%) | 0 (0.0%) |
| Information | 188 (36.3%) | 330 (63.7%) |
| Finance & Insurance | 186 (44.3%) | 234 (55.7%) |
| Real Estate, Rental & Leasing | 73 (34.4%) | 139 (65.6%) |
| Professional & Scientific | 486 (51.9%) | 450 (48.1%) |
| Enterprise Management | 0 (0.0%) | 0 (0.0%) |
| Administrative & Support | 380 (60.0%) | 253 (40.0%) |
| Educational Services | 851 (29.0%) | 2,085 (71.0%) |
| Health Care & Social Assistance | 953 (20.4%) | 3,718 (79.6%) |
| Arts, Entertainment & Recreation | 114 (47.5%) | 126 (52.5%) |
| Accommodation & Food Services | 743 (39.3%) | 1,150 (60.8%) |
| Public Administration | 709 (63.2%) | 412 (36.7%) |
| Total | 11,828 (51.2%) | 11,291 (48.8%) |
Education in Mercer County
School Enrollment in Mercer County
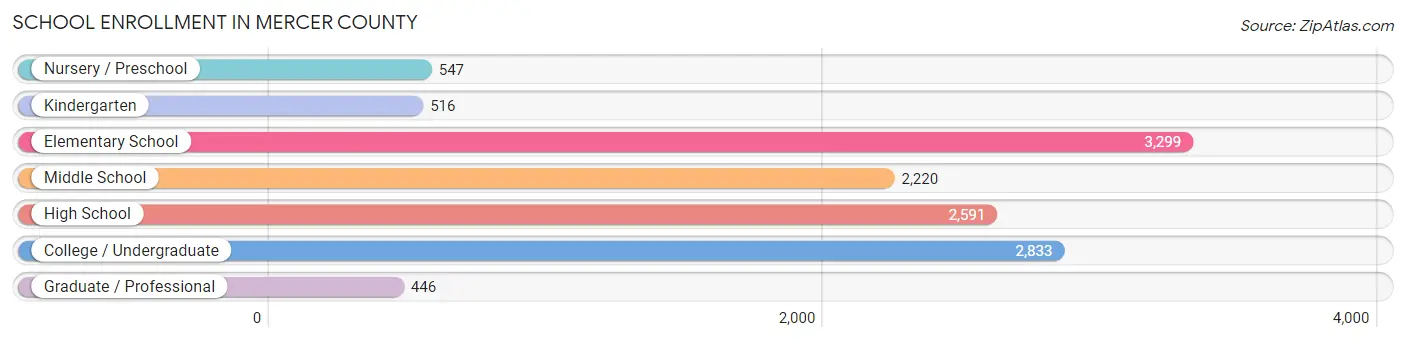
The most common levels of schooling among the 12,452 students in Mercer County are elementary school (3,299 | 26.5%), college / undergraduate (2,833 | 22.8%), and high school (2,591 | 20.8%).
| School Level | # Students | % Students |
| Nursery / Preschool | 547 | 4.4% |
| Kindergarten | 516 | 4.1% |
| Elementary School | 3,299 | 26.5% |
| Middle School | 2,220 | 17.8% |
| High School | 2,591 | 20.8% |
| College / Undergraduate | 2,833 | 22.8% |
| Graduate / Professional | 446 | 3.6% |
| Total | 12,452 | 100.0% |
School Enrollment by Age by Funding Source in Mercer County
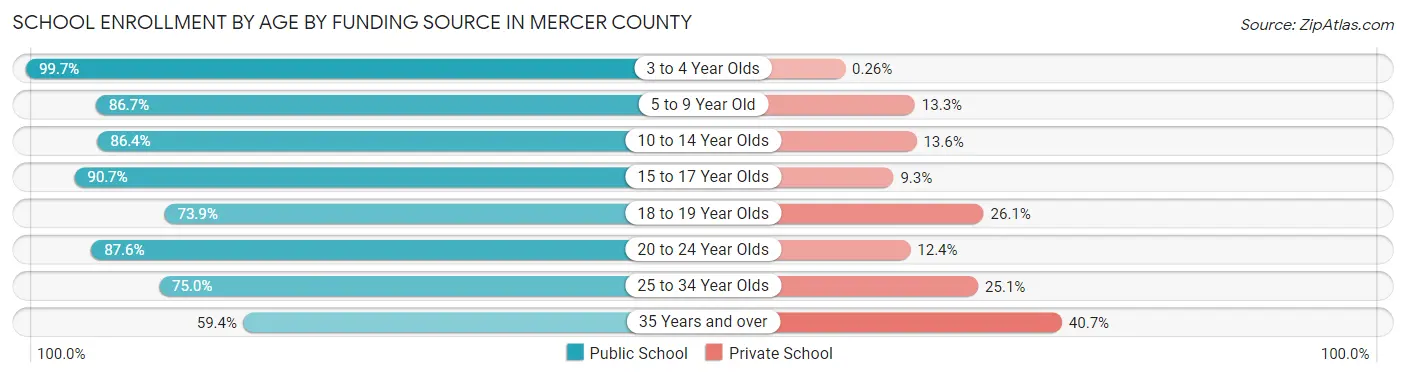
Out of a total of 12,452 students who are enrolled in schools in Mercer County, 1,843 (14.8%) attend a private institution, while the remaining 10,609 (85.2%) are enrolled in public schools. The age group of 35 years and over has the highest likelihood of being enrolled in private schools, with 200 (40.6% in the age bracket) enrolled. Conversely, the age group of 3 to 4 year olds has the lowest likelihood of being enrolled in a private school, with 377 (99.7% in the age bracket) attending a public institution.
| Age Bracket | Public School | Private School |
| 3 to 4 Year Olds | 377 (99.7%) | 1 (0.3%) |
| 5 to 9 Year Old | 3,012 (86.7%) | 461 (13.3%) |
| 10 to 14 Year Olds | 2,670 (86.4%) | 419 (13.6%) |
| 15 to 17 Year Olds | 1,730 (90.7%) | 177 (9.3%) |
| 18 to 19 Year Olds | 760 (73.9%) | 268 (26.1%) |
| 20 to 24 Year Olds | 1,410 (87.6%) | 200 (12.4%) |
| 25 to 34 Year Olds | 356 (75.0%) | 119 (25.1%) |
| 35 Years and over | 292 (59.4%) | 200 (40.6%) |
| Total | 10,609 (85.2%) | 1,843 (14.8%) |
Educational Attainment by Field of Study in Mercer County
Education (2,369 | 25.6%), business (1,479 | 16.0%), science & technology (994 | 10.7%), arts & humanities (868 | 9.4%), and psychology (766 | 8.3%) are the most common fields of study among 9,257 individuals in Mercer County who have obtained a bachelor's degree or higher.
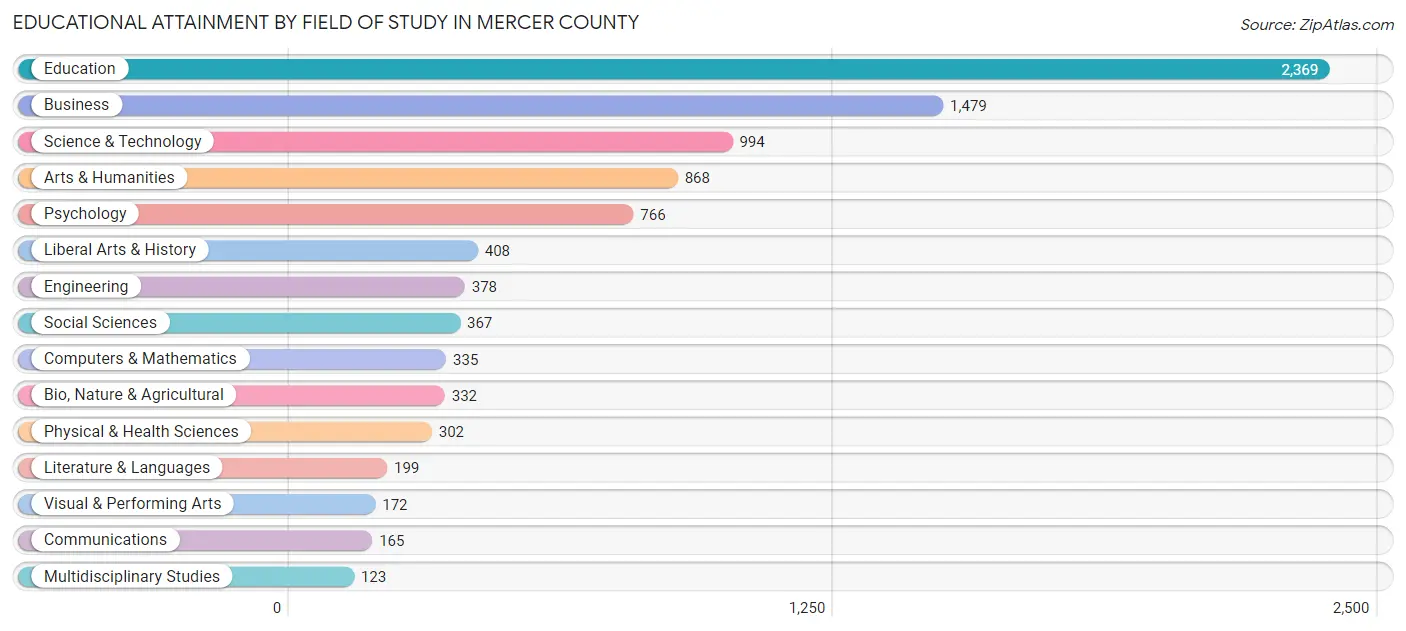
| Field of Study | # Graduates | % Graduates |
| Computers & Mathematics | 335 | 3.6% |
| Bio, Nature & Agricultural | 332 | 3.6% |
| Physical & Health Sciences | 302 | 3.3% |
| Psychology | 766 | 8.3% |
| Social Sciences | 367 | 4.0% |
| Engineering | 378 | 4.1% |
| Multidisciplinary Studies | 123 | 1.3% |
| Science & Technology | 994 | 10.7% |
| Business | 1,479 | 16.0% |
| Education | 2,369 | 25.6% |
| Literature & Languages | 199 | 2.1% |
| Liberal Arts & History | 408 | 4.4% |
| Visual & Performing Arts | 172 | 1.9% |
| Communications | 165 | 1.8% |
| Arts & Humanities | 868 | 9.4% |
| Total | 9,257 | 100.0% |
Transportation & Commute in Mercer County
Vehicle Availability by Sex in Mercer County
The most prevalent vehicle ownership categories in Mercer County are males with 2 vehicles (4,212, accounting for 36.2%) and females with 2 vehicles (4,065, making up 38.7%).
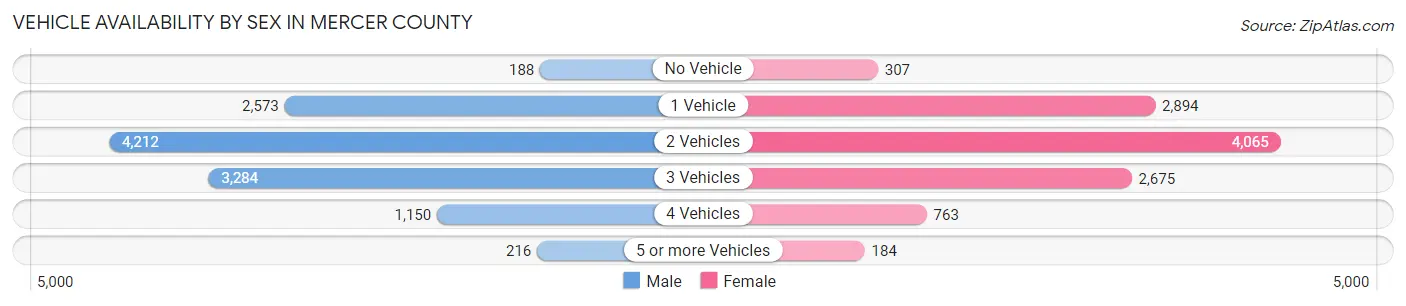
| Vehicles Available | Male | Female |
| No Vehicle | 188 (1.6%) | 307 (2.8%) |
| 1 Vehicle | 2,573 (22.1%) | 2,894 (26.6%) |
| 2 Vehicles | 4,212 (36.2%) | 4,065 (37.3%) |
| 3 Vehicles | 3,284 (28.2%) | 2,675 (24.6%) |
| 4 Vehicles | 1,150 (9.9%) | 763 (7.0%) |
| 5 or more Vehicles | 216 (1.9%) | 184 (1.7%) |
| Total | 11,623 (100.0%) | 10,888 (100.0%) |
Commute Time in Mercer County
The most frequently occuring commute durations in Mercer County are 10 to 14 minutes (4,112 commuters, 19.0%), 15 to 19 minutes (3,270 commuters, 15.1%), and 20 to 24 minutes (3,166 commuters, 14.6%).
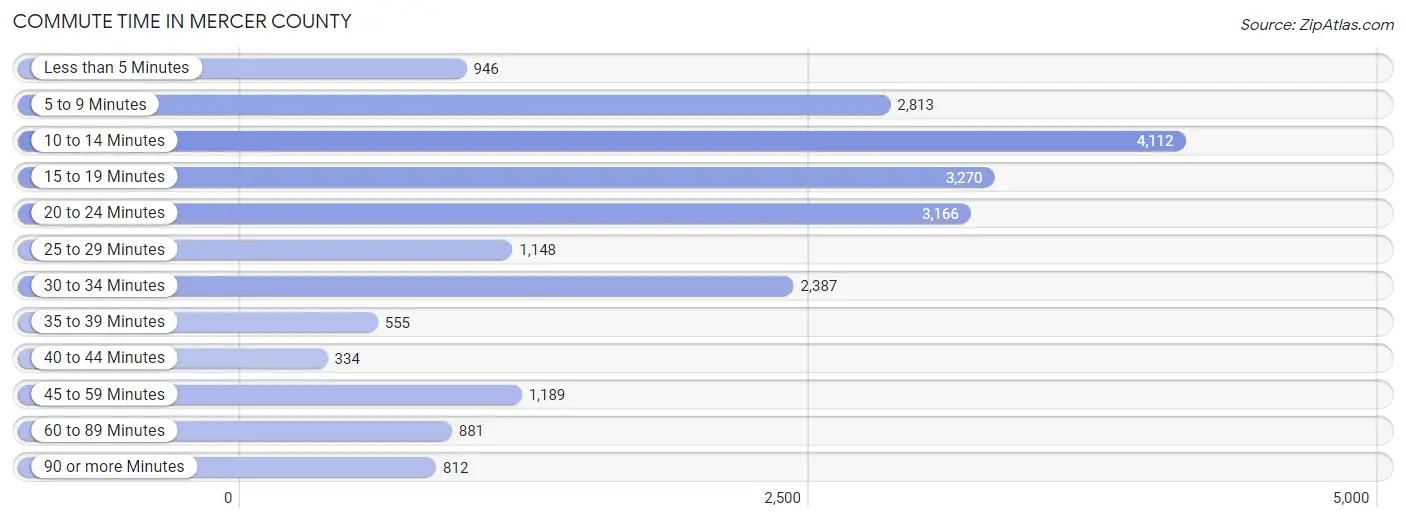
| Commute Time | # Commuters | % Commuters |
| Less than 5 Minutes | 946 | 4.4% |
| 5 to 9 Minutes | 2,813 | 13.0% |
| 10 to 14 Minutes | 4,112 | 19.0% |
| 15 to 19 Minutes | 3,270 | 15.1% |
| 20 to 24 Minutes | 3,166 | 14.6% |
| 25 to 29 Minutes | 1,148 | 5.3% |
| 30 to 34 Minutes | 2,387 | 11.0% |
| 35 to 39 Minutes | 555 | 2.6% |
| 40 to 44 Minutes | 334 | 1.5% |
| 45 to 59 Minutes | 1,189 | 5.5% |
| 60 to 89 Minutes | 881 | 4.1% |
| 90 or more Minutes | 812 | 3.8% |
Commute Time by Sex in Mercer County
The most common commute times in Mercer County are 20 to 24 minutes (1,852 commuters, 16.5%) for males and 10 to 14 minutes (2,283 commuters, 22.0%) for females.
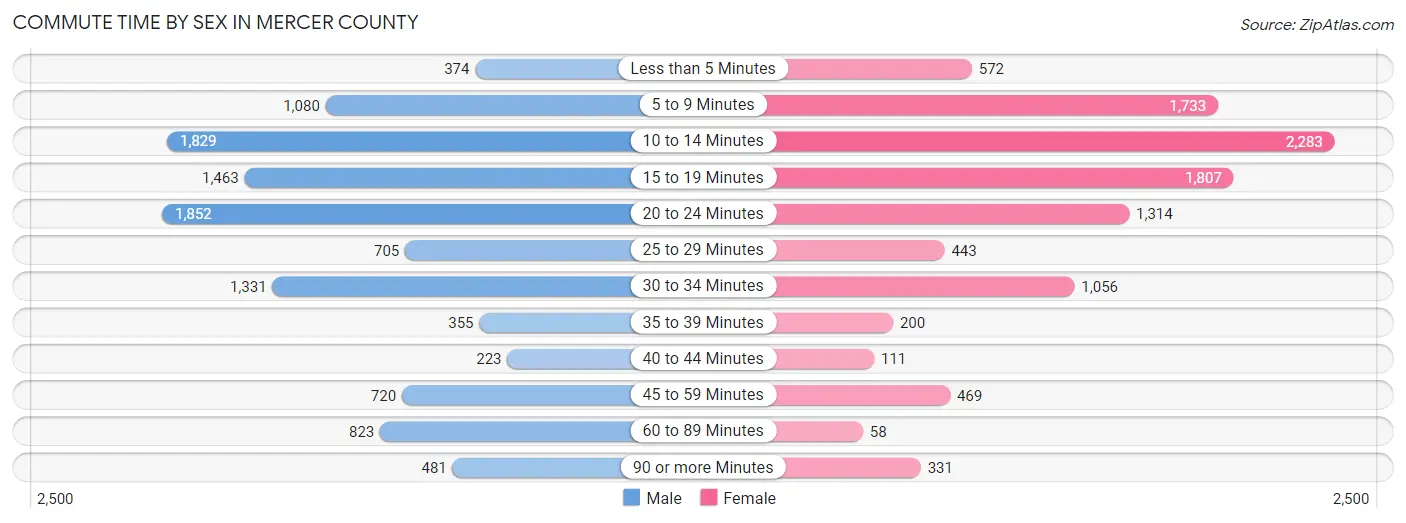
| Commute Time | Male | Female |
| Less than 5 Minutes | 374 (3.3%) | 572 (5.5%) |
| 5 to 9 Minutes | 1,080 (9.6%) | 1,733 (16.7%) |
| 10 to 14 Minutes | 1,829 (16.3%) | 2,283 (22.0%) |
| 15 to 19 Minutes | 1,463 (13.0%) | 1,807 (17.4%) |
| 20 to 24 Minutes | 1,852 (16.5%) | 1,314 (12.7%) |
| 25 to 29 Minutes | 705 (6.3%) | 443 (4.3%) |
| 30 to 34 Minutes | 1,331 (11.8%) | 1,056 (10.2%) |
| 35 to 39 Minutes | 355 (3.2%) | 200 (1.9%) |
| 40 to 44 Minutes | 223 (2.0%) | 111 (1.1%) |
| 45 to 59 Minutes | 720 (6.4%) | 469 (4.5%) |
| 60 to 89 Minutes | 823 (7.3%) | 58 (0.6%) |
| 90 or more Minutes | 481 (4.3%) | 331 (3.2%) |
Time of Departure to Work by Sex in Mercer County
The most frequent times of departure to work in Mercer County are 7:00 AM to 7:29 AM (1,785, 15.9%) for males and 7:30 AM to 7:59 AM (2,035, 19.6%) for females.
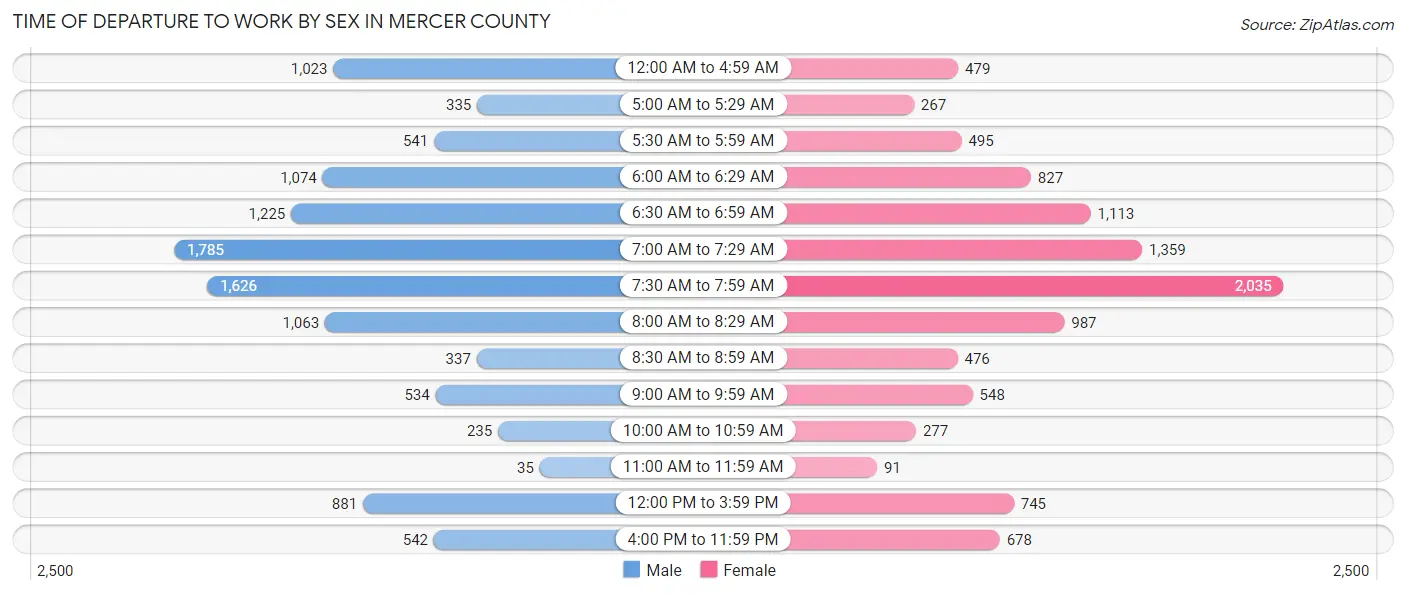
| Time of Departure | Male | Female |
| 12:00 AM to 4:59 AM | 1,023 (9.1%) | 479 (4.6%) |
| 5:00 AM to 5:29 AM | 335 (3.0%) | 267 (2.6%) |
| 5:30 AM to 5:59 AM | 541 (4.8%) | 495 (4.8%) |
| 6:00 AM to 6:29 AM | 1,074 (9.6%) | 827 (8.0%) |
| 6:30 AM to 6:59 AM | 1,225 (10.9%) | 1,113 (10.7%) |
| 7:00 AM to 7:29 AM | 1,785 (15.9%) | 1,359 (13.1%) |
| 7:30 AM to 7:59 AM | 1,626 (14.5%) | 2,035 (19.6%) |
| 8:00 AM to 8:29 AM | 1,063 (9.5%) | 987 (9.5%) |
| 8:30 AM to 8:59 AM | 337 (3.0%) | 476 (4.6%) |
| 9:00 AM to 9:59 AM | 534 (4.8%) | 548 (5.3%) |
| 10:00 AM to 10:59 AM | 235 (2.1%) | 277 (2.7%) |
| 11:00 AM to 11:59 AM | 35 (0.3%) | 91 (0.9%) |
| 12:00 PM to 3:59 PM | 881 (7.8%) | 745 (7.2%) |
| 4:00 PM to 11:59 PM | 542 (4.8%) | 678 (6.5%) |
| Total | 11,236 (100.0%) | 10,377 (100.0%) |
Housing Occupancy in Mercer County
Occupancy by Ownership in Mercer County
Of the total 24,471 dwellings in Mercer County, owner-occupied units account for 17,118 (70.0%), while renter-occupied units make up 7,353 (30.0%).
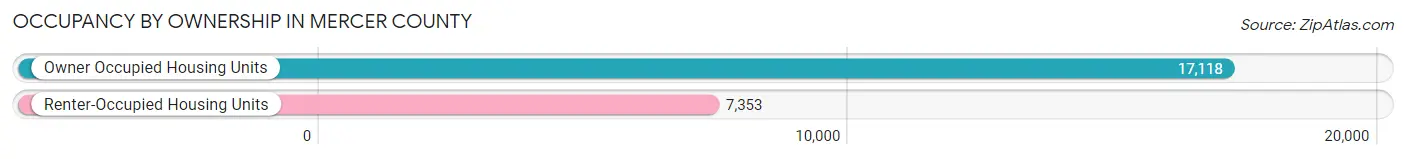
| Occupancy | # Housing Units | % Housing Units |
| Owner Occupied Housing Units | 17,118 | 70.0% |
| Renter-Occupied Housing Units | 7,353 | 30.0% |
| Total Occupied Housing Units | 24,471 | 100.0% |
Occupancy by Household Size in Mercer County
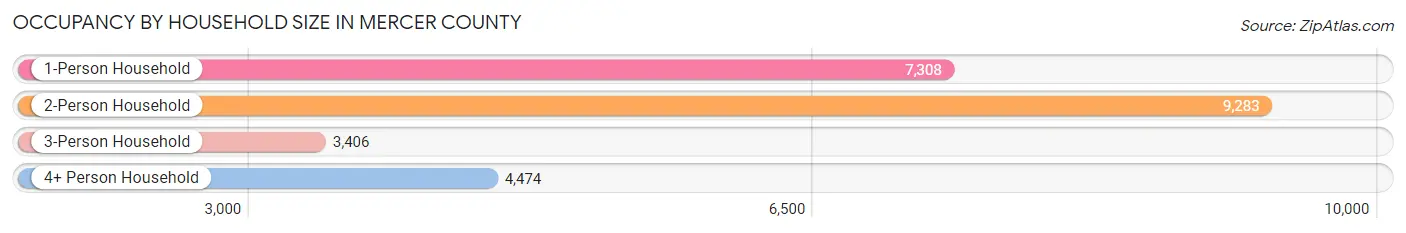
| Household Size | # Housing Units | % Housing Units |
| 1-Person Household | 7,308 | 29.9% |
| 2-Person Household | 9,283 | 37.9% |
| 3-Person Household | 3,406 | 13.9% |
| 4+ Person Household | 4,474 | 18.3% |
| Total Housing Units | 24,471 | 100.0% |
Occupancy by Ownership by Household Size in Mercer County
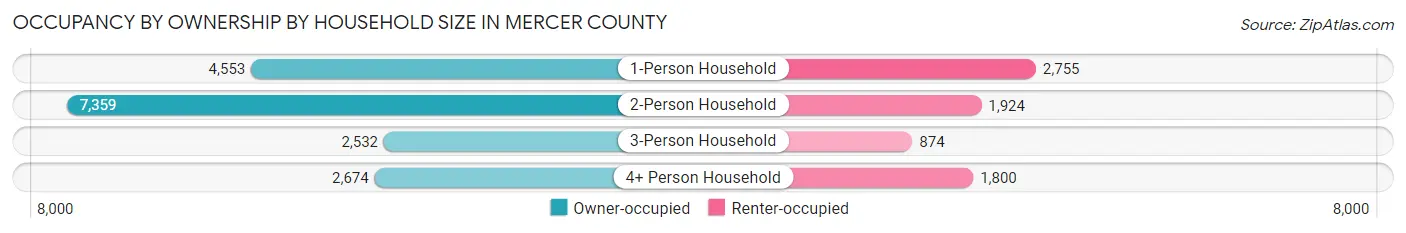
| Household Size | Owner-occupied | Renter-occupied |
| 1-Person Household | 4,553 (62.3%) | 2,755 (37.7%) |
| 2-Person Household | 7,359 (79.3%) | 1,924 (20.7%) |
| 3-Person Household | 2,532 (74.3%) | 874 (25.7%) |
| 4+ Person Household | 2,674 (59.8%) | 1,800 (40.2%) |
| Total Housing Units | 17,118 (70.0%) | 7,353 (30.0%) |
Occupancy by Educational Attainment in Mercer County
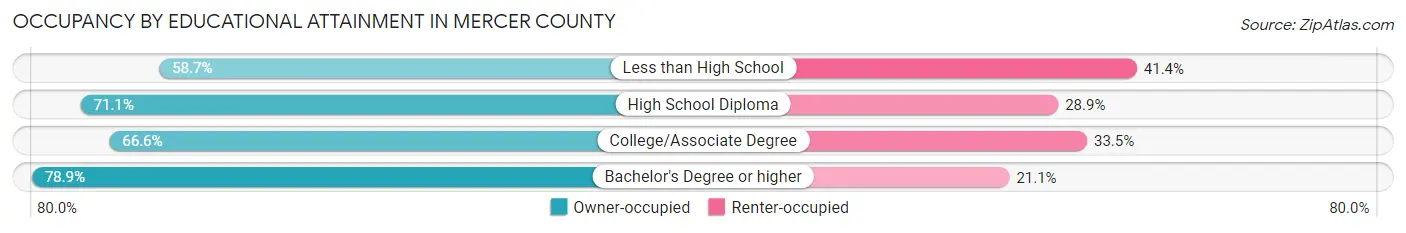
| Household Size | Owner-occupied | Renter-occupied |
| Less than High School | 1,827 (58.7%) | 1,288 (41.3%) |
| High School Diploma | 6,626 (71.1%) | 2,690 (28.9%) |
| College/Associate Degree | 4,487 (66.5%) | 2,255 (33.5%) |
| Bachelor's Degree or higher | 4,178 (78.9%) | 1,120 (21.1%) |
Occupancy by Age of Householder in Mercer County
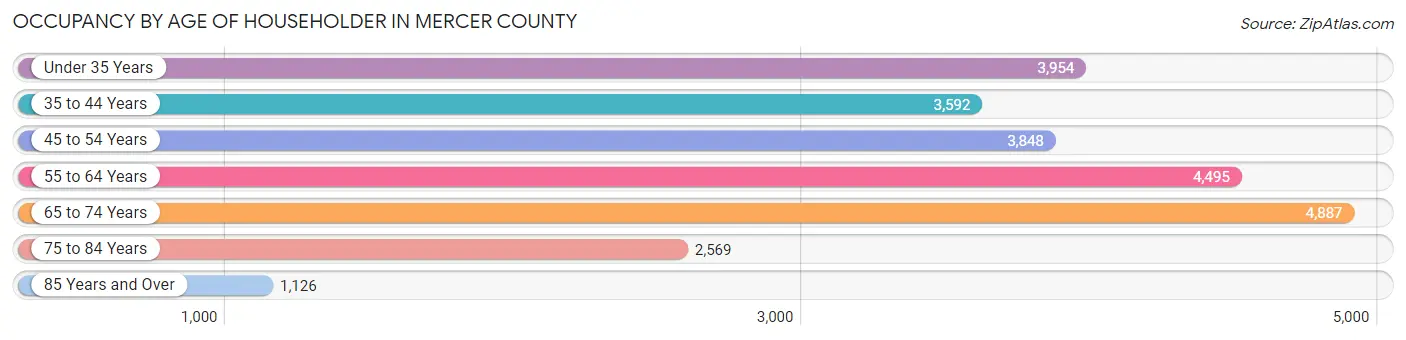
| Age Bracket | # Households | % Households |
| Under 35 Years | 3,954 | 16.2% |
| 35 to 44 Years | 3,592 | 14.7% |
| 45 to 54 Years | 3,848 | 15.7% |
| 55 to 64 Years | 4,495 | 18.4% |
| 65 to 74 Years | 4,887 | 20.0% |
| 75 to 84 Years | 2,569 | 10.5% |
| 85 Years and Over | 1,126 | 4.6% |
| Total | 24,471 | 100.0% |
Housing Finances in Mercer County
Median Income by Occupancy in Mercer County
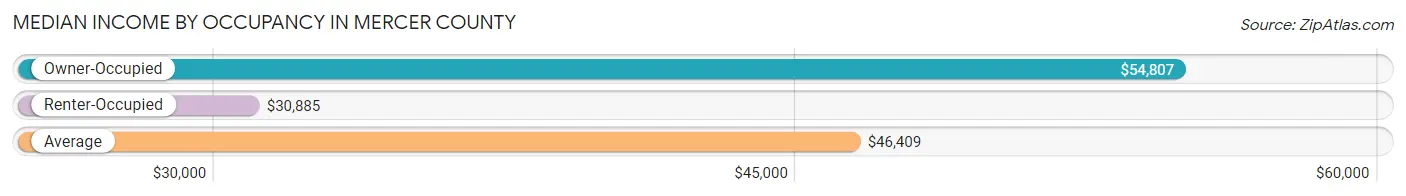
| Occupancy Type | # Households | Median Income |
| Owner-Occupied | 17,118 (70.0%) | $54,807 |
| Renter-Occupied | 7,353 (30.0%) | $30,885 |
| Average | 24,471 (100.0%) | $46,409 |
Occupancy by Householder Income Bracket in Mercer County
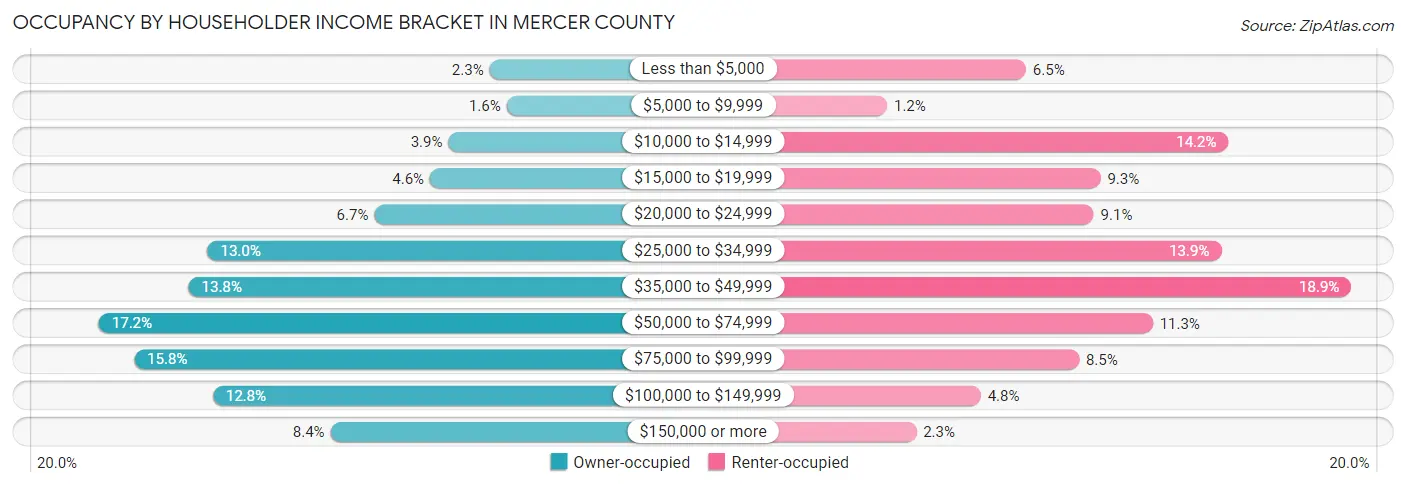
| Income Bracket | Owner-occupied | Renter-occupied |
| Less than $5,000 | 392 (2.3%) | 477 (6.5%) |
| $5,000 to $9,999 | 281 (1.6%) | 88 (1.2%) |
| $10,000 to $14,999 | 661 (3.9%) | 1,044 (14.2%) |
| $15,000 to $19,999 | 780 (4.6%) | 686 (9.3%) |
| $20,000 to $24,999 | 1,144 (6.7%) | 667 (9.1%) |
| $25,000 to $34,999 | 2,231 (13.0%) | 1,024 (13.9%) |
| $35,000 to $49,999 | 2,353 (13.8%) | 1,388 (18.9%) |
| $50,000 to $74,999 | 2,939 (17.2%) | 832 (11.3%) |
| $75,000 to $99,999 | 2,710 (15.8%) | 626 (8.5%) |
| $100,000 to $149,999 | 2,197 (12.8%) | 351 (4.8%) |
| $150,000 or more | 1,430 (8.4%) | 170 (2.3%) |
| Total | 17,118 (100.0%) | 7,353 (100.0%) |
Monthly Housing Cost Tiers in Mercer County
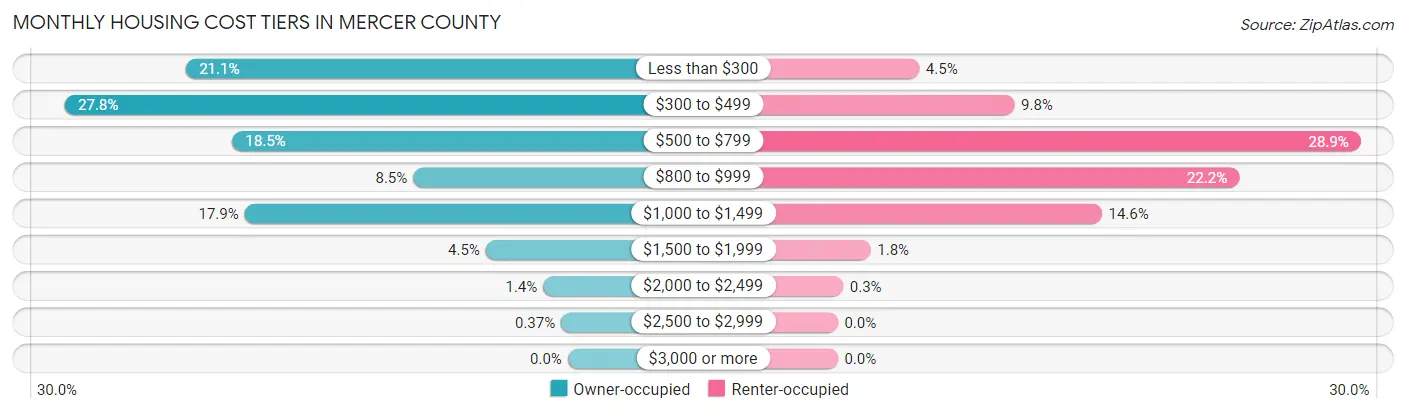
| Monthly Cost | Owner-occupied | Renter-occupied |
| Less than $300 | 3,607 (21.1%) | 331 (4.5%) |
| $300 to $499 | 4,752 (27.8%) | 718 (9.8%) |
| $500 to $799 | 3,170 (18.5%) | 2,125 (28.9%) |
| $800 to $999 | 1,462 (8.5%) | 1,631 (22.2%) |
| $1,000 to $1,499 | 3,055 (17.8%) | 1,073 (14.6%) |
| $1,500 to $1,999 | 775 (4.5%) | 134 (1.8%) |
| $2,000 to $2,499 | 233 (1.4%) | 22 (0.3%) |
| $2,500 to $2,999 | 64 (0.4%) | 0 (0.0%) |
| $3,000 or more | 0 (0.0%) | 0 (0.0%) |
| Total | 17,118 (100.0%) | 7,353 (100.0%) |
Physical Housing Characteristics in Mercer County
Housing Structures in Mercer County
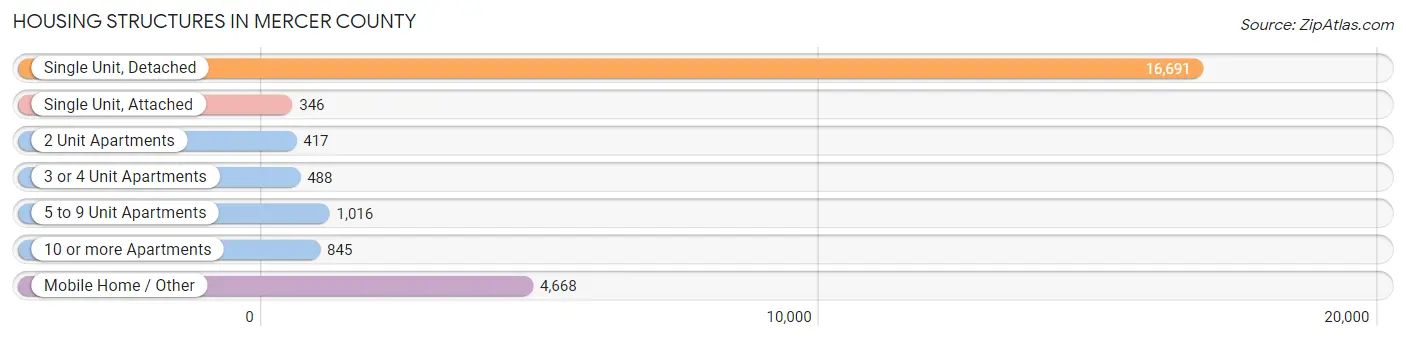
| Structure Type | # Housing Units | % Housing Units |
| Single Unit, Detached | 16,691 | 68.2% |
| Single Unit, Attached | 346 | 1.4% |
| 2 Unit Apartments | 417 | 1.7% |
| 3 or 4 Unit Apartments | 488 | 2.0% |
| 5 to 9 Unit Apartments | 1,016 | 4.2% |
| 10 or more Apartments | 845 | 3.5% |
| Mobile Home / Other | 4,668 | 19.1% |
| Total | 24,471 | 100.0% |
Housing Structures by Occupancy in Mercer County
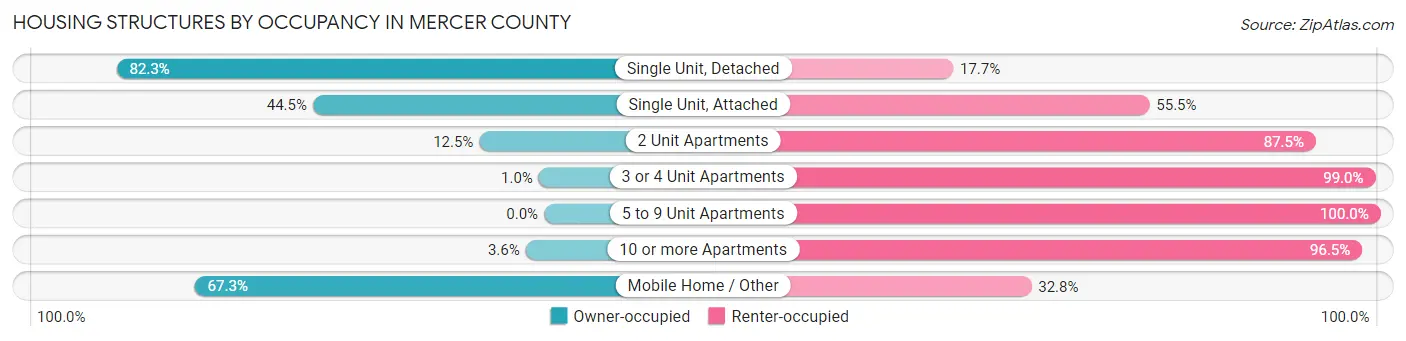
| Structure Type | Owner-occupied | Renter-occupied |
| Single Unit, Detached | 13,738 (82.3%) | 2,953 (17.7%) |
| Single Unit, Attached | 154 (44.5%) | 192 (55.5%) |
| 2 Unit Apartments | 52 (12.5%) | 365 (87.5%) |
| 3 or 4 Unit Apartments | 5 (1.0%) | 483 (99.0%) |
| 5 to 9 Unit Apartments | 0 (0.0%) | 1,016 (100.0%) |
| 10 or more Apartments | 30 (3.5%) | 815 (96.5%) |
| Mobile Home / Other | 3,139 (67.2%) | 1,529 (32.8%) |
| Total | 17,118 (70.0%) | 7,353 (30.0%) |
Housing Structures by Number of Rooms in Mercer County
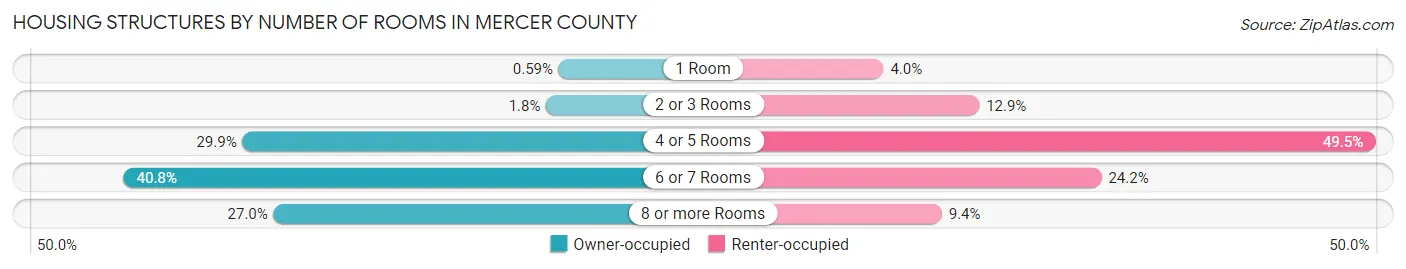
| Number of Rooms | Owner-occupied | Renter-occupied |
| 1 Room | 101 (0.6%) | 296 (4.0%) |
| 2 or 3 Rooms | 300 (1.8%) | 947 (12.9%) |
| 4 or 5 Rooms | 5,109 (29.8%) | 3,638 (49.5%) |
| 6 or 7 Rooms | 6,991 (40.8%) | 1,779 (24.2%) |
| 8 or more Rooms | 4,617 (27.0%) | 693 (9.4%) |
| Total | 17,118 (100.0%) | 7,353 (100.0%) |
Housing Structure by Heating Type in Mercer County
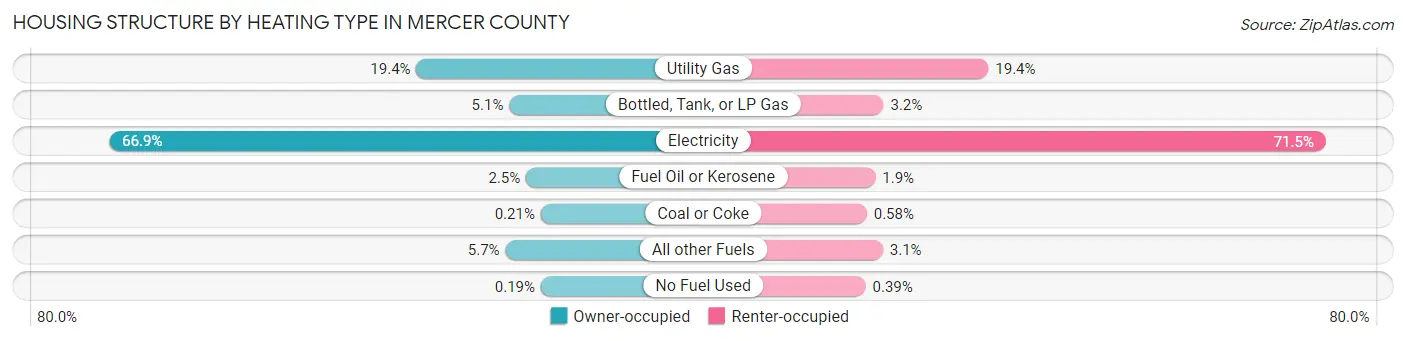
| Heating Type | Owner-occupied | Renter-occupied |
| Utility Gas | 3,326 (19.4%) | 1,424 (19.4%) |
| Bottled, Tank, or LP Gas | 870 (5.1%) | 233 (3.2%) |
| Electricity | 11,459 (66.9%) | 5,259 (71.5%) |
| Fuel Oil or Kerosene | 423 (2.5%) | 140 (1.9%) |
| Coal or Coke | 36 (0.2%) | 43 (0.6%) |
| All other Fuels | 971 (5.7%) | 225 (3.1%) |
| No Fuel Used | 33 (0.2%) | 29 (0.4%) |
| Total | 17,118 (100.0%) | 7,353 (100.0%) |
Household Vehicle Usage in Mercer County
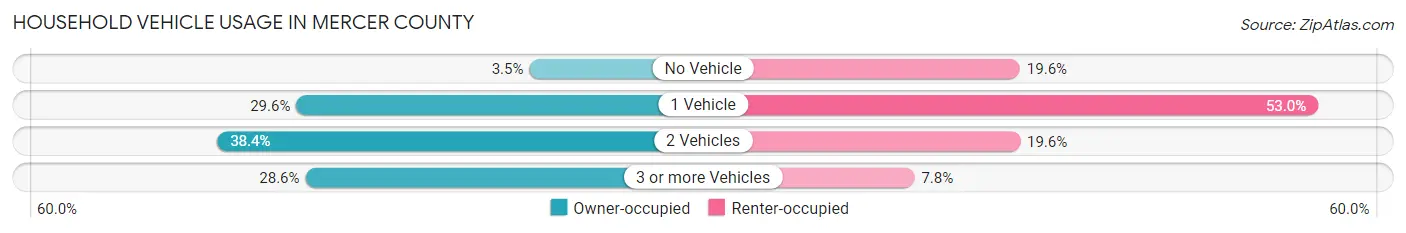
| Vehicles per Household | Owner-occupied | Renter-occupied |
| No Vehicle | 593 (3.5%) | 1,441 (19.6%) |
| 1 Vehicle | 5,061 (29.6%) | 3,896 (53.0%) |
| 2 Vehicles | 6,577 (38.4%) | 1,443 (19.6%) |
| 3 or more Vehicles | 4,887 (28.5%) | 573 (7.8%) |
| Total | 17,118 (100.0%) | 7,353 (100.0%) |
Real Estate & Mortgages in Mercer County
Real Estate and Mortgage Overview in Mercer County
| Characteristic | Without Mortgage | With Mortgage |
| Housing Units | 10,366 | 6,752 |
| Median Property Value | $95,300 | $147,200 |
| Median Household Income | $49,080 | $955 |
| Monthly Housing Costs | $365 | $0 |
| Real Estate Taxes | $472 | $318 |
Property Value by Mortgage Status in Mercer County
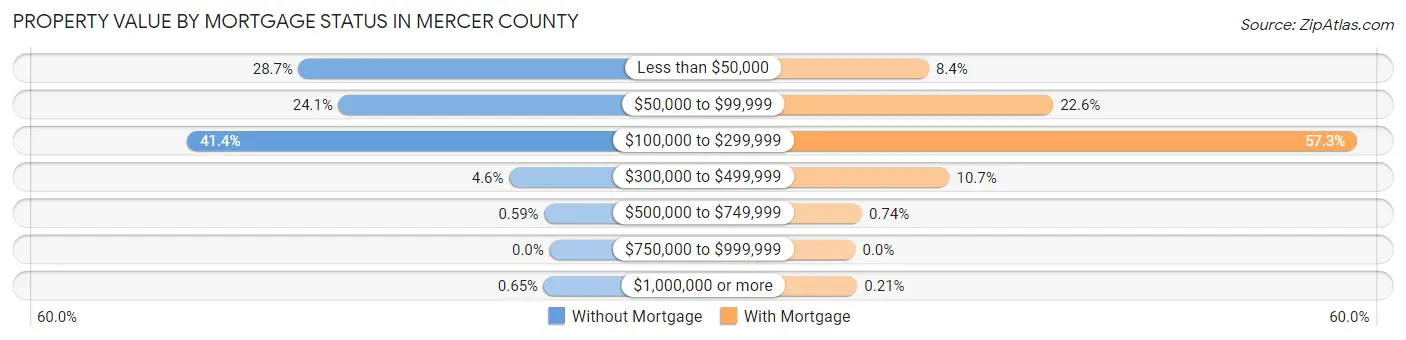
| Property Value | Without Mortgage | With Mortgage |
| Less than $50,000 | 2,971 (28.7%) | 567 (8.4%) |
| $50,000 to $99,999 | 2,497 (24.1%) | 1,525 (22.6%) |
| $100,000 to $299,999 | 4,293 (41.4%) | 3,871 (57.3%) |
| $300,000 to $499,999 | 477 (4.6%) | 725 (10.7%) |
| $500,000 to $749,999 | 61 (0.6%) | 50 (0.7%) |
| $750,000 to $999,999 | 0 (0.0%) | 0 (0.0%) |
| $1,000,000 or more | 67 (0.6%) | 14 (0.2%) |
| Total | 10,366 (100.0%) | 6,752 (100.0%) |
Household Income by Mortgage Status in Mercer County
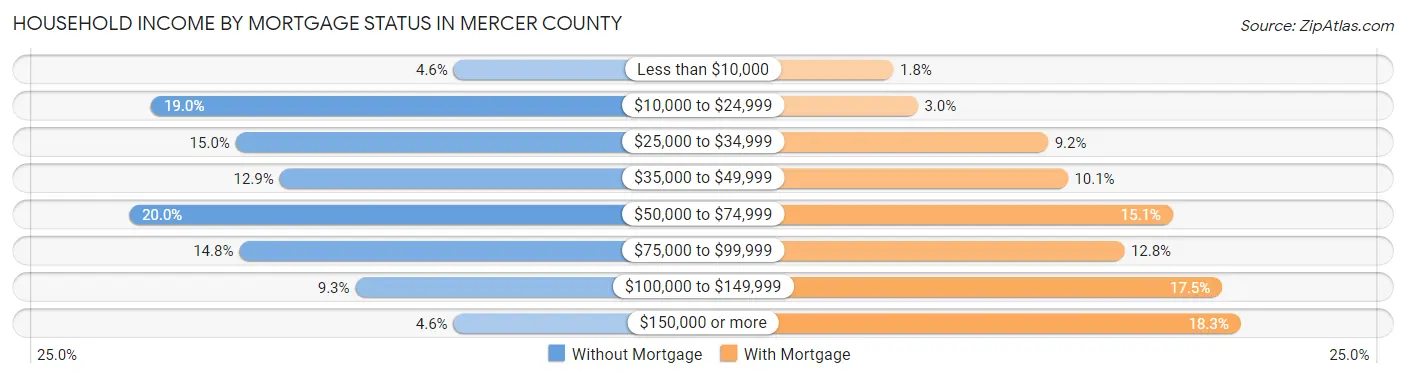
| Household Income | Without Mortgage | With Mortgage |
| Less than $10,000 | 474 (4.6%) | 121 (1.8%) |
| $10,000 to $24,999 | 1,967 (19.0%) | 199 (2.9%) |
| $25,000 to $34,999 | 1,550 (14.9%) | 618 (9.1%) |
| $35,000 to $49,999 | 1,333 (12.9%) | 681 (10.1%) |
| $50,000 to $74,999 | 2,076 (20.0%) | 1,020 (15.1%) |
| $75,000 to $99,999 | 1,532 (14.8%) | 863 (12.8%) |
| $100,000 to $149,999 | 959 (9.2%) | 1,178 (17.4%) |
| $150,000 or more | 475 (4.6%) | 1,238 (18.3%) |
| Total | 10,366 (100.0%) | 6,752 (100.0%) |
Property Value to Household Income Ratio in Mercer County
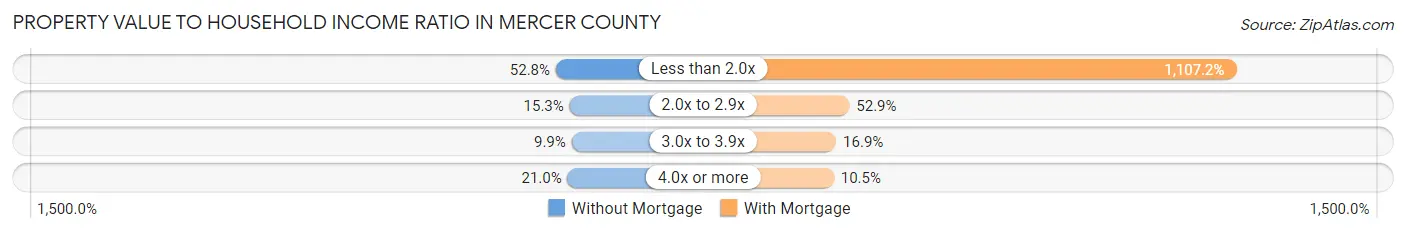
| Value-to-Income Ratio | Without Mortgage | With Mortgage |
| Less than 2.0x | 5,475 (52.8%) | 74,755 (1,107.2%) |
| 2.0x to 2.9x | 1,589 (15.3%) | 3,572 (52.9%) |
| 3.0x to 3.9x | 1,022 (9.9%) | 1,143 (16.9%) |
| 4.0x or more | 2,173 (21.0%) | 709 (10.5%) |
| Total | 10,366 (100.0%) | 6,752 (100.0%) |
Real Estate Taxes by Mortgage Status in Mercer County
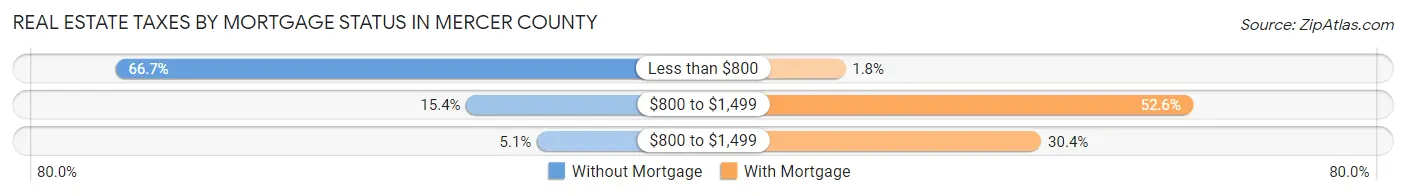
| Property Taxes | Without Mortgage | With Mortgage |
| Less than $800 | 6,916 (66.7%) | 121 (1.8%) |
| $800 to $1,499 | 1,601 (15.4%) | 3,549 (52.6%) |
| $800 to $1,499 | 529 (5.1%) | 2,053 (30.4%) |
| Total | 10,366 (100.0%) | 6,752 (100.0%) |
Health & Disability in Mercer County
Health Insurance Coverage by Age in Mercer County
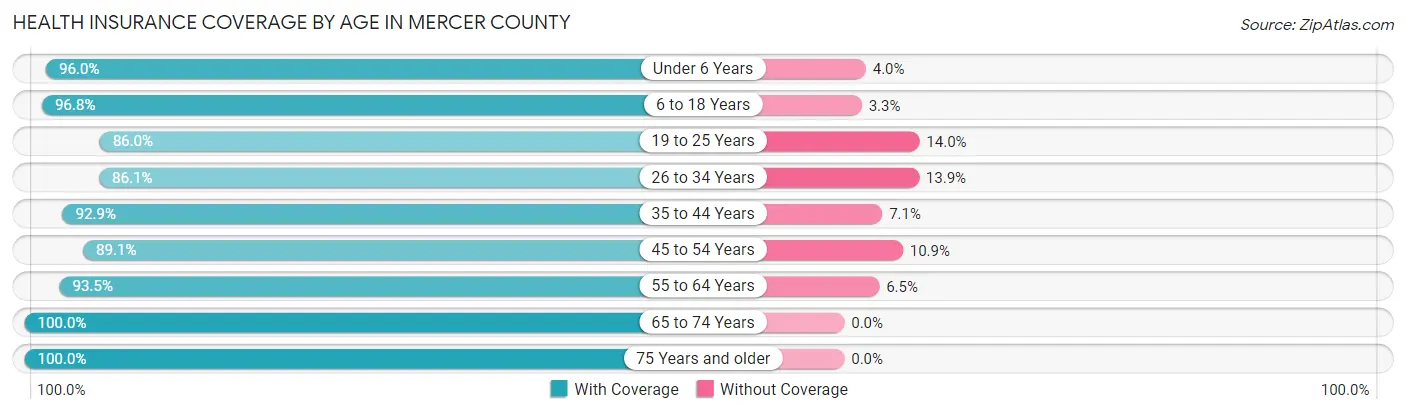
| Age Bracket | With Coverage | Without Coverage |
| Under 6 Years | 3,515 (96.0%) | 147 (4.0%) |
| 6 to 18 Years | 9,070 (96.8%) | 305 (3.3%) |
| 19 to 25 Years | 4,058 (86.0%) | 661 (14.0%) |
| 26 to 34 Years | 5,552 (86.1%) | 897 (13.9%) |
| 35 to 44 Years | 6,179 (92.9%) | 471 (7.1%) |
| 45 to 54 Years | 6,587 (89.1%) | 807 (10.9%) |
| 55 to 64 Years | 7,350 (93.5%) | 512 (6.5%) |
| 65 to 74 Years | 7,743 (100.0%) | 0 (0.0%) |
| 75 Years and older | 5,182 (100.0%) | 0 (0.0%) |
| Total | 55,236 (93.6%) | 3,800 (6.4%) |
Health Insurance Coverage by Citizenship Status in Mercer County
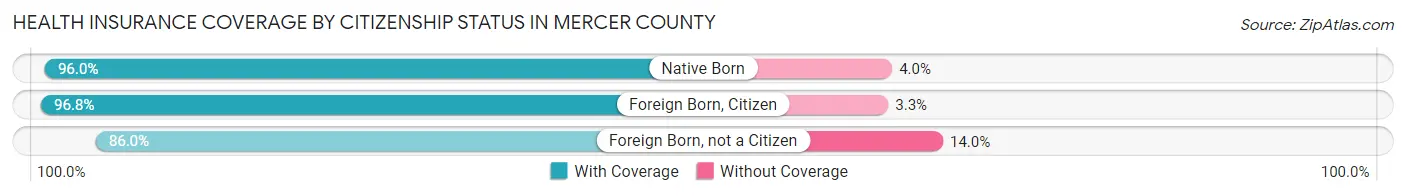
| Citizenship Status | With Coverage | Without Coverage |
| Native Born | 3,515 (96.0%) | 147 (4.0%) |
| Foreign Born, Citizen | 9,070 (96.8%) | 305 (3.3%) |
| Foreign Born, not a Citizen | 4,058 (86.0%) | 661 (14.0%) |
Health Insurance Coverage by Household Income in Mercer County
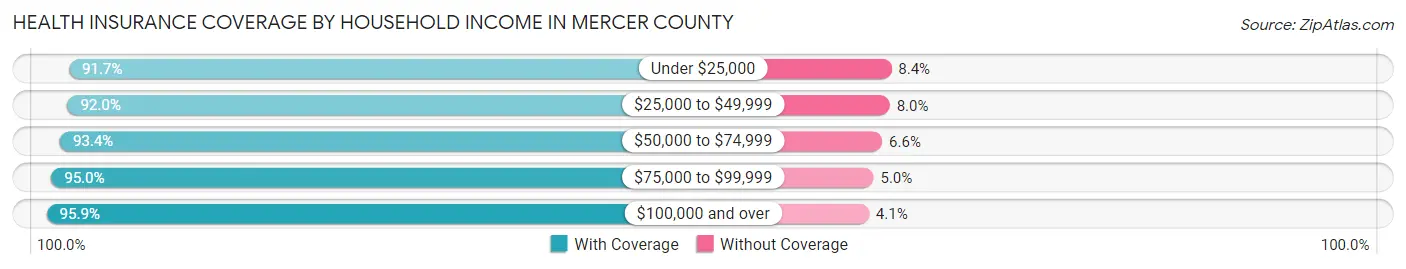
| Household Income | With Coverage | Without Coverage |
| Under $25,000 | 9,775 (91.6%) | 890 (8.4%) |
| $25,000 to $49,999 | 13,524 (92.0%) | 1,183 (8.0%) |
| $50,000 to $74,999 | 9,742 (93.4%) | 692 (6.6%) |
| $75,000 to $99,999 | 8,804 (95.0%) | 464 (5.0%) |
| $100,000 and over | 12,551 (95.9%) | 542 (4.1%) |
Public vs Private Health Insurance Coverage by Age in Mercer County
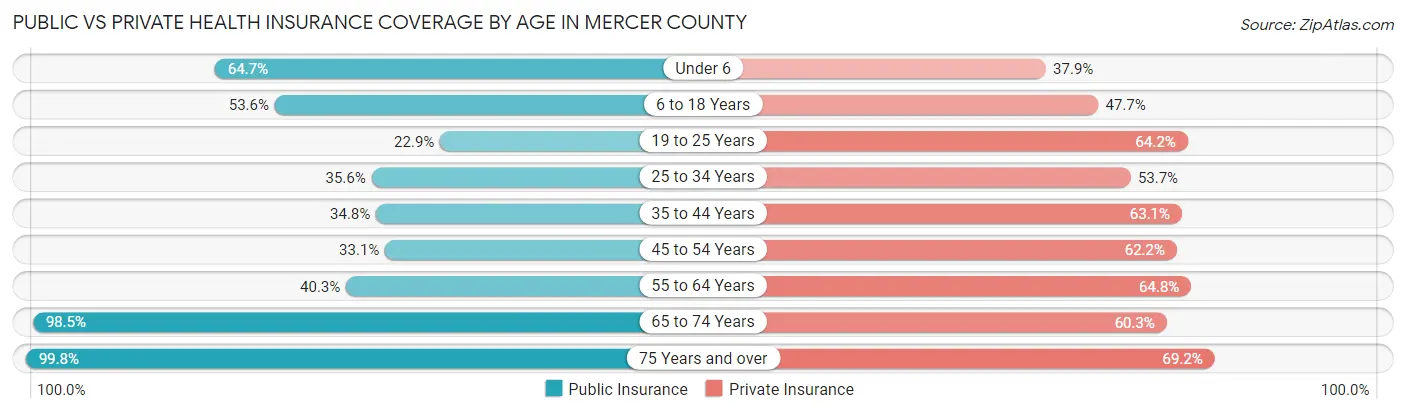
| Age Bracket | Public Insurance | Private Insurance |
| Under 6 | 2,369 (64.7%) | 1,389 (37.9%) |
| 6 to 18 Years | 5,021 (53.6%) | 4,468 (47.7%) |
| 19 to 25 Years | 1,079 (22.9%) | 3,029 (64.2%) |
| 25 to 34 Years | 2,296 (35.6%) | 3,461 (53.7%) |
| 35 to 44 Years | 2,311 (34.7%) | 4,197 (63.1%) |
| 45 to 54 Years | 2,445 (33.1%) | 4,597 (62.2%) |
| 55 to 64 Years | 3,170 (40.3%) | 5,098 (64.8%) |
| 65 to 74 Years | 7,626 (98.5%) | 4,669 (60.3%) |
| 75 Years and over | 5,171 (99.8%) | 3,586 (69.2%) |
| Total | 31,488 (53.3%) | 34,494 (58.4%) |
Disability Status by Sex by Age in Mercer County
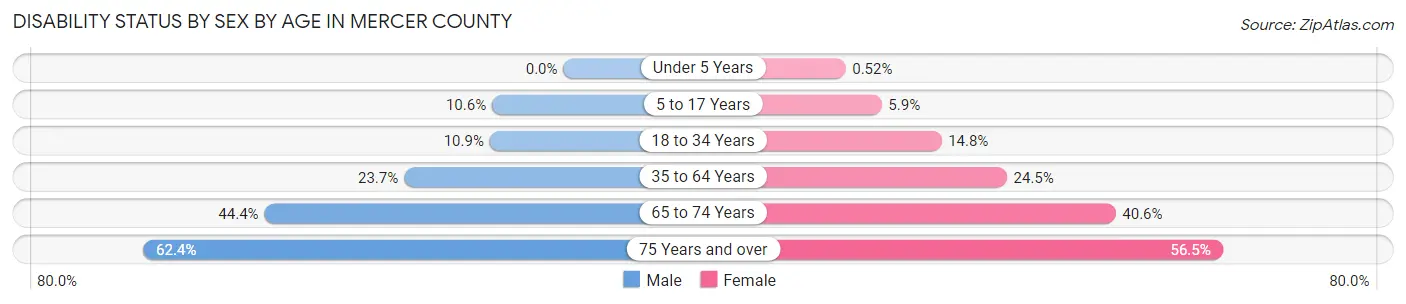
| Age Bracket | Male | Female |
| Under 5 Years | 0 (0.0%) | 8 (0.5%) |
| 5 to 17 Years | 494 (10.6%) | 261 (5.9%) |
| 18 to 34 Years | 666 (10.9%) | 863 (14.8%) |
| 35 to 64 Years | 2,458 (23.6%) | 2,817 (24.5%) |
| 65 to 74 Years | 1,589 (44.4%) | 1,691 (40.6%) |
| 75 Years and over | 1,379 (62.4%) | 1,680 (56.5%) |
Disability Class by Sex by Age in Mercer County
Disability Class: Hearing Difficulty
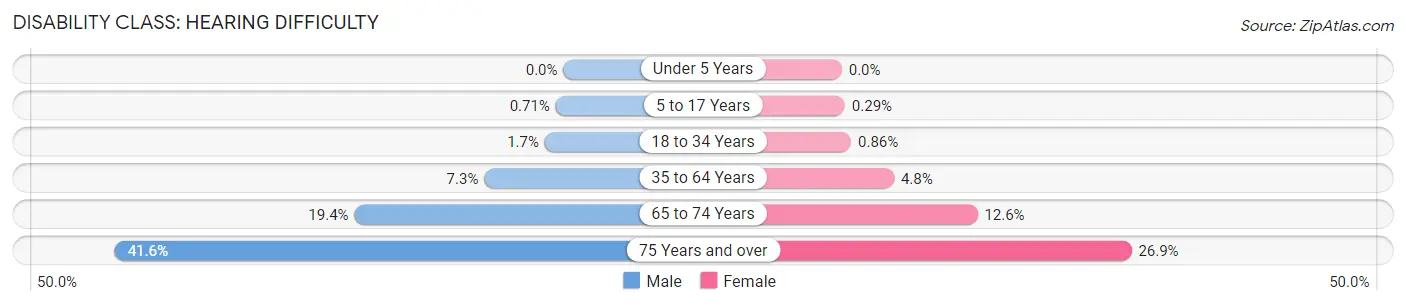
| Age Bracket | Male | Female |
| Under 5 Years | 0 (0.0%) | 0 (0.0%) |
| 5 to 17 Years | 33 (0.7%) | 13 (0.3%) |
| 18 to 34 Years | 105 (1.7%) | 50 (0.9%) |
| 35 to 64 Years | 763 (7.3%) | 557 (4.8%) |
| 65 to 74 Years | 694 (19.4%) | 524 (12.6%) |
| 75 Years and over | 920 (41.6%) | 799 (26.9%) |
Disability Class: Vision Difficulty
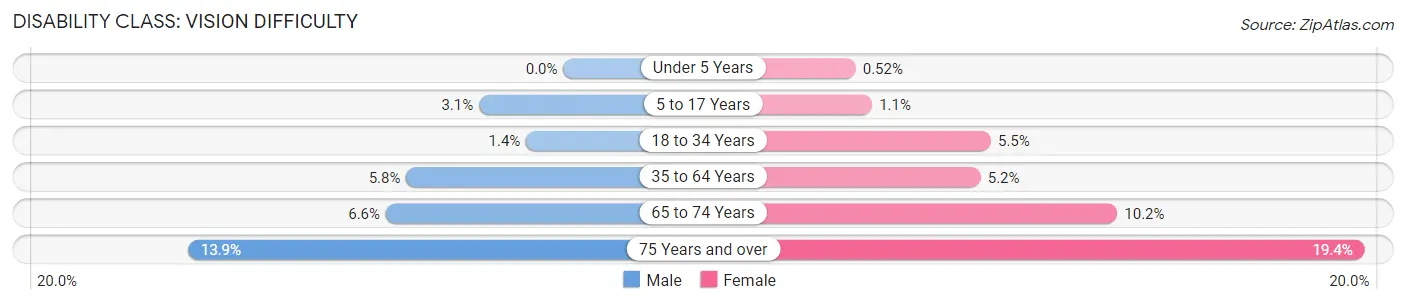
| Age Bracket | Male | Female |
| Under 5 Years | 0 (0.0%) | 8 (0.5%) |
| 5 to 17 Years | 146 (3.1%) | 50 (1.1%) |
| 18 to 34 Years | 84 (1.4%) | 324 (5.5%) |
| 35 to 64 Years | 606 (5.8%) | 594 (5.2%) |
| 65 to 74 Years | 236 (6.6%) | 426 (10.2%) |
| 75 Years and over | 308 (13.9%) | 577 (19.4%) |
Disability Class: Cognitive Difficulty
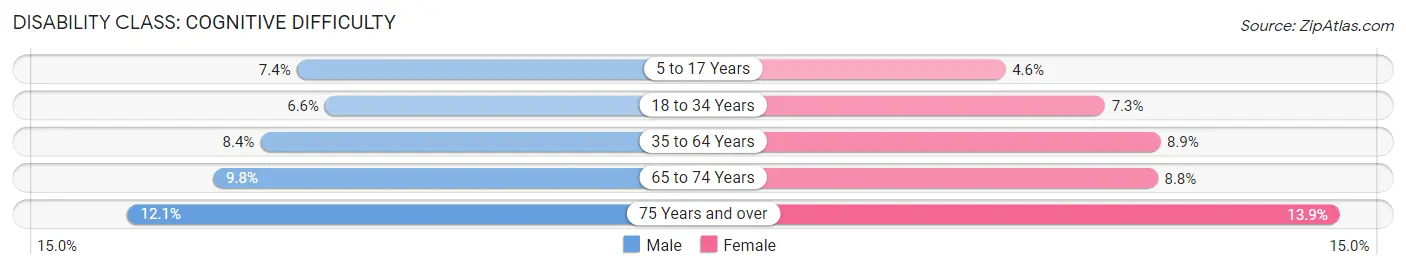
| Age Bracket | Male | Female |
| 5 to 17 Years | 346 (7.4%) | 202 (4.5%) |
| 18 to 34 Years | 405 (6.6%) | 428 (7.3%) |
| 35 to 64 Years | 877 (8.4%) | 1,020 (8.9%) |
| 65 to 74 Years | 349 (9.8%) | 366 (8.8%) |
| 75 Years and over | 268 (12.1%) | 412 (13.9%) |
Disability Class: Ambulatory Difficulty
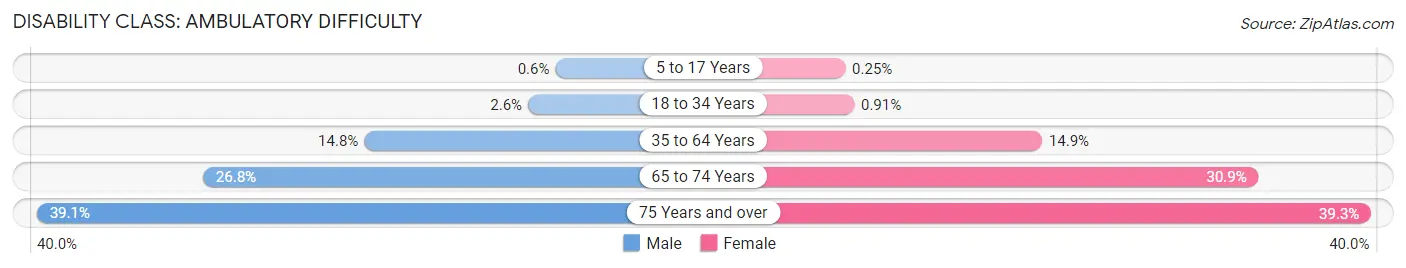
| Age Bracket | Male | Female |
| 5 to 17 Years | 28 (0.6%) | 11 (0.3%) |
| 18 to 34 Years | 160 (2.6%) | 53 (0.9%) |
| 35 to 64 Years | 1,537 (14.8%) | 1,711 (14.9%) |
| 65 to 74 Years | 958 (26.8%) | 1,288 (30.9%) |
| 75 Years and over | 864 (39.1%) | 1,168 (39.3%) |
Disability Class: Self-Care Difficulty
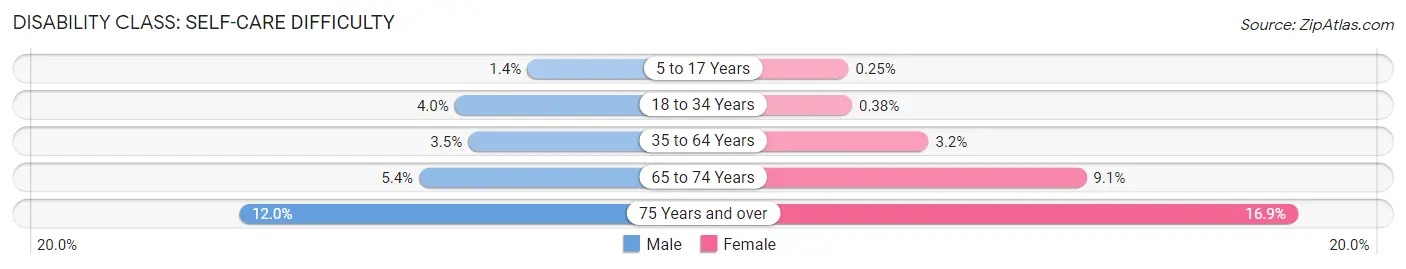
| Age Bracket | Male | Female |
| 5 to 17 Years | 63 (1.3%) | 11 (0.3%) |
| 18 to 34 Years | 246 (4.0%) | 22 (0.4%) |
| 35 to 64 Years | 368 (3.5%) | 371 (3.2%) |
| 65 to 74 Years | 192 (5.4%) | 378 (9.1%) |
| 75 Years and over | 266 (12.0%) | 503 (16.9%) |
Technology Access in Mercer County
Computing Device Access in Mercer County
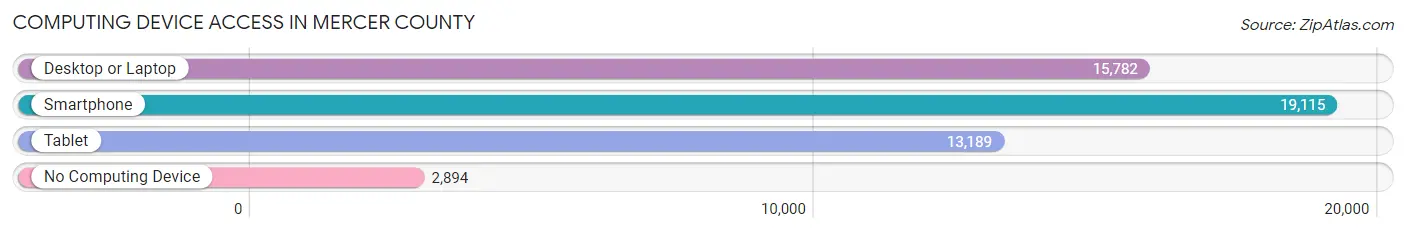
| Device Type | # Households | % Households |
| Desktop or Laptop | 15,782 | 64.5% |
| Smartphone | 19,115 | 78.1% |
| Tablet | 13,189 | 53.9% |
| No Computing Device | 2,894 | 11.8% |
| Total | 24,471 | 100.0% |
Internet Access in Mercer County
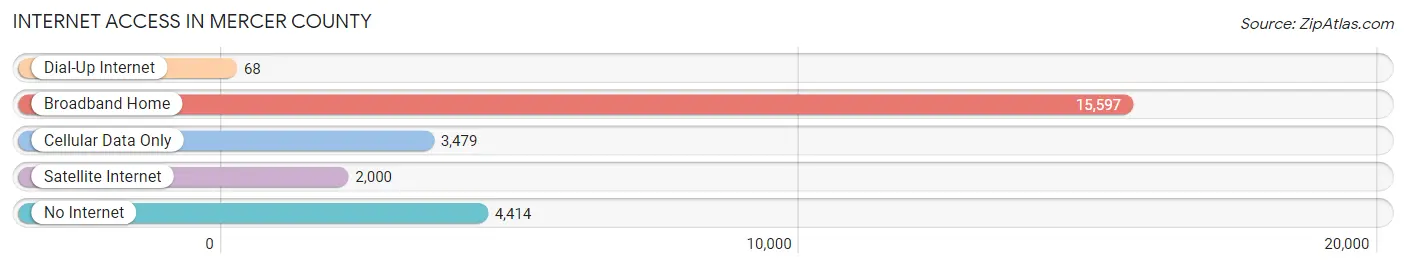
| Internet Type | # Households | % Households |
| Dial-Up Internet | 68 | 0.3% |
| Broadband Home | 15,597 | 63.7% |
| Cellular Data Only | 3,479 | 14.2% |
| Satellite Internet | 2,000 | 8.2% |
| No Internet | 4,414 | 18.0% |
| Total | 24,471 | 100.0% |
Mercer County Summary
Mercer County, West Virginia is located in the southern part of the state and is part of the Bluefield, WV-VA Metropolitan Statistical Area. The county was formed in 1837 from parts of Giles, Tazewell, and Monroe counties in Virginia. The county seat is Princeton, and the county is named for General Hugh Mercer, a Revolutionary War hero. As of the 2010 census, the population of Mercer County was 62,264.
Geography
Mercer County is located in the Appalachian Mountains of southern West Virginia. It is bordered by Summers County to the north, Monroe County to the east, Giles County, Virginia to the south, and Tazewell County, Virginia to the west. The county is divided into two distinct regions by the Bluestone River, which runs through the county from north to south. The western region is hilly and mountainous, while the eastern region is more level and rolling. The highest point in the county is located in the western region, at an elevation of 3,890 feet.
The county is home to several state parks, including Bluestone State Park, Pipestem Resort State Park, and Twin Falls Resort State Park. The Bluestone National Scenic River, a federally protected river, runs through the county.
Economy
The economy of Mercer County is largely based on coal mining and related industries. The county is home to several coal mines, including the Bluestone Mine, the largest underground coal mine in the state. Other industries in the county include manufacturing, health care, and tourism.
The county is also home to several colleges and universities, including Concord University, Bluefield State College, and New River Community and Technical College.
Demographics
As of the 2010 census, the population of Mercer County was 62,264. The racial makeup of the county was 92.3% White, 4.7% African American, 0.3% Native American, 0.5% Asian, 0.1% Pacific Islander, 0.7% from other races, and 1.4% from two or more races. Hispanic or Latino of any race were 1.7% of the population.
The median income for a household in the county was $35,945, and the median income for a family was $43,945. The per capita income for the county was $19,845. About 15.2% of families and 19.2% of the population were below the poverty line, including 28.2% of those under age 18 and 11.2% of those age 65 or over.
Mercer County is served by the Mercer County Board of Education, which operates seven public schools. The county is also home to several private schools, including Princeton Christian Academy and Bluefield Christian Academy.
Common Questions
What is the Total Population of Mercer County?
Total Population of Mercer County is 59,530.
What is the Total Male Population of Mercer County?
Total Male Population of Mercer County is 28,719.
What is the Total Female Population of Mercer County?
Total Female Population of Mercer County is 30,811.
What is the Ratio of Males per 100 Females in Mercer County?
There are 93.21 Males per 100 Females in Mercer County.
What is the Ratio of Females per 100 Males in Mercer County?
There are 107.28 Females per 100 Males in Mercer County.
What is the Median Population Age in Mercer County?
Median Population Age in Mercer County is 43.3 Years.
What is the Average Family Size in Mercer County
Average Family Size in Mercer County is 2.9 People.
What is the Average Household Size in Mercer County
Average Household Size in Mercer County is 2.4 People.
What is Per Capita Income in Mercer County?
Per Capita income in Mercer County is $27,245.
What is the Median Family Income in Mercer County?
Median Family Income in Mercer County is $63,142.
What is the Median Household income in Mercer County?
Median Household Income in Mercer County is $46,409.
What is Income or Wage Gap in Mercer County?
Income or Wage Gap in Mercer County is 32.2%.
Women in Mercer County earn 67.8 cents for every dollar earned by a man.
What is Family Income Deficit in Mercer County?
Family Income Deficit in Mercer County is $8,770.
Families that are below poverty line in Mercer County earn $8,770 less on average than the poverty threshold level.
What is Inequality or Gini Index in Mercer County?
Inequality or Gini Index in Mercer County is 0.46.
How Large is the Labor Force in Mercer County?
There are 24,147 People in the Labor Forcein in Mercer County.
What is the Percentage of People in the Labor Force in Mercer County?
49.7% of People are in the Labor Force in Mercer County.
What is the Unemployment Rate in Mercer County?
Unemployment Rate in Mercer County is 4.2%.