Mason County, WV
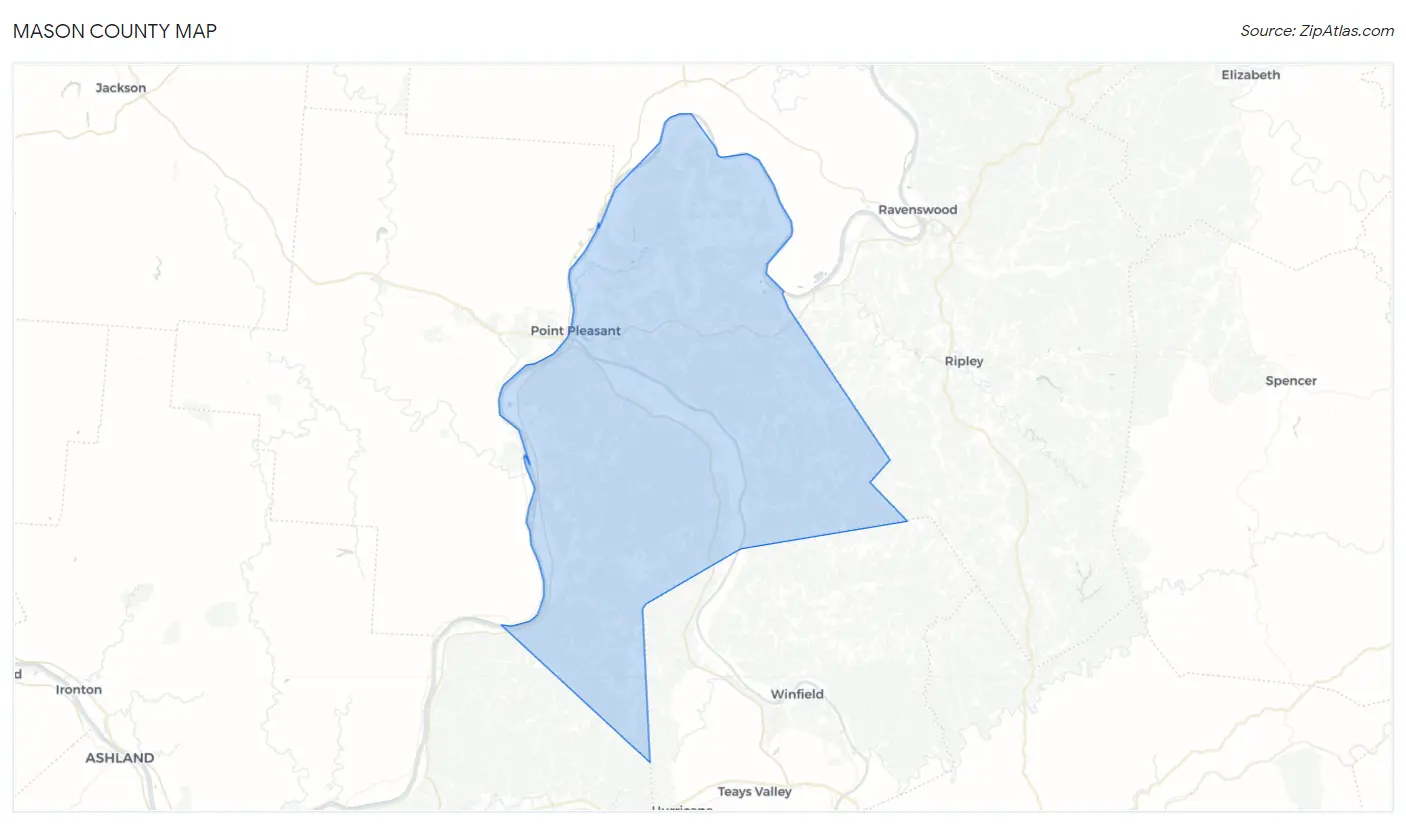
Mason County Map
Mason County Overview
25,488
TOTAL POPULATION
12,579
MALE POPULATION
12,909
FEMALE POPULATION
97.44
MALES / 100 FEMALES
102.62
FEMALES / 100 MALES
44.2
MEDIAN AGE
3.1
AVG FAMILY SIZE
2.4
AVG HOUSEHOLD SIZE
$31,085
PER CAPITA INCOME
$70,809
AVG FAMILY INCOME
$53,058
AVG HOUSEHOLD INCOME
50.4%
WAGE / INCOME GAP [ % ]
49.6¢/ $1
WAGE / INCOME GAP [ $ ]
0.49
INEQUALITY / GINI INDEX
9,729
LABOR FORCE [ PEOPLE ]
46.6%
PERCENT IN LABOR FORCE
2.9%
UNEMPLOYMENT RATE
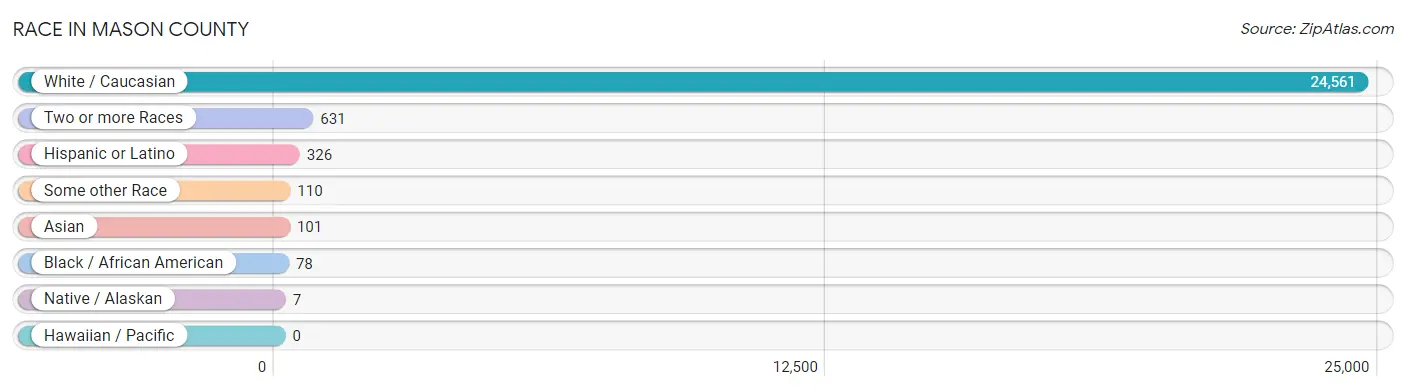
Race in Mason County
The most populous races in Mason County are White / Caucasian (24,561 | 96.4%), Two or more Races (631 | 2.5%), and Hispanic or Latino (326 | 1.3%).
| Race | # Population | % Population |
| Asian | 101 | 0.4% |
| Black / African American | 78 | 0.3% |
| Hawaiian / Pacific | 0 | 0.0% |
| Hispanic or Latino | 326 | 1.3% |
| Native / Alaskan | 7 | 0.0% |
| White / Caucasian | 24,561 | 96.4% |
| Two or more Races | 631 | 2.5% |
| Some other Race | 110 | 0.4% |
| Total | 25,488 | 100.0% |
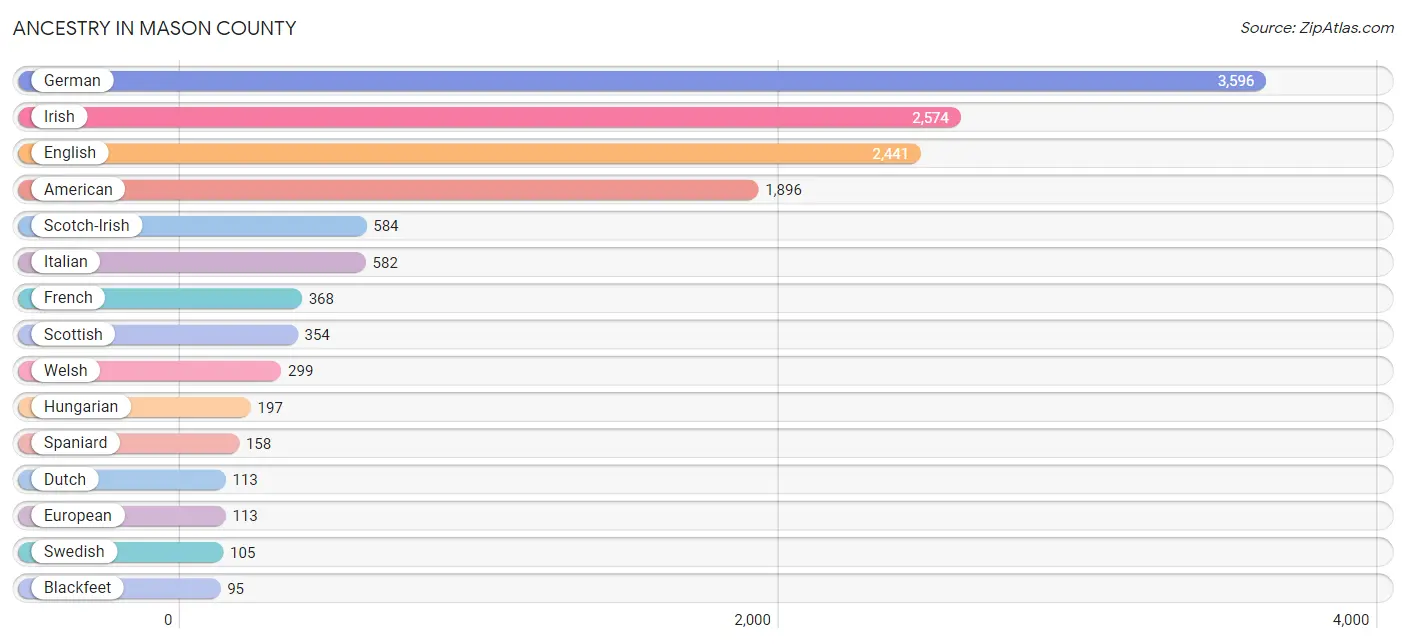
Ancestry in Mason County
The most populous ancestries reported in Mason County are German (3,596 | 14.1%), Irish (2,574 | 10.1%), English (2,441 | 9.6%), American (1,896 | 7.4%), and Scotch-Irish (584 | 2.3%), together accounting for 43.5% of all Mason County residents.
| Ancestry | # Population | % Population |
| American | 1,896 | 7.4% |
| Arab | 16 | 0.1% |
| Blackfeet | 95 | 0.4% |
| British | 34 | 0.1% |
| Burmese | 15 | 0.1% |
| Central American | 11 | 0.0% |
| Cherokee | 32 | 0.1% |
| Croatian | 25 | 0.1% |
| Cuban | 81 | 0.3% |
| Czech | 1 | 0.0% |
| Danish | 8 | 0.0% |
| Delaware | 14 | 0.1% |
| Dutch | 113 | 0.4% |
| Eastern European | 21 | 0.1% |
| English | 2,441 | 9.6% |
| European | 113 | 0.4% |
| Finnish | 19 | 0.1% |
| French | 368 | 1.4% |
| French Canadian | 75 | 0.3% |
| German | 3,596 | 14.1% |
| Guatemalan | 11 | 0.0% |
| Hungarian | 197 | 0.8% |
| Indian (Asian) | 16 | 0.1% |
| Irish | 2,574 | 10.1% |
| Italian | 582 | 2.3% |
| Jamaican | 1 | 0.0% |
| Korean | 43 | 0.2% |
| Lebanese | 16 | 0.1% |
| Mexican | 24 | 0.1% |
| Norwegian | 20 | 0.1% |
| Pennsylvania German | 54 | 0.2% |
| Polish | 27 | 0.1% |
| Portuguese | 85 | 0.3% |
| Pueblo | 17 | 0.1% |
| Puerto Rican | 22 | 0.1% |
| Russian | 27 | 0.1% |
| Scandinavian | 23 | 0.1% |
| Scotch-Irish | 584 | 2.3% |
| Scottish | 354 | 1.4% |
| Sioux | 95 | 0.4% |
| Spaniard | 158 | 0.6% |
| Sri Lankan | 20 | 0.1% |
| Swedish | 105 | 0.4% |
| Swiss | 7 | 0.0% |
| Ukrainian | 10 | 0.0% |
| Welsh | 299 | 1.2% | View All 46 Rows |
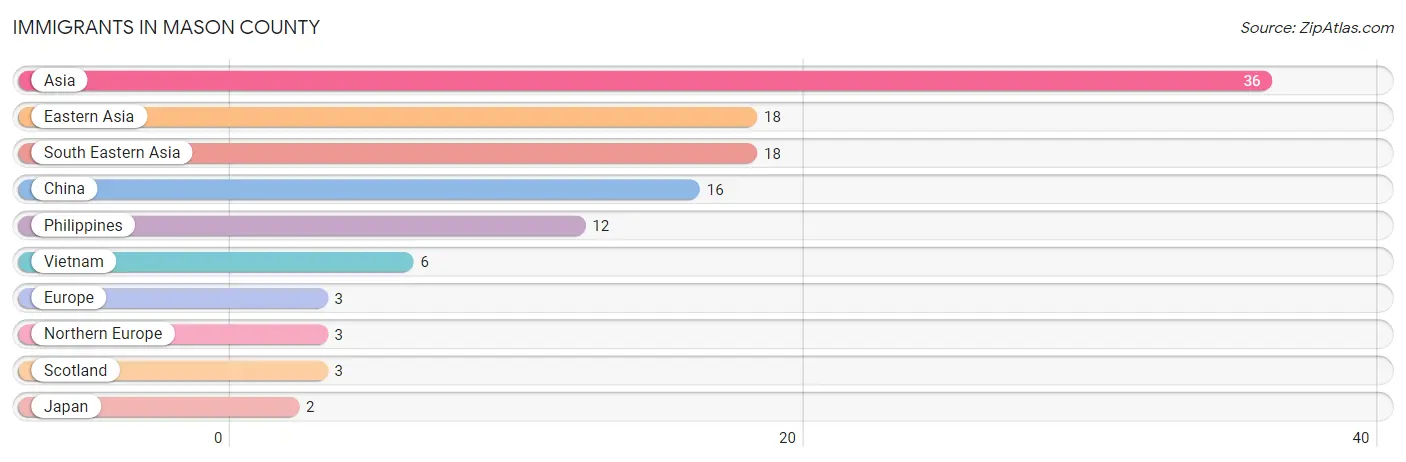
Immigrants in Mason County
The most numerous immigrant groups reported in Mason County came from Asia (36 | 0.1%), Eastern Asia (18 | 0.1%), South Eastern Asia (18 | 0.1%), China (16 | 0.1%), and Philippines (12 | 0.1%), together accounting for 0.4% of all Mason County residents.
| Immigration Origin | # Population | % Population |
| Asia | 36 | 0.1% |
| China | 16 | 0.1% |
| Eastern Asia | 18 | 0.1% |
| Europe | 3 | 0.0% |
| Japan | 2 | 0.0% |
| Northern Europe | 3 | 0.0% |
| Philippines | 12 | 0.1% |
| Scotland | 3 | 0.0% |
| South Eastern Asia | 18 | 0.1% |
| Vietnam | 6 | 0.0% | View All 10 Rows |
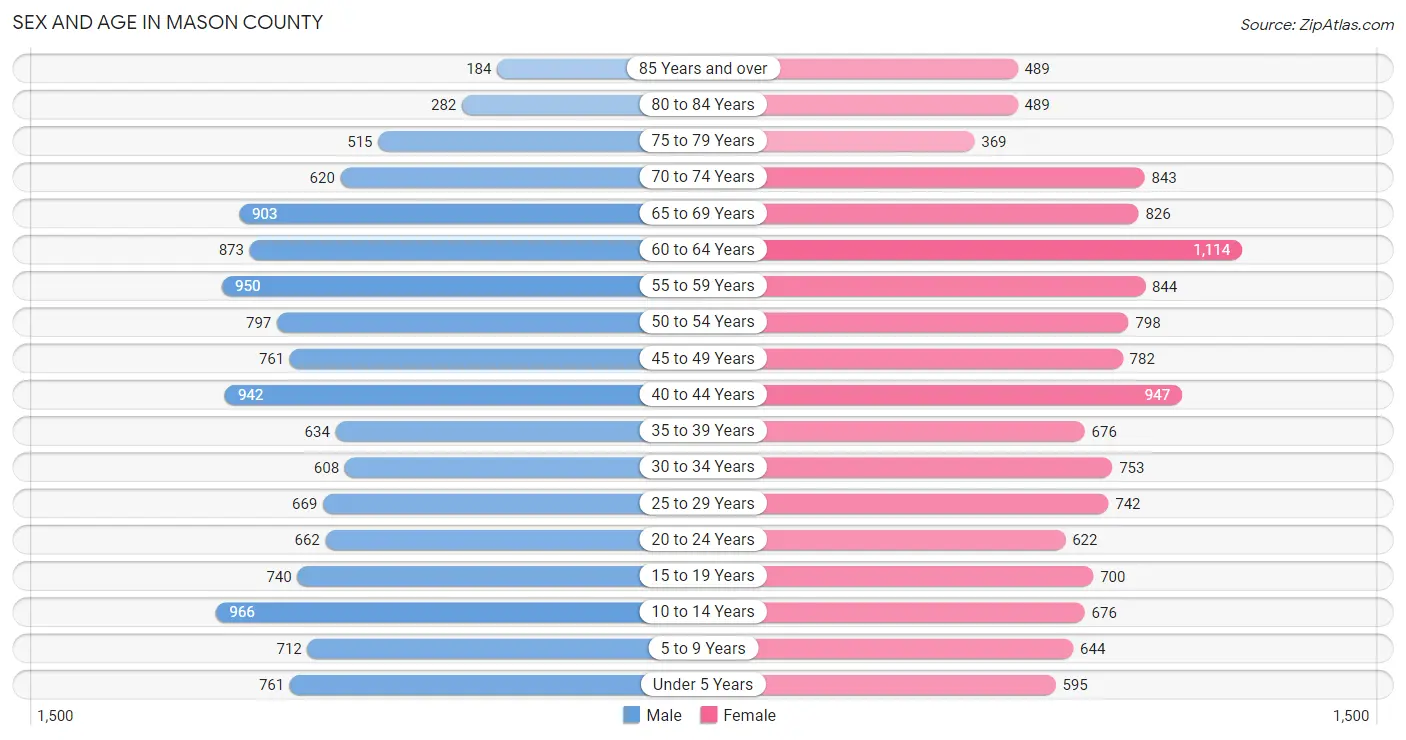
Sex and Age in Mason County
Sex and Age in Mason County
The most populous age groups in Mason County are 10 to 14 Years (966 | 7.7%) for men and 60 to 64 Years (1,114 | 8.6%) for women.
| Age Bracket | Male | Female |
| Under 5 Years | 761 (6.0%) | 595 (4.6%) |
| 5 to 9 Years | 712 (5.7%) | 644 (5.0%) |
| 10 to 14 Years | 966 (7.7%) | 676 (5.2%) |
| 15 to 19 Years | 740 (5.9%) | 700 (5.4%) |
| 20 to 24 Years | 662 (5.3%) | 622 (4.8%) |
| 25 to 29 Years | 669 (5.3%) | 742 (5.8%) |
| 30 to 34 Years | 608 (4.8%) | 753 (5.8%) |
| 35 to 39 Years | 634 (5.0%) | 676 (5.2%) |
| 40 to 44 Years | 942 (7.5%) | 947 (7.3%) |
| 45 to 49 Years | 761 (6.0%) | 782 (6.1%) |
| 50 to 54 Years | 797 (6.3%) | 798 (6.2%) |
| 55 to 59 Years | 950 (7.5%) | 844 (6.5%) |
| 60 to 64 Years | 873 (6.9%) | 1,114 (8.6%) |
| 65 to 69 Years | 903 (7.2%) | 826 (6.4%) |
| 70 to 74 Years | 620 (4.9%) | 843 (6.5%) |
| 75 to 79 Years | 515 (4.1%) | 369 (2.9%) |
| 80 to 84 Years | 282 (2.2%) | 489 (3.8%) |
| 85 Years and over | 184 (1.5%) | 489 (3.8%) |
| Total | 12,579 (100.0%) | 12,909 (100.0%) |
Families and Households in Mason County
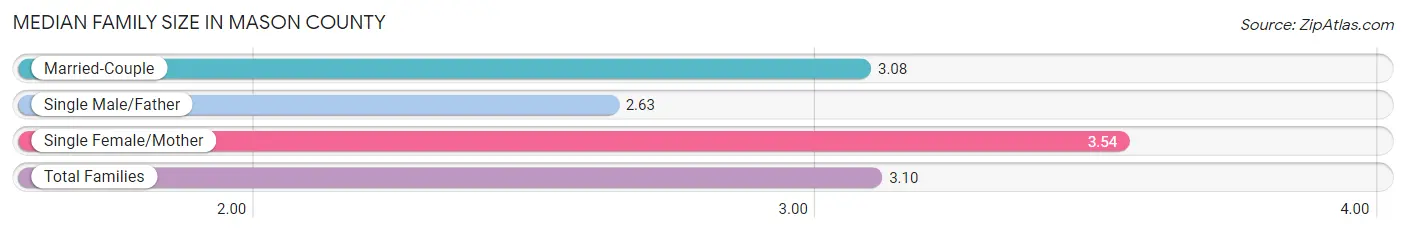
Median Family Size in Mason County
The median family size in Mason County is 3.10 persons per family, with single female/mother families (696 | 10.6%) accounting for the largest median family size of 3.54 persons per family. On the other hand, single male/father families (429 | 6.5%) represent the smallest median family size with 2.63 persons per family.
| Family Type | # Families | Family Size |
| Married-Couple | 5,442 (82.9%) | 3.08 |
| Single Male/Father | 429 (6.5%) | 2.63 |
| Single Female/Mother | 696 (10.6%) | 3.54 |
| Total Families | 6,567 (100.0%) | 3.10 |
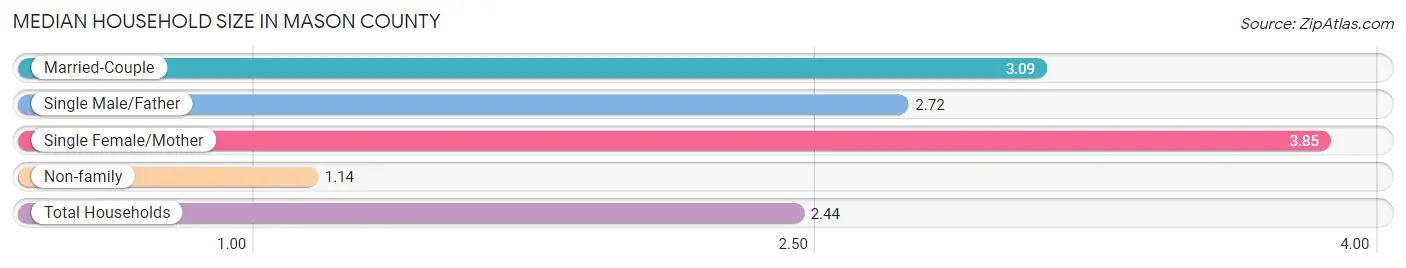
Median Household Size in Mason County
The median household size in Mason County is 2.44 persons per household, with single female/mother households (696 | 6.9%) accounting for the largest median household size of 3.85 persons per household. non-family households (3,553 | 35.1%) represent the smallest median household size with 1.14 persons per household.
| Household Type | # Households | Household Size |
| Married-Couple | 5,442 (53.8%) | 3.09 |
| Single Male/Father | 429 (4.2%) | 2.72 |
| Single Female/Mother | 696 (6.9%) | 3.85 |
| Non-family | 3,553 (35.1%) | 1.14 |
| Total Households | 10,120 (100.0%) | 2.44 |
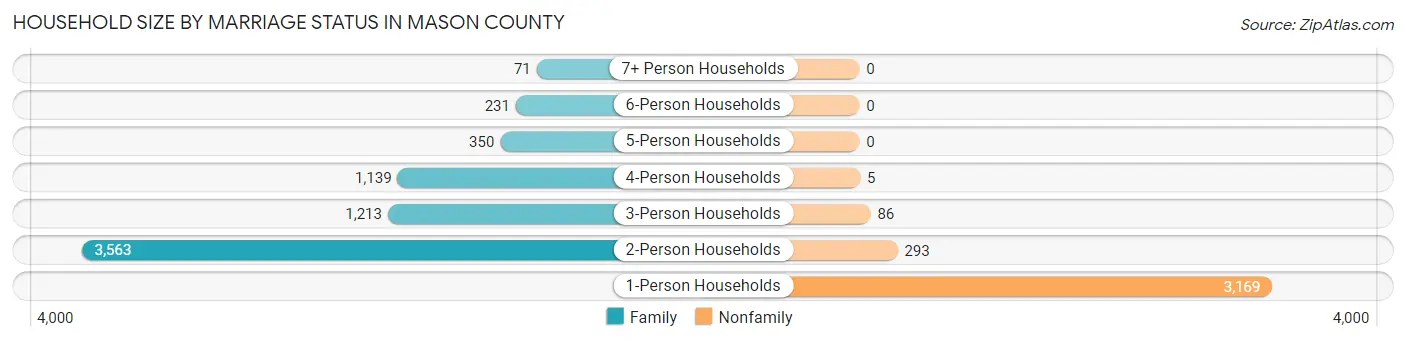
Household Size by Marriage Status in Mason County
Out of a total of 10,120 households in Mason County, 6,567 (64.9%) are family households, while 3,553 (35.1%) are nonfamily households. The most numerous type of family households are 2-person households, comprising 3,563, and the most common type of nonfamily households are 1-person households, comprising 3,169.
| Household Size | Family Households | Nonfamily Households |
| 1-Person Households | - | 3,169 (31.3%) |
| 2-Person Households | 3,563 (35.2%) | 293 (2.9%) |
| 3-Person Households | 1,213 (12.0%) | 86 (0.9%) |
| 4-Person Households | 1,139 (11.3%) | 5 (0.1%) |
| 5-Person Households | 350 (3.5%) | 0 (0.0%) |
| 6-Person Households | 231 (2.3%) | 0 (0.0%) |
| 7+ Person Households | 71 (0.7%) | 0 (0.0%) |
| Total | 6,567 (64.9%) | 3,553 (35.1%) |
Female Fertility in Mason County
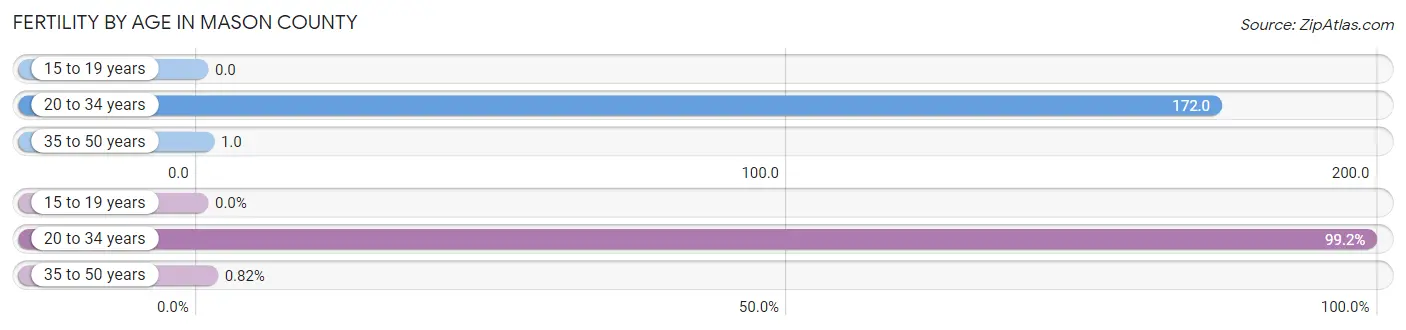
Fertility by Age in Mason County
Average fertility rate in Mason County is 69.0 births per 1,000 women. Women in the age bracket of 20 to 34 years have the highest fertility rate with 172.0 births per 1,000 women. Women in the age bracket of 20 to 34 years acount for 99.2% of all women with births.
| Age Bracket | Women with Births | Births / 1,000 Women |
| 15 to 19 years | 0 (0.0%) | 0.0 |
| 20 to 34 years | 365 (99.2%) | 172.0 |
| 35 to 50 years | 3 (0.8%) | 1.0 |
| Total | 368 (100.0%) | 69.0 |
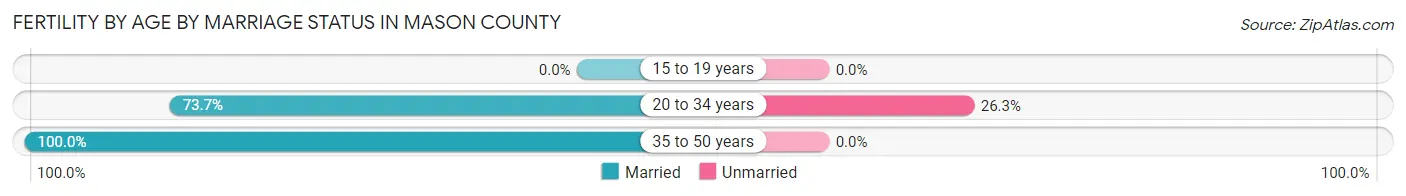
Fertility by Age by Marriage Status in Mason County
73.9% of women with births (368) in Mason County are married. The highest percentage of unmarried women with births falls into 20 to 34 years age bracket with 26.3% of them unmarried at the time of birth, while the lowest percentage of unmarried women with births belong to 35 to 50 years age bracket with 0.0% of them unmarried.
| Age Bracket | Married | Unmarried |
| 15 to 19 years | 0 (0.0%) | 0 (0.0%) |
| 20 to 34 years | 269 (73.7%) | 96 (26.3%) |
| 35 to 50 years | 3 (100.0%) | 0 (0.0%) |
| Total | 272 (73.9%) | 96 (26.1%) |
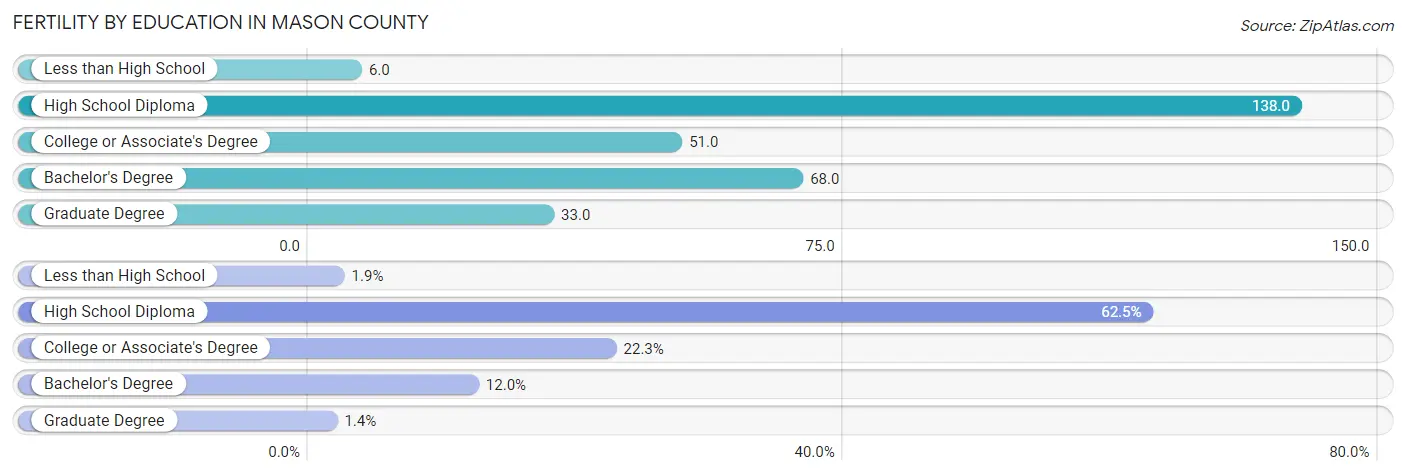
Fertility by Education in Mason County
Average fertility rate in Mason County is 69.0 births per 1,000 women. Women with the education attainment of high school diploma have the highest fertility rate of 138.0 births per 1,000 women, while women with the education attainment of less than high school have the lowest fertility at 6.0 births per 1,000 women. Women with the education attainment of high school diploma represent 62.5% of all women with births.
| Educational Attainment | Women with Births | Births / 1,000 Women |
| Less than High School | 7 (1.9%) | 6.0 |
| High School Diploma | 230 (62.5%) | 138.0 |
| College or Associate's Degree | 82 (22.3%) | 51.0 |
| Bachelor's Degree | 44 (12.0%) | 68.0 |
| Graduate Degree | 5 (1.4%) | 33.0 |
| Total | 368 (100.0%) | 69.0 |
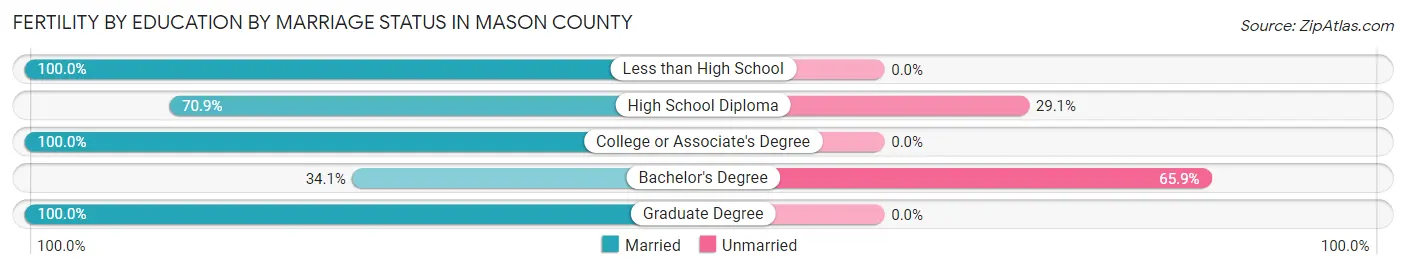
Fertility by Education by Marriage Status in Mason County
26.1% of women with births in Mason County are unmarried. Women with the educational attainment of less than high school are most likely to be married with 100.0% of them married at childbirth, while women with the educational attainment of bachelor's degree are least likely to be married with 65.9% of them unmarried at childbirth.
| Educational Attainment | Married | Unmarried |
| Less than High School | 7 (100.0%) | 0 (0.0%) |
| High School Diploma | 163 (70.9%) | 67 (29.1%) |
| College or Associate's Degree | 82 (100.0%) | 0 (0.0%) |
| Bachelor's Degree | 15 (34.1%) | 29 (65.9%) |
| Graduate Degree | 5 (100.0%) | 0 (0.0%) |
| Total | 272 (73.9%) | 96 (26.1%) |
Income in Mason County
Income Overview in Mason County
Per Capita Income in Mason County is $31,085, while median incomes of families and households are $70,809 and $53,058 respectively.
| Characteristic | Number | Measure |
| Per Capita Income | 25,488 | $31,085 |
| Median Family Income | 6,567 | $70,809 |
| Mean Family Income | 6,567 | $95,830 |
| Median Household Income | 10,120 | $53,058 |
| Mean Household Income | 10,120 | $76,285 |
| Income Deficit | 6,567 | $0 |
| Wage / Income Gap (%) | 25,488 | 50.36% |
| Wage / Income Gap ($) | 25,488 | 49.64¢ per $1 |
| Gini / Inequality Index | 25,488 | 0.49 |
Earnings by Sex in Mason County
Average Earnings in Mason County are $37,153, $50,141 for men and $24,889 for women, a difference of 50.4%.
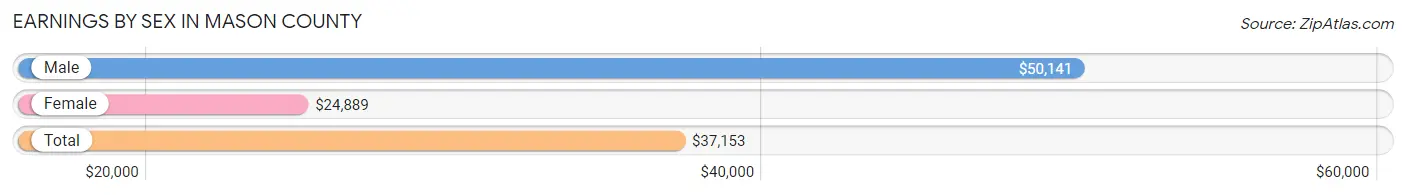
| Sex | Number | Average Earnings |
| Male | 5,740 (54.9%) | $50,141 |
| Female | 4,707 (45.1%) | $24,889 |
| Total | 10,447 (100.0%) | $37,153 |
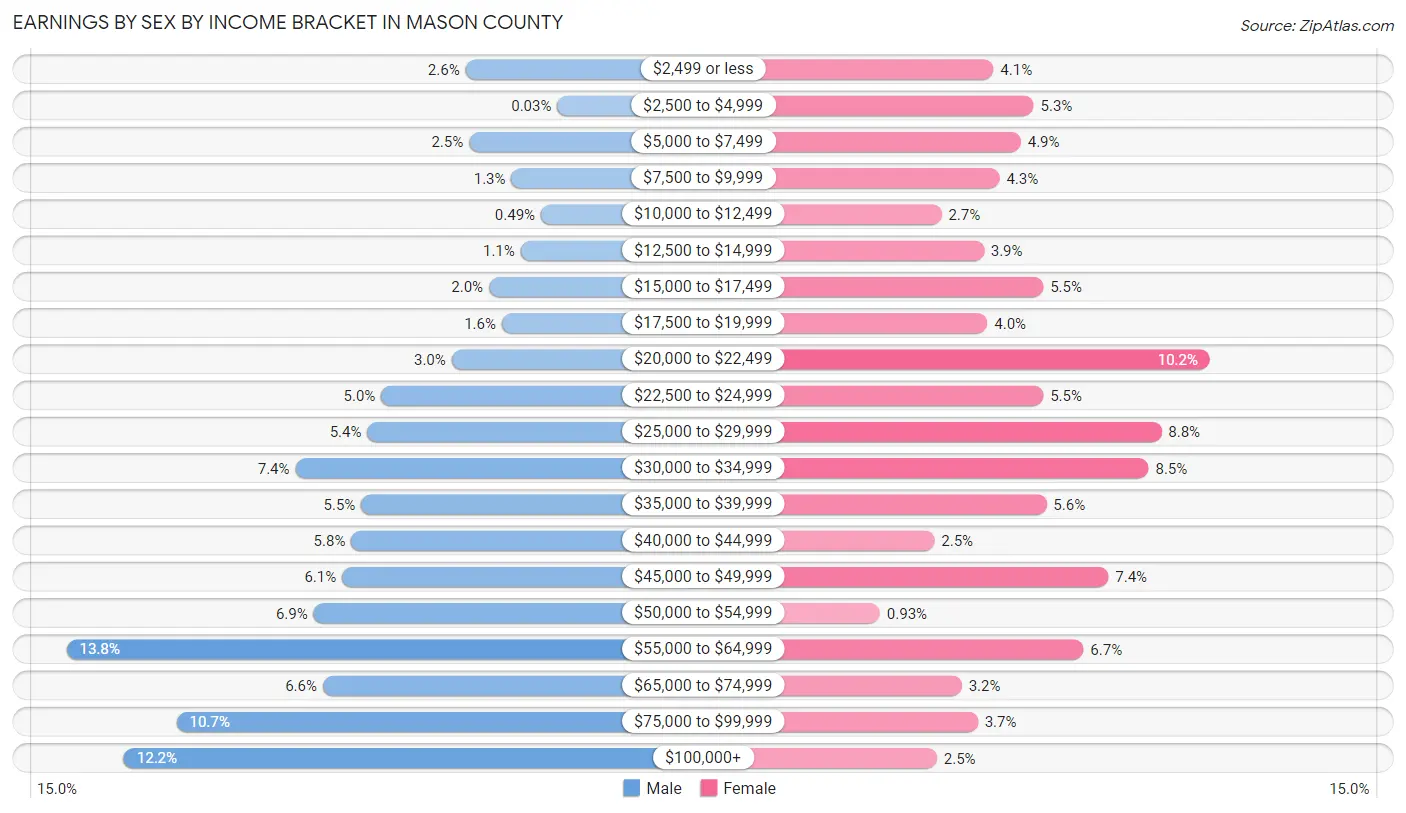
Earnings by Sex by Income Bracket in Mason County
The most common earnings brackets in Mason County are $55,000 to $64,999 for men (793 | 13.8%) and $20,000 to $22,499 for women (480 | 10.2%).
| Income | Male | Female |
| $2,499 or less | 150 (2.6%) | 194 (4.1%) |
| $2,500 to $4,999 | 2 (0.0%) | 247 (5.2%) |
| $5,000 to $7,499 | 144 (2.5%) | 230 (4.9%) |
| $7,500 to $9,999 | 76 (1.3%) | 202 (4.3%) |
| $10,000 to $12,499 | 28 (0.5%) | 125 (2.7%) |
| $12,500 to $14,999 | 61 (1.1%) | 181 (3.8%) |
| $15,000 to $17,499 | 112 (1.9%) | 260 (5.5%) |
| $17,500 to $19,999 | 91 (1.6%) | 186 (4.0%) |
| $20,000 to $22,499 | 172 (3.0%) | 480 (10.2%) |
| $22,500 to $24,999 | 286 (5.0%) | 260 (5.5%) |
| $25,000 to $29,999 | 308 (5.4%) | 416 (8.8%) |
| $30,000 to $34,999 | 424 (7.4%) | 399 (8.5%) |
| $35,000 to $39,999 | 318 (5.5%) | 264 (5.6%) |
| $40,000 to $44,999 | 334 (5.8%) | 116 (2.5%) |
| $45,000 to $49,999 | 349 (6.1%) | 346 (7.3%) |
| $50,000 to $54,999 | 395 (6.9%) | 44 (0.9%) |
| $55,000 to $64,999 | 793 (13.8%) | 313 (6.7%) |
| $65,000 to $74,999 | 380 (6.6%) | 152 (3.2%) |
| $75,000 to $99,999 | 616 (10.7%) | 173 (3.7%) |
| $100,000+ | 701 (12.2%) | 119 (2.5%) |
| Total | 5,740 (100.0%) | 4,707 (100.0%) |
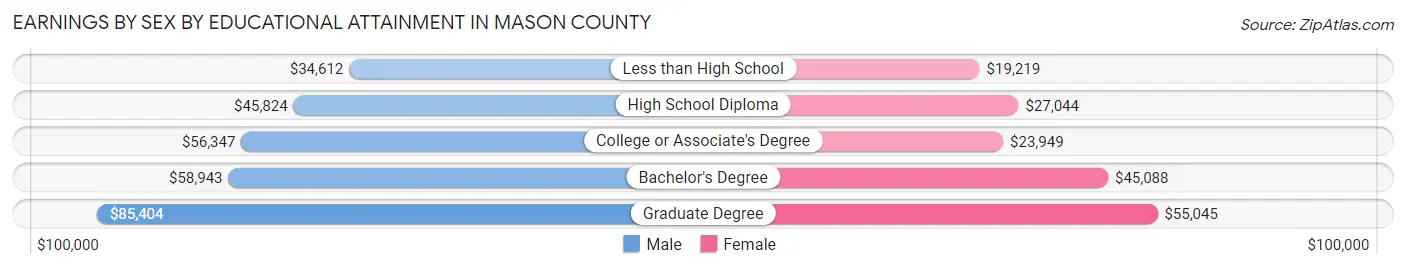
Earnings by Sex by Educational Attainment in Mason County
Average earnings in Mason County are $51,979 for men and $27,987 for women, a difference of 46.2%. Men with an educational attainment of graduate degree enjoy the highest average annual earnings of $85,404, while those with less than high school education earn the least with $34,612. Women with an educational attainment of graduate degree earn the most with the average annual earnings of $55,045, while those with less than high school education have the smallest earnings of $19,219.
| Educational Attainment | Male Income | Female Income |
| Less than High School | $34,612 | $19,219 |
| High School Diploma | $45,824 | $27,044 |
| College or Associate's Degree | $56,347 | $23,949 |
| Bachelor's Degree | $58,943 | $45,088 |
| Graduate Degree | $85,404 | $55,045 |
| Total | $51,979 | $27,987 |
Family Income in Mason County
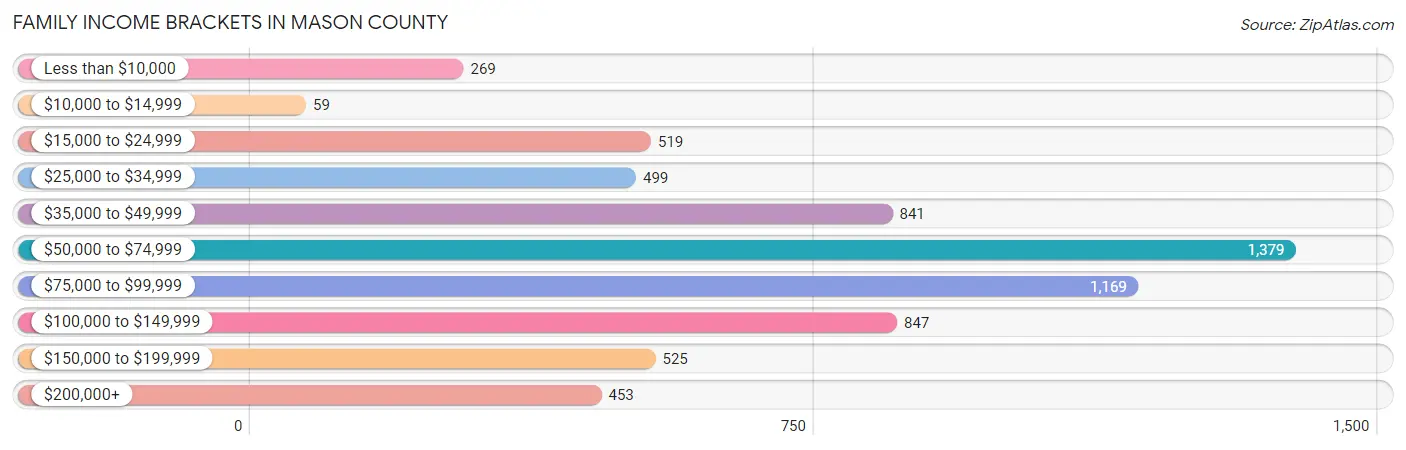
Family Income Brackets in Mason County
According to the Mason County family income data, there are 1,379 families falling into the $50,000 to $74,999 income range, which is the most common income bracket and makes up 21.0% of all families. Conversely, the $10,000 to $14,999 income bracket is the least frequent group with only 59 families (0.9%) belonging to this category.
| Income Bracket | # Families | % Families |
| Less than $10,000 | 269 | 4.1% |
| $10,000 to $14,999 | 59 | 0.9% |
| $15,000 to $24,999 | 519 | 7.9% |
| $25,000 to $34,999 | 499 | 7.6% |
| $35,000 to $49,999 | 841 | 12.8% |
| $50,000 to $74,999 | 1,379 | 21.0% |
| $75,000 to $99,999 | 1,169 | 17.8% |
| $100,000 to $149,999 | 847 | 12.9% |
| $150,000 to $199,999 | 525 | 8.0% |
| $200,000+ | 453 | 6.9% |
Family Income by Famaliy Size in Mason County
7+ person families (57 | 0.9%) account for the highest median family income in Mason County with $90,673 per family, while 2-person families (3,632 | 55.3%) have the highest median income of $33,660 per family member.
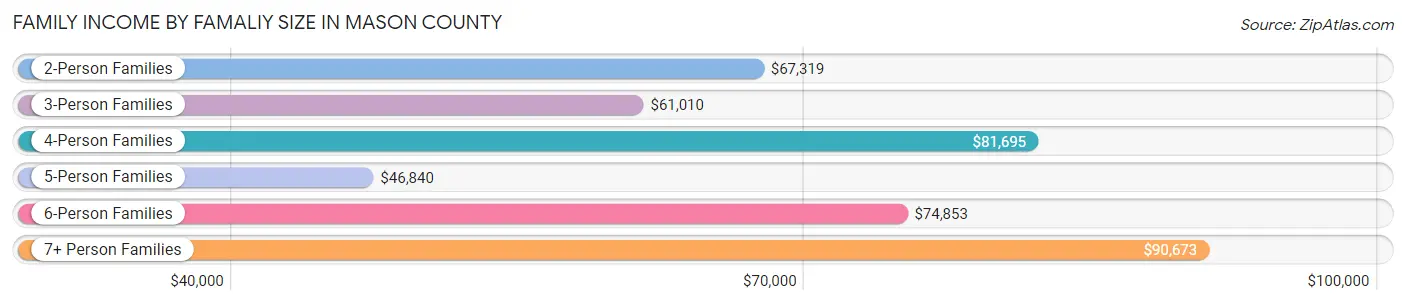
| Income Bracket | # Families | Median Income |
| 2-Person Families | 3,632 (55.3%) | $67,319 |
| 3-Person Families | 1,175 (17.9%) | $61,010 |
| 4-Person Families | 1,146 (17.4%) | $81,695 |
| 5-Person Families | 367 (5.6%) | $46,840 |
| 6-Person Families | 190 (2.9%) | $74,853 |
| 7+ Person Families | 57 (0.9%) | $90,673 |
| Total | 6,567 (100.0%) | $70,809 |
Family Income by Number of Earners in Mason County
The median family income in Mason County is $70,809, with families comprising 3+ earners (316) having the highest median family income of $121,019, while families with no earners (1,733) have the lowest median family income of $41,710, accounting for 4.8% and 26.4% of families, respectively.
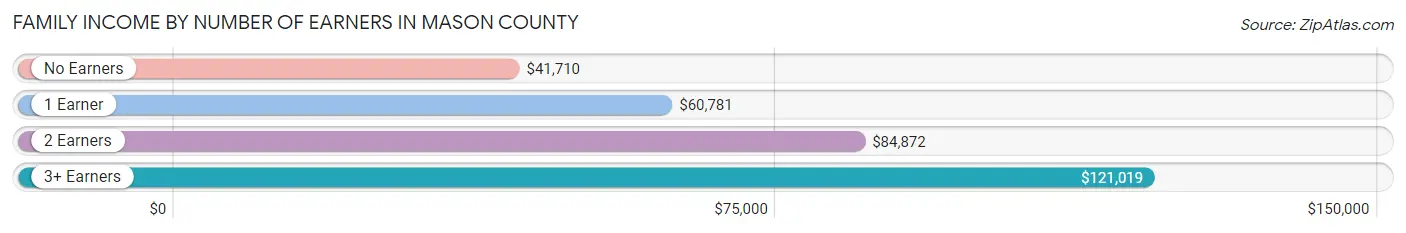
| Number of Earners | # Families | Median Income |
| No Earners | 1,733 (26.4%) | $41,710 |
| 1 Earner | 2,026 (30.8%) | $60,781 |
| 2 Earners | 2,492 (38.0%) | $84,872 |
| 3+ Earners | 316 (4.8%) | $121,019 |
| Total | 6,567 (100.0%) | $70,809 |
Household Income in Mason County
Household Income Brackets in Mason County
With 1,771 households falling in the category, the $50,000 to $74,999 income range is the most frequent in Mason County, accounting for 17.5% of all households. In contrast, only 344 households (3.4%) fall into the $10,000 to $14,999 income bracket, making it the least populous group.
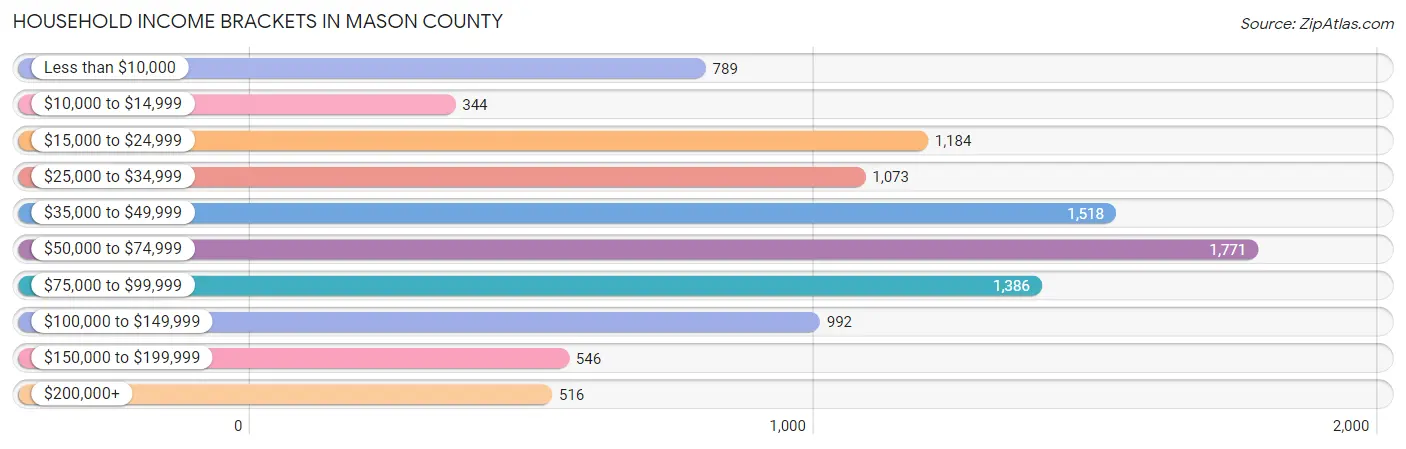
| Income Bracket | # Households | % Households |
| Less than $10,000 | 789 | 7.8% |
| $10,000 to $14,999 | 344 | 3.4% |
| $15,000 to $24,999 | 1,184 | 11.7% |
| $25,000 to $34,999 | 1,073 | 10.6% |
| $35,000 to $49,999 | 1,518 | 15.0% |
| $50,000 to $74,999 | 1,771 | 17.5% |
| $75,000 to $99,999 | 1,386 | 13.7% |
| $100,000 to $149,999 | 992 | 9.8% |
| $150,000 to $199,999 | 546 | 5.4% |
| $200,000+ | 516 | 5.1% |
Household Income by Householder Age in Mason County
The median household income in Mason County is $53,058, with the highest median household income of $65,831 found in the 45 to 64 years age bracket for the primary householder. A total of 3,781 households (37.4%) fall into this category. Meanwhile, the 65+ years age bracket for the primary householder has the lowest median household income of $37,435, with 3,724 households (36.8%) in this group.
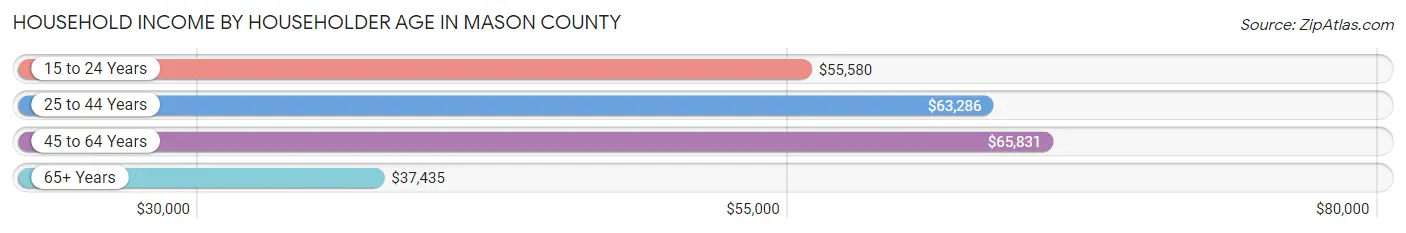
| Income Bracket | # Households | Median Income |
| 15 to 24 Years | 183 (1.8%) | $55,580 |
| 25 to 44 Years | 2,432 (24.0%) | $63,286 |
| 45 to 64 Years | 3,781 (37.4%) | $65,831 |
| 65+ Years | 3,724 (36.8%) | $37,435 |
| Total | 10,120 (100.0%) | $53,058 |
Poverty in Mason County
Income Below Poverty by Sex and Age in Mason County
With 13.8% poverty level for males and 18.9% for females among the residents of Mason County, 6 to 11 year old males and 15 year old females are the most vulnerable to poverty, with 367 males (37.1%) and 92 females (61.3%) in their respective age groups living below the poverty level.
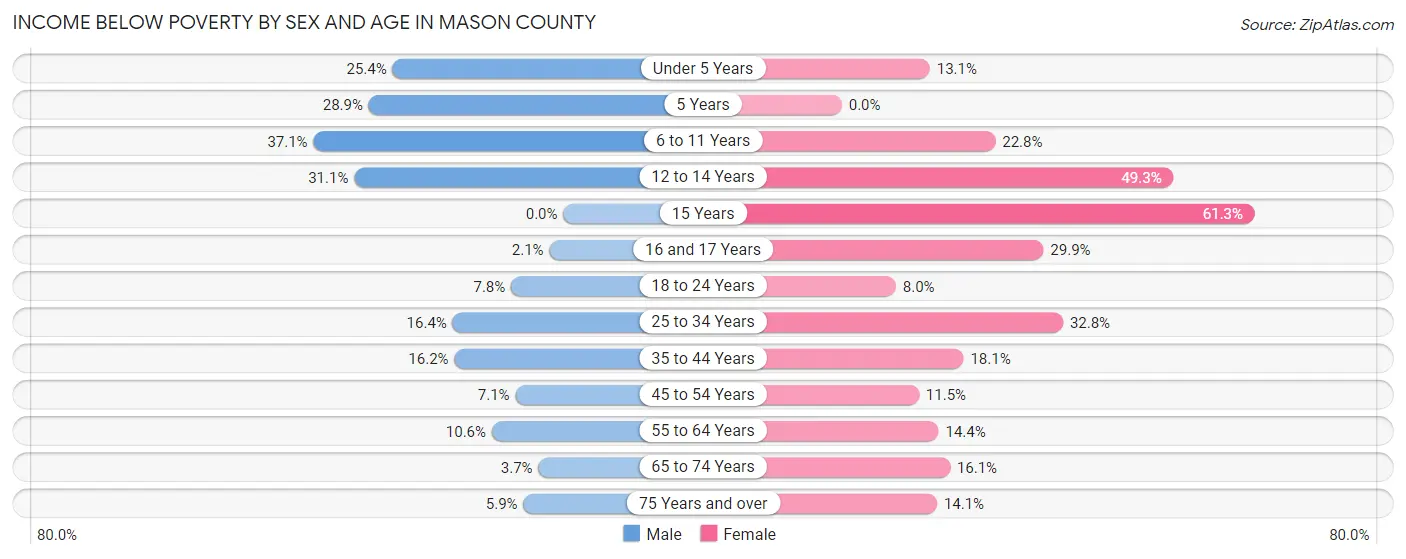
| Age Bracket | Male | Female |
| Under 5 Years | 193 (25.4%) | 72 (13.1%) |
| 5 Years | 39 (28.9%) | 0 (0.0%) |
| 6 to 11 Years | 367 (37.1%) | 165 (22.8%) |
| 12 to 14 Years | 172 (31.0%) | 229 (49.2%) |
| 15 Years | 0 (0.0%) | 92 (61.3%) |
| 16 and 17 Years | 8 (2.1%) | 97 (29.9%) |
| 18 to 24 Years | 70 (7.8%) | 64 (8.0%) |
| 25 to 34 Years | 210 (16.4%) | 423 (32.8%) |
| 35 to 44 Years | 255 (16.2%) | 254 (18.1%) |
| 45 to 54 Years | 111 (7.1%) | 170 (11.5%) |
| 55 to 64 Years | 193 (10.6%) | 277 (14.4%) |
| 65 to 74 Years | 55 (3.7%) | 267 (16.1%) |
| 75 Years and over | 58 (5.9%) | 182 (14.1%) |
| Total | 1,731 (13.8%) | 2,292 (18.9%) |
Income Above Poverty by Sex and Age in Mason County
According to the poverty statistics in Mason County, males aged 15 years and females aged 5 years are the age groups that are most secure financially, with 100.0% of males and 100.0% of females in these age groups living above the poverty line.
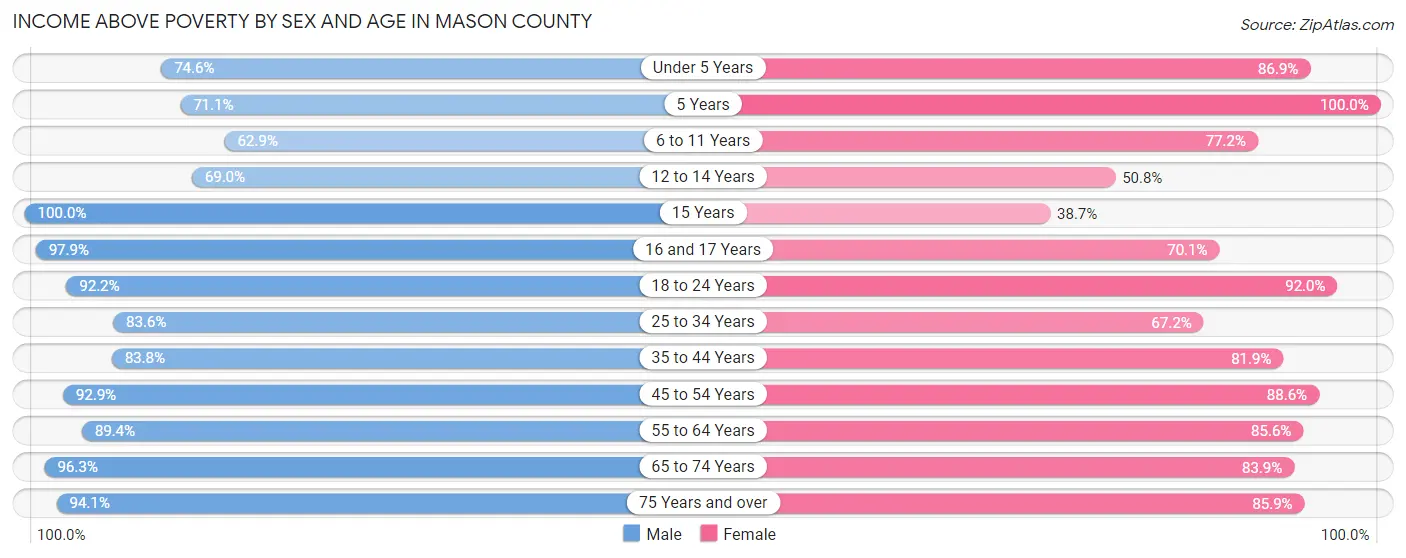
| Age Bracket | Male | Female |
| Under 5 Years | 568 (74.6%) | 479 (86.9%) |
| 5 Years | 96 (71.1%) | 53 (100.0%) |
| 6 to 11 Years | 622 (62.9%) | 559 (77.2%) |
| 12 to 14 Years | 382 (69.0%) | 236 (50.7%) |
| 15 Years | 106 (100.0%) | 58 (38.7%) |
| 16 and 17 Years | 378 (97.9%) | 227 (70.1%) |
| 18 to 24 Years | 832 (92.2%) | 733 (92.0%) |
| 25 to 34 Years | 1,067 (83.6%) | 865 (67.2%) |
| 35 to 44 Years | 1,321 (83.8%) | 1,152 (81.9%) |
| 45 to 54 Years | 1,447 (92.9%) | 1,315 (88.5%) |
| 55 to 64 Years | 1,625 (89.4%) | 1,651 (85.6%) |
| 65 to 74 Years | 1,433 (96.3%) | 1,396 (83.9%) |
| 75 Years and over | 920 (94.1%) | 1,106 (85.9%) |
| Total | 10,797 (86.2%) | 9,830 (81.1%) |
Income Below Poverty Among Married-Couple Families in Mason County
The poverty statistics for married-couple families in Mason County show that 7.6% or 413 of the total 5,442 families live below the poverty line. Families with 5 or more children have the highest poverty rate of 29.1%, comprising of 16 families. On the other hand, families with no children have the lowest poverty rate of 2.8%, which includes 101 families.
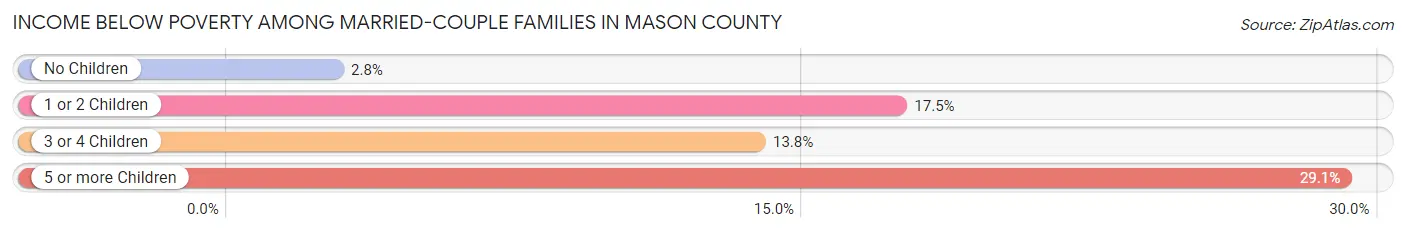
| Children | Above Poverty | Below Poverty |
| No Children | 3,544 (97.2%) | 101 (2.8%) |
| 1 or 2 Children | 1,246 (82.5%) | 264 (17.5%) |
| 3 or 4 Children | 200 (86.2%) | 32 (13.8%) |
| 5 or more Children | 39 (70.9%) | 16 (29.1%) |
| Total | 5,029 (92.4%) | 413 (7.6%) |
Income Below Poverty Among Single-Parent Households in Mason County
According to the poverty data in Mason County, 8.9% or 38 single-father households and 35.1% or 244 single-mother households are living below the poverty line. Among single-father households, those with 1 or 2 children have the highest poverty rate, with 38 households (23.9%) experiencing poverty. Likewise, among single-mother households, those with 3 or 4 children have the highest poverty rate, with 84 households (59.2%) falling below the poverty line.
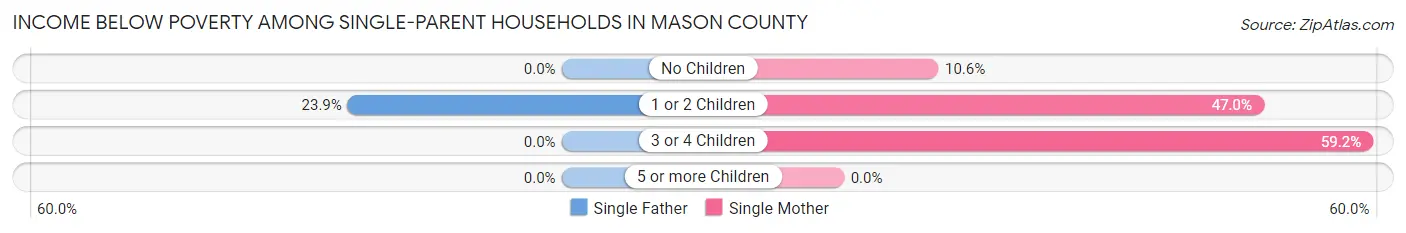
| Children | Single Father | Single Mother |
| No Children | 0 (0.0%) | 29 (10.5%) |
| 1 or 2 Children | 38 (23.9%) | 131 (46.9%) |
| 3 or 4 Children | 0 (0.0%) | 84 (59.2%) |
| 5 or more Children | 0 (0.0%) | 0 (0.0%) |
| Total | 38 (8.9%) | 244 (35.1%) |
Income Below Poverty Among Married-Couple vs Single-Parent Households in Mason County
The poverty data for Mason County shows that 413 of the married-couple family households (7.6%) and 282 of the single-parent households (25.1%) are living below the poverty level. Within the married-couple family households, those with 5 or more children have the highest poverty rate, with 16 households (29.1%) falling below the poverty line. Among the single-parent households, those with 3 or 4 children have the highest poverty rate, with 84 household (55.3%) living below poverty.
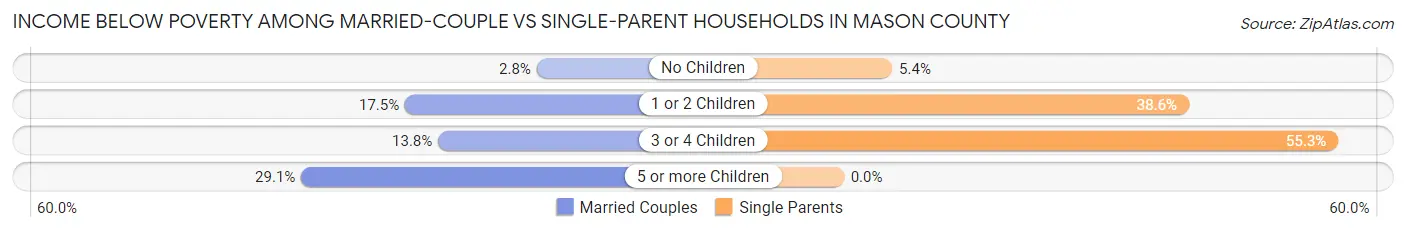
| Children | Married-Couple Families | Single-Parent Households |
| No Children | 101 (2.8%) | 29 (5.4%) |
| 1 or 2 Children | 264 (17.5%) | 169 (38.6%) |
| 3 or 4 Children | 32 (13.8%) | 84 (55.3%) |
| 5 or more Children | 16 (29.1%) | 0 (0.0%) |
| Total | 413 (7.6%) | 282 (25.1%) |
Employment Characteristics in Mason County
Employment by Class of Employer in Mason County
Among the 9,091 employed individuals in Mason County, private company employees (6,521 | 71.7%), state government employees (845 | 9.3%), and local government employees (619 | 6.8%) make up the most common classes of employment.
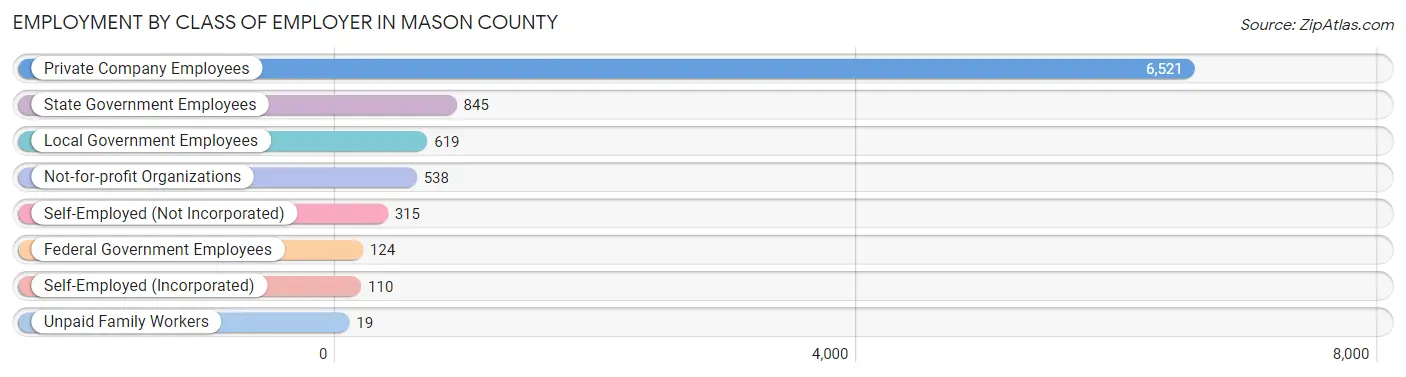
| Employer Class | # Employees | % Employees |
| Private Company Employees | 6,521 | 71.7% |
| Self-Employed (Incorporated) | 110 | 1.2% |
| Self-Employed (Not Incorporated) | 315 | 3.5% |
| Not-for-profit Organizations | 538 | 5.9% |
| Local Government Employees | 619 | 6.8% |
| State Government Employees | 845 | 9.3% |
| Federal Government Employees | 124 | 1.4% |
| Unpaid Family Workers | 19 | 0.2% |
| Total | 9,091 | 100.0% |
Employment Status by Age in Mason County
According to the labor force statistics for Mason County, out of the total population over 16 years of age (20,878), 46.6% or 9,729 individuals are in the labor force, with 2.9% or 282 of them unemployed. The age group with the highest labor force participation rate is 20 to 24 years, with 70.6% or 907 individuals in the labor force. Within the labor force, the 25 to 29 years age range has the highest percentage of unemployed individuals, with 12.6% or 83 of them being unemployed.
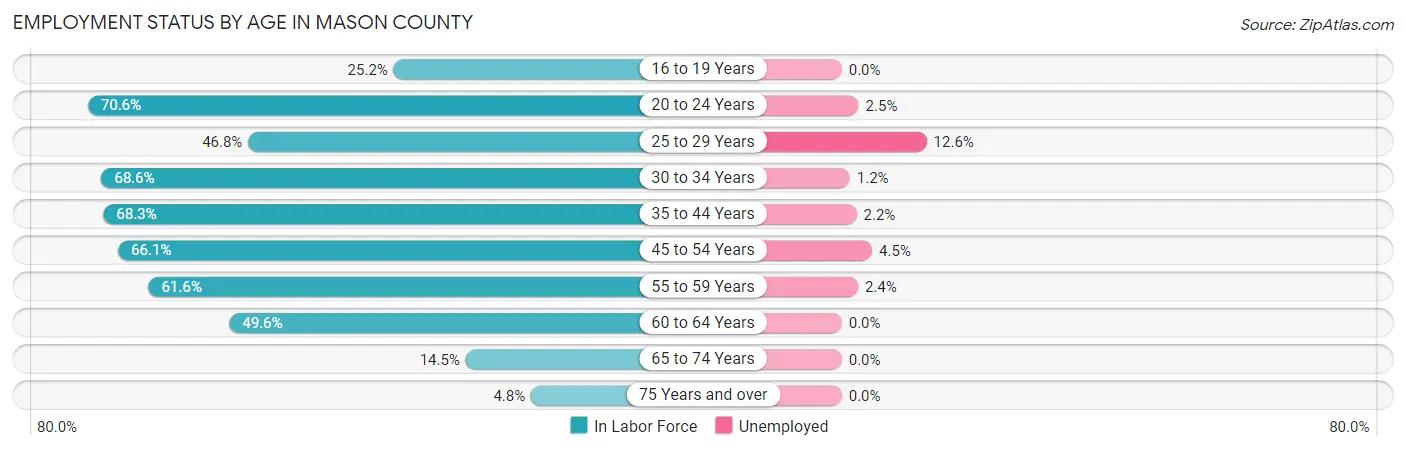
| Age Bracket | In Labor Force | Unemployed |
| 16 to 19 Years | 298 (25.2%) | 0 (0.0%) |
| 20 to 24 Years | 907 (70.6%) | 23 (2.5%) |
| 25 to 29 Years | 660 (46.8%) | 83 (12.6%) |
| 30 to 34 Years | 934 (68.6%) | 11 (1.2%) |
| 35 to 44 Years | 2,185 (68.3%) | 48 (2.2%) |
| 45 to 54 Years | 2,074 (66.1%) | 93 (4.5%) |
| 55 to 59 Years | 1,105 (61.6%) | 27 (2.4%) |
| 60 to 64 Years | 986 (49.6%) | 0 (0.0%) |
| 65 to 74 Years | 463 (14.5%) | 0 (0.0%) |
| 75 Years and over | 112 (4.8%) | 0 (0.0%) |
| Total | 9,729 (46.6%) | 282 (2.9%) |
Employment Status by Educational Attainment in Mason County
According to labor force statistics for Mason County, 61.6% of individuals (7,940) out of the total population between 25 and 64 years of age (12,890) are in the labor force, with 3.3% or 262 of them being unemployed. The group with the highest labor force participation rate are those with the educational attainment of bachelor's degree or higher, with 80.9% or 1,758 individuals in the labor force. Within the labor force, individuals with less than high school education have the highest percentage of unemployment, with 12.9% or 73 of them being unemployed.
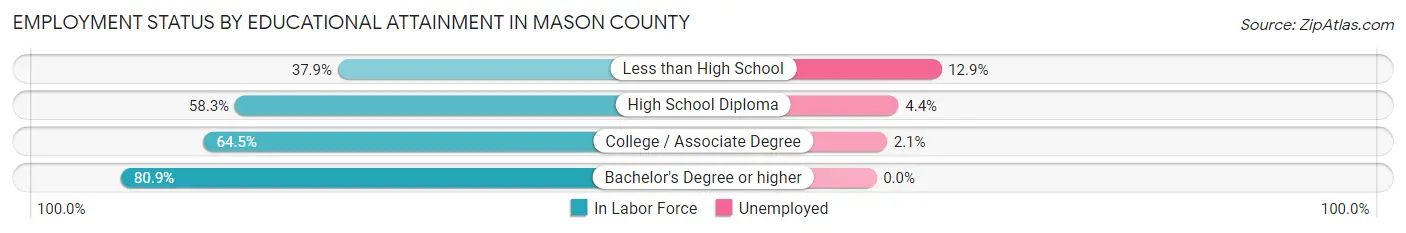
| Educational Attainment | In Labor Force | Unemployed |
| Less than High School | 564 (37.9%) | 192 (12.9%) |
| High School Diploma | 3,132 (58.3%) | 236 (4.4%) |
| College / Associate Degree | 2,486 (64.5%) | 81 (2.1%) |
| Bachelor's Degree or higher | 1,758 (80.9%) | 0 (0.0%) |
| Total | 7,940 (61.6%) | 425 (3.3%) |
Employment Occupations by Sex in Mason County
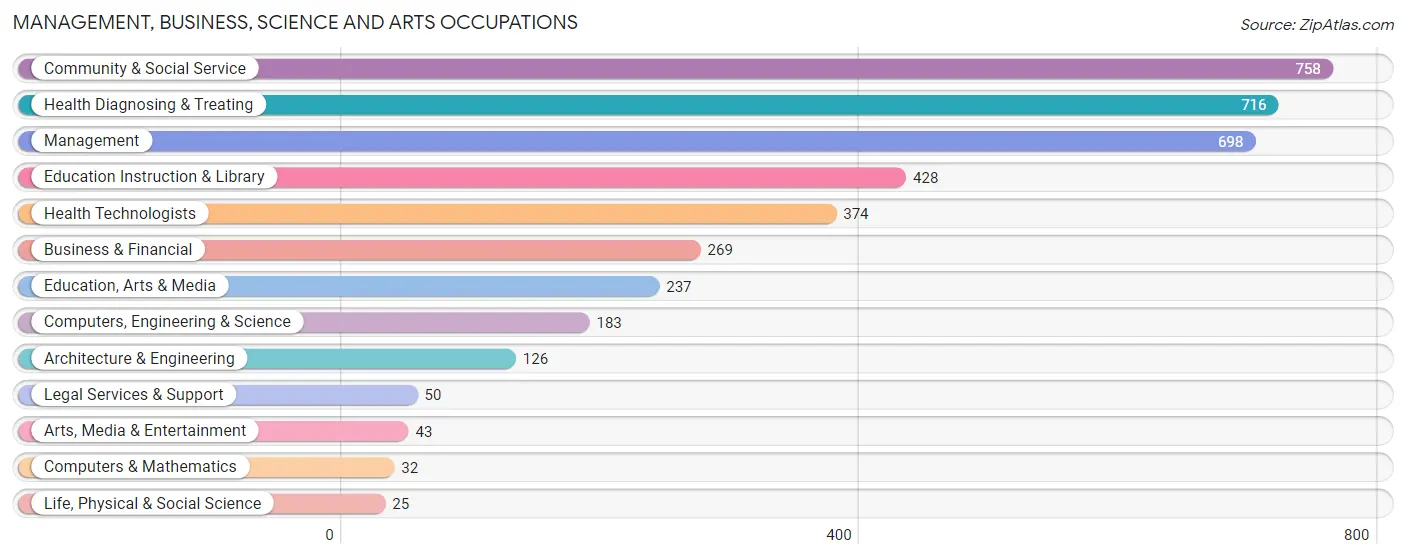
Management, Business, Science and Arts Occupations
The most common Management, Business, Science and Arts occupations in Mason County are Community & Social Service (758 | 8.1%), Health Diagnosing & Treating (716 | 7.6%), Management (698 | 7.4%), Education Instruction & Library (428 | 4.5%), and Health Technologists (374 | 4.0%).
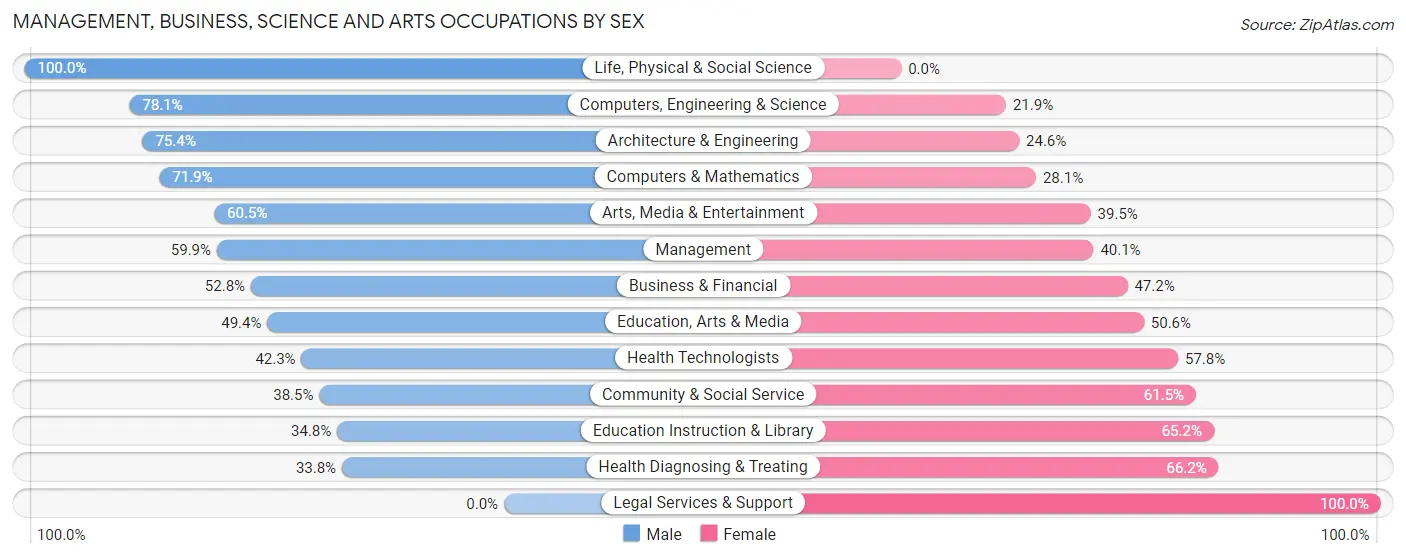
Management, Business, Science and Arts Occupations by Sex
Within the Management, Business, Science and Arts occupations in Mason County, the most male-oriented occupations are Life, Physical & Social Science (100.0%), Computers, Engineering & Science (78.1%), and Architecture & Engineering (75.4%), while the most female-oriented occupations are Legal Services & Support (100.0%), Health Diagnosing & Treating (66.2%), and Education Instruction & Library (65.2%).
| Occupation | Male | Female |
| Management | 418 (59.9%) | 280 (40.1%) |
| Business & Financial | 142 (52.8%) | 127 (47.2%) |
| Computers, Engineering & Science | 143 (78.1%) | 40 (21.9%) |
| Computers & Mathematics | 23 (71.9%) | 9 (28.1%) |
| Architecture & Engineering | 95 (75.4%) | 31 (24.6%) |
| Life, Physical & Social Science | 25 (100.0%) | 0 (0.0%) |
| Community & Social Service | 292 (38.5%) | 466 (61.5%) |
| Education, Arts & Media | 117 (49.4%) | 120 (50.6%) |
| Legal Services & Support | 0 (0.0%) | 50 (100.0%) |
| Education Instruction & Library | 149 (34.8%) | 279 (65.2%) |
| Arts, Media & Entertainment | 26 (60.5%) | 17 (39.5%) |
| Health Diagnosing & Treating | 242 (33.8%) | 474 (66.2%) |
| Health Technologists | 158 (42.2%) | 216 (57.8%) |
| Total (Category) | 1,237 (47.1%) | 1,387 (52.9%) |
| Total (Overall) | 5,370 (57.0%) | 4,047 (43.0%) |
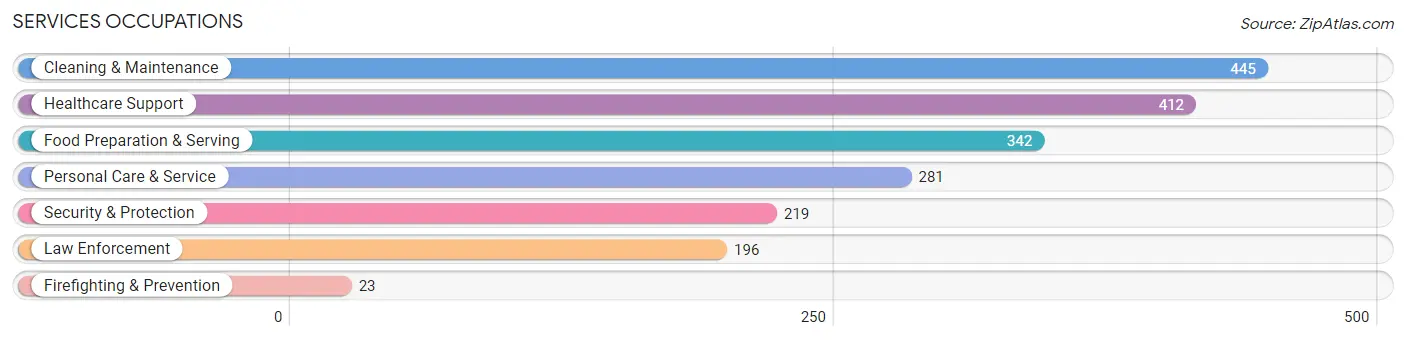
Services Occupations
The most common Services occupations in Mason County are Cleaning & Maintenance (445 | 4.7%), Healthcare Support (412 | 4.4%), Food Preparation & Serving (342 | 3.6%), Personal Care & Service (281 | 3.0%), and Security & Protection (219 | 2.3%).
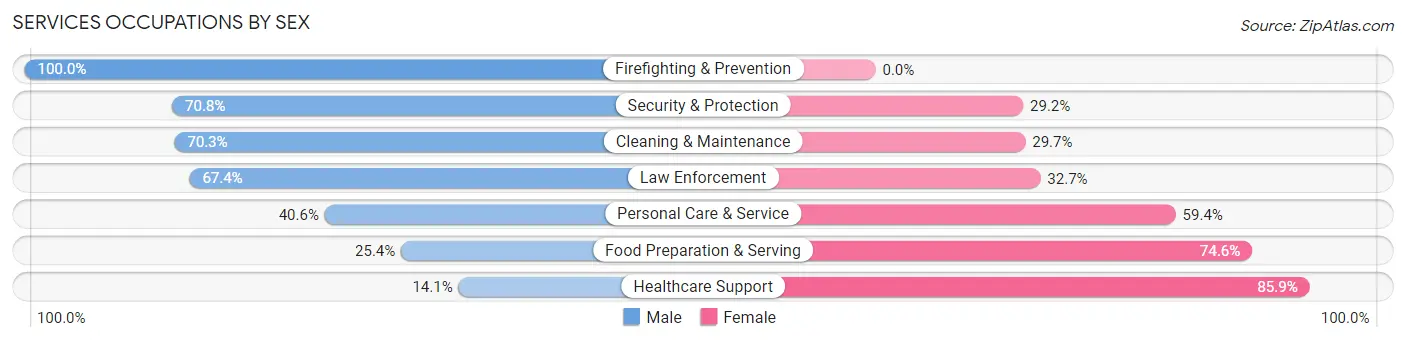
Services Occupations by Sex
Within the Services occupations in Mason County, the most male-oriented occupations are Firefighting & Prevention (100.0%), Security & Protection (70.8%), and Cleaning & Maintenance (70.3%), while the most female-oriented occupations are Healthcare Support (85.9%), Food Preparation & Serving (74.6%), and Personal Care & Service (59.4%).
| Occupation | Male | Female |
| Healthcare Support | 58 (14.1%) | 354 (85.9%) |
| Security & Protection | 155 (70.8%) | 64 (29.2%) |
| Firefighting & Prevention | 23 (100.0%) | 0 (0.0%) |
| Law Enforcement | 132 (67.3%) | 64 (32.7%) |
| Food Preparation & Serving | 87 (25.4%) | 255 (74.6%) |
| Cleaning & Maintenance | 313 (70.3%) | 132 (29.7%) |
| Personal Care & Service | 114 (40.6%) | 167 (59.4%) |
| Total (Category) | 727 (42.8%) | 972 (57.2%) |
| Total (Overall) | 5,370 (57.0%) | 4,047 (43.0%) |
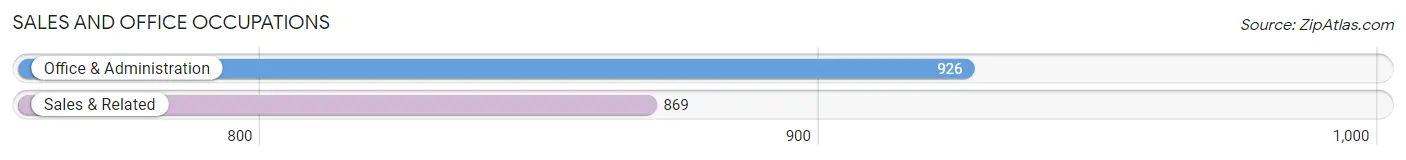
Sales and Office Occupations
The most common Sales and Office occupations in Mason County are Office & Administration (926 | 9.8%), and Sales & Related (869 | 9.2%).
Sales and Office Occupations by Sex
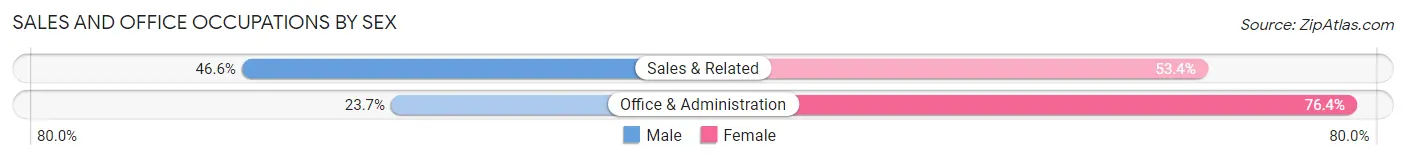
| Occupation | Male | Female |
| Sales & Related | 405 (46.6%) | 464 (53.4%) |
| Office & Administration | 219 (23.6%) | 707 (76.3%) |
| Total (Category) | 624 (34.8%) | 1,171 (65.2%) |
| Total (Overall) | 5,370 (57.0%) | 4,047 (43.0%) |
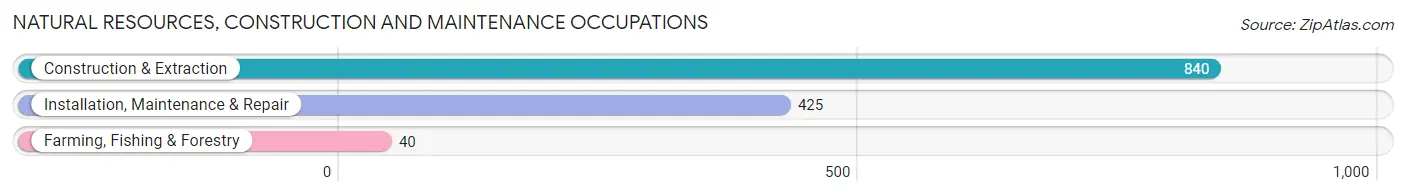
Natural Resources, Construction and Maintenance Occupations
The most common Natural Resources, Construction and Maintenance occupations in Mason County are Construction & Extraction (840 | 8.9%), Installation, Maintenance & Repair (425 | 4.5%), and Farming, Fishing & Forestry (40 | 0.4%).
Natural Resources, Construction and Maintenance Occupations by Sex
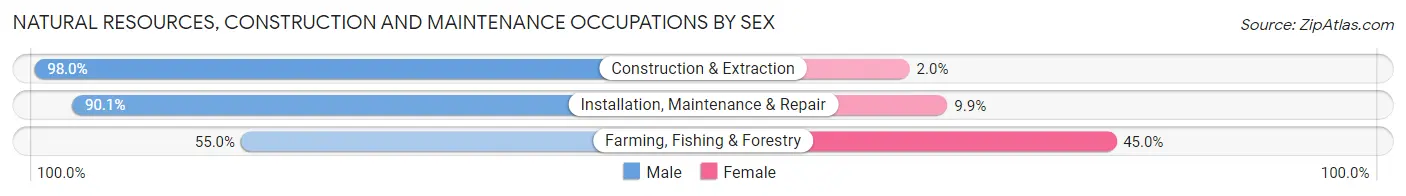
| Occupation | Male | Female |
| Farming, Fishing & Forestry | 22 (55.0%) | 18 (45.0%) |
| Construction & Extraction | 823 (98.0%) | 17 (2.0%) |
| Installation, Maintenance & Repair | 383 (90.1%) | 42 (9.9%) |
| Total (Category) | 1,228 (94.1%) | 77 (5.9%) |
| Total (Overall) | 5,370 (57.0%) | 4,047 (43.0%) |
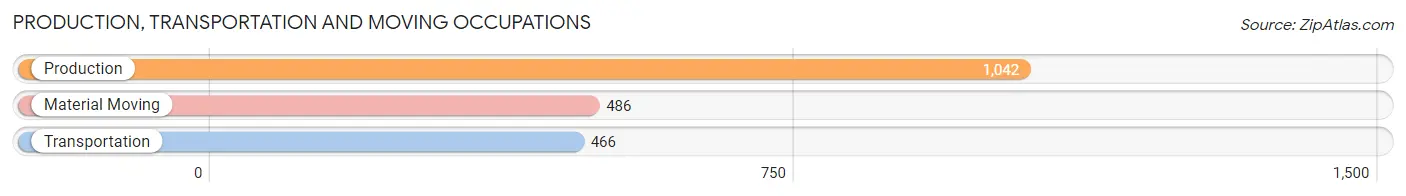
Production, Transportation and Moving Occupations
The most common Production, Transportation and Moving occupations in Mason County are Production (1,042 | 11.1%), Material Moving (486 | 5.2%), and Transportation (466 | 5.0%).
Production, Transportation and Moving Occupations by Sex
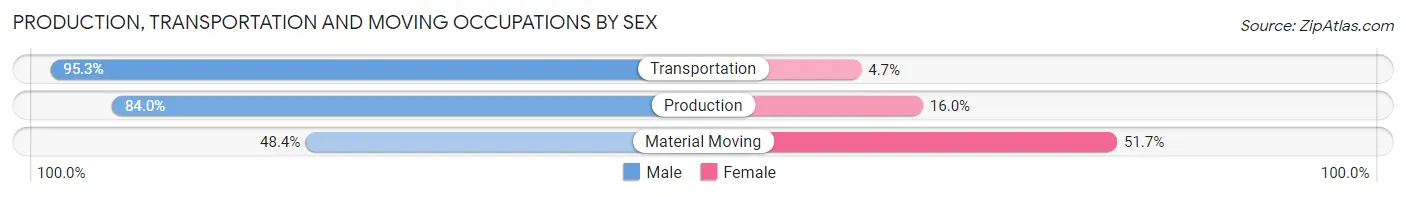
| Occupation | Male | Female |
| Production | 875 (84.0%) | 167 (16.0%) |
| Transportation | 444 (95.3%) | 22 (4.7%) |
| Material Moving | 235 (48.3%) | 251 (51.6%) |
| Total (Category) | 1,554 (77.9%) | 440 (22.1%) |
| Total (Overall) | 5,370 (57.0%) | 4,047 (43.0%) |
Employment Industries by Sex in Mason County
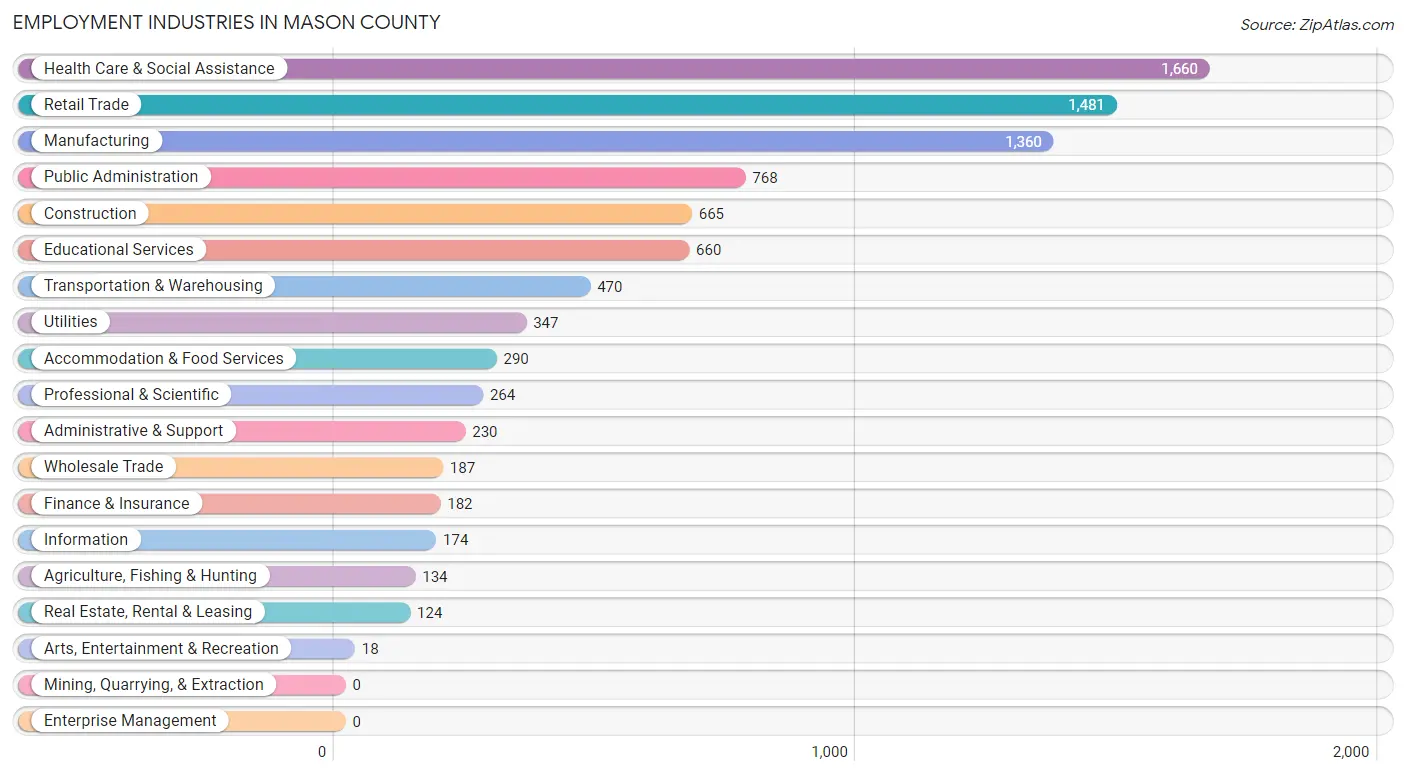
Employment Industries in Mason County
The major employment industries in Mason County include Health Care & Social Assistance (1,660 | 17.6%), Retail Trade (1,481 | 15.7%), Manufacturing (1,360 | 14.4%), Public Administration (768 | 8.2%), and Construction (665 | 7.1%).
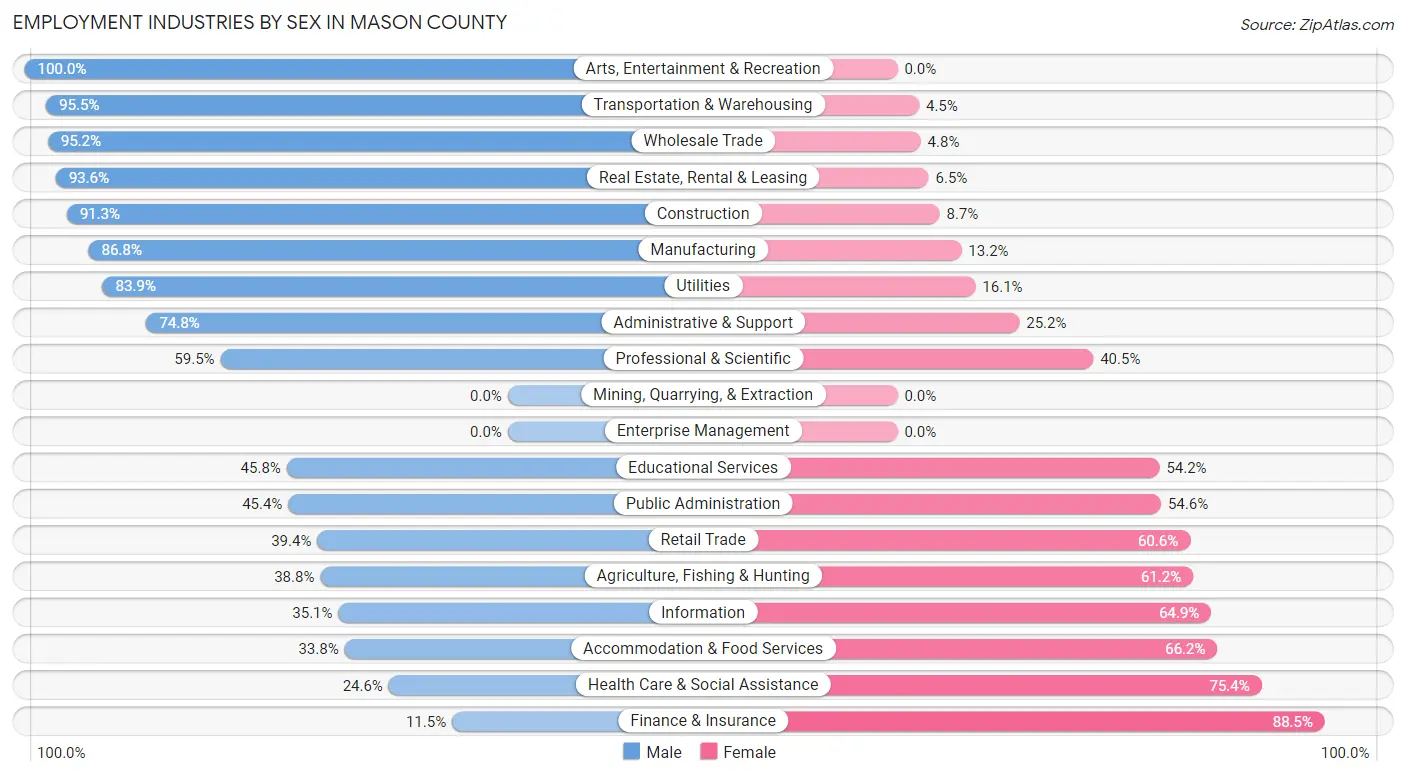
Employment Industries by Sex in Mason County
The Mason County industries that see more men than women are Arts, Entertainment & Recreation (100.0%), Transportation & Warehousing (95.5%), and Wholesale Trade (95.2%), whereas the industries that tend to have a higher number of women are Finance & Insurance (88.5%), Health Care & Social Assistance (75.4%), and Accommodation & Food Services (66.2%).
| Industry | Male | Female |
| Agriculture, Fishing & Hunting | 52 (38.8%) | 82 (61.2%) |
| Mining, Quarrying, & Extraction | 0 (0.0%) | 0 (0.0%) |
| Construction | 607 (91.3%) | 58 (8.7%) |
| Manufacturing | 1,180 (86.8%) | 180 (13.2%) |
| Wholesale Trade | 178 (95.2%) | 9 (4.8%) |
| Retail Trade | 584 (39.4%) | 897 (60.6%) |
| Transportation & Warehousing | 449 (95.5%) | 21 (4.5%) |
| Utilities | 291 (83.9%) | 56 (16.1%) |
| Information | 61 (35.1%) | 113 (64.9%) |
| Finance & Insurance | 21 (11.5%) | 161 (88.5%) |
| Real Estate, Rental & Leasing | 116 (93.5%) | 8 (6.5%) |
| Professional & Scientific | 157 (59.5%) | 107 (40.5%) |
| Enterprise Management | 0 (0.0%) | 0 (0.0%) |
| Administrative & Support | 172 (74.8%) | 58 (25.2%) |
| Educational Services | 302 (45.8%) | 358 (54.2%) |
| Health Care & Social Assistance | 409 (24.6%) | 1,251 (75.4%) |
| Arts, Entertainment & Recreation | 18 (100.0%) | 0 (0.0%) |
| Accommodation & Food Services | 98 (33.8%) | 192 (66.2%) |
| Public Administration | 349 (45.4%) | 419 (54.6%) |
| Total | 5,370 (57.0%) | 4,047 (43.0%) |
Education in Mason County
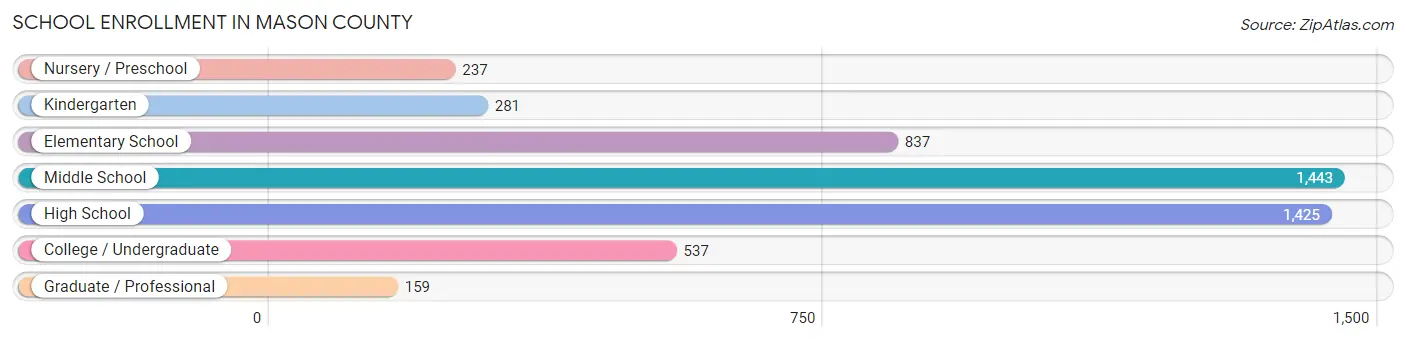
School Enrollment in Mason County
The most common levels of schooling among the 4,919 students in Mason County are middle school (1,443 | 29.3%), high school (1,425 | 29.0%), and elementary school (837 | 17.0%).
| School Level | # Students | % Students |
| Nursery / Preschool | 237 | 4.8% |
| Kindergarten | 281 | 5.7% |
| Elementary School | 837 | 17.0% |
| Middle School | 1,443 | 29.3% |
| High School | 1,425 | 29.0% |
| College / Undergraduate | 537 | 10.9% |
| Graduate / Professional | 159 | 3.2% |
| Total | 4,919 | 100.0% |
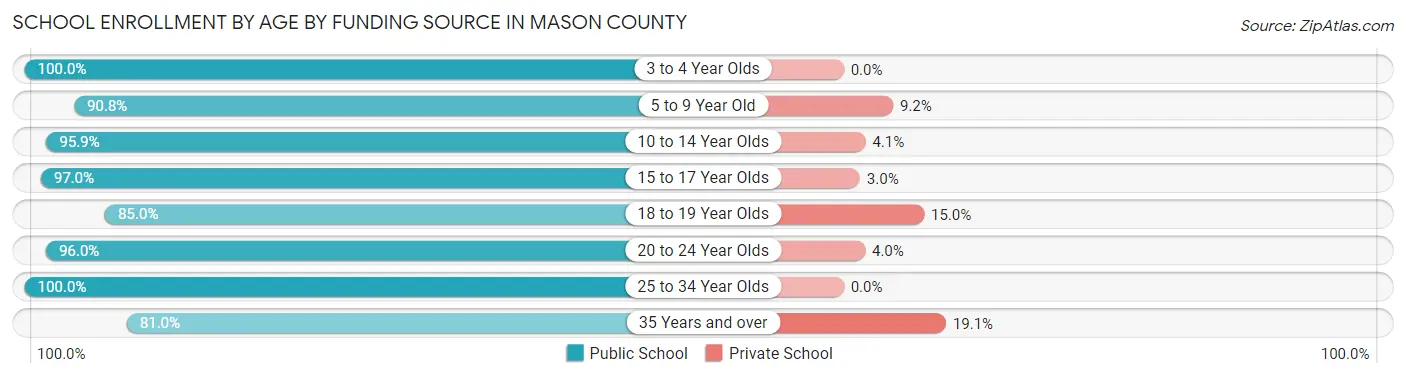
School Enrollment by Age by Funding Source in Mason County
Out of a total of 4,919 students who are enrolled in schools in Mason County, 295 (6.0%) attend a private institution, while the remaining 4,624 (94.0%) are enrolled in public schools. The age group of 35 years and over has the highest likelihood of being enrolled in private schools, with 32 (19.1% in the age bracket) enrolled. Conversely, the age group of 3 to 4 year olds has the lowest likelihood of being enrolled in a private school, with 135 (100.0% in the age bracket) attending a public institution.
| Age Bracket | Public School | Private School |
| 3 to 4 Year Olds | 135 (100.0%) | 0 (0.0%) |
| 5 to 9 Year Old | 1,036 (90.8%) | 105 (9.2%) |
| 10 to 14 Year Olds | 1,558 (95.9%) | 66 (4.1%) |
| 15 to 17 Year Olds | 866 (97.0%) | 27 (3.0%) |
| 18 to 19 Year Olds | 278 (85.0%) | 49 (15.0%) |
| 20 to 24 Year Olds | 338 (96.0%) | 14 (4.0%) |
| 25 to 34 Year Olds | 279 (100.0%) | 0 (0.0%) |
| 35 Years and over | 136 (80.9%) | 32 (19.1%) |
| Total | 4,624 (94.0%) | 295 (6.0%) |
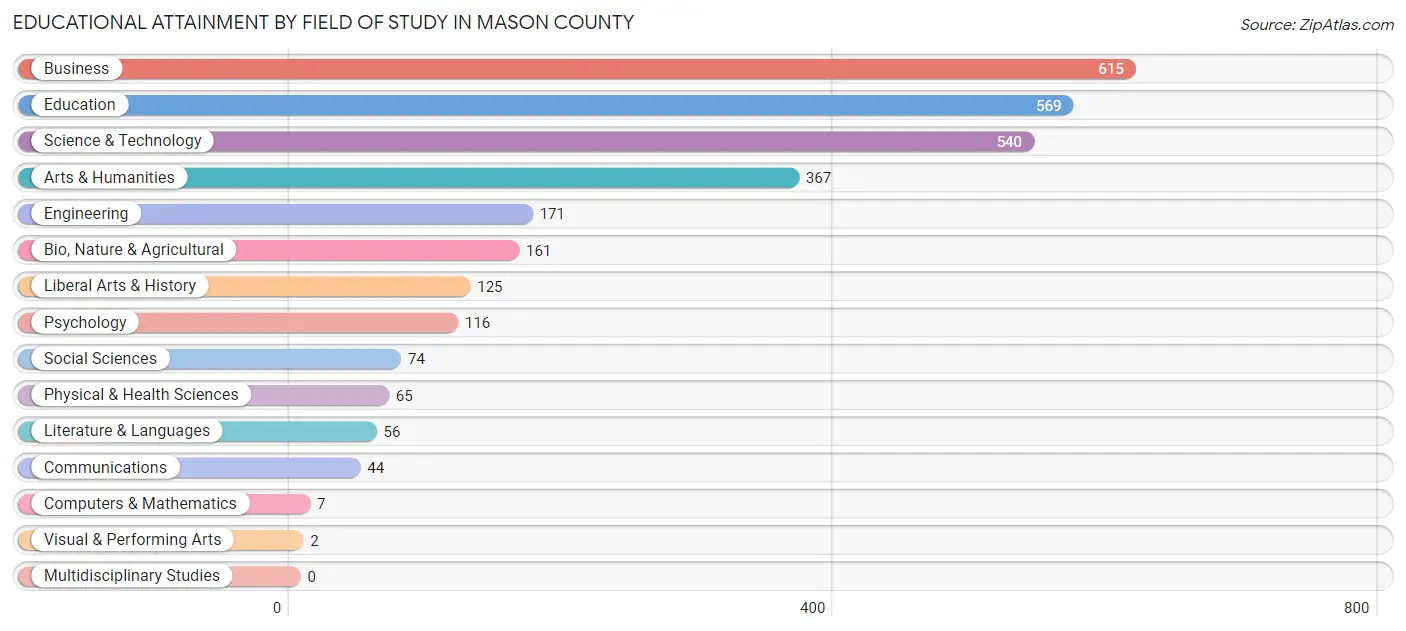
Educational Attainment by Field of Study in Mason County
Business (615 | 21.1%), education (569 | 19.5%), science & technology (540 | 18.5%), arts & humanities (367 | 12.6%), and engineering (171 | 5.9%) are the most common fields of study among 2,912 individuals in Mason County who have obtained a bachelor's degree or higher.
| Field of Study | # Graduates | % Graduates |
| Computers & Mathematics | 7 | 0.2% |
| Bio, Nature & Agricultural | 161 | 5.5% |
| Physical & Health Sciences | 65 | 2.2% |
| Psychology | 116 | 4.0% |
| Social Sciences | 74 | 2.5% |
| Engineering | 171 | 5.9% |
| Multidisciplinary Studies | 0 | 0.0% |
| Science & Technology | 540 | 18.5% |
| Business | 615 | 21.1% |
| Education | 569 | 19.5% |
| Literature & Languages | 56 | 1.9% |
| Liberal Arts & History | 125 | 4.3% |
| Visual & Performing Arts | 2 | 0.1% |
| Communications | 44 | 1.5% |
| Arts & Humanities | 367 | 12.6% |
| Total | 2,912 | 100.0% |
Transportation & Commute in Mason County
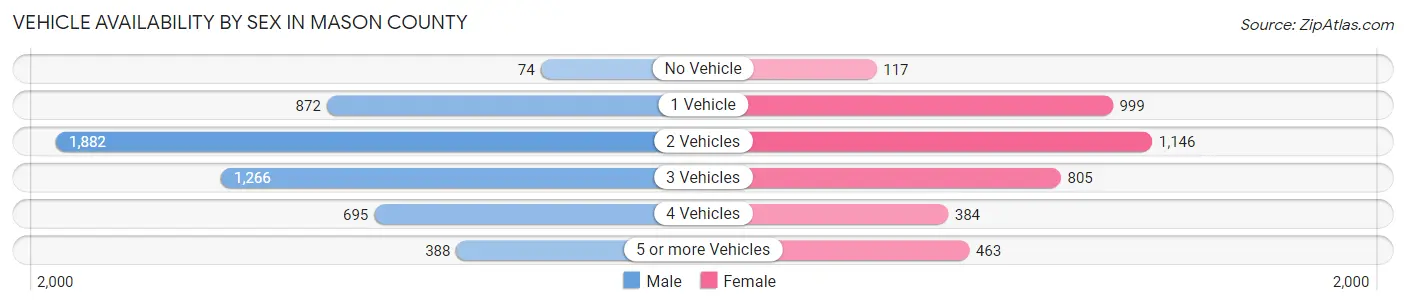
Vehicle Availability by Sex in Mason County
The most prevalent vehicle ownership categories in Mason County are males with 2 vehicles (1,882, accounting for 36.3%) and females with 2 vehicles (1,146, making up 48.1%).
| Vehicles Available | Male | Female |
| No Vehicle | 74 (1.4%) | 117 (3.0%) |
| 1 Vehicle | 872 (16.8%) | 999 (25.5%) |
| 2 Vehicles | 1,882 (36.3%) | 1,146 (29.3%) |
| 3 Vehicles | 1,266 (24.4%) | 805 (20.6%) |
| 4 Vehicles | 695 (13.4%) | 384 (9.8%) |
| 5 or more Vehicles | 388 (7.5%) | 463 (11.8%) |
| Total | 5,177 (100.0%) | 3,914 (100.0%) |
Commute Time in Mason County
The most frequently occuring commute durations in Mason County are 30 to 34 minutes (1,686 commuters, 19.1%), 15 to 19 minutes (1,549 commuters, 17.5%), and 5 to 9 minutes (931 commuters, 10.5%).
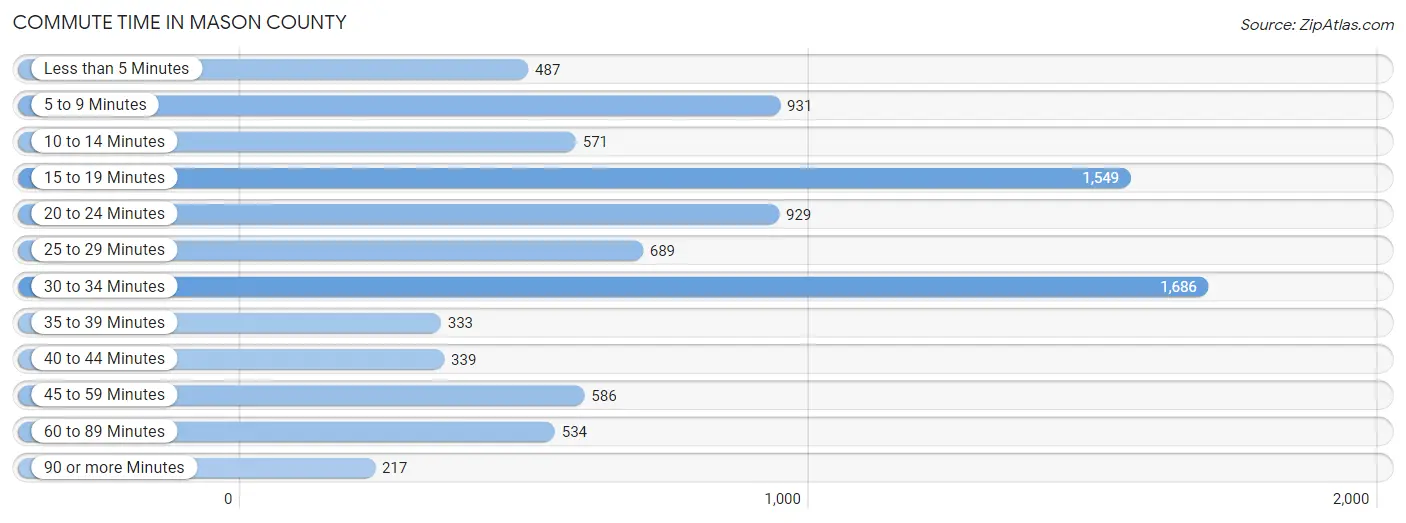
| Commute Time | # Commuters | % Commuters |
| Less than 5 Minutes | 487 | 5.5% |
| 5 to 9 Minutes | 931 | 10.5% |
| 10 to 14 Minutes | 571 | 6.5% |
| 15 to 19 Minutes | 1,549 | 17.5% |
| 20 to 24 Minutes | 929 | 10.5% |
| 25 to 29 Minutes | 689 | 7.8% |
| 30 to 34 Minutes | 1,686 | 19.1% |
| 35 to 39 Minutes | 333 | 3.8% |
| 40 to 44 Minutes | 339 | 3.8% |
| 45 to 59 Minutes | 586 | 6.6% |
| 60 to 89 Minutes | 534 | 6.0% |
| 90 or more Minutes | 217 | 2.5% |
Commute Time by Sex in Mason County
The most common commute times in Mason County are 30 to 34 minutes (848 commuters, 16.7%) for males and 30 to 34 minutes (838 commuters, 22.1%) for females.
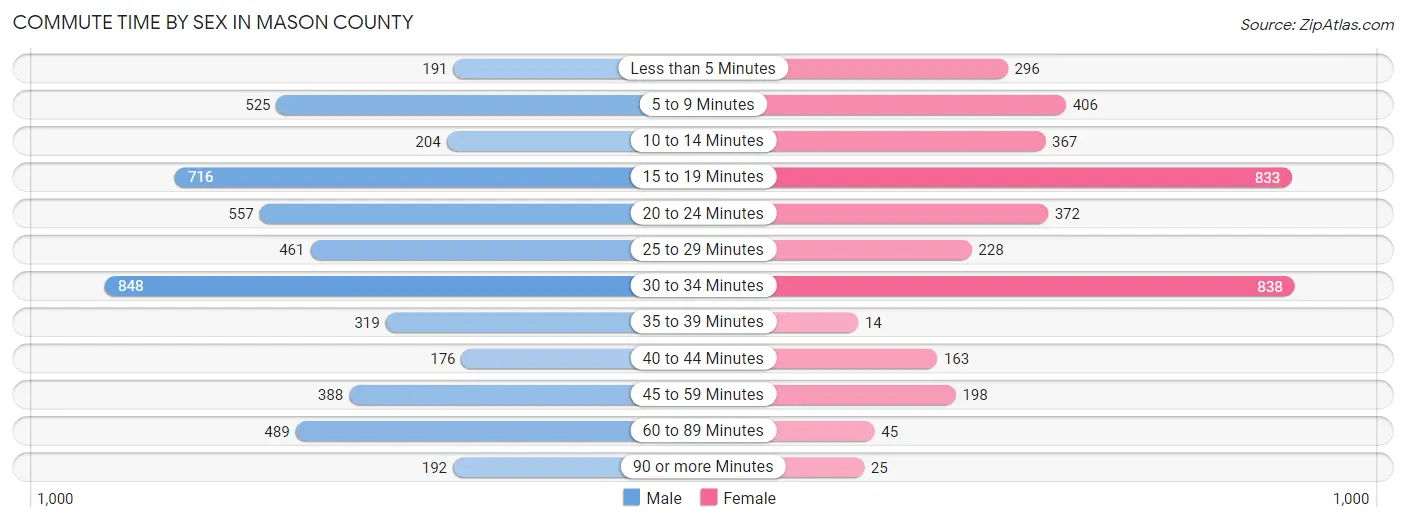
| Commute Time | Male | Female |
| Less than 5 Minutes | 191 (3.8%) | 296 (7.8%) |
| 5 to 9 Minutes | 525 (10.4%) | 406 (10.7%) |
| 10 to 14 Minutes | 204 (4.0%) | 367 (9.7%) |
| 15 to 19 Minutes | 716 (14.1%) | 833 (22.0%) |
| 20 to 24 Minutes | 557 (11.0%) | 372 (9.8%) |
| 25 to 29 Minutes | 461 (9.1%) | 228 (6.0%) |
| 30 to 34 Minutes | 848 (16.7%) | 838 (22.1%) |
| 35 to 39 Minutes | 319 (6.3%) | 14 (0.4%) |
| 40 to 44 Minutes | 176 (3.5%) | 163 (4.3%) |
| 45 to 59 Minutes | 388 (7.7%) | 198 (5.2%) |
| 60 to 89 Minutes | 489 (9.7%) | 45 (1.2%) |
| 90 or more Minutes | 192 (3.8%) | 25 (0.7%) |
Time of Departure to Work by Sex in Mason County
The most frequent times of departure to work in Mason County are 6:30 AM to 6:59 AM (979, 19.3%) for males and 7:00 AM to 7:29 AM (828, 21.9%) for females.
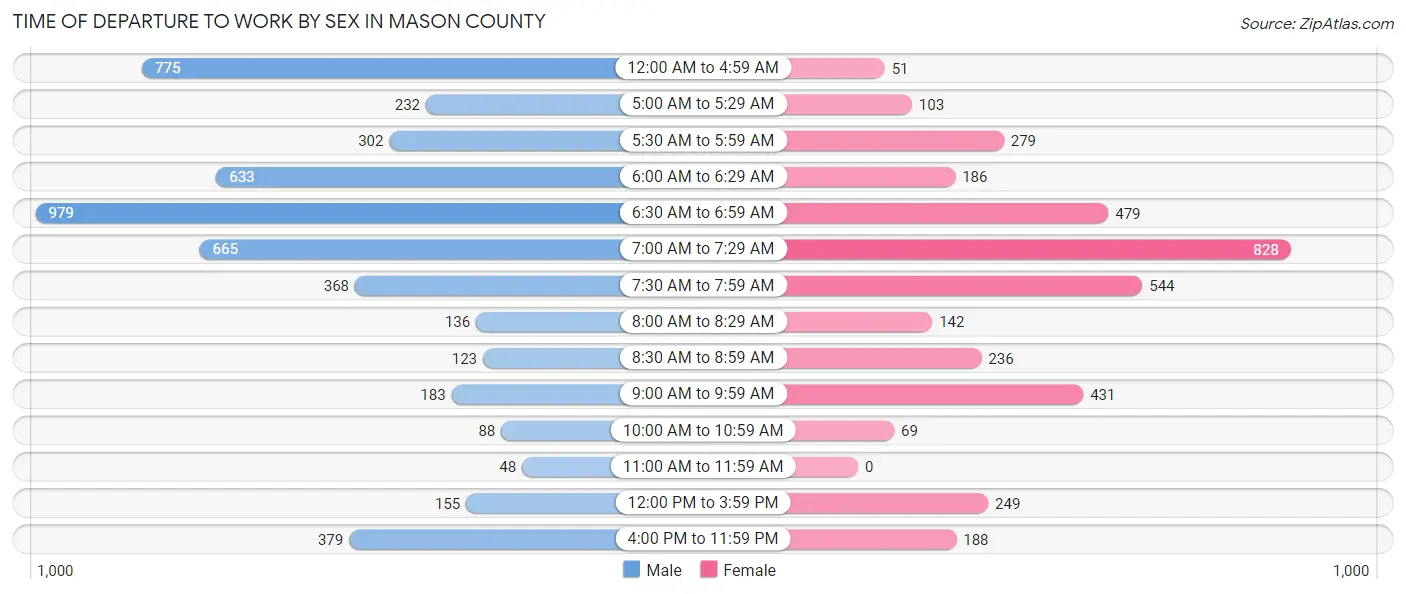
| Time of Departure | Male | Female |
| 12:00 AM to 4:59 AM | 775 (15.3%) | 51 (1.3%) |
| 5:00 AM to 5:29 AM | 232 (4.6%) | 103 (2.7%) |
| 5:30 AM to 5:59 AM | 302 (6.0%) | 279 (7.4%) |
| 6:00 AM to 6:29 AM | 633 (12.5%) | 186 (4.9%) |
| 6:30 AM to 6:59 AM | 979 (19.3%) | 479 (12.7%) |
| 7:00 AM to 7:29 AM | 665 (13.1%) | 828 (21.9%) |
| 7:30 AM to 7:59 AM | 368 (7.3%) | 544 (14.4%) |
| 8:00 AM to 8:29 AM | 136 (2.7%) | 142 (3.7%) |
| 8:30 AM to 8:59 AM | 123 (2.4%) | 236 (6.2%) |
| 9:00 AM to 9:59 AM | 183 (3.6%) | 431 (11.4%) |
| 10:00 AM to 10:59 AM | 88 (1.7%) | 69 (1.8%) |
| 11:00 AM to 11:59 AM | 48 (0.9%) | 0 (0.0%) |
| 12:00 PM to 3:59 PM | 155 (3.1%) | 249 (6.6%) |
| 4:00 PM to 11:59 PM | 379 (7.5%) | 188 (5.0%) |
| Total | 5,066 (100.0%) | 3,785 (100.0%) |
Housing Occupancy in Mason County
Occupancy by Ownership in Mason County
Of the total 10,120 dwellings in Mason County, owner-occupied units account for 8,525 (84.2%), while renter-occupied units make up 1,595 (15.8%).
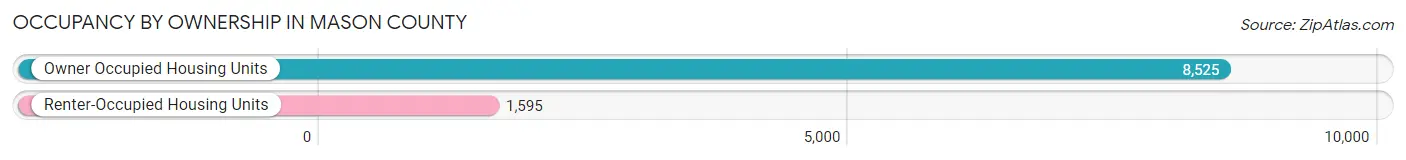
| Occupancy | # Housing Units | % Housing Units |
| Owner Occupied Housing Units | 8,525 | 84.2% |
| Renter-Occupied Housing Units | 1,595 | 15.8% |
| Total Occupied Housing Units | 10,120 | 100.0% |
Occupancy by Household Size in Mason County
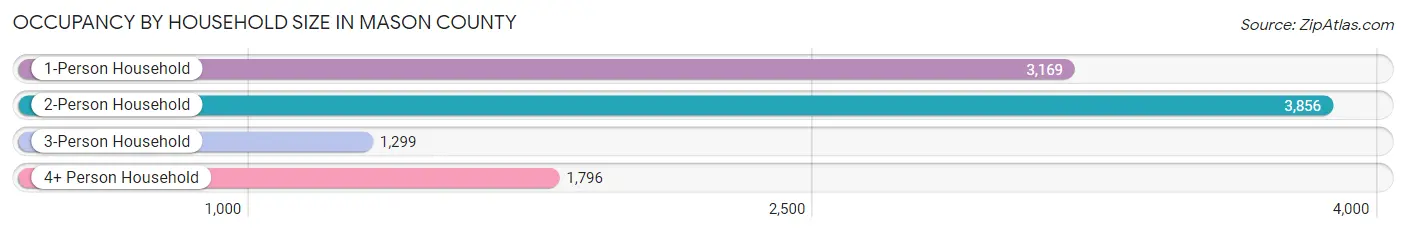
| Household Size | # Housing Units | % Housing Units |
| 1-Person Household | 3,169 | 31.3% |
| 2-Person Household | 3,856 | 38.1% |
| 3-Person Household | 1,299 | 12.8% |
| 4+ Person Household | 1,796 | 17.7% |
| Total Housing Units | 10,120 | 100.0% |
Occupancy by Ownership by Household Size in Mason County
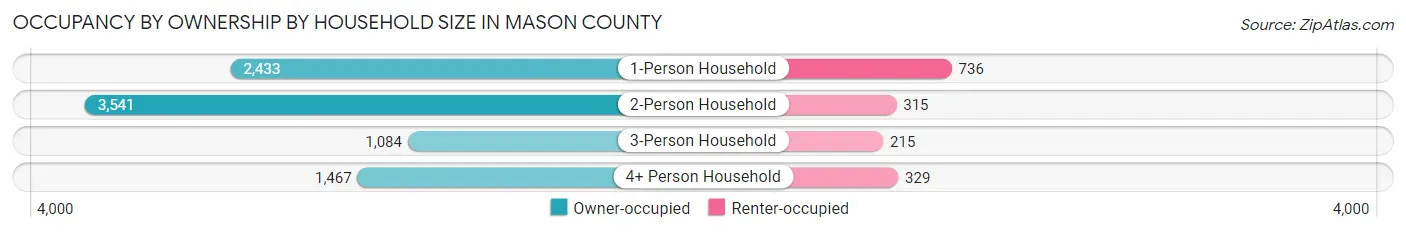
| Household Size | Owner-occupied | Renter-occupied |
| 1-Person Household | 2,433 (76.8%) | 736 (23.2%) |
| 2-Person Household | 3,541 (91.8%) | 315 (8.2%) |
| 3-Person Household | 1,084 (83.5%) | 215 (16.6%) |
| 4+ Person Household | 1,467 (81.7%) | 329 (18.3%) |
| Total Housing Units | 8,525 (84.2%) | 1,595 (15.8%) |
Occupancy by Educational Attainment in Mason County
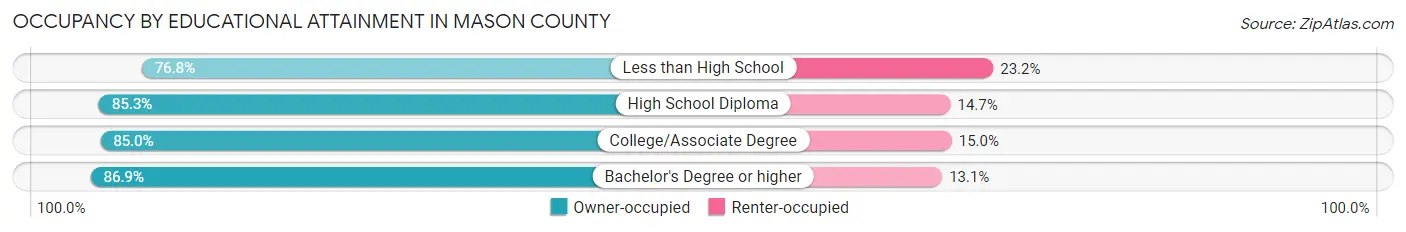
| Household Size | Owner-occupied | Renter-occupied |
| Less than High School | 1,117 (76.8%) | 338 (23.2%) |
| High School Diploma | 3,279 (85.3%) | 567 (14.7%) |
| College/Associate Degree | 2,635 (85.0%) | 465 (15.0%) |
| Bachelor's Degree or higher | 1,494 (86.9%) | 225 (13.1%) |
Occupancy by Age of Householder in Mason County
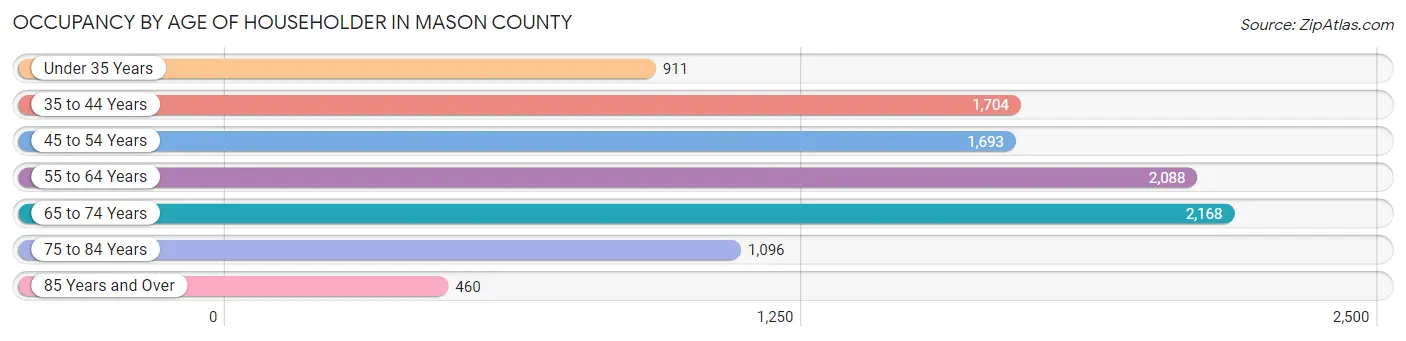
| Age Bracket | # Households | % Households |
| Under 35 Years | 911 | 9.0% |
| 35 to 44 Years | 1,704 | 16.8% |
| 45 to 54 Years | 1,693 | 16.7% |
| 55 to 64 Years | 2,088 | 20.6% |
| 65 to 74 Years | 2,168 | 21.4% |
| 75 to 84 Years | 1,096 | 10.8% |
| 85 Years and Over | 460 | 4.5% |
| Total | 10,120 | 100.0% |
Housing Finances in Mason County
Median Income by Occupancy in Mason County
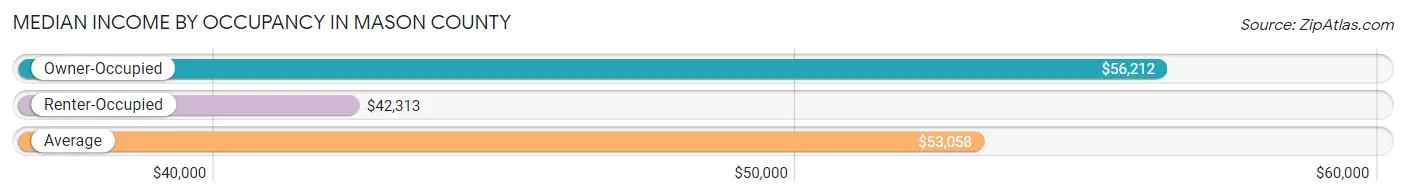
| Occupancy Type | # Households | Median Income |
| Owner-Occupied | 8,525 (84.2%) | $56,212 |
| Renter-Occupied | 1,595 (15.8%) | $42,313 |
| Average | 10,120 (100.0%) | $53,058 |
Occupancy by Householder Income Bracket in Mason County
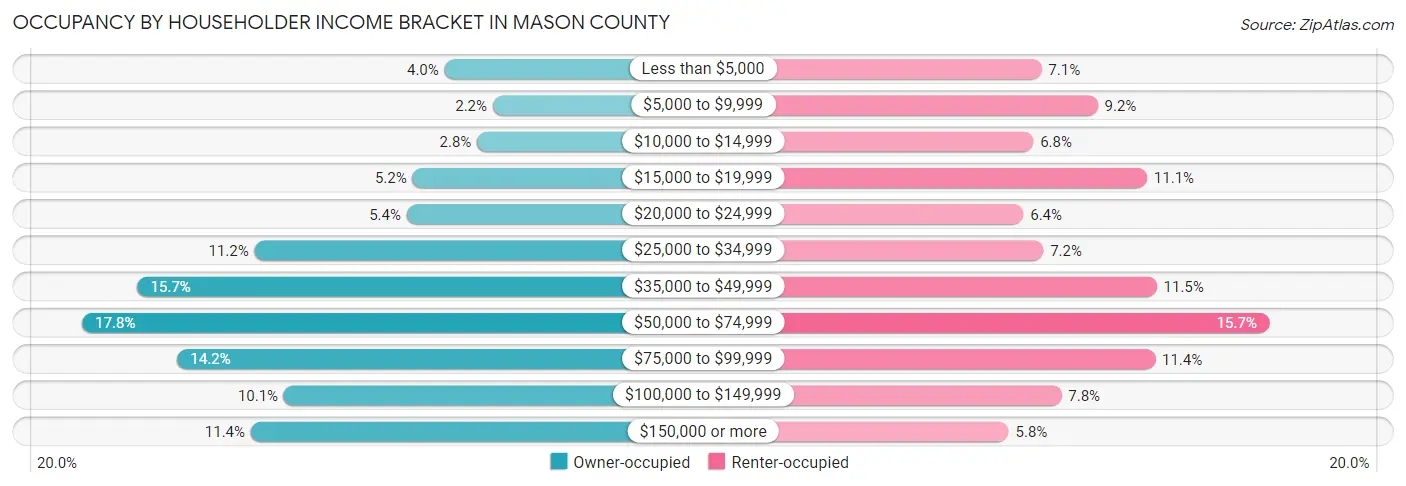
| Income Bracket | Owner-occupied | Renter-occupied |
| Less than $5,000 | 341 (4.0%) | 113 (7.1%) |
| $5,000 to $9,999 | 184 (2.2%) | 147 (9.2%) |
| $10,000 to $14,999 | 235 (2.8%) | 108 (6.8%) |
| $15,000 to $19,999 | 445 (5.2%) | 177 (11.1%) |
| $20,000 to $24,999 | 464 (5.4%) | 102 (6.4%) |
| $25,000 to $34,999 | 958 (11.2%) | 114 (7.1%) |
| $35,000 to $49,999 | 1,338 (15.7%) | 183 (11.5%) |
| $50,000 to $74,999 | 1,518 (17.8%) | 251 (15.7%) |
| $75,000 to $99,999 | 1,209 (14.2%) | 182 (11.4%) |
| $100,000 to $149,999 | 863 (10.1%) | 125 (7.8%) |
| $150,000 or more | 970 (11.4%) | 93 (5.8%) |
| Total | 8,525 (100.0%) | 1,595 (100.0%) |
Monthly Housing Cost Tiers in Mason County
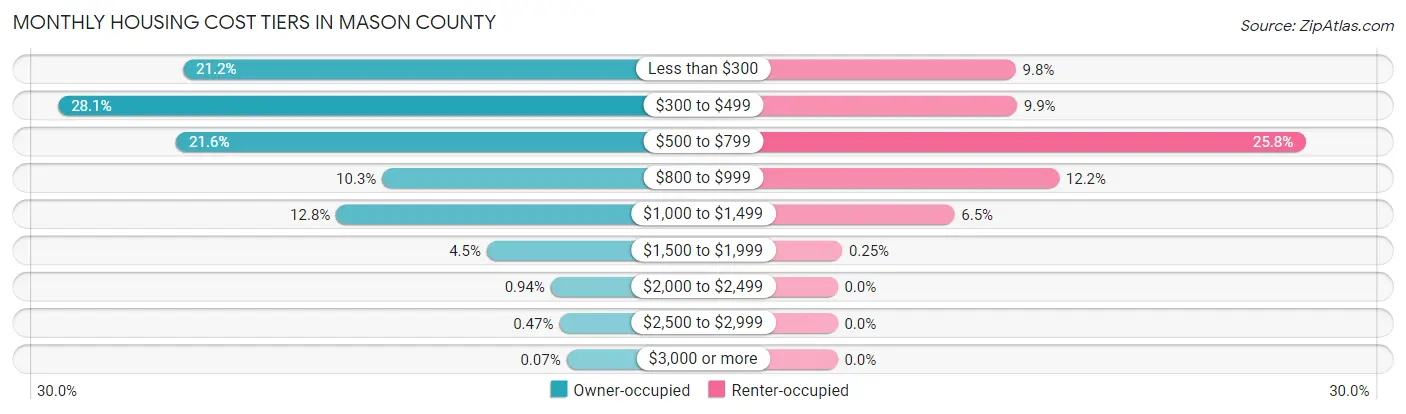
| Monthly Cost | Owner-occupied | Renter-occupied |
| Less than $300 | 1,811 (21.2%) | 157 (9.8%) |
| $300 to $499 | 2,399 (28.1%) | 158 (9.9%) |
| $500 to $799 | 1,844 (21.6%) | 412 (25.8%) |
| $800 to $999 | 874 (10.2%) | 195 (12.2%) |
| $1,000 to $1,499 | 1,090 (12.8%) | 103 (6.5%) |
| $1,500 to $1,999 | 381 (4.5%) | 4 (0.3%) |
| $2,000 to $2,499 | 80 (0.9%) | 0 (0.0%) |
| $2,500 to $2,999 | 40 (0.5%) | 0 (0.0%) |
| $3,000 or more | 6 (0.1%) | 0 (0.0%) |
| Total | 8,525 (100.0%) | 1,595 (100.0%) |
Physical Housing Characteristics in Mason County
Housing Structures in Mason County
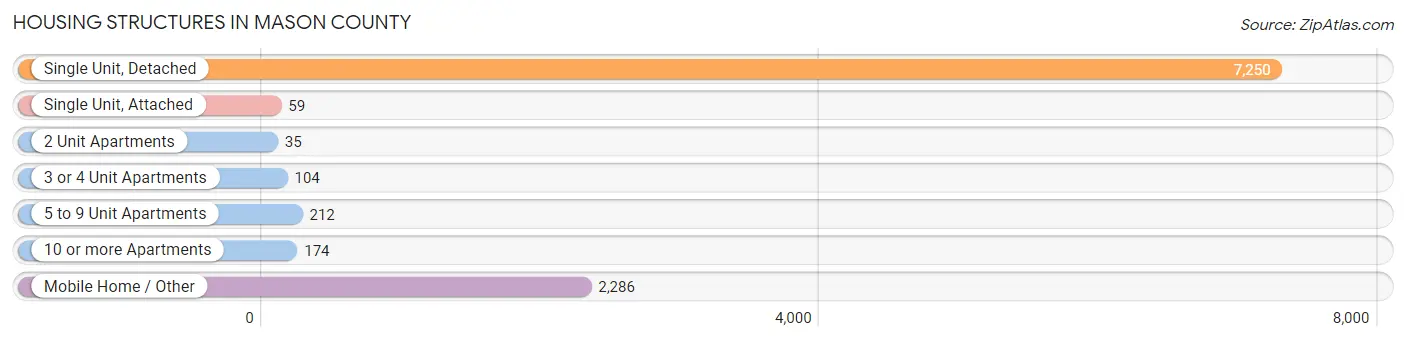
| Structure Type | # Housing Units | % Housing Units |
| Single Unit, Detached | 7,250 | 71.6% |
| Single Unit, Attached | 59 | 0.6% |
| 2 Unit Apartments | 35 | 0.4% |
| 3 or 4 Unit Apartments | 104 | 1.0% |
| 5 to 9 Unit Apartments | 212 | 2.1% |
| 10 or more Apartments | 174 | 1.7% |
| Mobile Home / Other | 2,286 | 22.6% |
| Total | 10,120 | 100.0% |
Housing Structures by Occupancy in Mason County
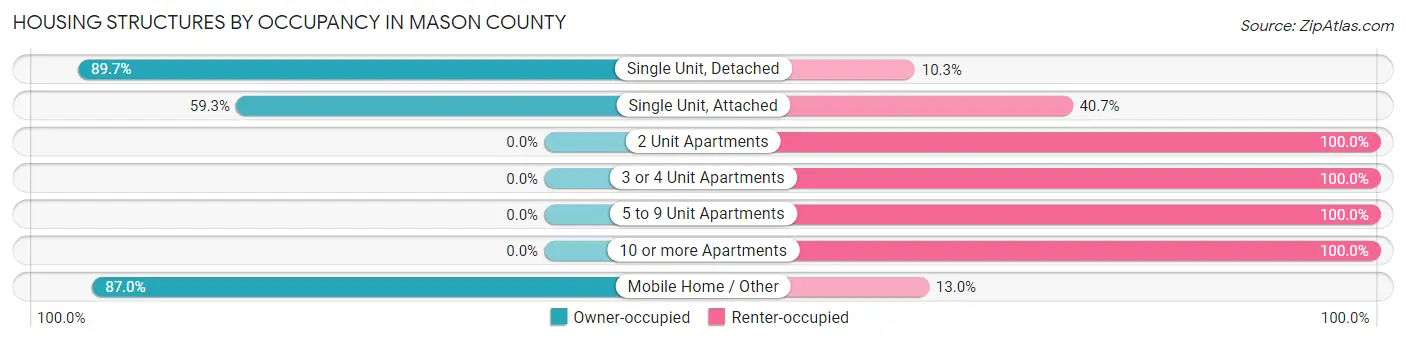
| Structure Type | Owner-occupied | Renter-occupied |
| Single Unit, Detached | 6,502 (89.7%) | 748 (10.3%) |
| Single Unit, Attached | 35 (59.3%) | 24 (40.7%) |
| 2 Unit Apartments | 0 (0.0%) | 35 (100.0%) |
| 3 or 4 Unit Apartments | 0 (0.0%) | 104 (100.0%) |
| 5 to 9 Unit Apartments | 0 (0.0%) | 212 (100.0%) |
| 10 or more Apartments | 0 (0.0%) | 174 (100.0%) |
| Mobile Home / Other | 1,988 (87.0%) | 298 (13.0%) |
| Total | 8,525 (84.2%) | 1,595 (15.8%) |
Housing Structures by Number of Rooms in Mason County
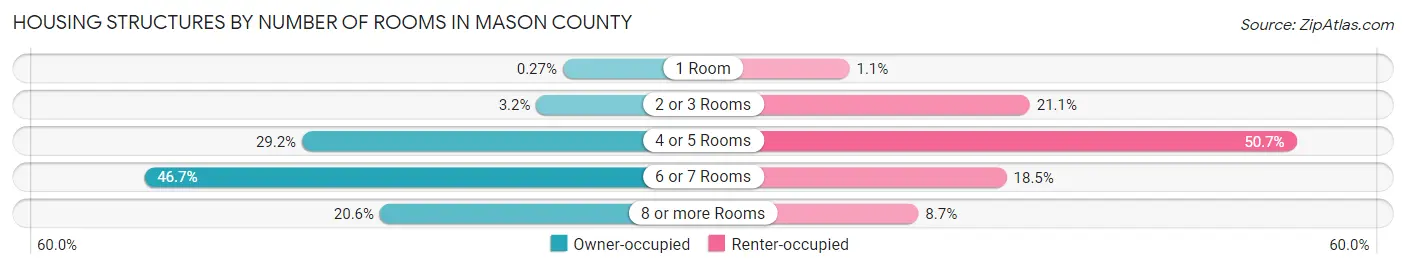
| Number of Rooms | Owner-occupied | Renter-occupied |
| 1 Room | 23 (0.3%) | 17 (1.1%) |
| 2 or 3 Rooms | 274 (3.2%) | 336 (21.1%) |
| 4 or 5 Rooms | 2,491 (29.2%) | 808 (50.7%) |
| 6 or 7 Rooms | 3,983 (46.7%) | 295 (18.5%) |
| 8 or more Rooms | 1,754 (20.6%) | 139 (8.7%) |
| Total | 8,525 (100.0%) | 1,595 (100.0%) |
Housing Structure by Heating Type in Mason County
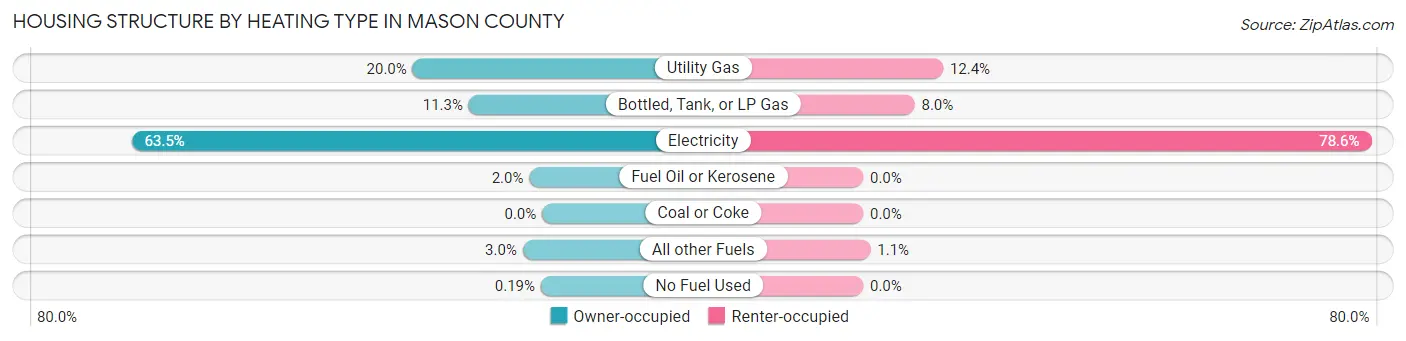
| Heating Type | Owner-occupied | Renter-occupied |
| Utility Gas | 1,707 (20.0%) | 197 (12.3%) |
| Bottled, Tank, or LP Gas | 966 (11.3%) | 127 (8.0%) |
| Electricity | 5,412 (63.5%) | 1,253 (78.6%) |
| Fuel Oil or Kerosene | 169 (2.0%) | 0 (0.0%) |
| Coal or Coke | 0 (0.0%) | 0 (0.0%) |
| All other Fuels | 255 (3.0%) | 18 (1.1%) |
| No Fuel Used | 16 (0.2%) | 0 (0.0%) |
| Total | 8,525 (100.0%) | 1,595 (100.0%) |
Household Vehicle Usage in Mason County
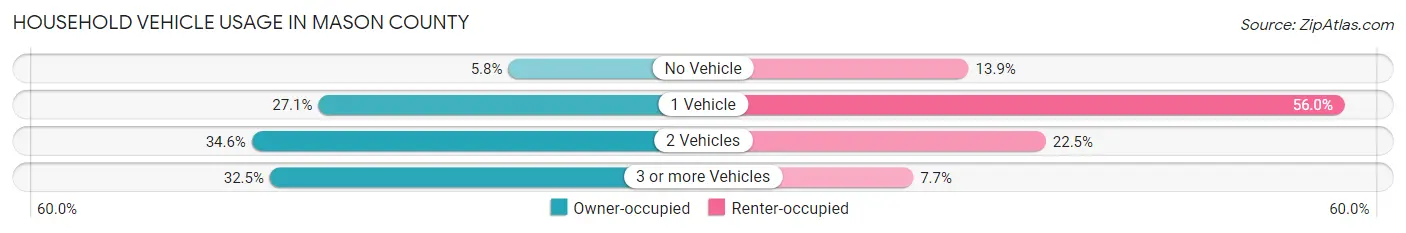
| Vehicles per Household | Owner-occupied | Renter-occupied |
| No Vehicle | 496 (5.8%) | 221 (13.9%) |
| 1 Vehicle | 2,310 (27.1%) | 893 (56.0%) |
| 2 Vehicles | 2,946 (34.6%) | 359 (22.5%) |
| 3 or more Vehicles | 2,773 (32.5%) | 122 (7.6%) |
| Total | 8,525 (100.0%) | 1,595 (100.0%) |
Real Estate & Mortgages in Mason County
Real Estate and Mortgage Overview in Mason County
| Characteristic | Without Mortgage | With Mortgage |
| Housing Units | 5,583 | 2,942 |
| Median Property Value | $100,000 | $140,400 |
| Median Household Income | $42,546 | $447 |
| Monthly Housing Costs | $398 | $6 |
| Real Estate Taxes | $661 | $87 |
Property Value by Mortgage Status in Mason County
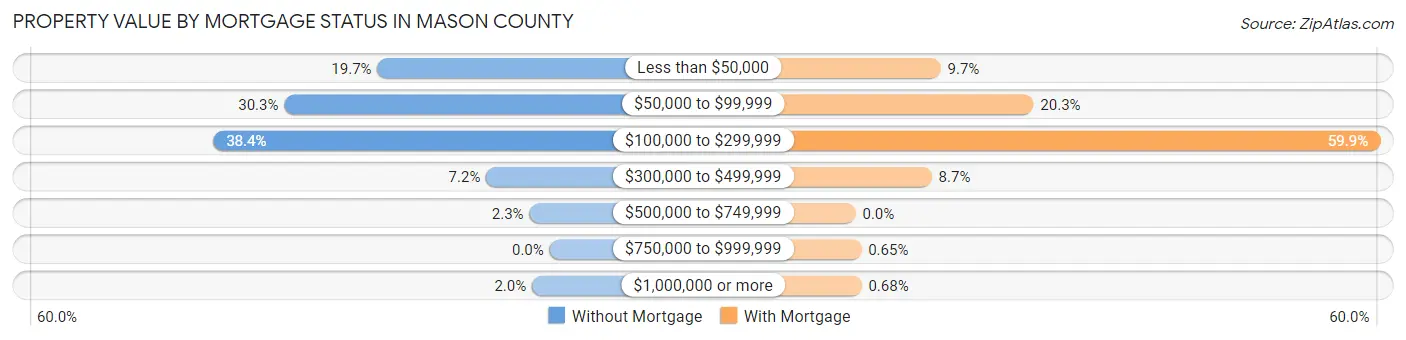
| Property Value | Without Mortgage | With Mortgage |
| Less than $50,000 | 1,099 (19.7%) | 286 (9.7%) |
| $50,000 to $99,999 | 1,693 (30.3%) | 598 (20.3%) |
| $100,000 to $299,999 | 2,146 (38.4%) | 1,763 (59.9%) |
| $300,000 to $499,999 | 404 (7.2%) | 256 (8.7%) |
| $500,000 to $749,999 | 129 (2.3%) | 0 (0.0%) |
| $750,000 to $999,999 | 0 (0.0%) | 19 (0.6%) |
| $1,000,000 or more | 112 (2.0%) | 20 (0.7%) |
| Total | 5,583 (100.0%) | 2,942 (100.0%) |
Household Income by Mortgage Status in Mason County
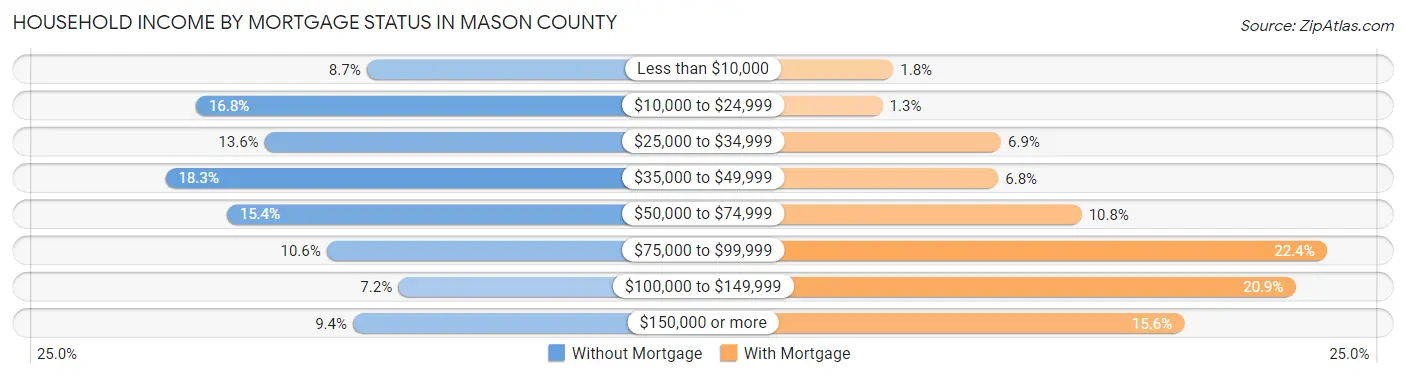
| Household Income | Without Mortgage | With Mortgage |
| Less than $10,000 | 487 (8.7%) | 53 (1.8%) |
| $10,000 to $24,999 | 940 (16.8%) | 38 (1.3%) |
| $25,000 to $34,999 | 758 (13.6%) | 204 (6.9%) |
| $35,000 to $49,999 | 1,021 (18.3%) | 200 (6.8%) |
| $50,000 to $74,999 | 858 (15.4%) | 317 (10.8%) |
| $75,000 to $99,999 | 593 (10.6%) | 660 (22.4%) |
| $100,000 to $149,999 | 403 (7.2%) | 616 (20.9%) |
| $150,000 or more | 523 (9.4%) | 460 (15.6%) |
| Total | 5,583 (100.0%) | 2,942 (100.0%) |
Property Value to Household Income Ratio in Mason County
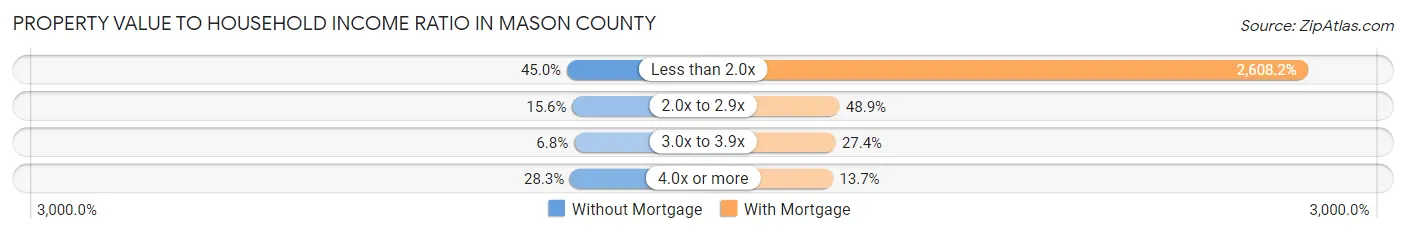
| Value-to-Income Ratio | Without Mortgage | With Mortgage |
| Less than 2.0x | 2,514 (45.0%) | 76,733 (2,608.2%) |
| 2.0x to 2.9x | 870 (15.6%) | 1,439 (48.9%) |
| 3.0x to 3.9x | 380 (6.8%) | 806 (27.4%) |
| 4.0x or more | 1,582 (28.3%) | 402 (13.7%) |
| Total | 5,583 (100.0%) | 2,942 (100.0%) |
Real Estate Taxes by Mortgage Status in Mason County
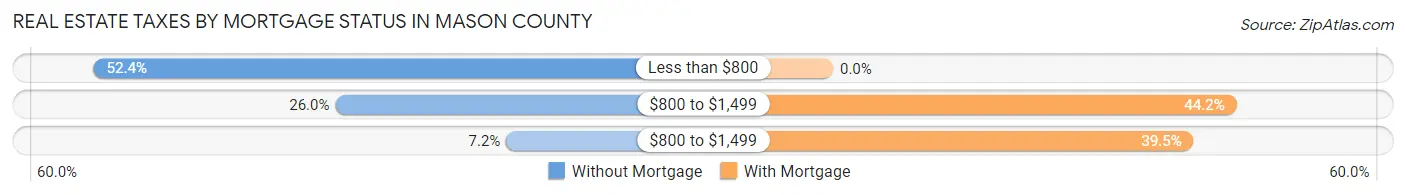
| Property Taxes | Without Mortgage | With Mortgage |
| Less than $800 | 2,927 (52.4%) | 0 (0.0%) |
| $800 to $1,499 | 1,449 (26.0%) | 1,301 (44.2%) |
| $800 to $1,499 | 403 (7.2%) | 1,162 (39.5%) |
| Total | 5,583 (100.0%) | 2,942 (100.0%) |
Health & Disability in Mason County
Health Insurance Coverage by Age in Mason County
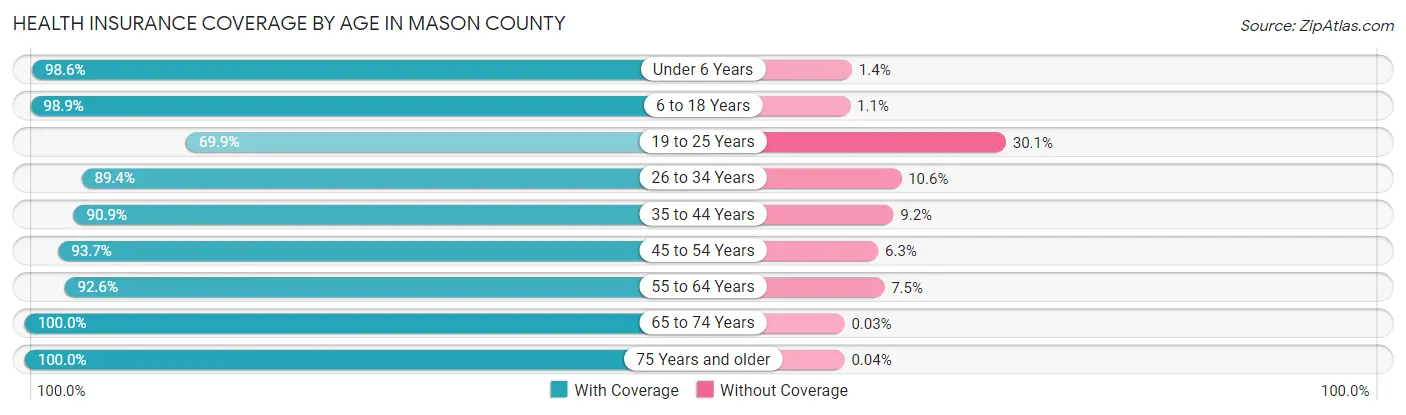
| Age Bracket | With Coverage | Without Coverage |
| Under 6 Years | 1,522 (98.6%) | 22 (1.4%) |
| 6 to 18 Years | 3,985 (98.9%) | 44 (1.1%) |
| 19 to 25 Years | 1,244 (69.9%) | 536 (30.1%) |
| 26 to 34 Years | 1,995 (89.4%) | 237 (10.6%) |
| 35 to 44 Years | 2,709 (90.8%) | 273 (9.1%) |
| 45 to 54 Years | 2,851 (93.7%) | 192 (6.3%) |
| 55 to 64 Years | 3,467 (92.5%) | 279 (7.4%) |
| 65 to 74 Years | 3,150 (100.0%) | 1 (0.0%) |
| 75 Years and older | 2,265 (100.0%) | 1 (0.0%) |
| Total | 23,188 (93.6%) | 1,585 (6.4%) |
Health Insurance Coverage by Citizenship Status in Mason County
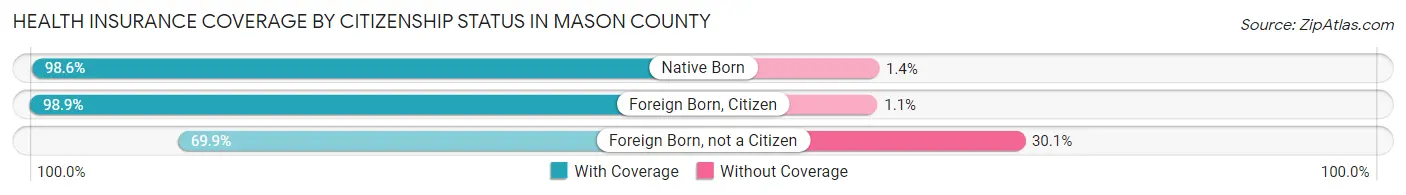
| Citizenship Status | With Coverage | Without Coverage |
| Native Born | 1,522 (98.6%) | 22 (1.4%) |
| Foreign Born, Citizen | 3,985 (98.9%) | 44 (1.1%) |
| Foreign Born, not a Citizen | 1,244 (69.9%) | 536 (30.1%) |
Health Insurance Coverage by Household Income in Mason County
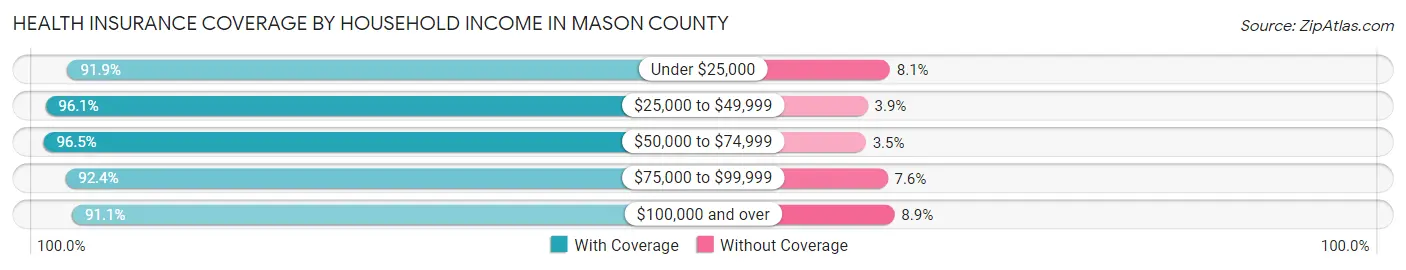
| Household Income | With Coverage | Without Coverage |
| Under $25,000 | 3,971 (91.9%) | 348 (8.1%) |
| $25,000 to $49,999 | 5,431 (96.1%) | 220 (3.9%) |
| $50,000 to $74,999 | 4,393 (96.5%) | 161 (3.5%) |
| $75,000 to $99,999 | 3,597 (92.4%) | 297 (7.6%) |
| $100,000 and over | 5,705 (91.1%) | 559 (8.9%) |
Public vs Private Health Insurance Coverage by Age in Mason County
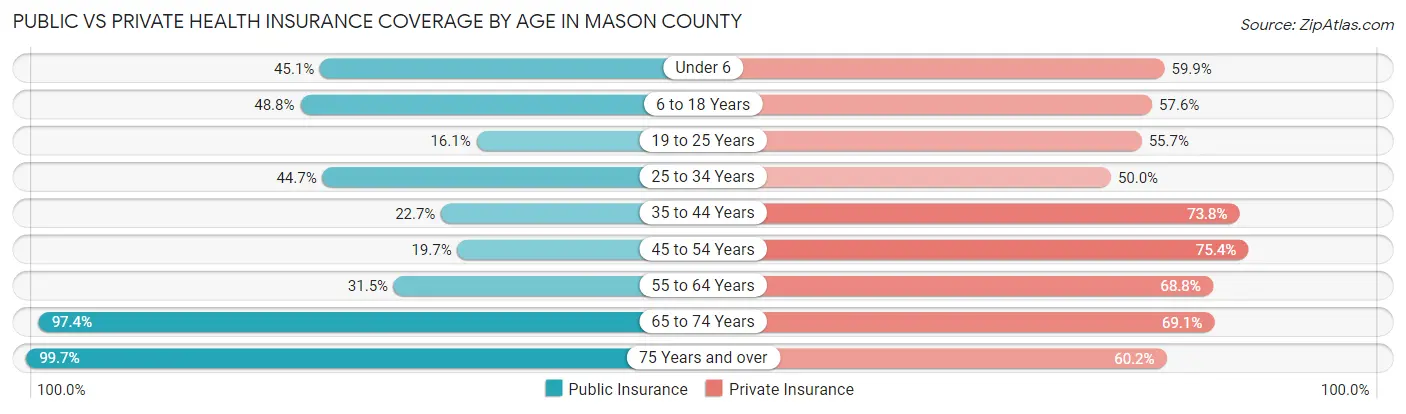
| Age Bracket | Public Insurance | Private Insurance |
| Under 6 | 697 (45.1%) | 925 (59.9%) |
| 6 to 18 Years | 1,967 (48.8%) | 2,321 (57.6%) |
| 19 to 25 Years | 287 (16.1%) | 991 (55.7%) |
| 25 to 34 Years | 998 (44.7%) | 1,115 (50.0%) |
| 35 to 44 Years | 676 (22.7%) | 2,200 (73.8%) |
| 45 to 54 Years | 598 (19.7%) | 2,295 (75.4%) |
| 55 to 64 Years | 1,178 (31.5%) | 2,578 (68.8%) |
| 65 to 74 Years | 3,068 (97.4%) | 2,177 (69.1%) |
| 75 Years and over | 2,259 (99.7%) | 1,365 (60.2%) |
| Total | 11,728 (47.3%) | 15,967 (64.4%) |
Disability Status by Sex by Age in Mason County
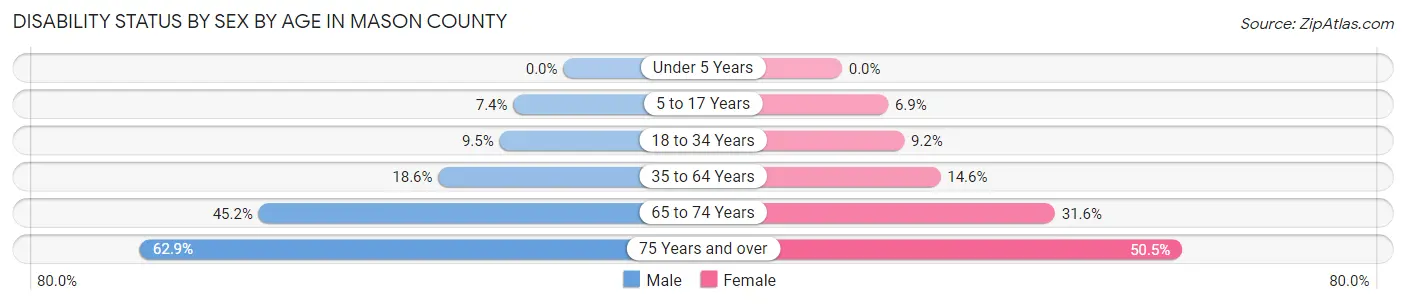
| Age Bracket | Male | Female |
| Under 5 Years | 0 (0.0%) | 0 (0.0%) |
| 5 to 17 Years | 161 (7.4%) | 123 (6.9%) |
| 18 to 34 Years | 207 (9.5%) | 192 (9.2%) |
| 35 to 64 Years | 919 (18.6%) | 705 (14.6%) |
| 65 to 74 Years | 673 (45.2%) | 526 (31.6%) |
| 75 Years and over | 615 (62.9%) | 651 (50.5%) |
Disability Class by Sex by Age in Mason County
Disability Class: Hearing Difficulty
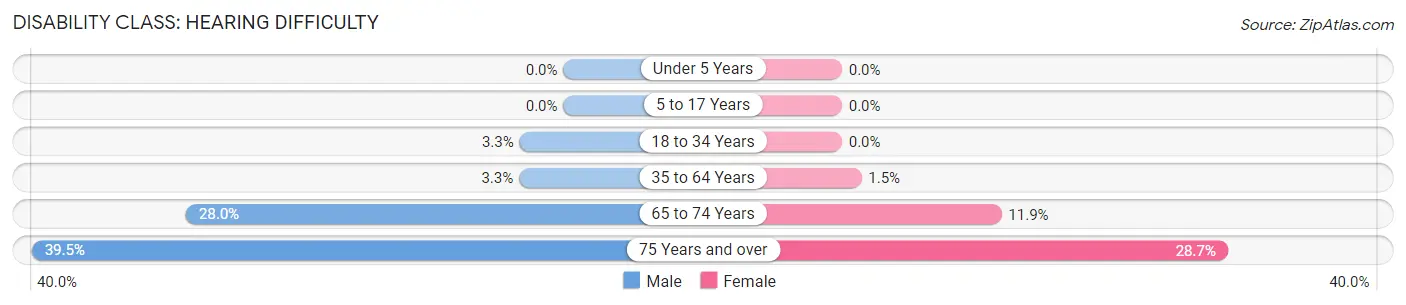
| Age Bracket | Male | Female |
| Under 5 Years | 0 (0.0%) | 0 (0.0%) |
| 5 to 17 Years | 0 (0.0%) | 0 (0.0%) |
| 18 to 34 Years | 71 (3.3%) | 0 (0.0%) |
| 35 to 64 Years | 163 (3.3%) | 70 (1.5%) |
| 65 to 74 Years | 417 (28.0%) | 197 (11.8%) |
| 75 Years and over | 386 (39.5%) | 369 (28.6%) |
Disability Class: Vision Difficulty
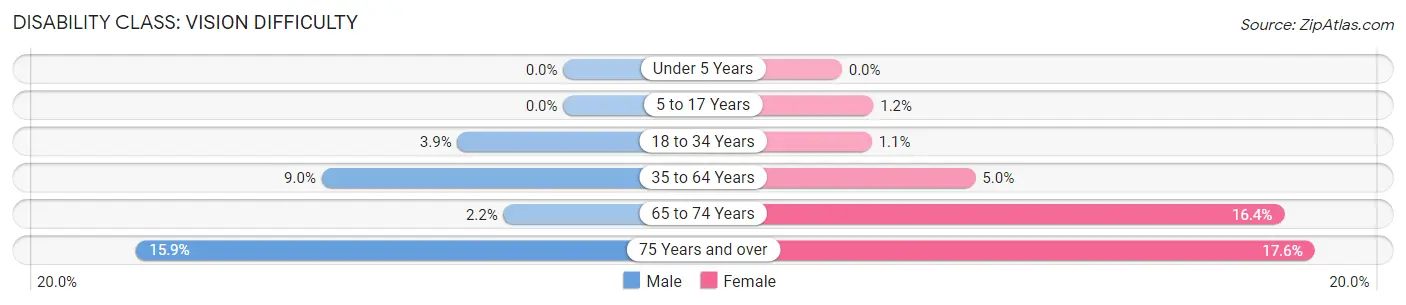
| Age Bracket | Male | Female |
| Under 5 Years | 0 (0.0%) | 0 (0.0%) |
| 5 to 17 Years | 0 (0.0%) | 21 (1.2%) |
| 18 to 34 Years | 86 (3.9%) | 23 (1.1%) |
| 35 to 64 Years | 444 (9.0%) | 239 (5.0%) |
| 65 to 74 Years | 33 (2.2%) | 273 (16.4%) |
| 75 Years and over | 155 (15.9%) | 226 (17.5%) |
Disability Class: Cognitive Difficulty
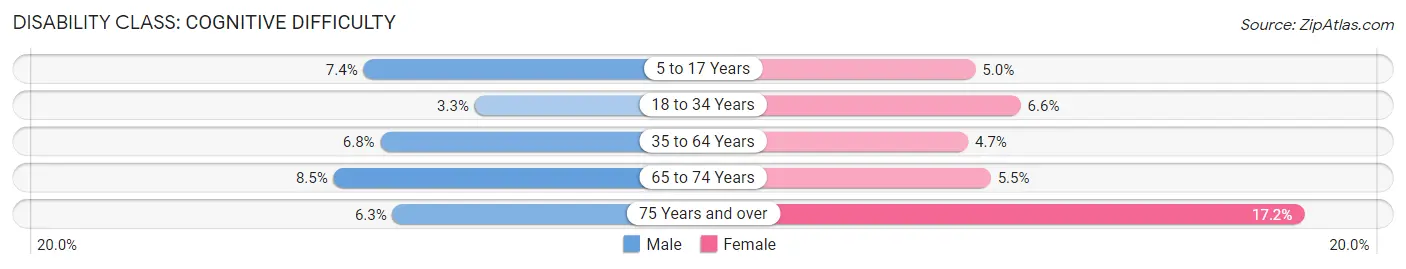
| Age Bracket | Male | Female |
| 5 to 17 Years | 161 (7.4%) | 89 (5.0%) |
| 18 to 34 Years | 72 (3.3%) | 138 (6.6%) |
| 35 to 64 Years | 336 (6.8%) | 226 (4.7%) |
| 65 to 74 Years | 127 (8.5%) | 92 (5.5%) |
| 75 Years and over | 62 (6.3%) | 221 (17.2%) |
Disability Class: Ambulatory Difficulty
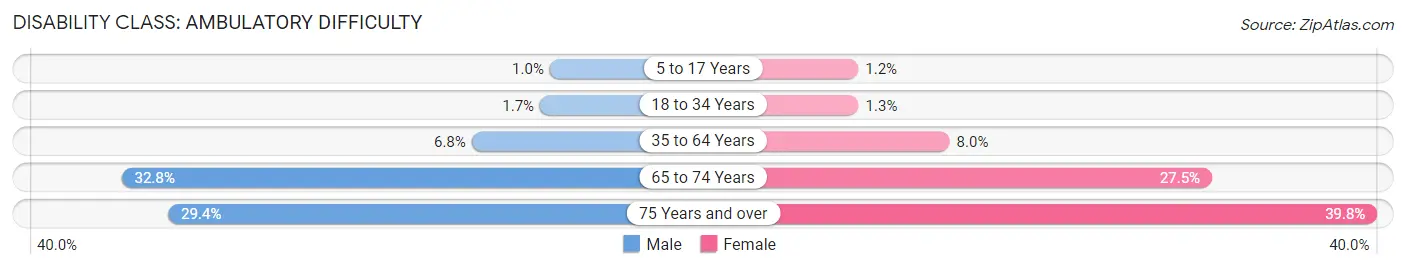
| Age Bracket | Male | Female |
| 5 to 17 Years | 22 (1.0%) | 22 (1.2%) |
| 18 to 34 Years | 38 (1.7%) | 26 (1.3%) |
| 35 to 64 Years | 337 (6.8%) | 386 (8.0%) |
| 65 to 74 Years | 488 (32.8%) | 457 (27.5%) |
| 75 Years and over | 287 (29.3%) | 512 (39.8%) |
Disability Class: Self-Care Difficulty
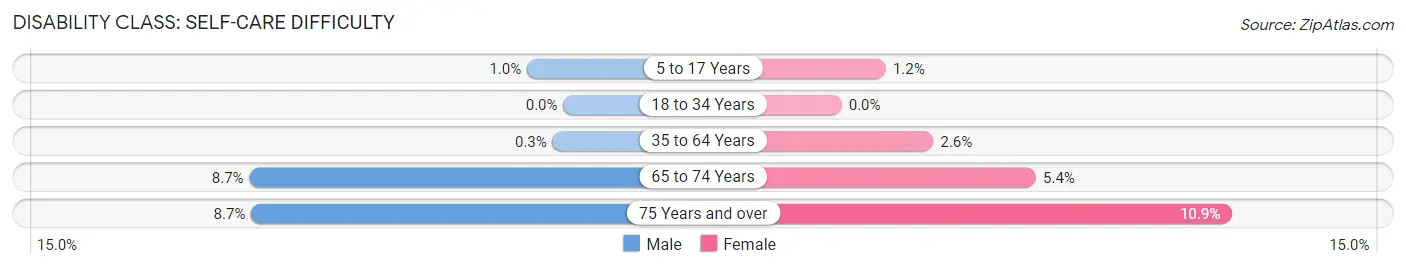
| Age Bracket | Male | Female |
| 5 to 17 Years | 22 (1.0%) | 22 (1.2%) |
| 18 to 34 Years | 0 (0.0%) | 0 (0.0%) |
| 35 to 64 Years | 15 (0.3%) | 123 (2.5%) |
| 65 to 74 Years | 130 (8.7%) | 90 (5.4%) |
| 75 Years and over | 85 (8.7%) | 140 (10.9%) |
Technology Access in Mason County
Computing Device Access in Mason County
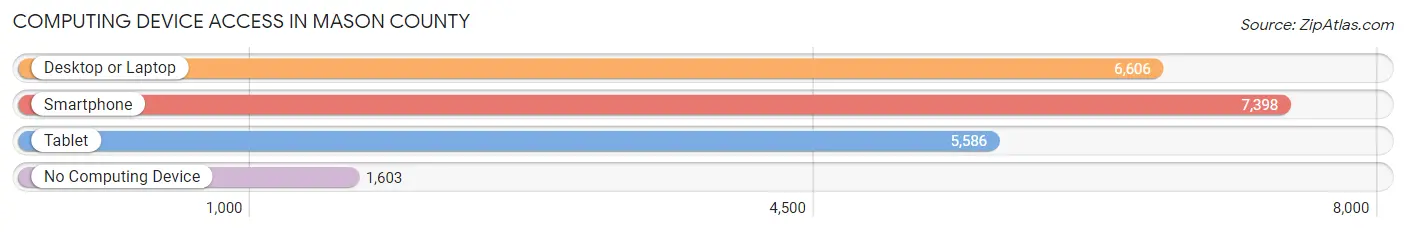
| Device Type | # Households | % Households |
| Desktop or Laptop | 6,606 | 65.3% |
| Smartphone | 7,398 | 73.1% |
| Tablet | 5,586 | 55.2% |
| No Computing Device | 1,603 | 15.8% |
| Total | 10,120 | 100.0% |
Internet Access in Mason County
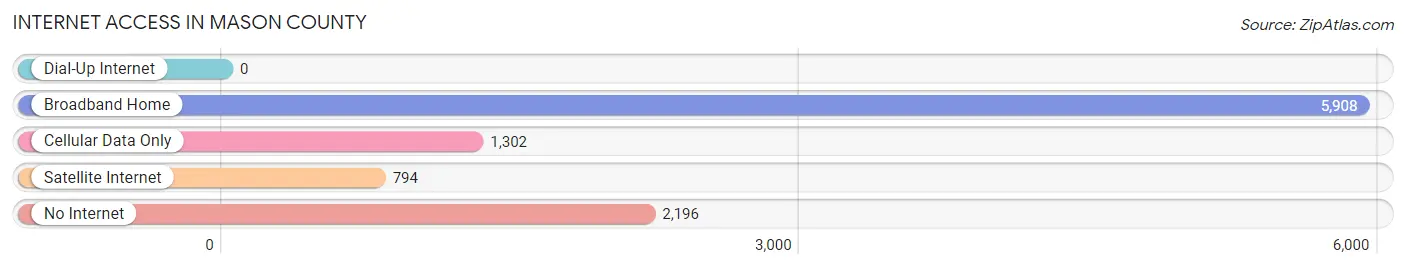
| Internet Type | # Households | % Households |
| Dial-Up Internet | 0 | 0.0% |
| Broadband Home | 5,908 | 58.4% |
| Cellular Data Only | 1,302 | 12.9% |
| Satellite Internet | 794 | 7.9% |
| No Internet | 2,196 | 21.7% |
| Total | 10,120 | 100.0% |
Mason County Summary
Mason County, West Virginia is located in the western part of the state, along the Ohio River. It is bordered by Putnam County to the north, Cabell County to the east, and Jackson County to the south. The county seat is Point Pleasant, and the county was named for George Mason, a Virginia statesman and delegate to the Constitutional Convention.
Mason County has a total area of 441 square miles, of which 437 square miles is land and 4.2 square miles is water. The terrain is mostly hilly, with some flat areas along the Ohio River. The climate is humid continental, with hot summers and cold winters.
As of the 2010 census, the population of Mason County was 27,324, an increase of 8.3% since 2000. The population is spread out, with the largest city being Point Pleasant, with a population of 4,637. Other cities include Mason, with a population of 1,845, and New Haven, with a population of 1,072. The racial makeup of the county is 94.3% White, 3.3% African American, 0.3% Native American, 0.3% Asian, 0.1% Pacific Islander, 0.5% from other races, and 1.2% from two or more races. Hispanic or Latino of any race were 1.3% of the population.
The median household income in Mason County was $37,845 in 2017, compared to the state median of $43,469. The median home value was $97,400, compared to the state median of $124,400. The unemployment rate was 5.2%, compared to the state rate of 4.7%.
The economy of Mason County is largely based on agriculture, with the main crops being corn, soybeans, and hay. The county is also home to several manufacturing companies, including a glass plant, a paper mill, and a steel mill. Tourism is also an important part of the economy, with the county being home to several state parks and historic sites.
Mason County is served by the Mason County School District, which consists of seven elementary schools, two middle schools, and one high school. The county is also home to several private schools, including a Catholic school and a Christian school. The county is served by the Mason County Public Library System, which consists of four branches.
Mason County is home to several historic sites, including the Tu-Endie-Wei State Park, which commemorates the Battle of Point Pleasant, the first battle of the American Revolutionary War. The county is also home to the Grave Creek Mound Archaeological Complex, which is the largest conical burial mound in the United States.
Mason County is a rural county with a rich history and a diverse economy. It is home to several historic sites, state parks, and manufacturing companies, and is served by a strong school system. The county is a great place to live, work, and raise a family.
Common Questions
What is the Total Population of Mason County?
Total Population of Mason County is 25,488.
What is the Total Male Population of Mason County?
Total Male Population of Mason County is 12,579.
What is the Total Female Population of Mason County?
Total Female Population of Mason County is 12,909.
What is the Ratio of Males per 100 Females in Mason County?
There are 97.44 Males per 100 Females in Mason County.
What is the Ratio of Females per 100 Males in Mason County?
There are 102.62 Females per 100 Males in Mason County.
What is the Median Population Age in Mason County?
Median Population Age in Mason County is 44.2 Years.
What is the Average Family Size in Mason County
Average Family Size in Mason County is 3.1 People.
What is the Average Household Size in Mason County
Average Household Size in Mason County is 2.4 People.
What is Per Capita Income in Mason County?
Per Capita income in Mason County is $31,085.
What is the Median Family Income in Mason County?
Median Family Income in Mason County is $70,809.
What is the Median Household income in Mason County?
Median Household Income in Mason County is $53,058.
What is Income or Wage Gap in Mason County?
Income or Wage Gap in Mason County is 50.4%.
Women in Mason County earn 49.6 cents for every dollar earned by a man.
What is Inequality or Gini Index in Mason County?
Inequality or Gini Index in Mason County is 0.49.
How Large is the Labor Force in Mason County?
There are 9,729 People in the Labor Forcein in Mason County.
What is the Percentage of People in the Labor Force in Mason County?
46.6% of People are in the Labor Force in Mason County.
What is the Unemployment Rate in Mason County?
Unemployment Rate in Mason County is 2.9%.