Marshall County, WV
Marshall County Map
Marshall County Overview
30,509
TOTAL POPULATION
15,540
MALE POPULATION
14,969
FEMALE POPULATION
103.81
MALES / 100 FEMALES
96.33
FEMALES / 100 MALES
46.4
MEDIAN AGE
3.1
AVG FAMILY SIZE
2.5
AVG HOUSEHOLD SIZE
$33,673
PER CAPITA INCOME
$70,136
AVG FAMILY INCOME
$58,129
AVG HOUSEHOLD INCOME
41.3%
WAGE / INCOME GAP [ % ]
58.7¢/ $1
WAGE / INCOME GAP [ $ ]
$10,633
FAMILY INCOME DEFICIT
0.49
INEQUALITY / GINI INDEX
13,687
LABOR FORCE [ PEOPLE ]
53.6%
PERCENT IN LABOR FORCE
3.9%
UNEMPLOYMENT RATE
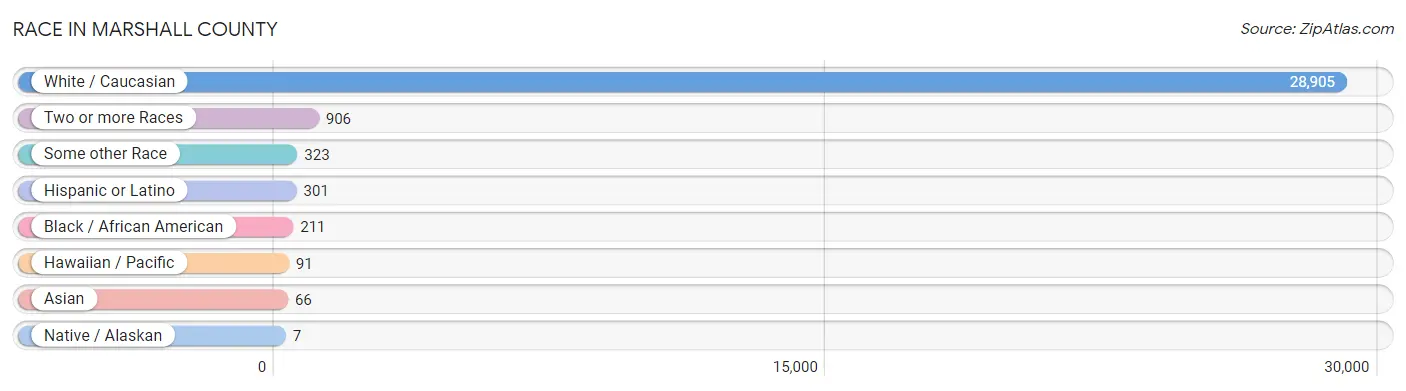
Race in Marshall County
The most populous races in Marshall County are White / Caucasian (28,905 | 94.7%), Two or more Races (906 | 3.0%), and Some other Race (323 | 1.1%).
| Race | # Population | % Population |
| Asian | 66 | 0.2% |
| Black / African American | 211 | 0.7% |
| Hawaiian / Pacific | 91 | 0.3% |
| Hispanic or Latino | 301 | 1.0% |
| Native / Alaskan | 7 | 0.0% |
| White / Caucasian | 28,905 | 94.7% |
| Two or more Races | 906 | 3.0% |
| Some other Race | 323 | 1.1% |
| Total | 30,509 | 100.0% |
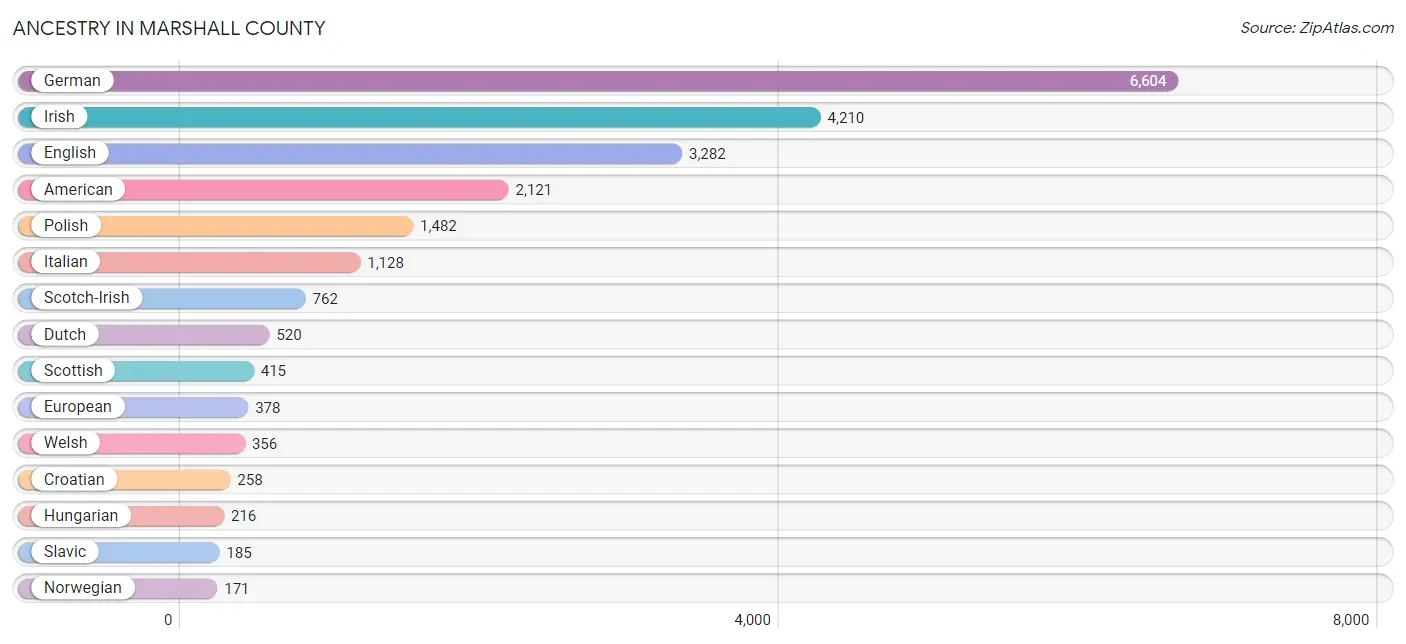
Ancestry in Marshall County
The most populous ancestries reported in Marshall County are German (6,604 | 21.6%), Irish (4,210 | 13.8%), English (3,282 | 10.8%), American (2,121 | 7.0%), and Polish (1,482 | 4.9%), together accounting for 58.0% of all Marshall County residents.
| Ancestry | # Population | % Population |
| American | 2,121 | 7.0% |
| Arab | 75 | 0.3% |
| Austrian | 37 | 0.1% |
| Belgian | 11 | 0.0% |
| Bhutanese | 15 | 0.1% |
| Blackfeet | 72 | 0.2% |
| Brazilian | 9 | 0.0% |
| British | 132 | 0.4% |
| Burmese | 5 | 0.0% |
| Central American | 100 | 0.3% |
| Cherokee | 78 | 0.3% |
| Choctaw | 1 | 0.0% |
| Croatian | 258 | 0.9% |
| Crow | 11 | 0.0% |
| Cuban | 5 | 0.0% |
| Czech | 35 | 0.1% |
| Czechoslovakian | 27 | 0.1% |
| Danish | 3 | 0.0% |
| Dominican | 4 | 0.0% |
| Dutch | 520 | 1.7% |
| Eastern European | 47 | 0.2% |
| English | 3,282 | 10.8% |
| European | 378 | 1.2% |
| French | 109 | 0.4% |
| French Canadian | 12 | 0.0% |
| German | 6,604 | 21.6% |
| Ghanaian | 1 | 0.0% |
| Greek | 67 | 0.2% |
| Hungarian | 216 | 0.7% |
| Indian (Asian) | 56 | 0.2% |
| Irish | 4,210 | 13.8% |
| Italian | 1,128 | 3.7% |
| Korean | 60 | 0.2% |
| Lebanese | 72 | 0.2% |
| Lithuanian | 21 | 0.1% |
| Mexican | 61 | 0.2% |
| Native Hawaiian | 91 | 0.3% |
| Navajo | 13 | 0.0% |
| Northern European | 33 | 0.1% |
| Norwegian | 171 | 0.6% |
| Pakistani | 2 | 0.0% |
| Pennsylvania German | 2 | 0.0% |
| Peruvian | 4 | 0.0% |
| Polish | 1,482 | 4.9% |
| Puerto Rican | 62 | 0.2% |
| Romanian | 27 | 0.1% |
| Russian | 115 | 0.4% |
| Salvadoran | 100 | 0.3% |
| Scandinavian | 41 | 0.1% |
| Scotch-Irish | 762 | 2.5% |
| Scottish | 415 | 1.4% |
| Serbian | 12 | 0.0% |
| Slavic | 185 | 0.6% |
| Slovak | 59 | 0.2% |
| Slovene | 47 | 0.2% |
| South American | 4 | 0.0% |
| Spaniard | 36 | 0.1% |
| Spanish | 25 | 0.1% |
| Sri Lankan | 39 | 0.1% |
| Subsaharan African | 1 | 0.0% |
| Swedish | 49 | 0.2% |
| Swiss | 34 | 0.1% |
| Syrian | 3 | 0.0% |
| Thai | 18 | 0.1% |
| Ukrainian | 77 | 0.3% |
| Welsh | 356 | 1.2% |
| Yugoslavian | 16 | 0.1% | View All 67 Rows |
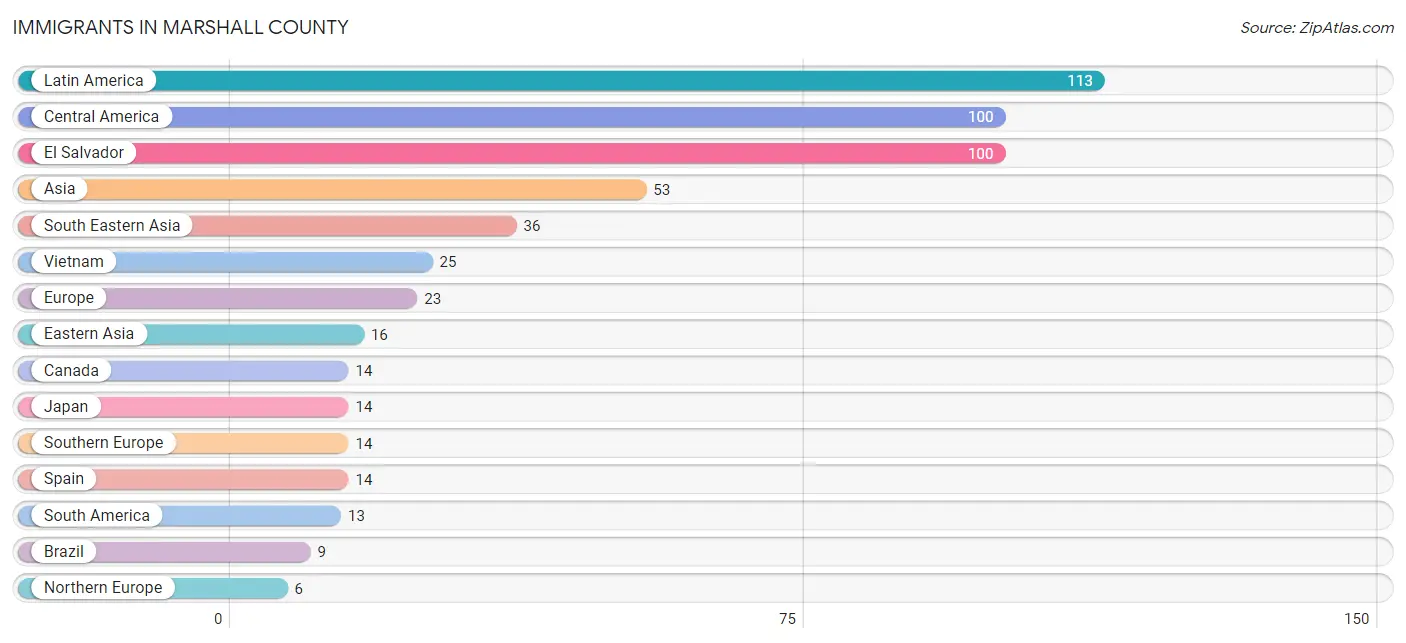
Immigrants in Marshall County
The most numerous immigrant groups reported in Marshall County came from Latin America (113 | 0.4%), Central America (100 | 0.3%), El Salvador (100 | 0.3%), Asia (53 | 0.2%), and South Eastern Asia (36 | 0.1%), together accounting for 1.3% of all Marshall County residents.
| Immigration Origin | # Population | % Population |
| Africa | 2 | 0.0% |
| Asia | 53 | 0.2% |
| Brazil | 9 | 0.0% |
| Canada | 14 | 0.1% |
| Central America | 100 | 0.3% |
| China | 2 | 0.0% |
| Eastern Africa | 1 | 0.0% |
| Eastern Asia | 16 | 0.1% |
| Eastern Europe | 3 | 0.0% |
| El Salvador | 100 | 0.3% |
| Europe | 23 | 0.1% |
| Ghana | 1 | 0.0% |
| India | 1 | 0.0% |
| Japan | 14 | 0.1% |
| Latin America | 113 | 0.4% |
| Malaysia | 4 | 0.0% |
| Northern Europe | 6 | 0.0% |
| Peru | 4 | 0.0% |
| Philippines | 5 | 0.0% |
| South America | 13 | 0.0% |
| South Central Asia | 1 | 0.0% |
| South Eastern Asia | 36 | 0.1% |
| Southern Europe | 14 | 0.1% |
| Spain | 14 | 0.1% |
| Taiwan | 1 | 0.0% |
| Thailand | 2 | 0.0% |
| Vietnam | 25 | 0.1% |
| Western Africa | 1 | 0.0% | View All 28 Rows |
Sex and Age in Marshall County
Sex and Age in Marshall County
The most populous age groups in Marshall County are 60 to 64 Years (1,250 | 8.0%) for men and 60 to 64 Years (1,309 | 8.7%) for women.
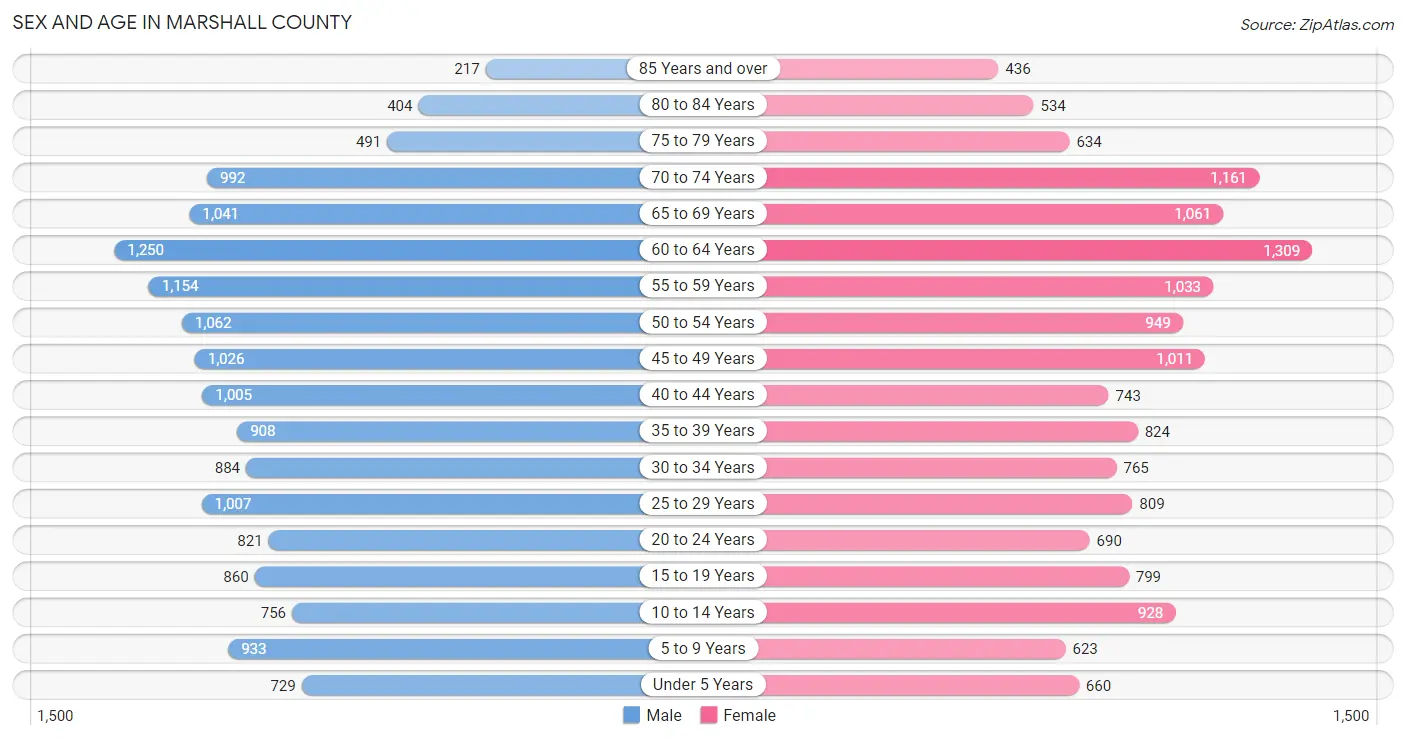
| Age Bracket | Male | Female |
| Under 5 Years | 729 (4.7%) | 660 (4.4%) |
| 5 to 9 Years | 933 (6.0%) | 623 (4.2%) |
| 10 to 14 Years | 756 (4.9%) | 928 (6.2%) |
| 15 to 19 Years | 860 (5.5%) | 799 (5.3%) |
| 20 to 24 Years | 821 (5.3%) | 690 (4.6%) |
| 25 to 29 Years | 1,007 (6.5%) | 809 (5.4%) |
| 30 to 34 Years | 884 (5.7%) | 765 (5.1%) |
| 35 to 39 Years | 908 (5.8%) | 824 (5.5%) |
| 40 to 44 Years | 1,005 (6.5%) | 743 (5.0%) |
| 45 to 49 Years | 1,026 (6.6%) | 1,011 (6.8%) |
| 50 to 54 Years | 1,062 (6.8%) | 949 (6.3%) |
| 55 to 59 Years | 1,154 (7.4%) | 1,033 (6.9%) |
| 60 to 64 Years | 1,250 (8.0%) | 1,309 (8.7%) |
| 65 to 69 Years | 1,041 (6.7%) | 1,061 (7.1%) |
| 70 to 74 Years | 992 (6.4%) | 1,161 (7.8%) |
| 75 to 79 Years | 491 (3.2%) | 634 (4.2%) |
| 80 to 84 Years | 404 (2.6%) | 534 (3.6%) |
| 85 Years and over | 217 (1.4%) | 436 (2.9%) |
| Total | 15,540 (100.0%) | 14,969 (100.0%) |
Families and Households in Marshall County
Median Family Size in Marshall County
The median family size in Marshall County is 3.06 persons per family, with single male/father families (516 | 6.6%) accounting for the largest median family size of 3.49 persons per family. On the other hand, married-couple families (5,804 | 73.7%) represent the smallest median family size with 2.93 persons per family.
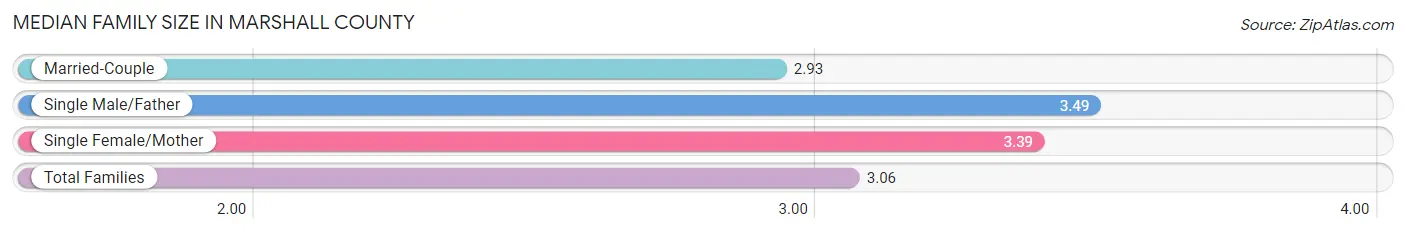
| Family Type | # Families | Family Size |
| Married-Couple | 5,804 (73.7%) | 2.93 |
| Single Male/Father | 516 (6.6%) | 3.49 |
| Single Female/Mother | 1,557 (19.8%) | 3.39 |
| Total Families | 7,877 (100.0%) | 3.06 |
Median Household Size in Marshall County
The median household size in Marshall County is 2.47 persons per household, with single male/father households (516 | 4.3%) accounting for the largest median household size of 4.03 persons per household. non-family households (4,178 | 34.7%) represent the smallest median household size with 1.19 persons per household.
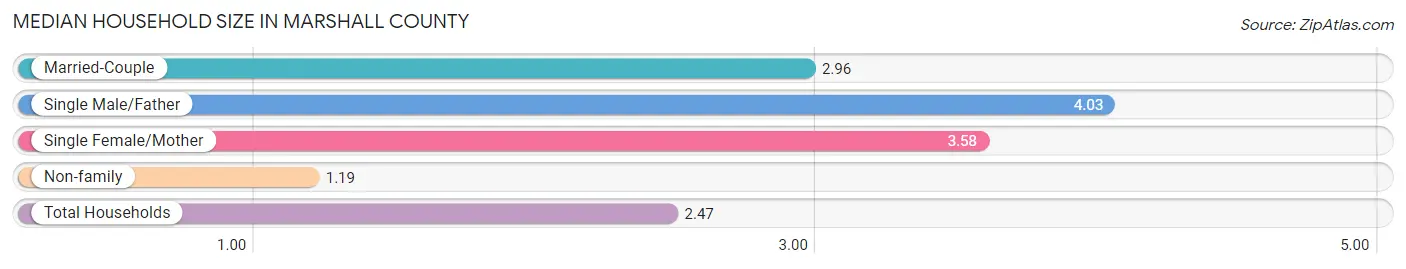
| Household Type | # Households | Household Size |
| Married-Couple | 5,804 (48.1%) | 2.96 |
| Single Male/Father | 516 (4.3%) | 4.03 |
| Single Female/Mother | 1,557 (12.9%) | 3.58 |
| Non-family | 4,178 (34.7%) | 1.19 |
| Total Households | 12,055 (100.0%) | 2.47 |
Household Size by Marriage Status in Marshall County
Out of a total of 12,055 households in Marshall County, 7,877 (65.3%) are family households, while 4,178 (34.7%) are nonfamily households. The most numerous type of family households are 2-person households, comprising 4,373, and the most common type of nonfamily households are 1-person households, comprising 3,576.
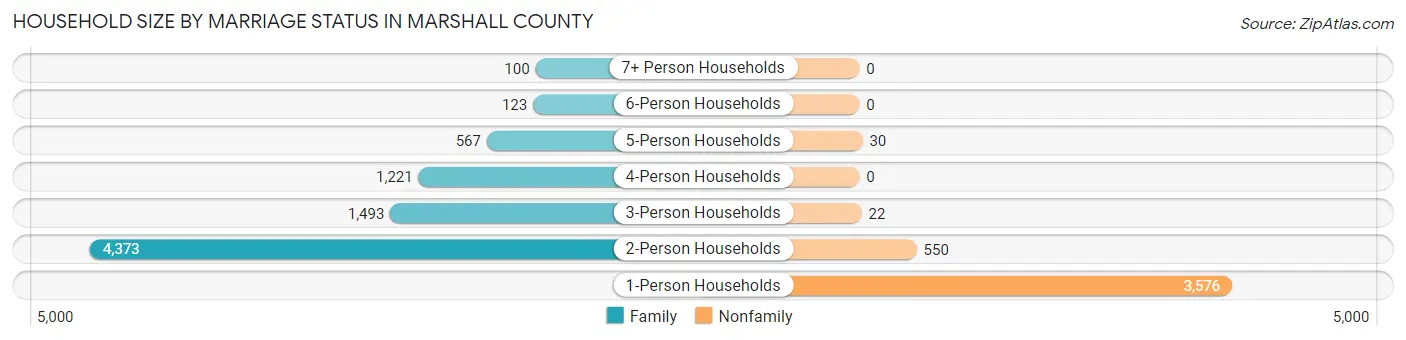
| Household Size | Family Households | Nonfamily Households |
| 1-Person Households | - | 3,576 (29.7%) |
| 2-Person Households | 4,373 (36.3%) | 550 (4.6%) |
| 3-Person Households | 1,493 (12.4%) | 22 (0.2%) |
| 4-Person Households | 1,221 (10.1%) | 0 (0.0%) |
| 5-Person Households | 567 (4.7%) | 30 (0.3%) |
| 6-Person Households | 123 (1.0%) | 0 (0.0%) |
| 7+ Person Households | 100 (0.8%) | 0 (0.0%) |
| Total | 7,877 (65.3%) | 4,178 (34.7%) |
Female Fertility in Marshall County
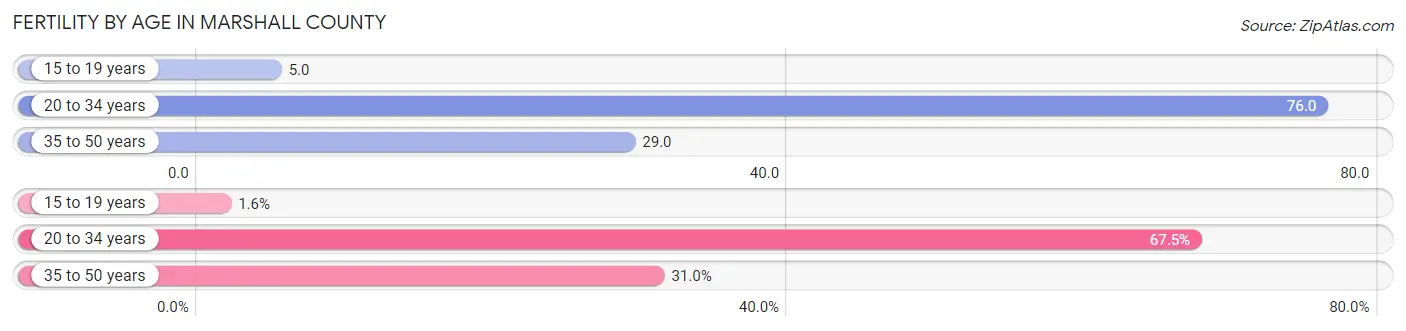
Fertility by Age in Marshall County
Average fertility rate in Marshall County is 44.0 births per 1,000 women. Women in the age bracket of 20 to 34 years have the highest fertility rate with 76.0 births per 1,000 women. Women in the age bracket of 20 to 34 years acount for 67.4% of all women with births.
| Age Bracket | Women with Births | Births / 1,000 Women |
| 15 to 19 years | 4 (1.6%) | 5.0 |
| 20 to 34 years | 172 (67.4%) | 76.0 |
| 35 to 50 years | 79 (31.0%) | 29.0 |
| Total | 255 (100.0%) | 44.0 |
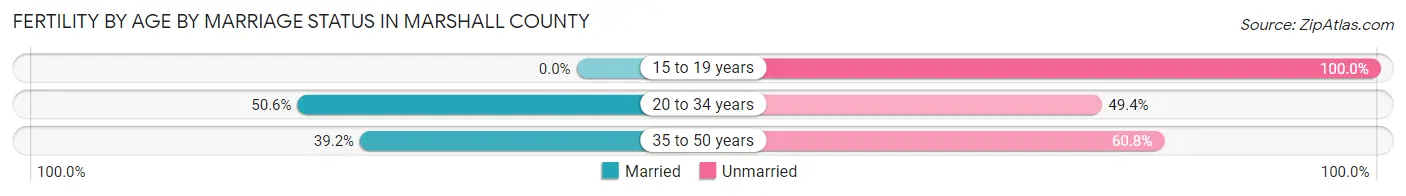
Fertility by Age by Marriage Status in Marshall County
46.3% of women with births (255) in Marshall County are married. The highest percentage of unmarried women with births falls into 15 to 19 years age bracket with 100.0% of them unmarried at the time of birth, while the lowest percentage of unmarried women with births belong to 20 to 34 years age bracket with 49.4% of them unmarried.
| Age Bracket | Married | Unmarried |
| 15 to 19 years | 0 (0.0%) | 4 (100.0%) |
| 20 to 34 years | 87 (50.6%) | 85 (49.4%) |
| 35 to 50 years | 31 (39.2%) | 48 (60.8%) |
| Total | 118 (46.3%) | 137 (53.7%) |
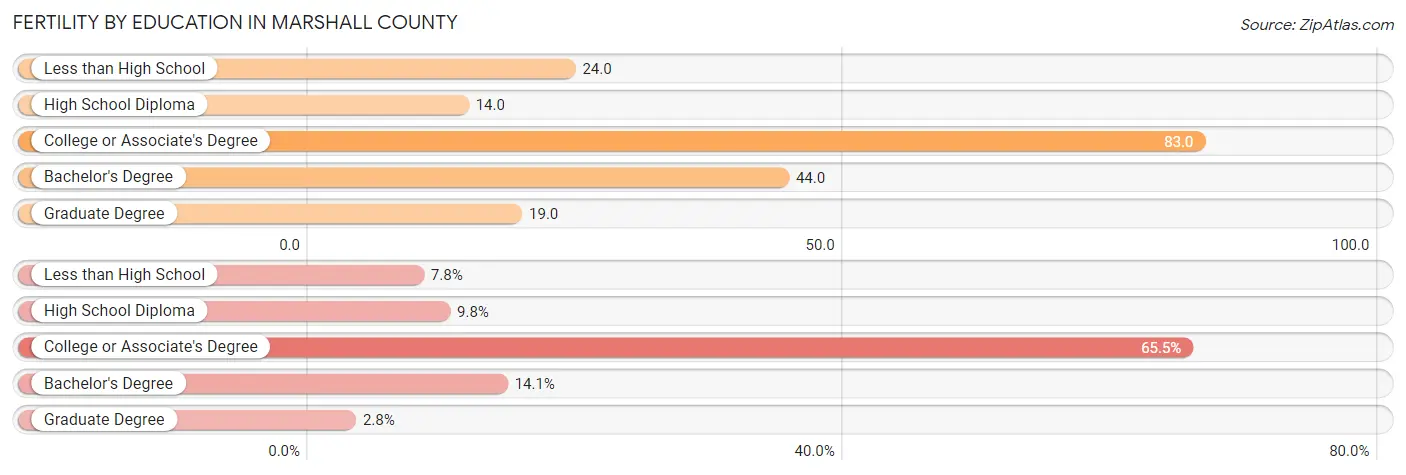
Fertility by Education in Marshall County
Average fertility rate in Marshall County is 44.0 births per 1,000 women. Women with the education attainment of college or associate's degree have the highest fertility rate of 83.0 births per 1,000 women, while women with the education attainment of high school diploma have the lowest fertility at 14.0 births per 1,000 women. Women with the education attainment of college or associate's degree represent 65.5% of all women with births.
| Educational Attainment | Women with Births | Births / 1,000 Women |
| Less than High School | 20 (7.8%) | 24.0 |
| High School Diploma | 25 (9.8%) | 14.0 |
| College or Associate's Degree | 167 (65.5%) | 83.0 |
| Bachelor's Degree | 36 (14.1%) | 44.0 |
| Graduate Degree | 7 (2.8%) | 19.0 |
| Total | 255 (100.0%) | 44.0 |
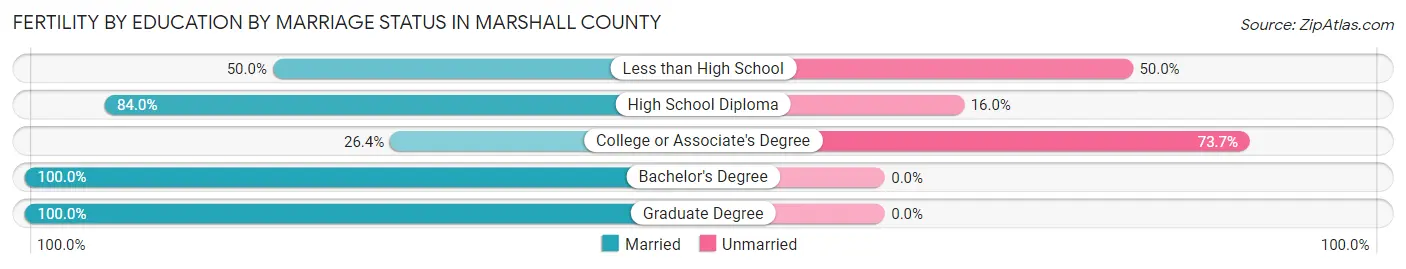
Fertility by Education by Marriage Status in Marshall County
53.7% of women with births in Marshall County are unmarried. Women with the educational attainment of bachelor's degree are most likely to be married with 100.0% of them married at childbirth, while women with the educational attainment of college or associate's degree are least likely to be married with 73.7% of them unmarried at childbirth.
| Educational Attainment | Married | Unmarried |
| Less than High School | 10 (50.0%) | 10 (50.0%) |
| High School Diploma | 21 (84.0%) | 4 (16.0%) |
| College or Associate's Degree | 44 (26.4%) | 123 (73.7%) |
| Bachelor's Degree | 36 (100.0%) | 0 (0.0%) |
| Graduate Degree | 7 (100.0%) | 0 (0.0%) |
| Total | 118 (46.3%) | 137 (53.7%) |
Income in Marshall County
Income Overview in Marshall County
Per Capita Income in Marshall County is $33,673, while median incomes of families and households are $70,136 and $58,129 respectively.
| Characteristic | Number | Measure |
| Per Capita Income | 30,509 | $33,673 |
| Median Family Income | 7,877 | $70,136 |
| Mean Family Income | 7,877 | $95,300 |
| Median Household Income | 12,055 | $58,129 |
| Mean Household Income | 12,055 | $78,581 |
| Income Deficit | 7,877 | $10,633 |
| Wage / Income Gap (%) | 30,509 | 41.27% |
| Wage / Income Gap ($) | 30,509 | 58.73¢ per $1 |
| Gini / Inequality Index | 30,509 | 0.49 |
Earnings by Sex in Marshall County
Average Earnings in Marshall County are $37,052, $45,683 for men and $26,831 for women, a difference of 41.3%.
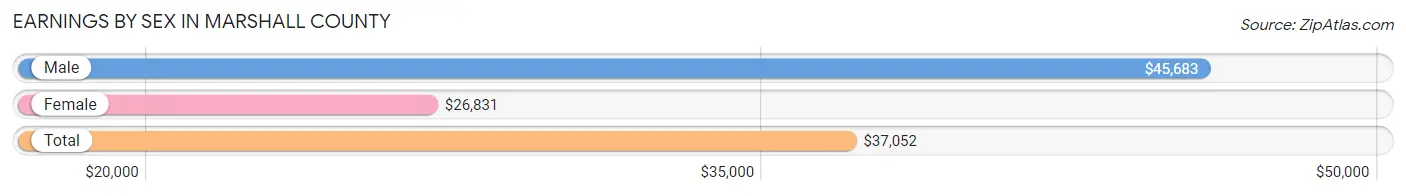
| Sex | Number | Average Earnings |
| Male | 8,150 (56.5%) | $45,683 |
| Female | 6,287 (43.5%) | $26,831 |
| Total | 14,437 (100.0%) | $37,052 |
Earnings by Sex by Income Bracket in Marshall County
The most common earnings brackets in Marshall County are $100,000+ for men (1,390 | 17.1%) and $25,000 to $29,999 for women (627 | 10.0%).
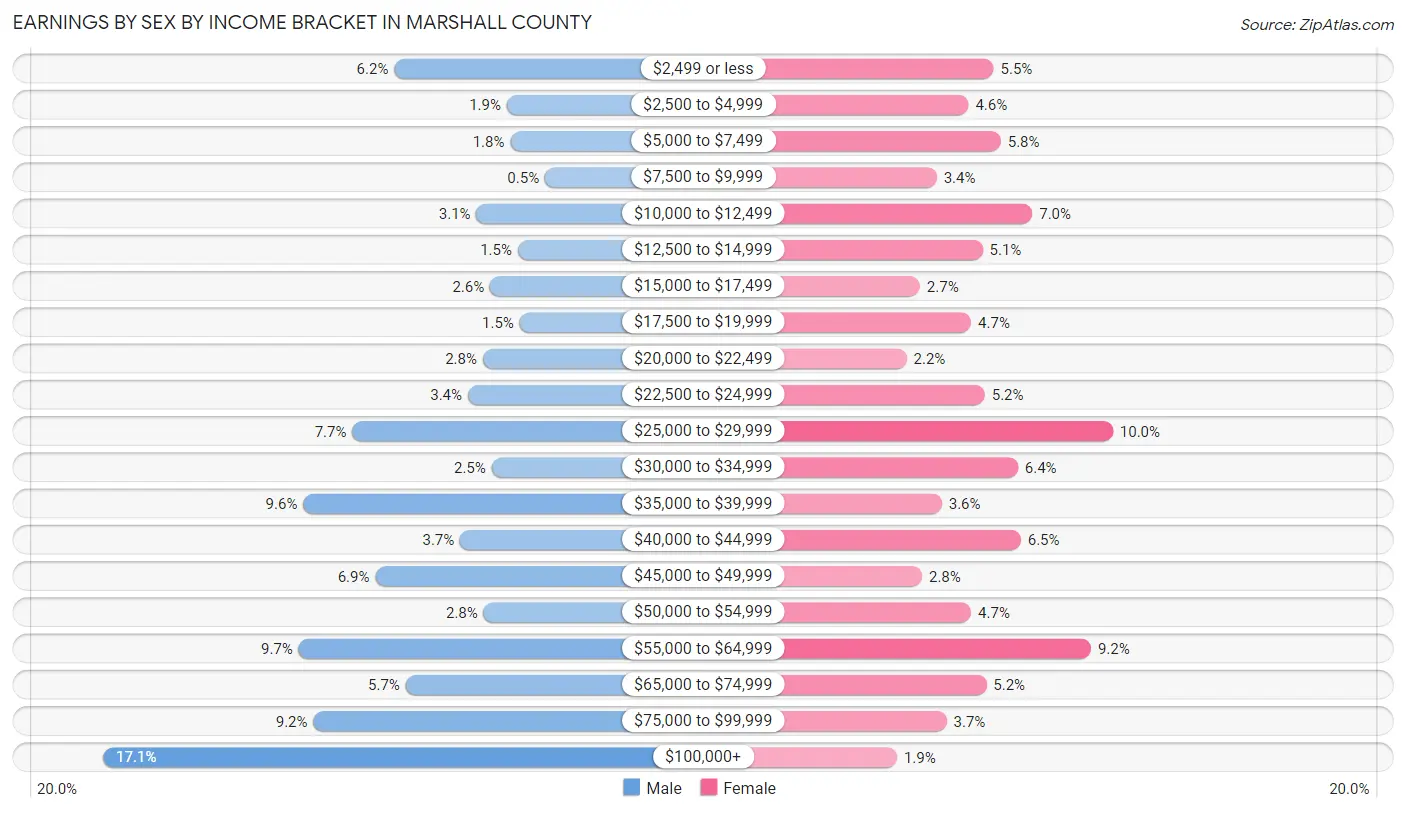
| Income | Male | Female |
| $2,499 or less | 501 (6.1%) | 346 (5.5%) |
| $2,500 to $4,999 | 157 (1.9%) | 287 (4.6%) |
| $5,000 to $7,499 | 147 (1.8%) | 363 (5.8%) |
| $7,500 to $9,999 | 41 (0.5%) | 212 (3.4%) |
| $10,000 to $12,499 | 250 (3.1%) | 437 (7.0%) |
| $12,500 to $14,999 | 124 (1.5%) | 320 (5.1%) |
| $15,000 to $17,499 | 209 (2.6%) | 172 (2.7%) |
| $17,500 to $19,999 | 118 (1.5%) | 293 (4.7%) |
| $20,000 to $22,499 | 231 (2.8%) | 141 (2.2%) |
| $22,500 to $24,999 | 276 (3.4%) | 325 (5.2%) |
| $25,000 to $29,999 | 629 (7.7%) | 627 (10.0%) |
| $30,000 to $34,999 | 204 (2.5%) | 403 (6.4%) |
| $35,000 to $39,999 | 779 (9.6%) | 224 (3.6%) |
| $40,000 to $44,999 | 300 (3.7%) | 410 (6.5%) |
| $45,000 to $49,999 | 559 (6.9%) | 177 (2.8%) |
| $50,000 to $54,999 | 228 (2.8%) | 293 (4.7%) |
| $55,000 to $64,999 | 793 (9.7%) | 575 (9.1%) |
| $65,000 to $74,999 | 466 (5.7%) | 329 (5.2%) |
| $75,000 to $99,999 | 748 (9.2%) | 235 (3.7%) |
| $100,000+ | 1,390 (17.1%) | 118 (1.9%) |
| Total | 8,150 (100.0%) | 6,287 (100.0%) |
Earnings by Sex by Educational Attainment in Marshall County
Average earnings in Marshall County are $48,797 for men and $29,630 for women, a difference of 39.3%. Men with an educational attainment of graduate degree enjoy the highest average annual earnings of $90,250, while those with less than high school education earn the least with $45,101. Women with an educational attainment of graduate degree earn the most with the average annual earnings of $58,022, while those with less than high school education have the smallest earnings of $11,821.
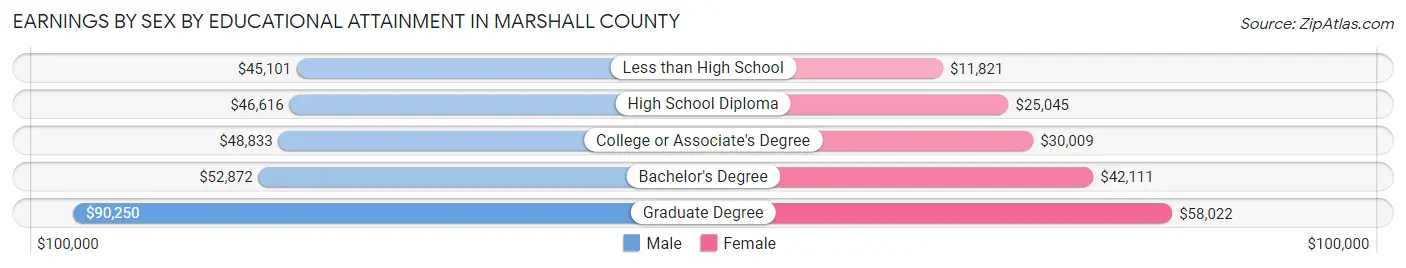
| Educational Attainment | Male Income | Female Income |
| Less than High School | $45,101 | $11,821 |
| High School Diploma | $46,616 | $25,045 |
| College or Associate's Degree | $48,833 | $30,009 |
| Bachelor's Degree | $52,872 | $42,111 |
| Graduate Degree | $90,250 | $58,022 |
| Total | $48,797 | $29,630 |
Family Income in Marshall County
Family Income Brackets in Marshall County
According to the Marshall County family income data, there are 1,796 families falling into the $50,000 to $74,999 income range, which is the most common income bracket and makes up 22.8% of all families. Conversely, the $10,000 to $14,999 income bracket is the least frequent group with only 221 families (2.8%) belonging to this category.
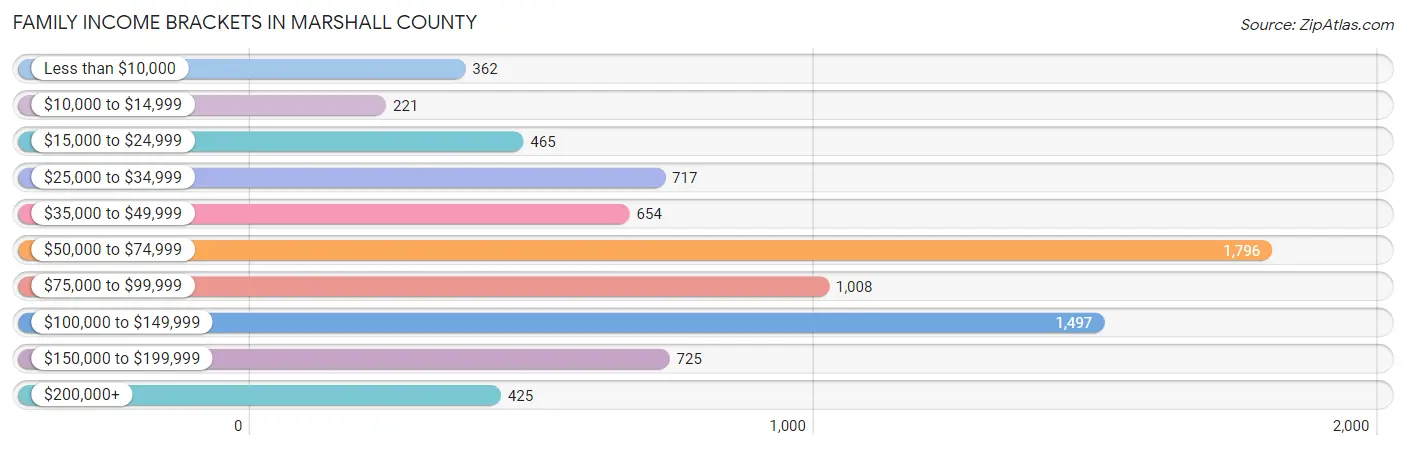
| Income Bracket | # Families | % Families |
| Less than $10,000 | 362 | 4.6% |
| $10,000 to $14,999 | 221 | 2.8% |
| $15,000 to $24,999 | 465 | 5.9% |
| $25,000 to $34,999 | 717 | 9.1% |
| $35,000 to $49,999 | 654 | 8.3% |
| $50,000 to $74,999 | 1,796 | 22.8% |
| $75,000 to $99,999 | 1,008 | 12.8% |
| $100,000 to $149,999 | 1,497 | 19.0% |
| $150,000 to $199,999 | 725 | 9.2% |
| $200,000+ | 425 | 5.4% |
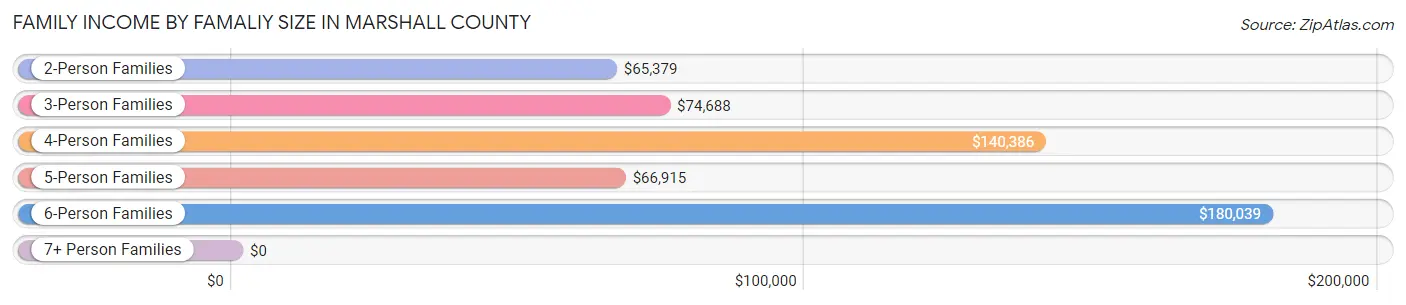
Family Income by Famaliy Size in Marshall County
6-person families (126 | 1.6%) account for the highest median family income in Marshall County with $180,039 per family, while 4-person families (1,051 | 13.3%) have the highest median income of $35,096 per family member.
| Income Bracket | # Families | Median Income |
| 2-Person Families | 4,515 (57.3%) | $65,379 |
| 3-Person Families | 1,561 (19.8%) | $74,688 |
| 4-Person Families | 1,051 (13.3%) | $140,386 |
| 5-Person Families | 578 (7.3%) | $66,915 |
| 6-Person Families | 126 (1.6%) | $180,039 |
| 7+ Person Families | 46 (0.6%) | $0 |
| Total | 7,877 (100.0%) | $70,136 |
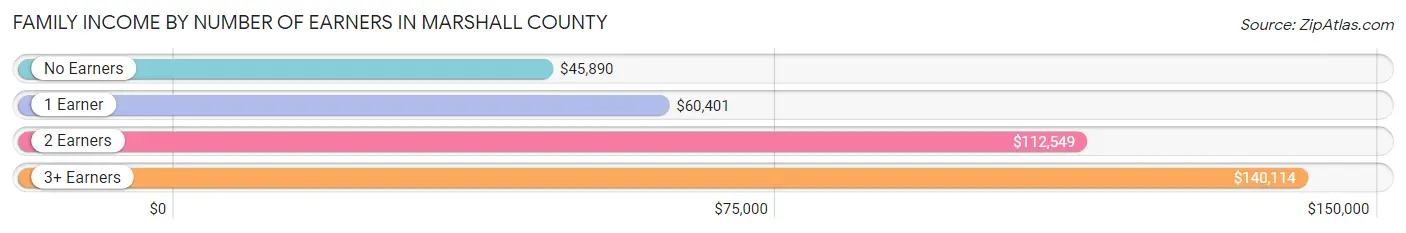
Family Income by Number of Earners in Marshall County
The median family income in Marshall County is $70,136, with families comprising 3+ earners (931) having the highest median family income of $140,114, while families with no earners (2,138) have the lowest median family income of $45,890, accounting for 11.8% and 27.1% of families, respectively.
| Number of Earners | # Families | Median Income |
| No Earners | 2,138 (27.1%) | $45,890 |
| 1 Earner | 2,310 (29.3%) | $60,401 |
| 2 Earners | 2,498 (31.7%) | $112,549 |
| 3+ Earners | 931 (11.8%) | $140,114 |
| Total | 7,877 (100.0%) | $70,136 |
Household Income in Marshall County
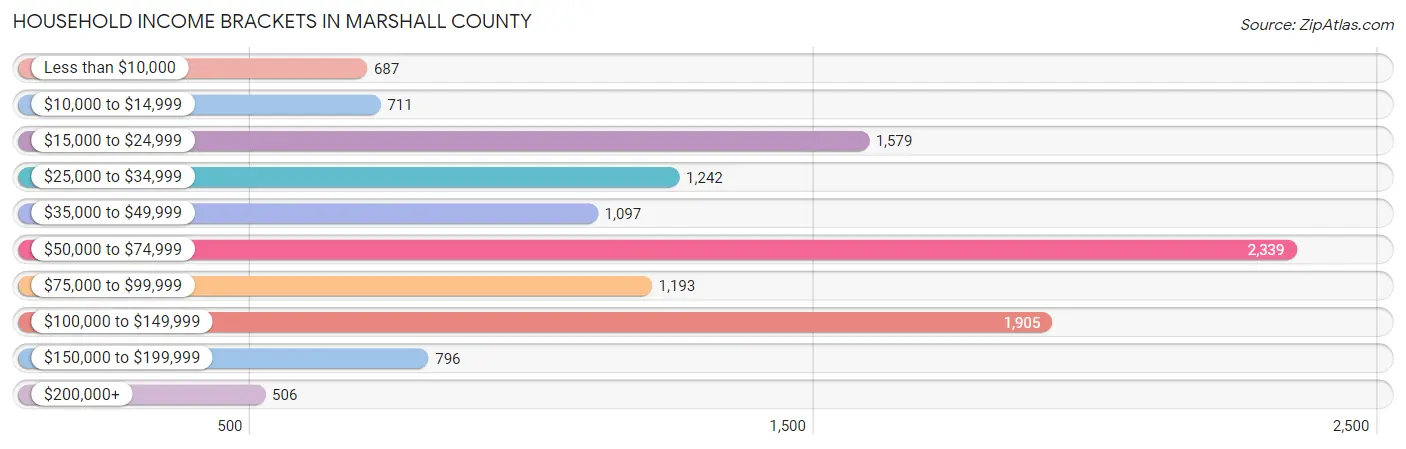
Household Income Brackets in Marshall County
With 2,339 households falling in the category, the $50,000 to $74,999 income range is the most frequent in Marshall County, accounting for 19.4% of all households. In contrast, only 506 households (4.2%) fall into the $200,000+ income bracket, making it the least populous group.
| Income Bracket | # Households | % Households |
| Less than $10,000 | 687 | 5.7% |
| $10,000 to $14,999 | 711 | 5.9% |
| $15,000 to $24,999 | 1,579 | 13.1% |
| $25,000 to $34,999 | 1,242 | 10.3% |
| $35,000 to $49,999 | 1,097 | 9.1% |
| $50,000 to $74,999 | 2,339 | 19.4% |
| $75,000 to $99,999 | 1,193 | 9.9% |
| $100,000 to $149,999 | 1,905 | 15.8% |
| $150,000 to $199,999 | 796 | 6.6% |
| $200,000+ | 506 | 4.2% |
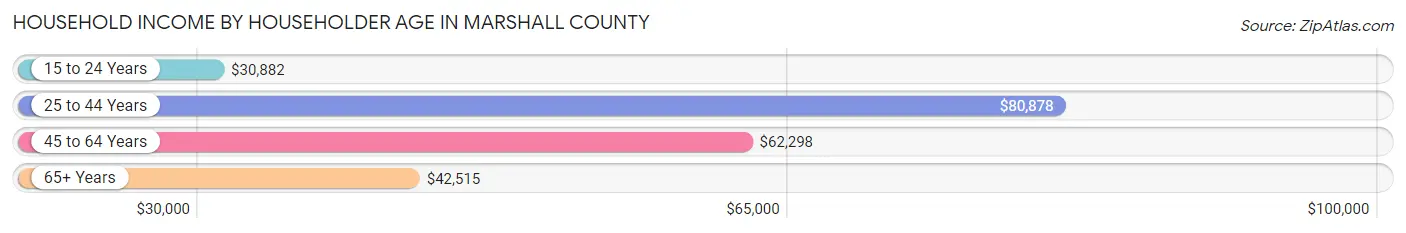
Household Income by Householder Age in Marshall County
The median household income in Marshall County is $58,129, with the highest median household income of $80,878 found in the 25 to 44 years age bracket for the primary householder. A total of 2,775 households (23.0%) fall into this category. Meanwhile, the 15 to 24 years age bracket for the primary householder has the lowest median household income of $30,882, with 200 households (1.7%) in this group.
| Income Bracket | # Households | Median Income |
| 15 to 24 Years | 200 (1.7%) | $30,882 |
| 25 to 44 Years | 2,775 (23.0%) | $80,878 |
| 45 to 64 Years | 4,667 (38.7%) | $62,298 |
| 65+ Years | 4,413 (36.6%) | $42,515 |
| Total | 12,055 (100.0%) | $58,129 |
Poverty in Marshall County
Income Below Poverty by Sex and Age in Marshall County
With 12.3% poverty level for males and 17.0% for females among the residents of Marshall County, 5 year old males and 6 to 11 year old females are the most vulnerable to poverty, with 39 males (28.3%) and 218 females (36.3%) in their respective age groups living below the poverty level.
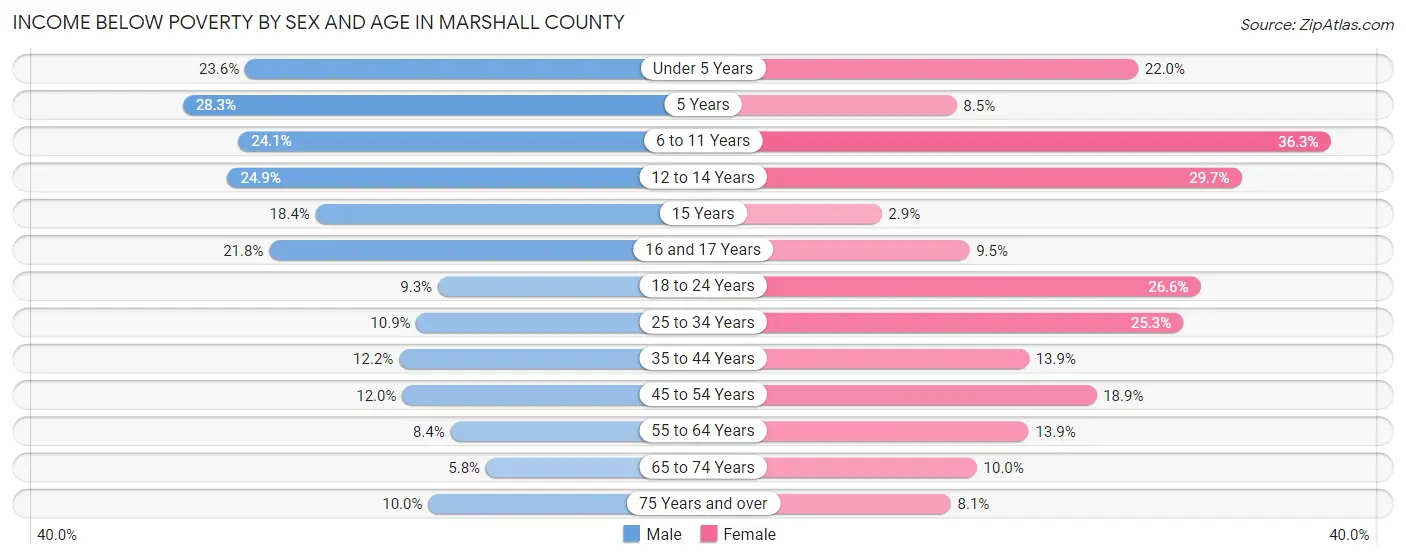
| Age Bracket | Male | Female |
| Under 5 Years | 172 (23.6%) | 140 (22.0%) |
| 5 Years | 39 (28.3%) | 20 (8.5%) |
| 6 to 11 Years | 262 (24.1%) | 218 (36.3%) |
| 12 to 14 Years | 93 (24.9%) | 191 (29.7%) |
| 15 Years | 32 (18.4%) | 5 (2.9%) |
| 16 and 17 Years | 76 (21.8%) | 33 (9.5%) |
| 18 to 24 Years | 105 (9.3%) | 251 (26.6%) |
| 25 to 34 Years | 191 (10.9%) | 396 (25.3%) |
| 35 to 44 Years | 218 (12.2%) | 214 (13.9%) |
| 45 to 54 Years | 242 (12.0%) | 368 (18.9%) |
| 55 to 64 Years | 198 (8.4%) | 322 (13.9%) |
| 65 to 74 Years | 116 (5.8%) | 221 (10.0%) |
| 75 Years and over | 108 (10.0%) | 123 (8.1%) |
| Total | 1,852 (12.3%) | 2,502 (17.0%) |
Income Above Poverty by Sex and Age in Marshall County
According to the poverty statistics in Marshall County, males aged 65 to 74 years and females aged 15 years are the age groups that are most secure financially, with 94.3% of males and 97.1% of females in these age groups living above the poverty line.
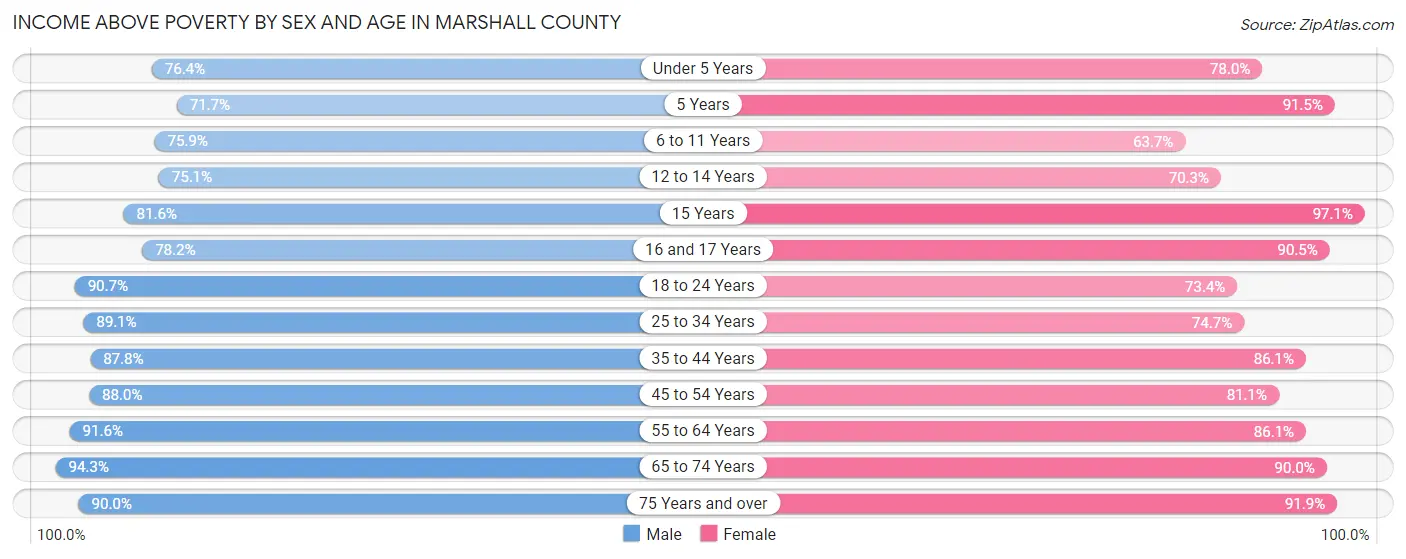
| Age Bracket | Male | Female |
| Under 5 Years | 556 (76.4%) | 497 (78.0%) |
| 5 Years | 99 (71.7%) | 215 (91.5%) |
| 6 to 11 Years | 824 (75.9%) | 383 (63.7%) |
| 12 to 14 Years | 280 (75.1%) | 453 (70.3%) |
| 15 Years | 142 (81.6%) | 165 (97.1%) |
| 16 and 17 Years | 272 (78.2%) | 316 (90.5%) |
| 18 to 24 Years | 1,023 (90.7%) | 692 (73.4%) |
| 25 to 34 Years | 1,559 (89.1%) | 1,167 (74.7%) |
| 35 to 44 Years | 1,571 (87.8%) | 1,328 (86.1%) |
| 45 to 54 Years | 1,781 (88.0%) | 1,580 (81.1%) |
| 55 to 64 Years | 2,169 (91.6%) | 2,002 (86.1%) |
| 65 to 74 Years | 1,900 (94.3%) | 1,987 (90.0%) |
| 75 Years and over | 969 (90.0%) | 1,400 (91.9%) |
| Total | 13,145 (87.6%) | 12,185 (83.0%) |
Income Below Poverty Among Married-Couple Families in Marshall County
The poverty statistics for married-couple families in Marshall County show that 5.7% or 328 of the total 5,804 families live below the poverty line. Families with 5 or more children have the highest poverty rate of 41.3%, comprising of 19 families. On the other hand, families with 3 or 4 children have the lowest poverty rate of 5.0%, which includes 13 families.
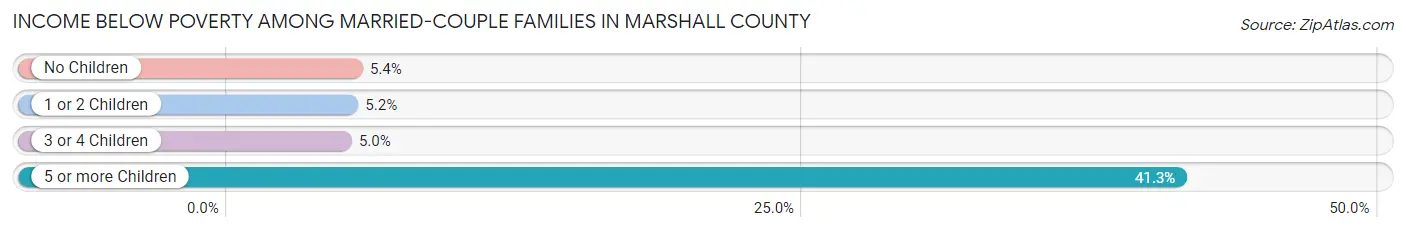
| Children | Above Poverty | Below Poverty |
| No Children | 3,879 (94.6%) | 223 (5.4%) |
| 1 or 2 Children | 1,321 (94.8%) | 73 (5.2%) |
| 3 or 4 Children | 249 (95.0%) | 13 (5.0%) |
| 5 or more Children | 27 (58.7%) | 19 (41.3%) |
| Total | 5,476 (94.4%) | 328 (5.7%) |
Income Below Poverty Among Single-Parent Households in Marshall County
According to the poverty data in Marshall County, 15.7% or 81 single-father households and 32.8% or 510 single-mother households are living below the poverty line. Among single-father households, those with 1 or 2 children have the highest poverty rate, with 65 households (34.6%) experiencing poverty. Likewise, among single-mother households, those with 5 or more children have the highest poverty rate, with 4 households (100.0%) falling below the poverty line.
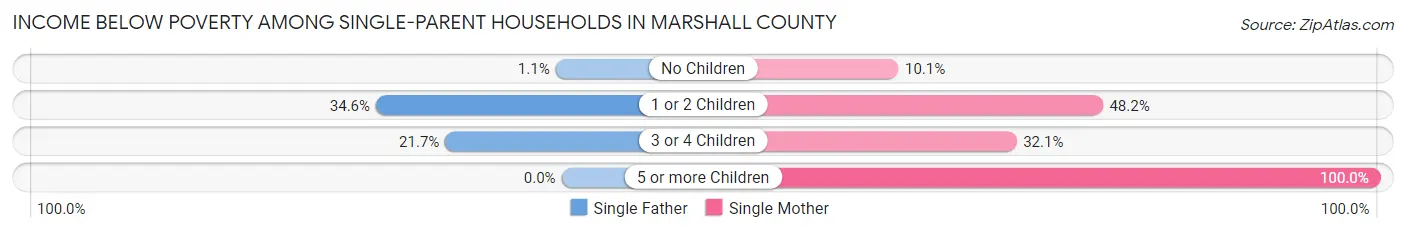
| Children | Single Father | Single Mother |
| No Children | 3 (1.1%) | 61 (10.1%) |
| 1 or 2 Children | 65 (34.6%) | 418 (48.2%) |
| 3 or 4 Children | 13 (21.7%) | 27 (32.1%) |
| 5 or more Children | 0 (0.0%) | 4 (100.0%) |
| Total | 81 (15.7%) | 510 (32.8%) |
Income Below Poverty Among Married-Couple vs Single-Parent Households in Marshall County
The poverty data for Marshall County shows that 328 of the married-couple family households (5.7%) and 591 of the single-parent households (28.5%) are living below the poverty level. Within the married-couple family households, those with 5 or more children have the highest poverty rate, with 19 households (41.3%) falling below the poverty line. Among the single-parent households, those with 5 or more children have the highest poverty rate, with 4 household (100.0%) living below poverty.
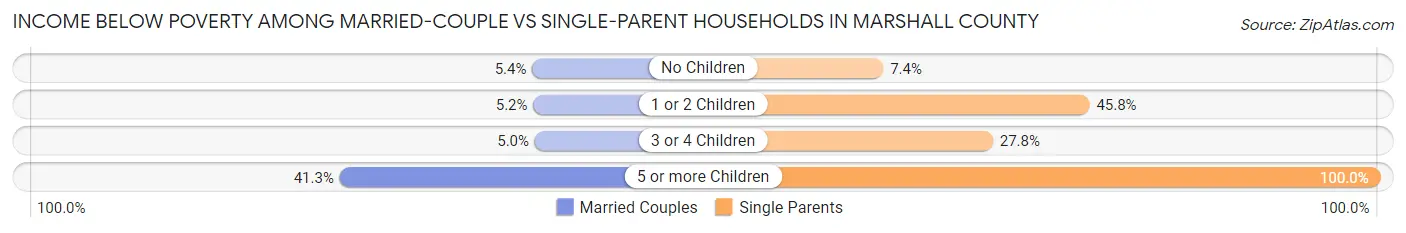
| Children | Married-Couple Families | Single-Parent Households |
| No Children | 223 (5.4%) | 64 (7.4%) |
| 1 or 2 Children | 73 (5.2%) | 483 (45.8%) |
| 3 or 4 Children | 13 (5.0%) | 40 (27.8%) |
| 5 or more Children | 19 (41.3%) | 4 (100.0%) |
| Total | 328 (5.7%) | 591 (28.5%) |
Employment Characteristics in Marshall County
Employment by Class of Employer in Marshall County
Among the 12,888 employed individuals in Marshall County, private company employees (9,147 | 71.0%), local government employees (1,167 | 9.0%), and not-for-profit organizations (957 | 7.4%) make up the most common classes of employment.
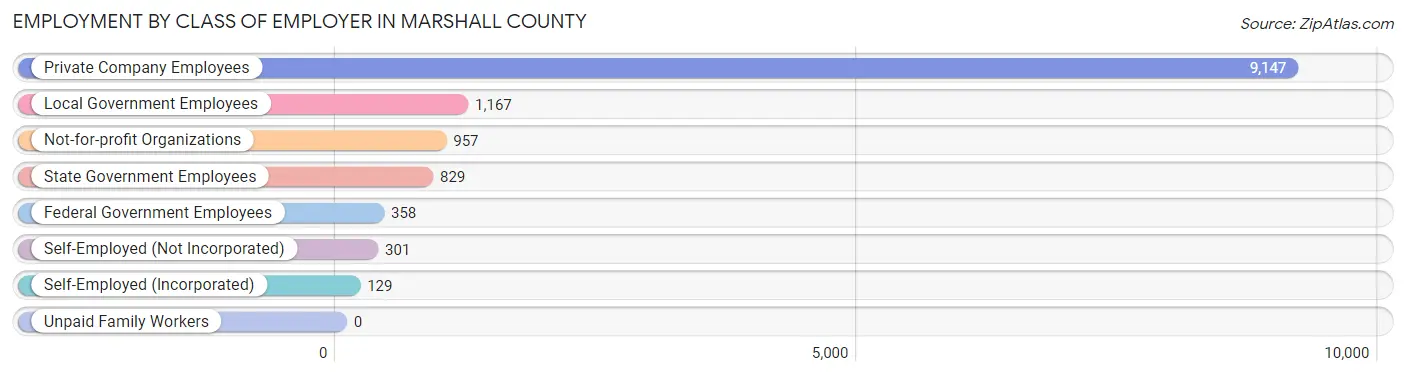
| Employer Class | # Employees | % Employees |
| Private Company Employees | 9,147 | 71.0% |
| Self-Employed (Incorporated) | 129 | 1.0% |
| Self-Employed (Not Incorporated) | 301 | 2.3% |
| Not-for-profit Organizations | 957 | 7.4% |
| Local Government Employees | 1,167 | 9.0% |
| State Government Employees | 829 | 6.4% |
| Federal Government Employees | 358 | 2.8% |
| Unpaid Family Workers | 0 | 0.0% |
| Total | 12,888 | 100.0% |
Employment Status by Age in Marshall County
According to the labor force statistics for Marshall County, out of the total population over 16 years of age (25,536), 53.6% or 13,687 individuals are in the labor force, with 3.9% or 534 of them unemployed. The age group with the highest labor force participation rate is 25 to 29 years, with 83.3% or 1,513 individuals in the labor force. Within the labor force, the 16 to 19 years age range has the highest percentage of unemployed individuals, with 8.3% or 41 of them being unemployed.
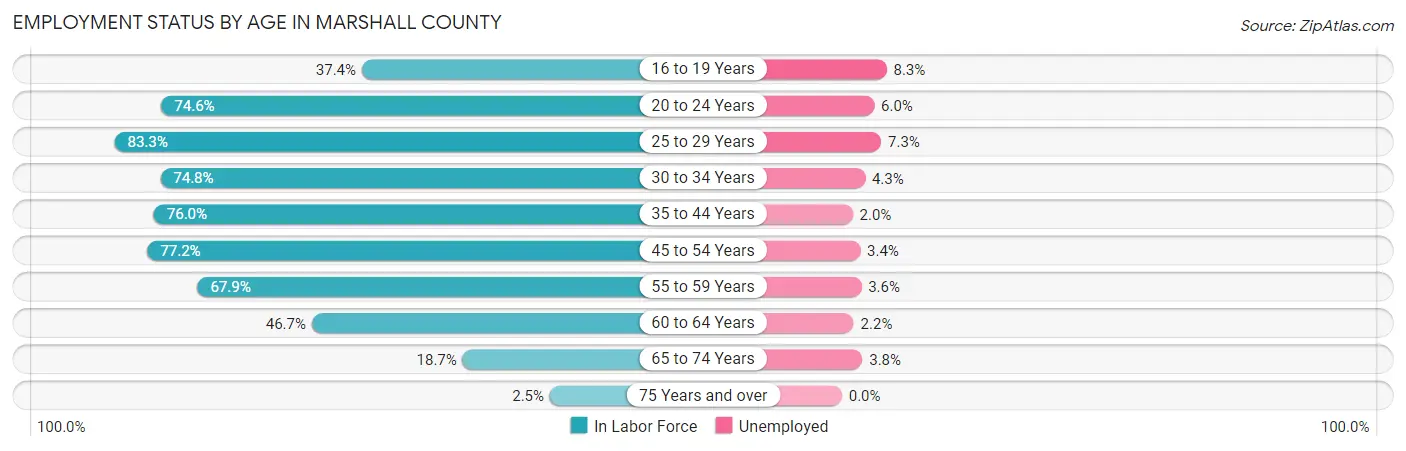
| Age Bracket | In Labor Force | Unemployed |
| 16 to 19 Years | 492 (37.4%) | 41 (8.3%) |
| 20 to 24 Years | 1,127 (74.6%) | 68 (6.0%) |
| 25 to 29 Years | 1,513 (83.3%) | 110 (7.3%) |
| 30 to 34 Years | 1,233 (74.8%) | 53 (4.3%) |
| 35 to 44 Years | 2,645 (76.0%) | 53 (2.0%) |
| 45 to 54 Years | 3,125 (77.2%) | 106 (3.4%) |
| 55 to 59 Years | 1,485 (67.9%) | 53 (3.6%) |
| 60 to 64 Years | 1,195 (46.7%) | 26 (2.2%) |
| 65 to 74 Years | 796 (18.7%) | 30 (3.8%) |
| 75 Years and over | 68 (2.5%) | 0 (0.0%) |
| Total | 13,687 (53.6%) | 534 (3.9%) |
Employment Status by Educational Attainment in Marshall County
According to labor force statistics for Marshall County, 71.2% of individuals (11,206) out of the total population between 25 and 64 years of age (15,739) are in the labor force, with 3.6% or 403 of them being unemployed. The group with the highest labor force participation rate are those with the educational attainment of bachelor's degree or higher, with 88.6% or 2,671 individuals in the labor force. Within the labor force, individuals with high school diploma education have the highest percentage of unemployment, with 5.7% or 251 of them being unemployed.
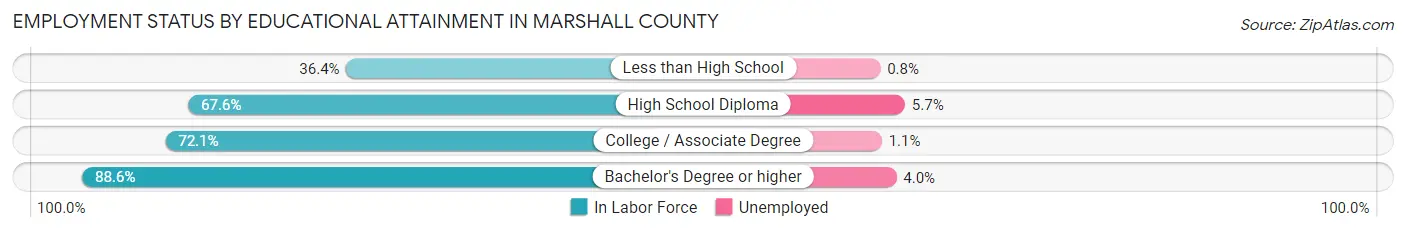
| Educational Attainment | In Labor Force | Unemployed |
| Less than High School | 360 (36.4%) | 8 (0.8%) |
| High School Diploma | 4,397 (67.6%) | 371 (5.7%) |
| College / Associate Degree | 3,772 (72.1%) | 58 (1.1%) |
| Bachelor's Degree or higher | 2,671 (88.6%) | 121 (4.0%) |
| Total | 11,206 (71.2%) | 567 (3.6%) |
Employment Occupations by Sex in Marshall County
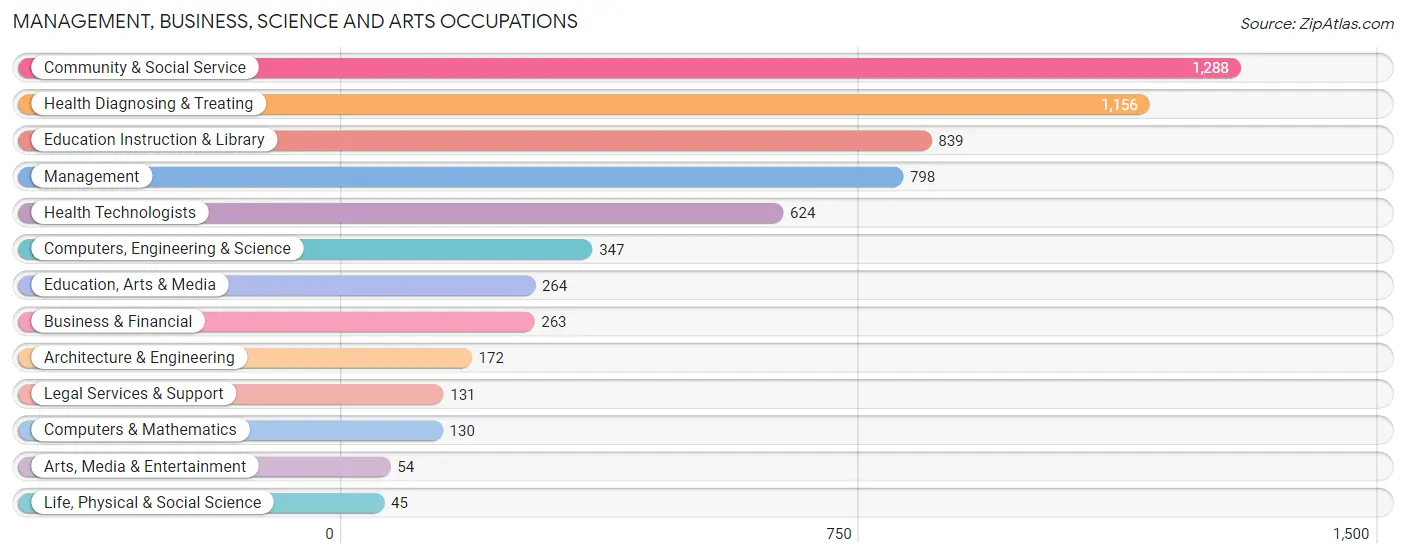
Management, Business, Science and Arts Occupations
The most common Management, Business, Science and Arts occupations in Marshall County are Community & Social Service (1,288 | 9.8%), Health Diagnosing & Treating (1,156 | 8.8%), Education Instruction & Library (839 | 6.4%), Management (798 | 6.1%), and Health Technologists (624 | 4.8%).
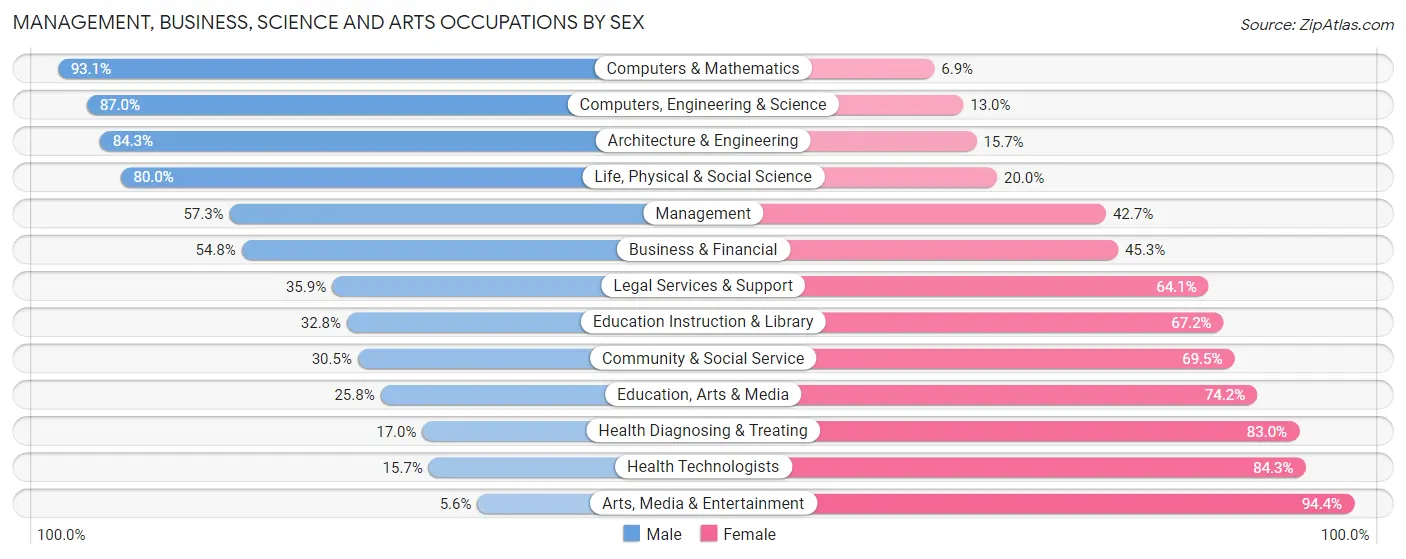
Management, Business, Science and Arts Occupations by Sex
Within the Management, Business, Science and Arts occupations in Marshall County, the most male-oriented occupations are Computers & Mathematics (93.1%), Computers, Engineering & Science (87.0%), and Architecture & Engineering (84.3%), while the most female-oriented occupations are Arts, Media & Entertainment (94.4%), Health Technologists (84.3%), and Health Diagnosing & Treating (83.0%).
| Occupation | Male | Female |
| Management | 457 (57.3%) | 341 (42.7%) |
| Business & Financial | 144 (54.7%) | 119 (45.3%) |
| Computers, Engineering & Science | 302 (87.0%) | 45 (13.0%) |
| Computers & Mathematics | 121 (93.1%) | 9 (6.9%) |
| Architecture & Engineering | 145 (84.3%) | 27 (15.7%) |
| Life, Physical & Social Science | 36 (80.0%) | 9 (20.0%) |
| Community & Social Service | 393 (30.5%) | 895 (69.5%) |
| Education, Arts & Media | 68 (25.8%) | 196 (74.2%) |
| Legal Services & Support | 47 (35.9%) | 84 (64.1%) |
| Education Instruction & Library | 275 (32.8%) | 564 (67.2%) |
| Arts, Media & Entertainment | 3 (5.6%) | 51 (94.4%) |
| Health Diagnosing & Treating | 197 (17.0%) | 959 (83.0%) |
| Health Technologists | 98 (15.7%) | 526 (84.3%) |
| Total (Category) | 1,493 (38.8%) | 2,359 (61.2%) |
| Total (Overall) | 7,337 (55.8%) | 5,806 (44.2%) |
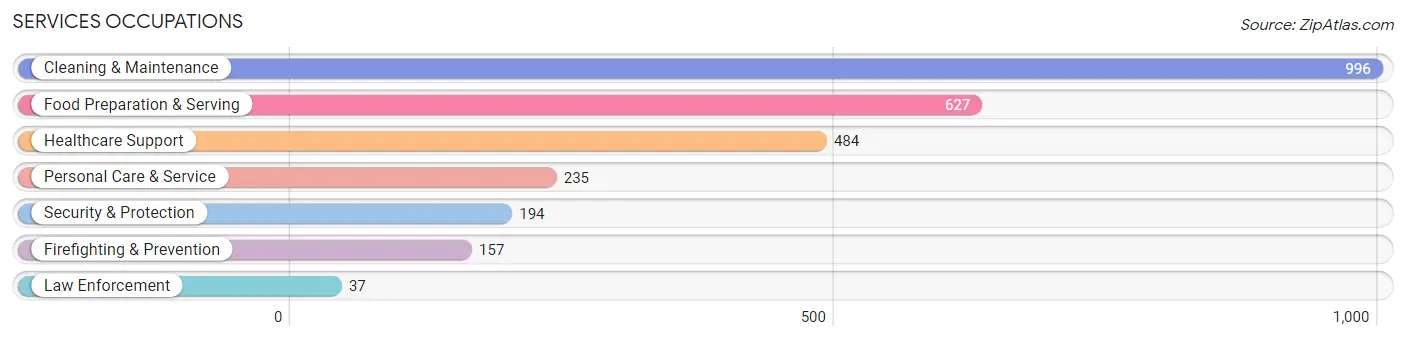
Services Occupations
The most common Services occupations in Marshall County are Cleaning & Maintenance (996 | 7.6%), Food Preparation & Serving (627 | 4.8%), Healthcare Support (484 | 3.7%), Personal Care & Service (235 | 1.8%), and Security & Protection (194 | 1.5%).
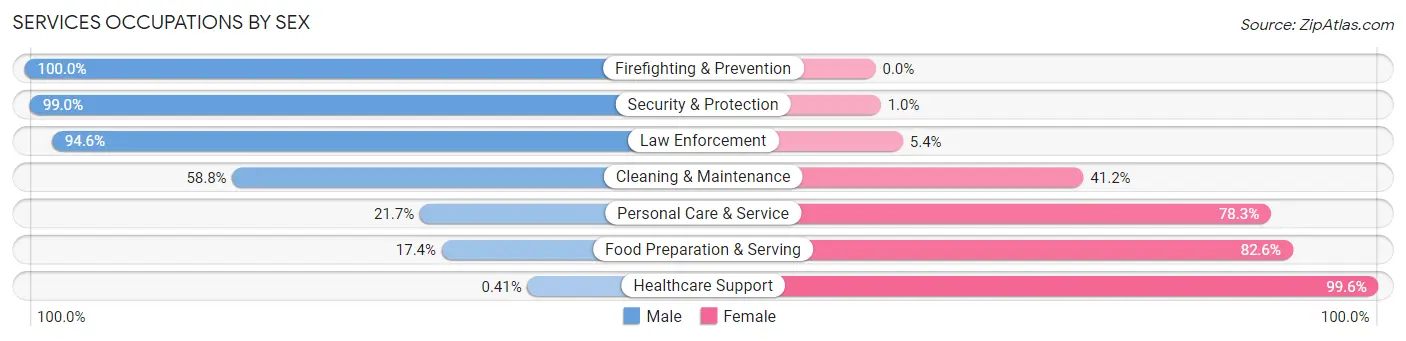
Services Occupations by Sex
Within the Services occupations in Marshall County, the most male-oriented occupations are Firefighting & Prevention (100.0%), Security & Protection (99.0%), and Law Enforcement (94.6%), while the most female-oriented occupations are Healthcare Support (99.6%), Food Preparation & Serving (82.6%), and Personal Care & Service (78.3%).
| Occupation | Male | Female |
| Healthcare Support | 2 (0.4%) | 482 (99.6%) |
| Security & Protection | 192 (99.0%) | 2 (1.0%) |
| Firefighting & Prevention | 157 (100.0%) | 0 (0.0%) |
| Law Enforcement | 35 (94.6%) | 2 (5.4%) |
| Food Preparation & Serving | 109 (17.4%) | 518 (82.6%) |
| Cleaning & Maintenance | 586 (58.8%) | 410 (41.2%) |
| Personal Care & Service | 51 (21.7%) | 184 (78.3%) |
| Total (Category) | 940 (37.1%) | 1,596 (62.9%) |
| Total (Overall) | 7,337 (55.8%) | 5,806 (44.2%) |
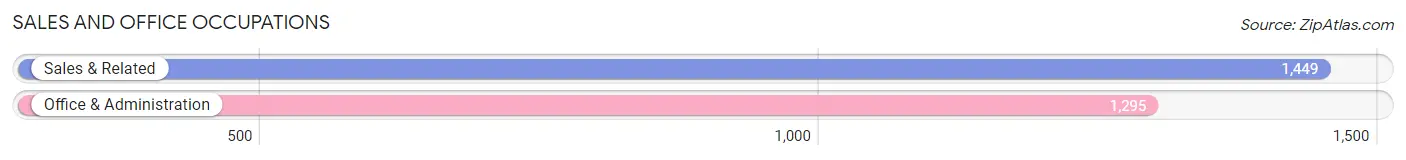
Sales and Office Occupations
The most common Sales and Office occupations in Marshall County are Sales & Related (1,449 | 11.0%), and Office & Administration (1,295 | 9.9%).
Sales and Office Occupations by Sex
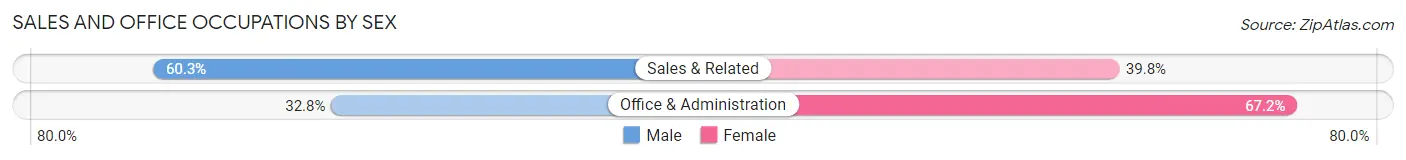
| Occupation | Male | Female |
| Sales & Related | 873 (60.3%) | 576 (39.8%) |
| Office & Administration | 425 (32.8%) | 870 (67.2%) |
| Total (Category) | 1,298 (47.3%) | 1,446 (52.7%) |
| Total (Overall) | 7,337 (55.8%) | 5,806 (44.2%) |
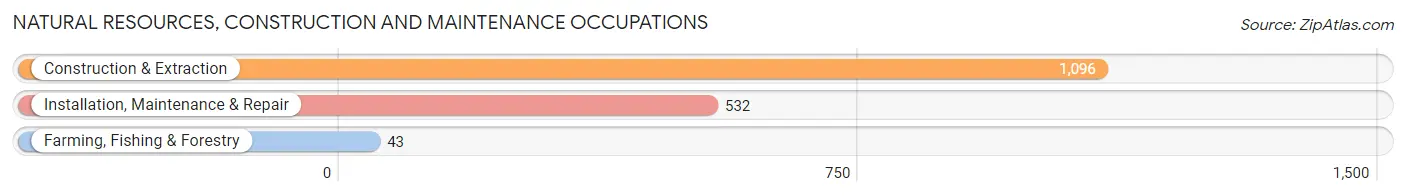
Natural Resources, Construction and Maintenance Occupations
The most common Natural Resources, Construction and Maintenance occupations in Marshall County are Construction & Extraction (1,096 | 8.3%), Installation, Maintenance & Repair (532 | 4.1%), and Farming, Fishing & Forestry (43 | 0.3%).
Natural Resources, Construction and Maintenance Occupations by Sex
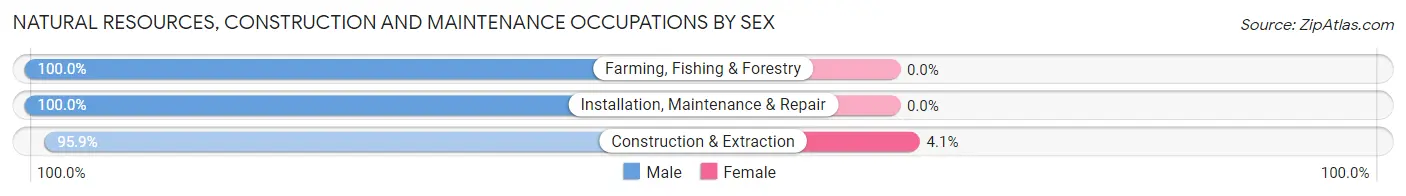
| Occupation | Male | Female |
| Farming, Fishing & Forestry | 43 (100.0%) | 0 (0.0%) |
| Construction & Extraction | 1,051 (95.9%) | 45 (4.1%) |
| Installation, Maintenance & Repair | 532 (100.0%) | 0 (0.0%) |
| Total (Category) | 1,626 (97.3%) | 45 (2.7%) |
| Total (Overall) | 7,337 (55.8%) | 5,806 (44.2%) |
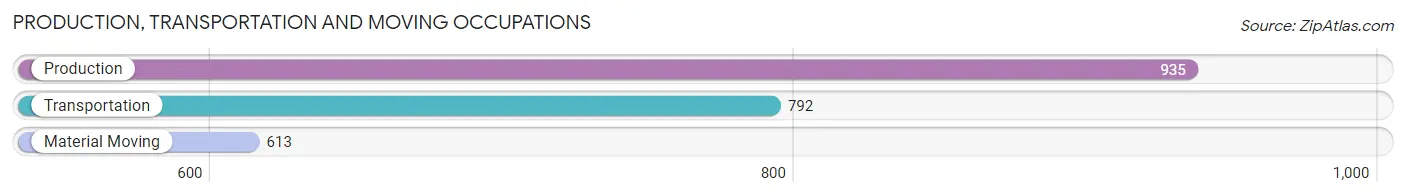
Production, Transportation and Moving Occupations
The most common Production, Transportation and Moving occupations in Marshall County are Production (935 | 7.1%), Transportation (792 | 6.0%), and Material Moving (613 | 4.7%).
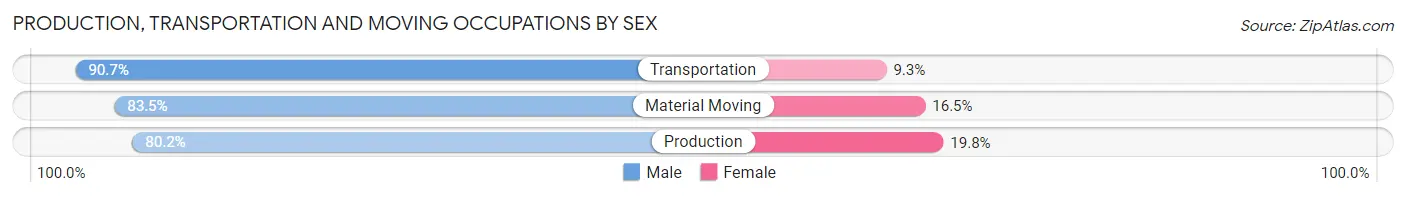
Production, Transportation and Moving Occupations by Sex
| Occupation | Male | Female |
| Production | 750 (80.2%) | 185 (19.8%) |
| Transportation | 718 (90.7%) | 74 (9.3%) |
| Material Moving | 512 (83.5%) | 101 (16.5%) |
| Total (Category) | 1,980 (84.6%) | 360 (15.4%) |
| Total (Overall) | 7,337 (55.8%) | 5,806 (44.2%) |
Employment Industries by Sex in Marshall County
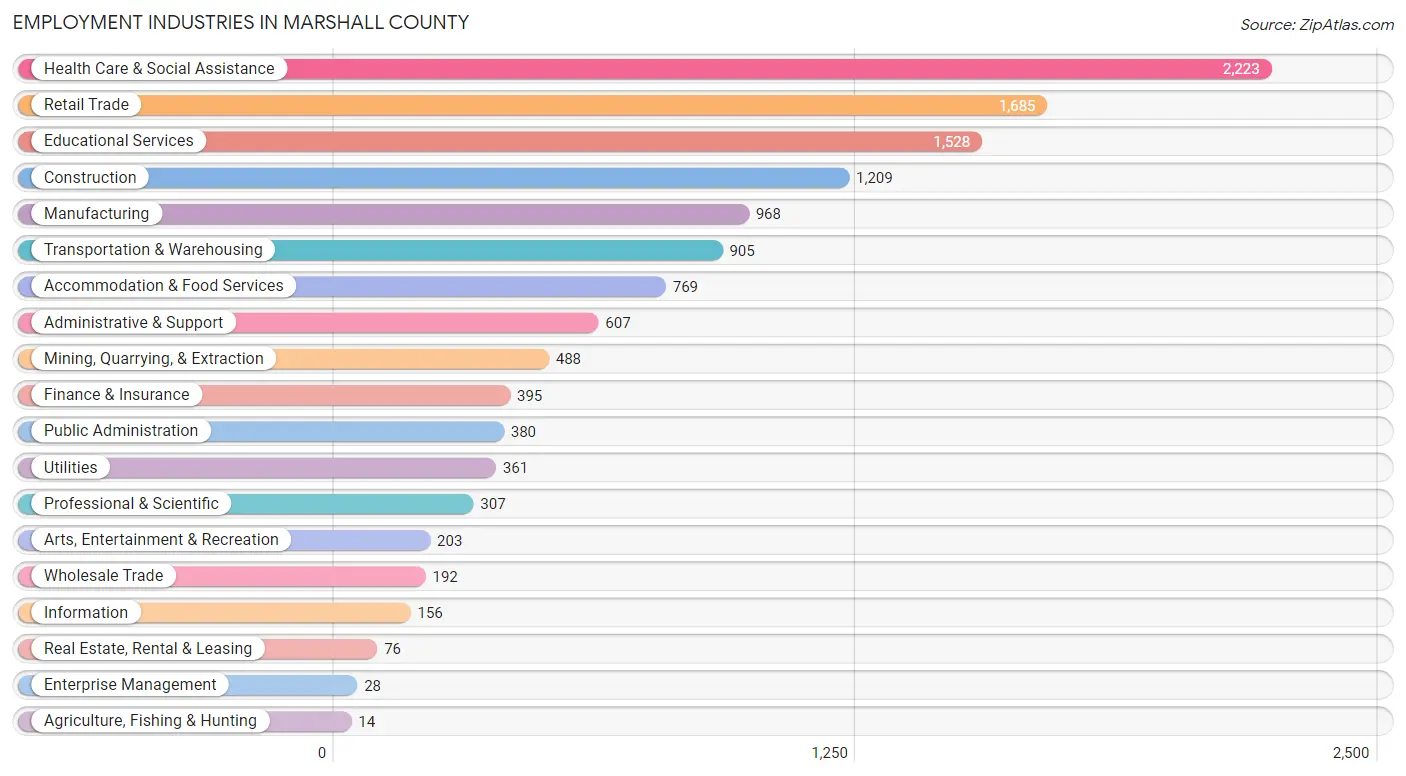
Employment Industries in Marshall County
The major employment industries in Marshall County include Health Care & Social Assistance (2,223 | 16.9%), Retail Trade (1,685 | 12.8%), Educational Services (1,528 | 11.6%), Construction (1,209 | 9.2%), and Manufacturing (968 | 7.4%).
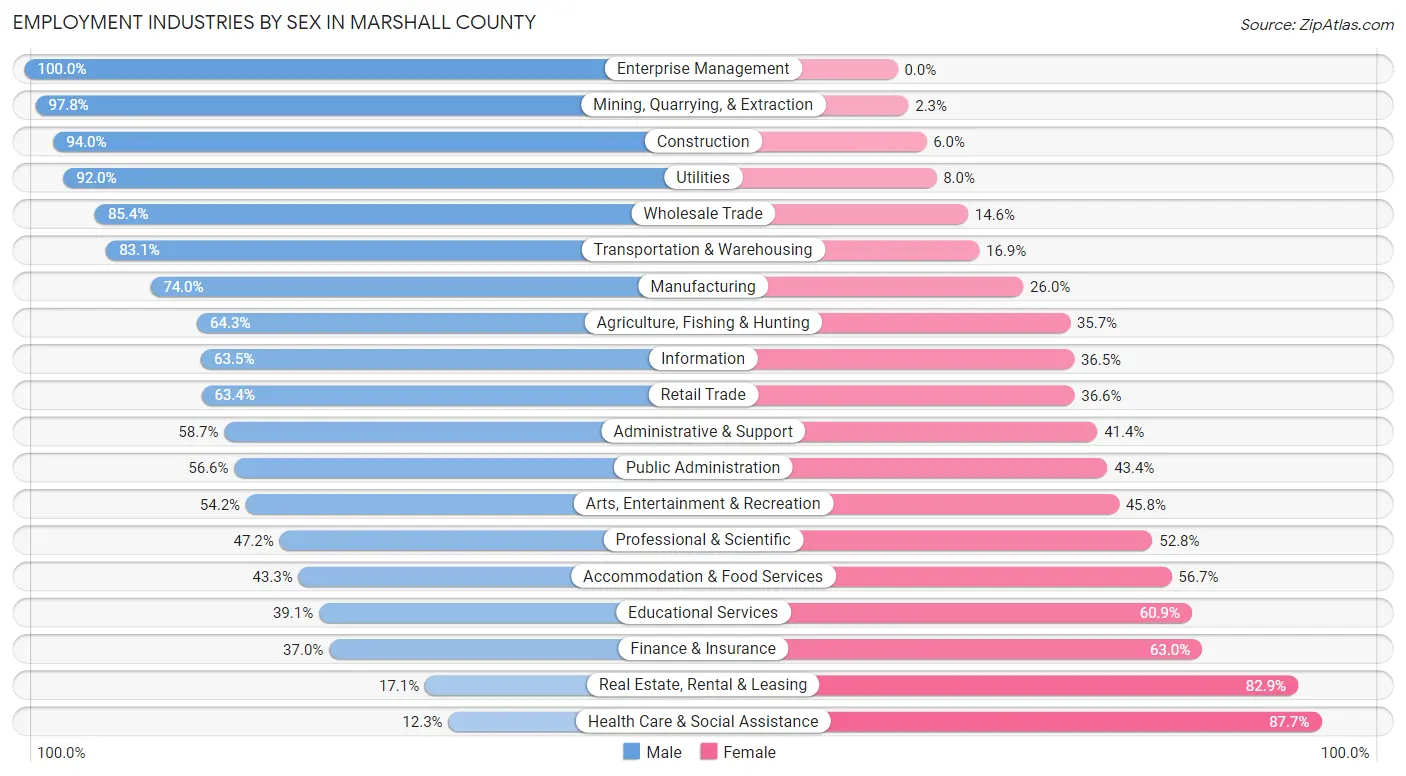
Employment Industries by Sex in Marshall County
The Marshall County industries that see more men than women are Enterprise Management (100.0%), Mining, Quarrying, & Extraction (97.8%), and Construction (94.0%), whereas the industries that tend to have a higher number of women are Health Care & Social Assistance (87.7%), Real Estate, Rental & Leasing (82.9%), and Finance & Insurance (63.0%).
| Industry | Male | Female |
| Agriculture, Fishing & Hunting | 9 (64.3%) | 5 (35.7%) |
| Mining, Quarrying, & Extraction | 477 (97.8%) | 11 (2.2%) |
| Construction | 1,137 (94.0%) | 72 (6.0%) |
| Manufacturing | 716 (74.0%) | 252 (26.0%) |
| Wholesale Trade | 164 (85.4%) | 28 (14.6%) |
| Retail Trade | 1,068 (63.4%) | 617 (36.6%) |
| Transportation & Warehousing | 752 (83.1%) | 153 (16.9%) |
| Utilities | 332 (92.0%) | 29 (8.0%) |
| Information | 99 (63.5%) | 57 (36.5%) |
| Finance & Insurance | 146 (37.0%) | 249 (63.0%) |
| Real Estate, Rental & Leasing | 13 (17.1%) | 63 (82.9%) |
| Professional & Scientific | 145 (47.2%) | 162 (52.8%) |
| Enterprise Management | 28 (100.0%) | 0 (0.0%) |
| Administrative & Support | 356 (58.7%) | 251 (41.3%) |
| Educational Services | 597 (39.1%) | 931 (60.9%) |
| Health Care & Social Assistance | 273 (12.3%) | 1,950 (87.7%) |
| Arts, Entertainment & Recreation | 110 (54.2%) | 93 (45.8%) |
| Accommodation & Food Services | 333 (43.3%) | 436 (56.7%) |
| Public Administration | 215 (56.6%) | 165 (43.4%) |
| Total | 7,337 (55.8%) | 5,806 (44.2%) |
Education in Marshall County
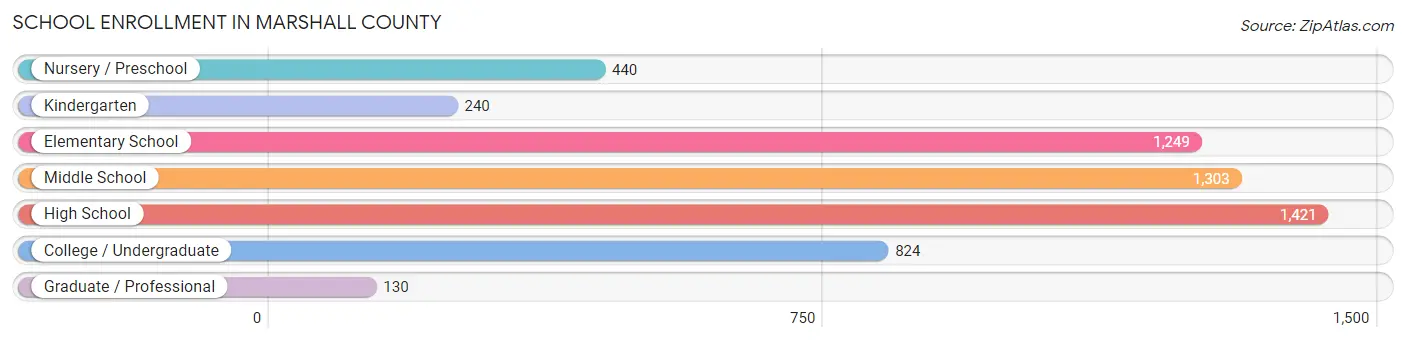
School Enrollment in Marshall County
The most common levels of schooling among the 5,607 students in Marshall County are high school (1,421 | 25.3%), middle school (1,303 | 23.2%), and elementary school (1,249 | 22.3%).
| School Level | # Students | % Students |
| Nursery / Preschool | 440 | 7.9% |
| Kindergarten | 240 | 4.3% |
| Elementary School | 1,249 | 22.3% |
| Middle School | 1,303 | 23.2% |
| High School | 1,421 | 25.3% |
| College / Undergraduate | 824 | 14.7% |
| Graduate / Professional | 130 | 2.3% |
| Total | 5,607 | 100.0% |
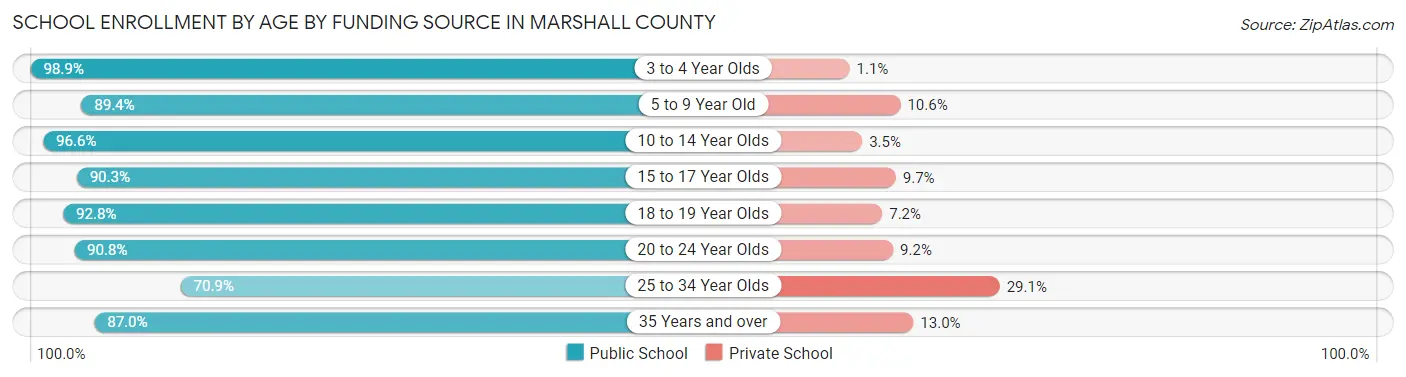
School Enrollment by Age by Funding Source in Marshall County
Out of a total of 5,607 students who are enrolled in schools in Marshall County, 488 (8.7%) attend a private institution, while the remaining 5,119 (91.3%) are enrolled in public schools. The age group of 25 to 34 year olds has the highest likelihood of being enrolled in private schools, with 84 (29.1% in the age bracket) enrolled. Conversely, the age group of 3 to 4 year olds has the lowest likelihood of being enrolled in a private school, with 180 (98.9% in the age bracket) attending a public institution.
| Age Bracket | Public School | Private School |
| 3 to 4 Year Olds | 180 (98.9%) | 2 (1.1%) |
| 5 to 9 Year Old | 1,344 (89.4%) | 159 (10.6%) |
| 10 to 14 Year Olds | 1,624 (96.6%) | 58 (3.5%) |
| 15 to 17 Year Olds | 901 (90.3%) | 97 (9.7%) |
| 18 to 19 Year Olds | 387 (92.8%) | 30 (7.2%) |
| 20 to 24 Year Olds | 256 (90.8%) | 26 (9.2%) |
| 25 to 34 Year Olds | 205 (70.9%) | 84 (29.1%) |
| 35 Years and over | 221 (87.0%) | 33 (13.0%) |
| Total | 5,119 (91.3%) | 488 (8.7%) |
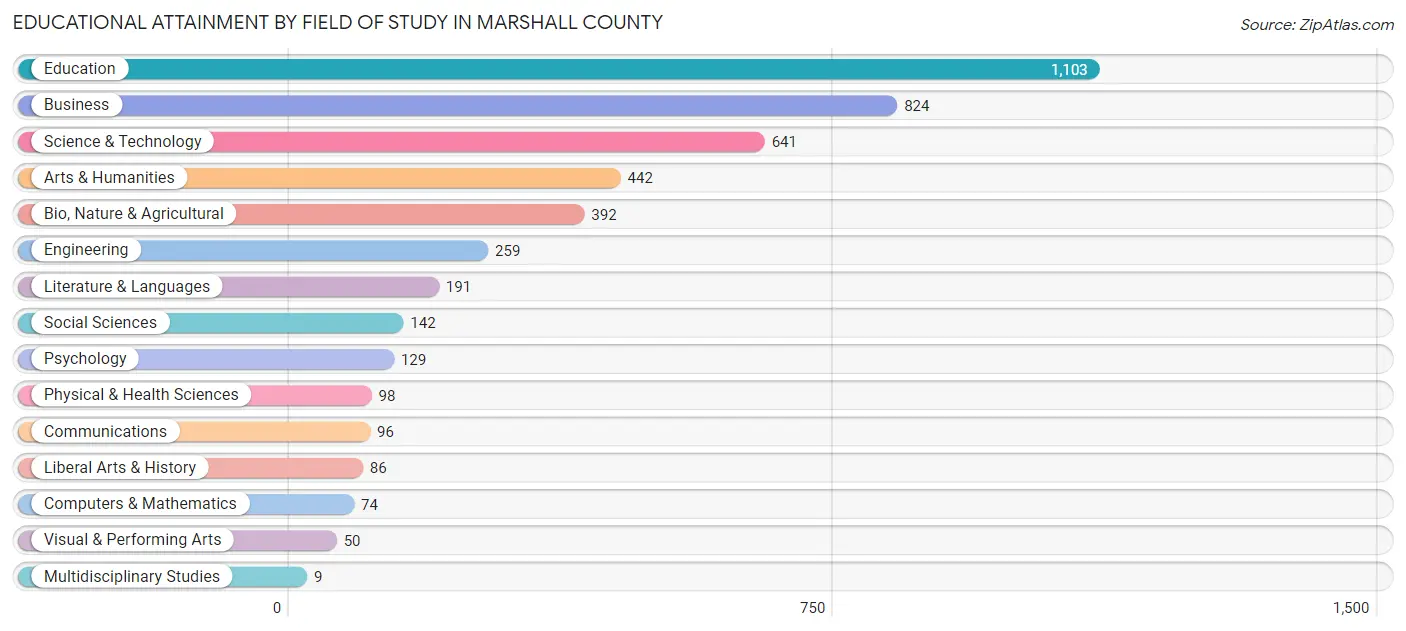
Educational Attainment by Field of Study in Marshall County
Education (1,103 | 24.3%), business (824 | 18.2%), science & technology (641 | 14.1%), arts & humanities (442 | 9.7%), and bio, nature & agricultural (392 | 8.6%) are the most common fields of study among 4,536 individuals in Marshall County who have obtained a bachelor's degree or higher.
| Field of Study | # Graduates | % Graduates |
| Computers & Mathematics | 74 | 1.6% |
| Bio, Nature & Agricultural | 392 | 8.6% |
| Physical & Health Sciences | 98 | 2.2% |
| Psychology | 129 | 2.8% |
| Social Sciences | 142 | 3.1% |
| Engineering | 259 | 5.7% |
| Multidisciplinary Studies | 9 | 0.2% |
| Science & Technology | 641 | 14.1% |
| Business | 824 | 18.2% |
| Education | 1,103 | 24.3% |
| Literature & Languages | 191 | 4.2% |
| Liberal Arts & History | 86 | 1.9% |
| Visual & Performing Arts | 50 | 1.1% |
| Communications | 96 | 2.1% |
| Arts & Humanities | 442 | 9.7% |
| Total | 4,536 | 100.0% |
Transportation & Commute in Marshall County
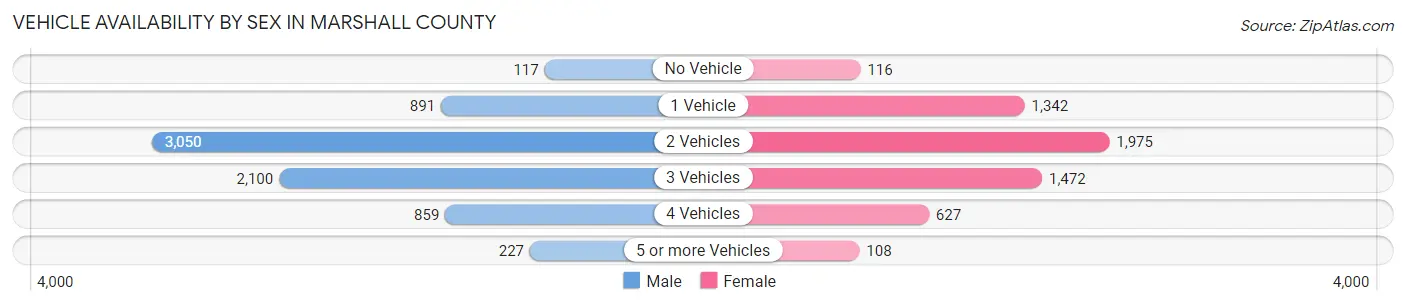
Vehicle Availability by Sex in Marshall County
The most prevalent vehicle ownership categories in Marshall County are males with 2 vehicles (3,050, accounting for 42.1%) and females with 2 vehicles (1,975, making up 54.1%).
| Vehicles Available | Male | Female |
| No Vehicle | 117 (1.6%) | 116 (2.1%) |
| 1 Vehicle | 891 (12.3%) | 1,342 (23.8%) |
| 2 Vehicles | 3,050 (42.1%) | 1,975 (35.0%) |
| 3 Vehicles | 2,100 (29.0%) | 1,472 (26.1%) |
| 4 Vehicles | 859 (11.9%) | 627 (11.1%) |
| 5 or more Vehicles | 227 (3.1%) | 108 (1.9%) |
| Total | 7,244 (100.0%) | 5,640 (100.0%) |
Commute Time in Marshall County
The most frequently occuring commute durations in Marshall County are 20 to 24 minutes (1,996 commuters, 16.1%), 30 to 34 minutes (1,920 commuters, 15.5%), and 10 to 14 minutes (1,750 commuters, 14.1%).
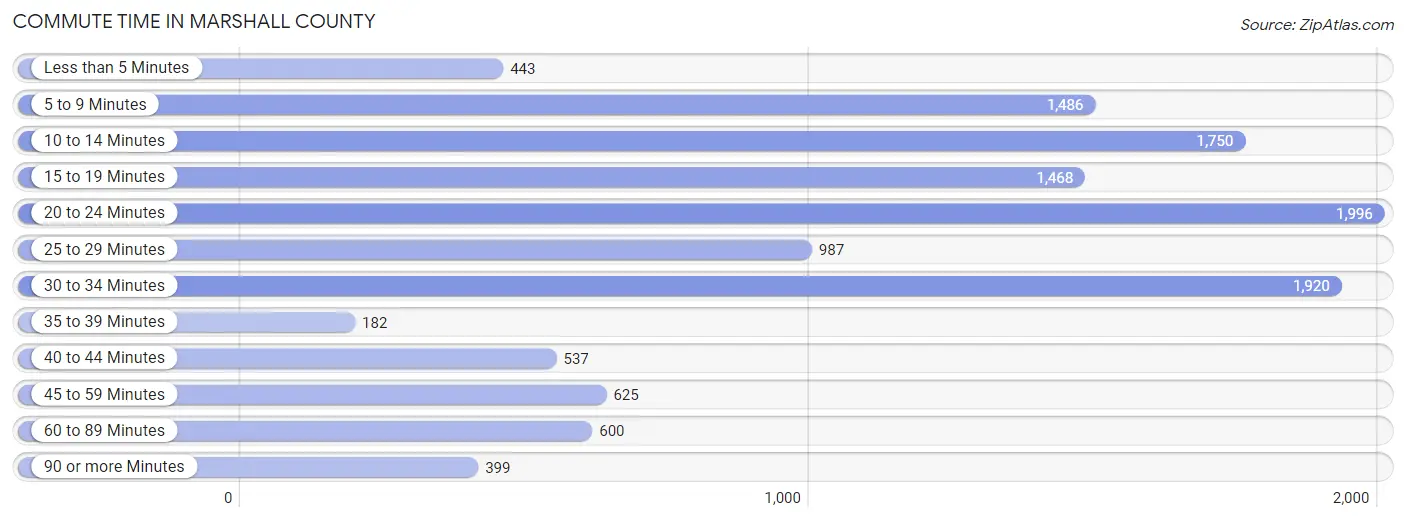
| Commute Time | # Commuters | % Commuters |
| Less than 5 Minutes | 443 | 3.6% |
| 5 to 9 Minutes | 1,486 | 12.0% |
| 10 to 14 Minutes | 1,750 | 14.1% |
| 15 to 19 Minutes | 1,468 | 11.8% |
| 20 to 24 Minutes | 1,996 | 16.1% |
| 25 to 29 Minutes | 987 | 8.0% |
| 30 to 34 Minutes | 1,920 | 15.5% |
| 35 to 39 Minutes | 182 | 1.5% |
| 40 to 44 Minutes | 537 | 4.3% |
| 45 to 59 Minutes | 625 | 5.0% |
| 60 to 89 Minutes | 600 | 4.8% |
| 90 or more Minutes | 399 | 3.2% |
Commute Time by Sex in Marshall County
The most common commute times in Marshall County are 20 to 24 minutes (1,189 commuters, 16.9%) for males and 30 to 34 minutes (908 commuters, 17.0%) for females.
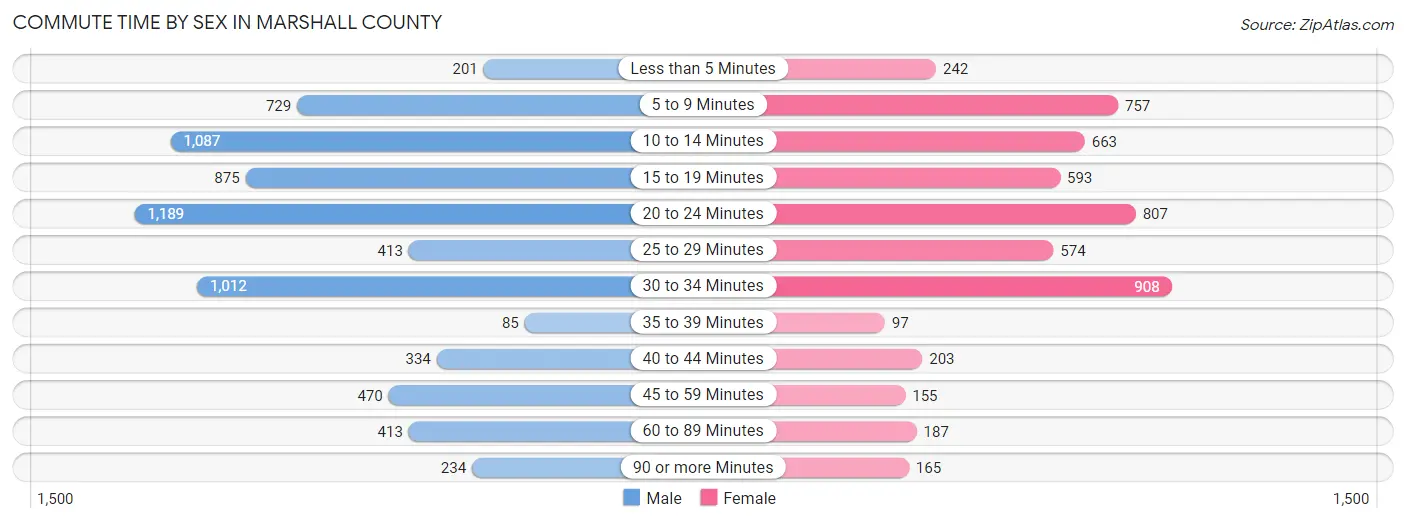
| Commute Time | Male | Female |
| Less than 5 Minutes | 201 (2.9%) | 242 (4.5%) |
| 5 to 9 Minutes | 729 (10.3%) | 757 (14.1%) |
| 10 to 14 Minutes | 1,087 (15.4%) | 663 (12.4%) |
| 15 to 19 Minutes | 875 (12.4%) | 593 (11.1%) |
| 20 to 24 Minutes | 1,189 (16.9%) | 807 (15.1%) |
| 25 to 29 Minutes | 413 (5.9%) | 574 (10.7%) |
| 30 to 34 Minutes | 1,012 (14.4%) | 908 (17.0%) |
| 35 to 39 Minutes | 85 (1.2%) | 97 (1.8%) |
| 40 to 44 Minutes | 334 (4.7%) | 203 (3.8%) |
| 45 to 59 Minutes | 470 (6.7%) | 155 (2.9%) |
| 60 to 89 Minutes | 413 (5.9%) | 187 (3.5%) |
| 90 or more Minutes | 234 (3.3%) | 165 (3.1%) |
Time of Departure to Work by Sex in Marshall County
The most frequent times of departure to work in Marshall County are 6:00 AM to 6:29 AM (1,183, 16.8%) for males and 7:30 AM to 7:59 AM (936, 17.5%) for females.
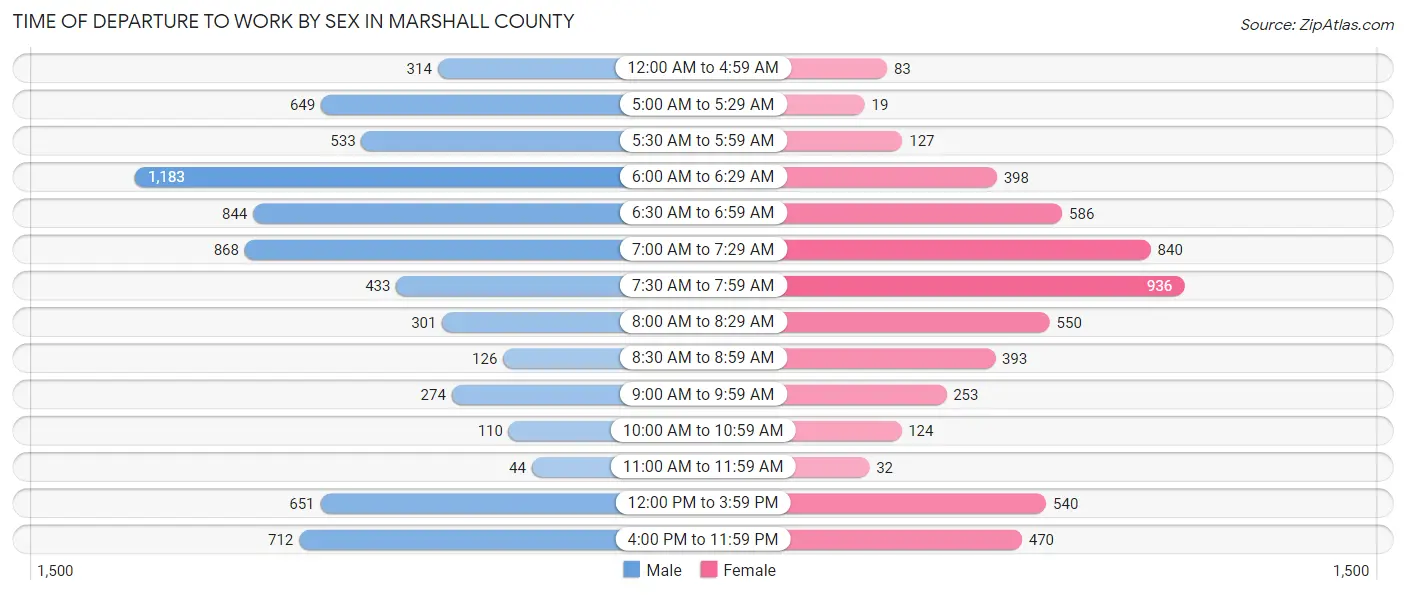
| Time of Departure | Male | Female |
| 12:00 AM to 4:59 AM | 314 (4.5%) | 83 (1.5%) |
| 5:00 AM to 5:29 AM | 649 (9.2%) | 19 (0.4%) |
| 5:30 AM to 5:59 AM | 533 (7.6%) | 127 (2.4%) |
| 6:00 AM to 6:29 AM | 1,183 (16.8%) | 398 (7.4%) |
| 6:30 AM to 6:59 AM | 844 (12.0%) | 586 (11.0%) |
| 7:00 AM to 7:29 AM | 868 (12.3%) | 840 (15.7%) |
| 7:30 AM to 7:59 AM | 433 (6.1%) | 936 (17.5%) |
| 8:00 AM to 8:29 AM | 301 (4.3%) | 550 (10.3%) |
| 8:30 AM to 8:59 AM | 126 (1.8%) | 393 (7.3%) |
| 9:00 AM to 9:59 AM | 274 (3.9%) | 253 (4.7%) |
| 10:00 AM to 10:59 AM | 110 (1.6%) | 124 (2.3%) |
| 11:00 AM to 11:59 AM | 44 (0.6%) | 32 (0.6%) |
| 12:00 PM to 3:59 PM | 651 (9.2%) | 540 (10.1%) |
| 4:00 PM to 11:59 PM | 712 (10.1%) | 470 (8.8%) |
| Total | 7,042 (100.0%) | 5,351 (100.0%) |
Housing Occupancy in Marshall County
Occupancy by Ownership in Marshall County
Of the total 12,055 dwellings in Marshall County, owner-occupied units account for 9,600 (79.6%), while renter-occupied units make up 2,455 (20.4%).
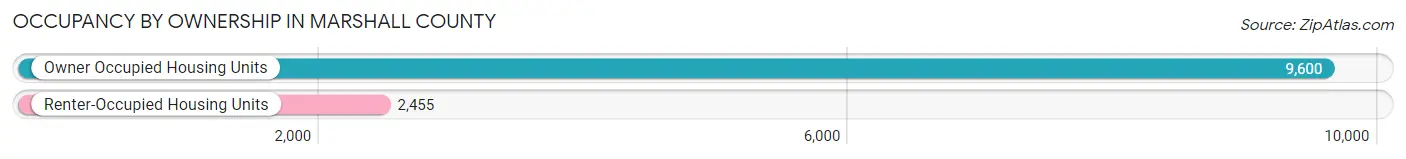
| Occupancy | # Housing Units | % Housing Units |
| Owner Occupied Housing Units | 9,600 | 79.6% |
| Renter-Occupied Housing Units | 2,455 | 20.4% |
| Total Occupied Housing Units | 12,055 | 100.0% |
Occupancy by Household Size in Marshall County
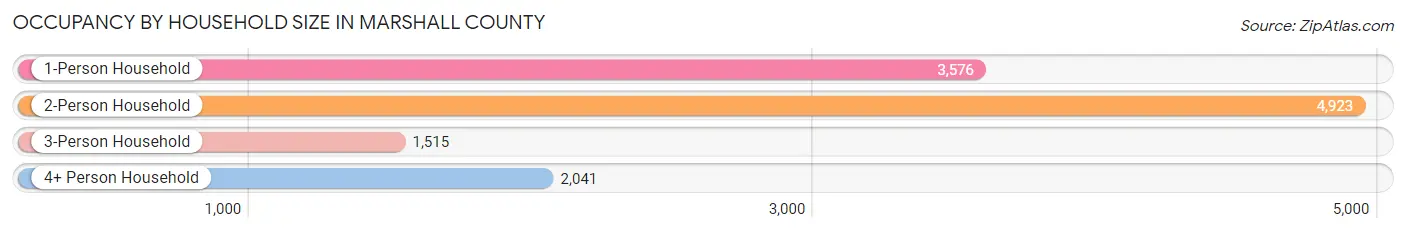
| Household Size | # Housing Units | % Housing Units |
| 1-Person Household | 3,576 | 29.7% |
| 2-Person Household | 4,923 | 40.8% |
| 3-Person Household | 1,515 | 12.6% |
| 4+ Person Household | 2,041 | 16.9% |
| Total Housing Units | 12,055 | 100.0% |
Occupancy by Ownership by Household Size in Marshall County
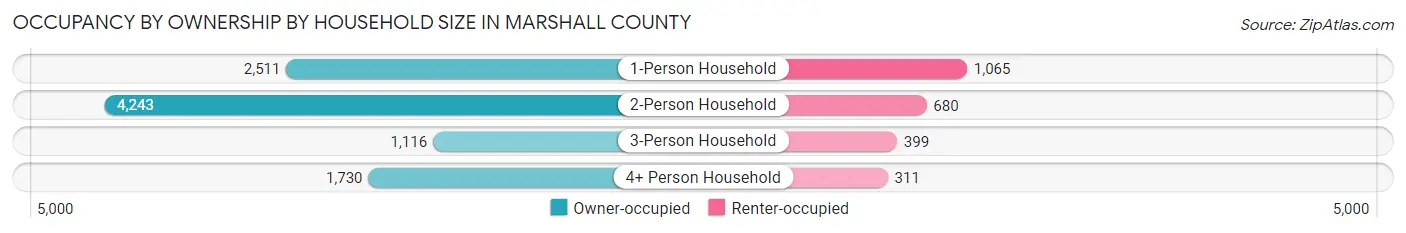
| Household Size | Owner-occupied | Renter-occupied |
| 1-Person Household | 2,511 (70.2%) | 1,065 (29.8%) |
| 2-Person Household | 4,243 (86.2%) | 680 (13.8%) |
| 3-Person Household | 1,116 (73.7%) | 399 (26.3%) |
| 4+ Person Household | 1,730 (84.8%) | 311 (15.2%) |
| Total Housing Units | 9,600 (79.6%) | 2,455 (20.4%) |
Occupancy by Educational Attainment in Marshall County
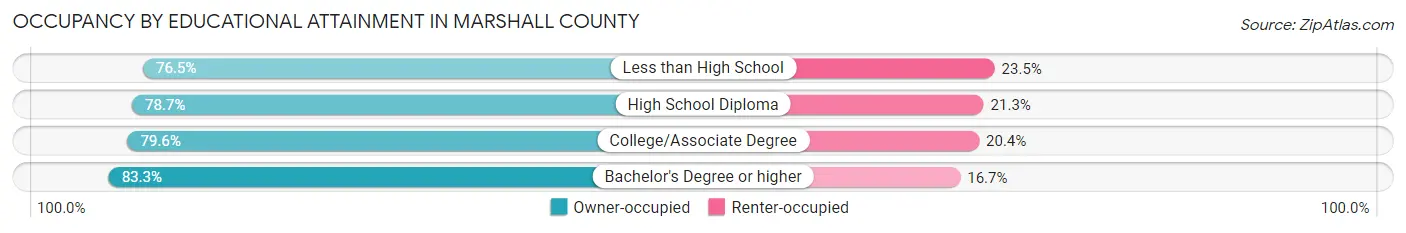
| Household Size | Owner-occupied | Renter-occupied |
| Less than High School | 671 (76.5%) | 206 (23.5%) |
| High School Diploma | 4,061 (78.7%) | 1,100 (21.3%) |
| College/Associate Degree | 3,100 (79.6%) | 795 (20.4%) |
| Bachelor's Degree or higher | 1,768 (83.3%) | 354 (16.7%) |
Occupancy by Age of Householder in Marshall County
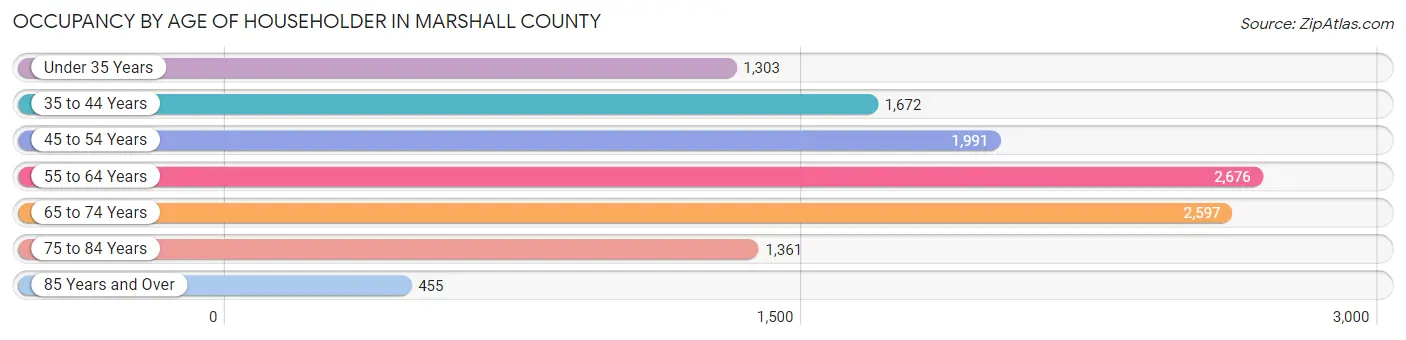
| Age Bracket | # Households | % Households |
| Under 35 Years | 1,303 | 10.8% |
| 35 to 44 Years | 1,672 | 13.9% |
| 45 to 54 Years | 1,991 | 16.5% |
| 55 to 64 Years | 2,676 | 22.2% |
| 65 to 74 Years | 2,597 | 21.5% |
| 75 to 84 Years | 1,361 | 11.3% |
| 85 Years and Over | 455 | 3.8% |
| Total | 12,055 | 100.0% |
Housing Finances in Marshall County
Median Income by Occupancy in Marshall County
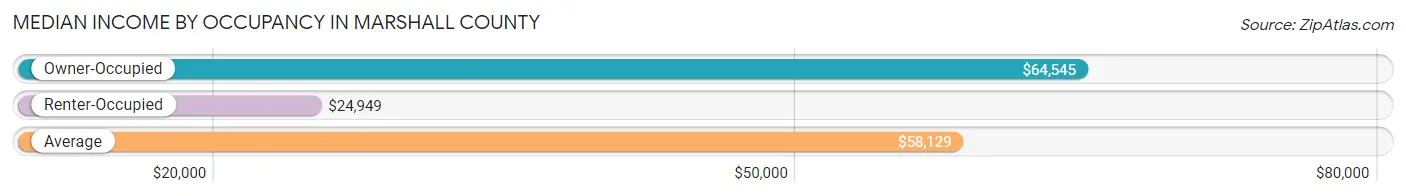
| Occupancy Type | # Households | Median Income |
| Owner-Occupied | 9,600 (79.6%) | $64,545 |
| Renter-Occupied | 2,455 (20.4%) | $24,949 |
| Average | 12,055 (100.0%) | $58,129 |
Occupancy by Householder Income Bracket in Marshall County
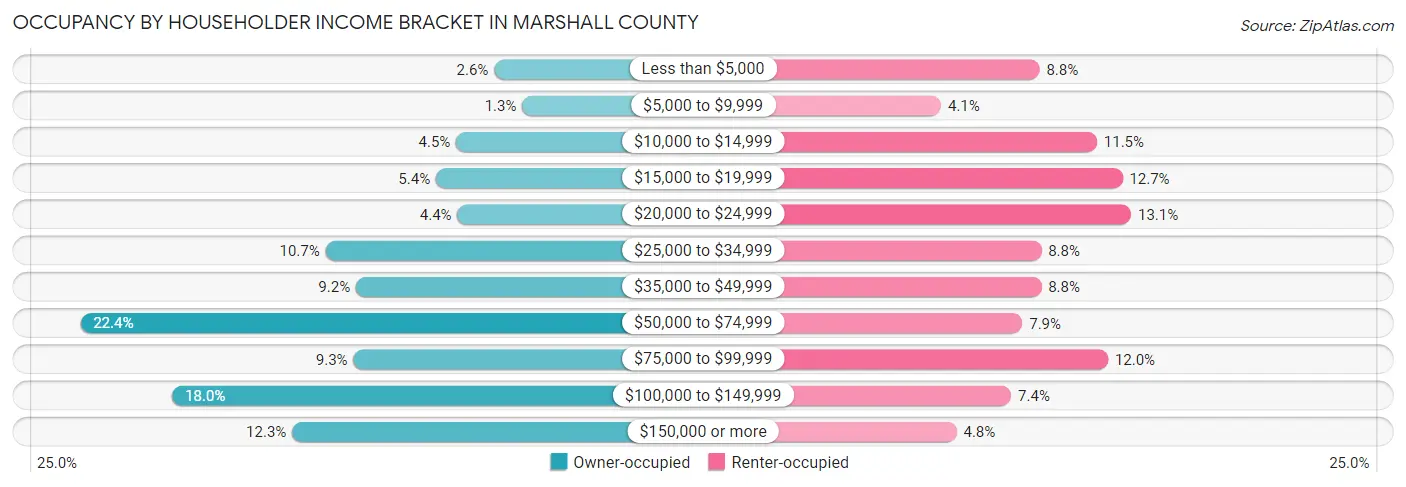
| Income Bracket | Owner-occupied | Renter-occupied |
| Less than $5,000 | 253 (2.6%) | 215 (8.8%) |
| $5,000 to $9,999 | 125 (1.3%) | 100 (4.1%) |
| $10,000 to $14,999 | 427 (4.4%) | 282 (11.5%) |
| $15,000 to $19,999 | 519 (5.4%) | 312 (12.7%) |
| $20,000 to $24,999 | 421 (4.4%) | 322 (13.1%) |
| $25,000 to $34,999 | 1,024 (10.7%) | 217 (8.8%) |
| $35,000 to $49,999 | 885 (9.2%) | 217 (8.8%) |
| $50,000 to $74,999 | 2,146 (22.4%) | 195 (7.9%) |
| $75,000 to $99,999 | 897 (9.3%) | 295 (12.0%) |
| $100,000 to $149,999 | 1,726 (18.0%) | 182 (7.4%) |
| $150,000 or more | 1,177 (12.3%) | 118 (4.8%) |
| Total | 9,600 (100.0%) | 2,455 (100.0%) |
Monthly Housing Cost Tiers in Marshall County
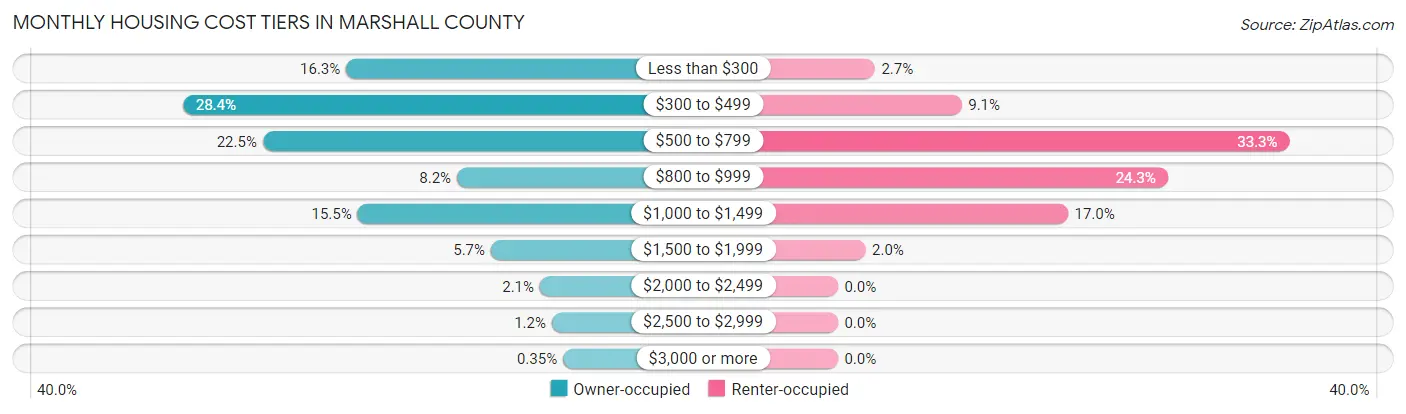
| Monthly Cost | Owner-occupied | Renter-occupied |
| Less than $300 | 1,567 (16.3%) | 67 (2.7%) |
| $300 to $499 | 2,722 (28.3%) | 224 (9.1%) |
| $500 to $799 | 2,156 (22.5%) | 817 (33.3%) |
| $800 to $999 | 783 (8.2%) | 597 (24.3%) |
| $1,000 to $1,499 | 1,486 (15.5%) | 416 (17.0%) |
| $1,500 to $1,999 | 543 (5.7%) | 50 (2.0%) |
| $2,000 to $2,499 | 197 (2.1%) | 0 (0.0%) |
| $2,500 to $2,999 | 112 (1.2%) | 0 (0.0%) |
| $3,000 or more | 34 (0.4%) | 0 (0.0%) |
| Total | 9,600 (100.0%) | 2,455 (100.0%) |
Physical Housing Characteristics in Marshall County
Housing Structures in Marshall County
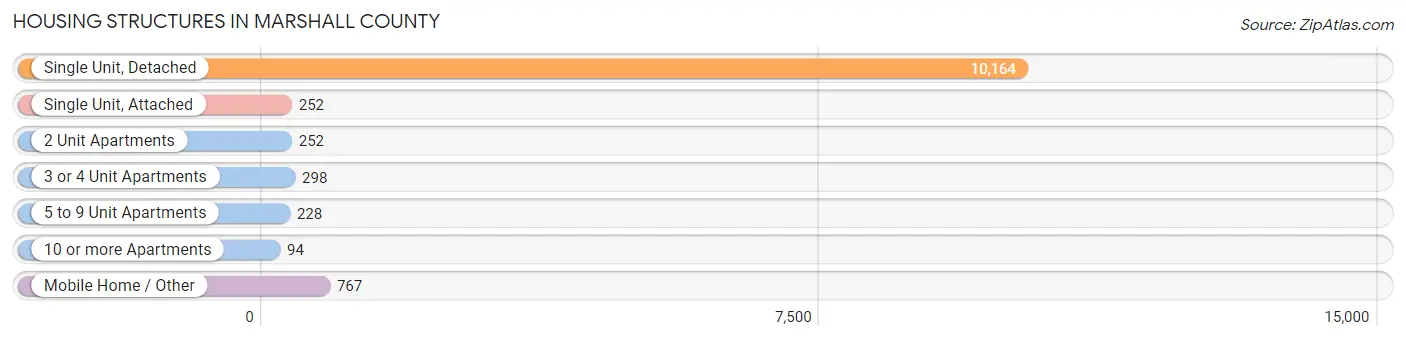
| Structure Type | # Housing Units | % Housing Units |
| Single Unit, Detached | 10,164 | 84.3% |
| Single Unit, Attached | 252 | 2.1% |
| 2 Unit Apartments | 252 | 2.1% |
| 3 or 4 Unit Apartments | 298 | 2.5% |
| 5 to 9 Unit Apartments | 228 | 1.9% |
| 10 or more Apartments | 94 | 0.8% |
| Mobile Home / Other | 767 | 6.4% |
| Total | 12,055 | 100.0% |
Housing Structures by Occupancy in Marshall County
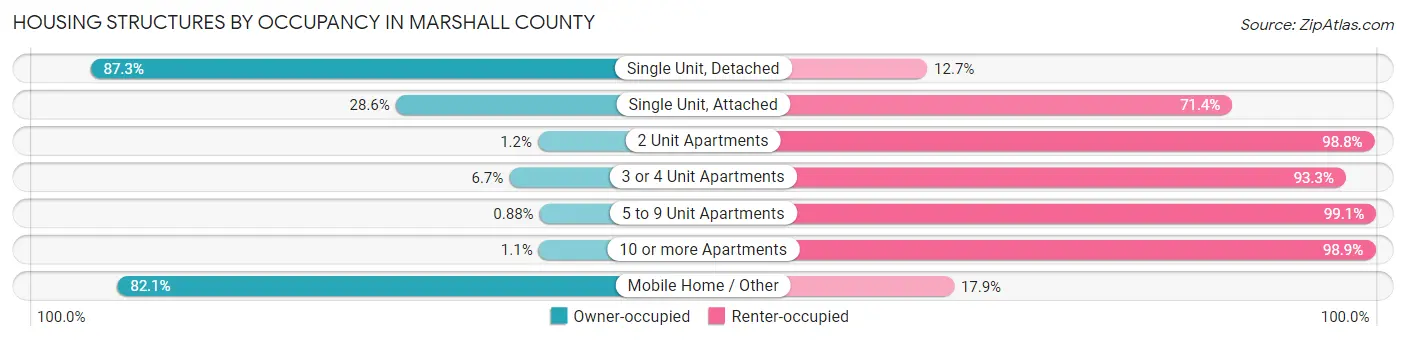
| Structure Type | Owner-occupied | Renter-occupied |
| Single Unit, Detached | 8,872 (87.3%) | 1,292 (12.7%) |
| Single Unit, Attached | 72 (28.6%) | 180 (71.4%) |
| 2 Unit Apartments | 3 (1.2%) | 249 (98.8%) |
| 3 or 4 Unit Apartments | 20 (6.7%) | 278 (93.3%) |
| 5 to 9 Unit Apartments | 2 (0.9%) | 226 (99.1%) |
| 10 or more Apartments | 1 (1.1%) | 93 (98.9%) |
| Mobile Home / Other | 630 (82.1%) | 137 (17.9%) |
| Total | 9,600 (79.6%) | 2,455 (20.4%) |
Housing Structures by Number of Rooms in Marshall County
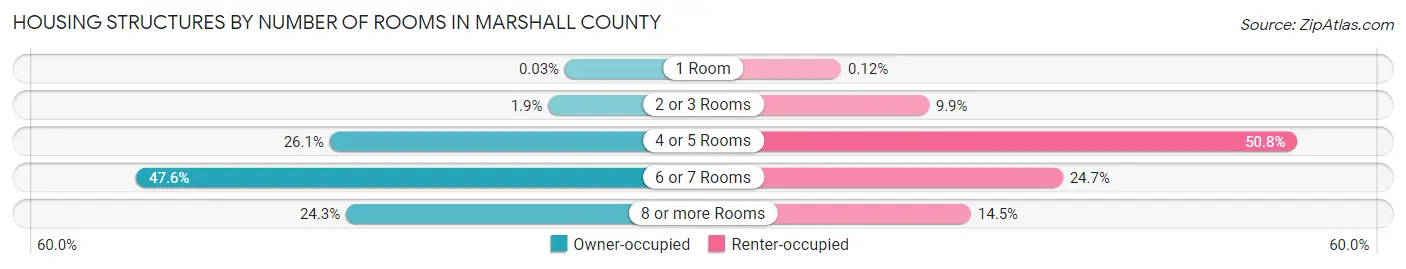
| Number of Rooms | Owner-occupied | Renter-occupied |
| 1 Room | 3 (0.0%) | 3 (0.1%) |
| 2 or 3 Rooms | 180 (1.9%) | 242 (9.9%) |
| 4 or 5 Rooms | 2,509 (26.1%) | 1,246 (50.7%) |
| 6 or 7 Rooms | 4,572 (47.6%) | 607 (24.7%) |
| 8 or more Rooms | 2,336 (24.3%) | 357 (14.5%) |
| Total | 9,600 (100.0%) | 2,455 (100.0%) |
Housing Structure by Heating Type in Marshall County
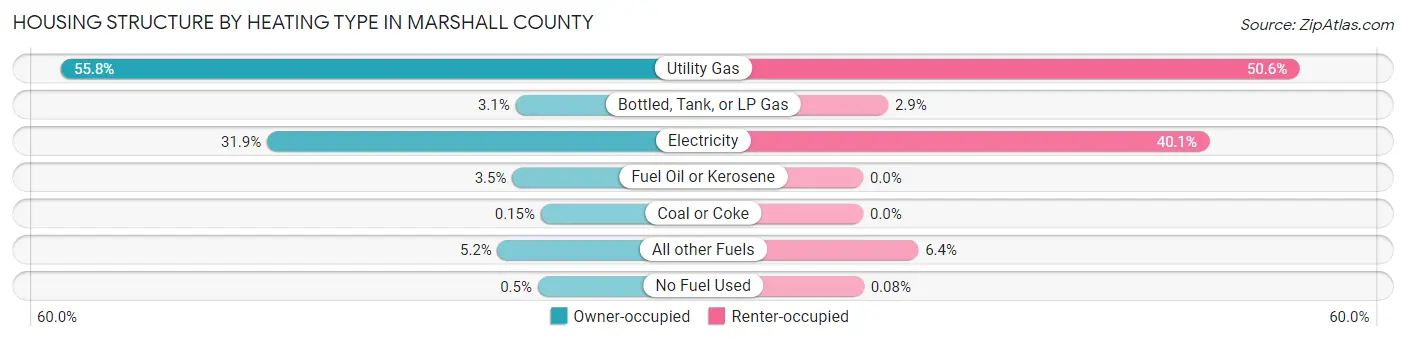
| Heating Type | Owner-occupied | Renter-occupied |
| Utility Gas | 5,355 (55.8%) | 1,241 (50.5%) |
| Bottled, Tank, or LP Gas | 296 (3.1%) | 71 (2.9%) |
| Electricity | 3,061 (31.9%) | 984 (40.1%) |
| Fuel Oil or Kerosene | 332 (3.5%) | 0 (0.0%) |
| Coal or Coke | 14 (0.2%) | 0 (0.0%) |
| All other Fuels | 494 (5.1%) | 157 (6.4%) |
| No Fuel Used | 48 (0.5%) | 2 (0.1%) |
| Total | 9,600 (100.0%) | 2,455 (100.0%) |
Household Vehicle Usage in Marshall County
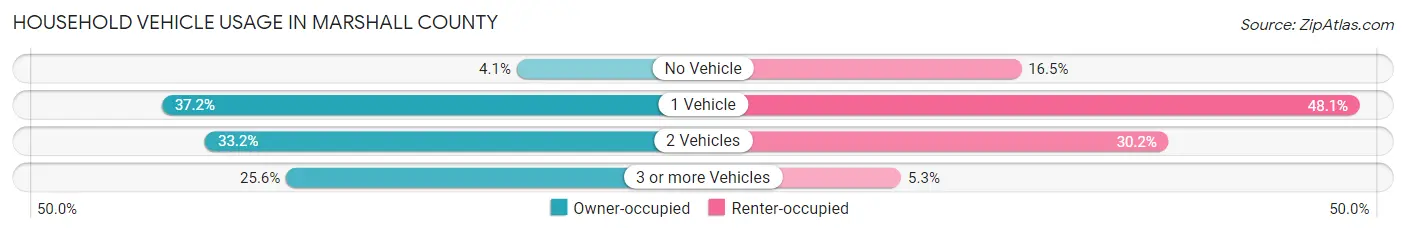
| Vehicles per Household | Owner-occupied | Renter-occupied |
| No Vehicle | 390 (4.1%) | 404 (16.5%) |
| 1 Vehicle | 3,571 (37.2%) | 1,180 (48.1%) |
| 2 Vehicles | 3,182 (33.2%) | 742 (30.2%) |
| 3 or more Vehicles | 2,457 (25.6%) | 129 (5.2%) |
| Total | 9,600 (100.0%) | 2,455 (100.0%) |
Real Estate & Mortgages in Marshall County
Real Estate and Mortgage Overview in Marshall County
| Characteristic | Without Mortgage | With Mortgage |
| Housing Units | 5,451 | 4,149 |
| Median Property Value | $102,000 | $157,400 |
| Median Household Income | $50,885 | $770 |
| Monthly Housing Costs | $383 | $34 |
| Real Estate Taxes | $497 | $192 |
Property Value by Mortgage Status in Marshall County
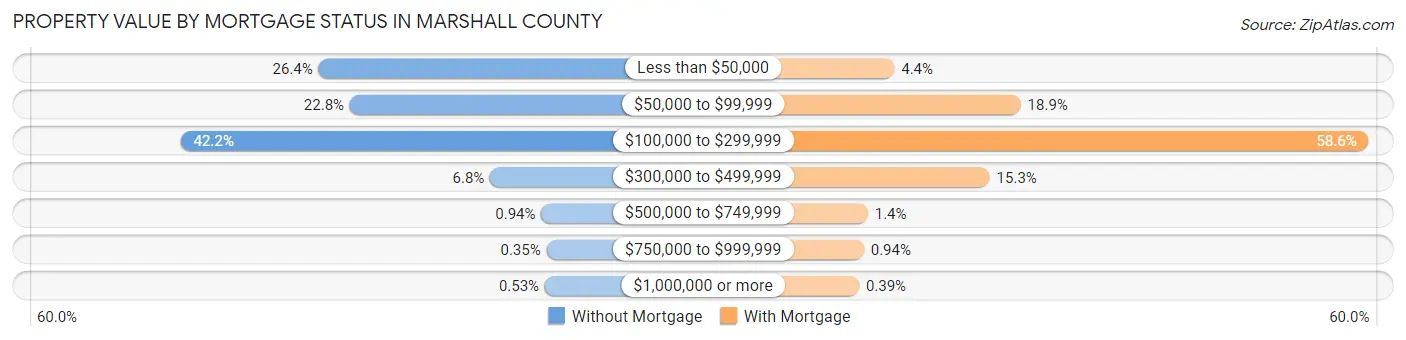
| Property Value | Without Mortgage | With Mortgage |
| Less than $50,000 | 1,439 (26.4%) | 184 (4.4%) |
| $50,000 to $99,999 | 1,244 (22.8%) | 783 (18.9%) |
| $100,000 to $299,999 | 2,299 (42.2%) | 2,433 (58.6%) |
| $300,000 to $499,999 | 370 (6.8%) | 636 (15.3%) |
| $500,000 to $749,999 | 51 (0.9%) | 58 (1.4%) |
| $750,000 to $999,999 | 19 (0.4%) | 39 (0.9%) |
| $1,000,000 or more | 29 (0.5%) | 16 (0.4%) |
| Total | 5,451 (100.0%) | 4,149 (100.0%) |
Household Income by Mortgage Status in Marshall County
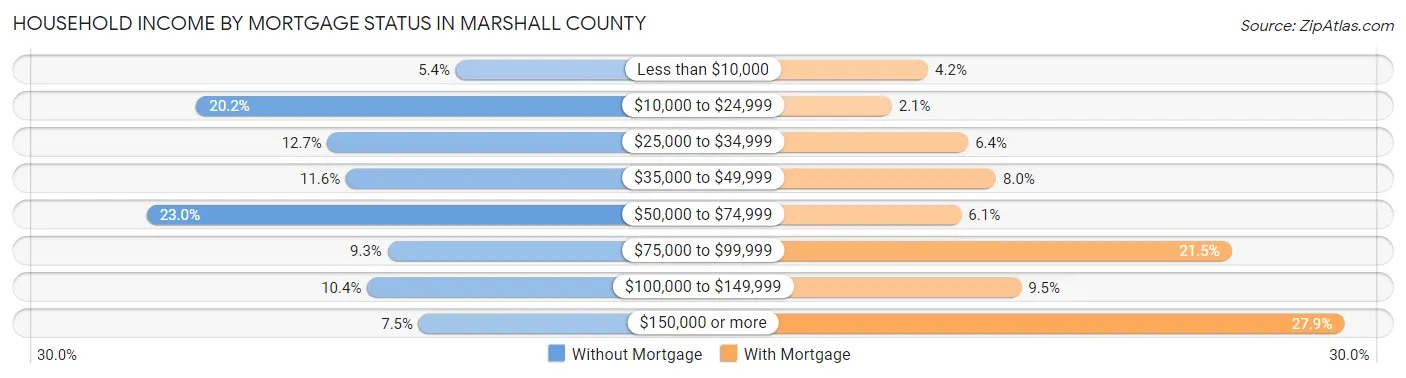
| Household Income | Without Mortgage | With Mortgage |
| Less than $10,000 | 292 (5.4%) | 172 (4.2%) |
| $10,000 to $24,999 | 1,100 (20.2%) | 86 (2.1%) |
| $25,000 to $34,999 | 691 (12.7%) | 267 (6.4%) |
| $35,000 to $49,999 | 634 (11.6%) | 333 (8.0%) |
| $50,000 to $74,999 | 1,255 (23.0%) | 251 (6.0%) |
| $75,000 to $99,999 | 504 (9.2%) | 891 (21.5%) |
| $100,000 to $149,999 | 568 (10.4%) | 393 (9.5%) |
| $150,000 or more | 407 (7.5%) | 1,158 (27.9%) |
| Total | 5,451 (100.0%) | 4,149 (100.0%) |
Property Value to Household Income Ratio in Marshall County
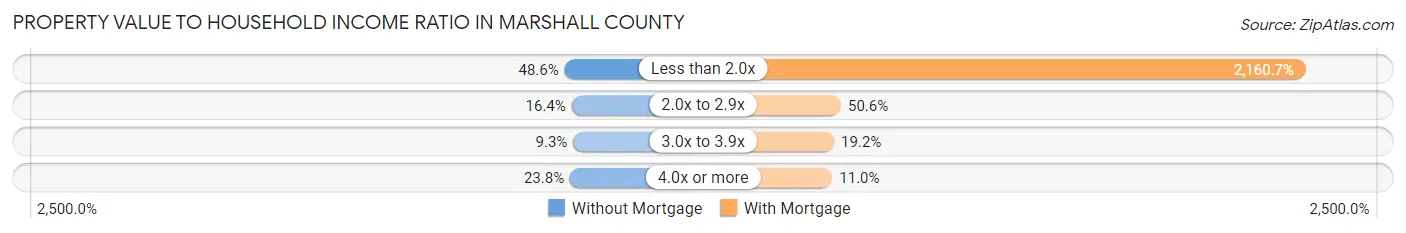
| Value-to-Income Ratio | Without Mortgage | With Mortgage |
| Less than 2.0x | 2,648 (48.6%) | 89,648 (2,160.7%) |
| 2.0x to 2.9x | 894 (16.4%) | 2,100 (50.6%) |
| 3.0x to 3.9x | 507 (9.3%) | 797 (19.2%) |
| 4.0x or more | 1,299 (23.8%) | 458 (11.0%) |
| Total | 5,451 (100.0%) | 4,149 (100.0%) |
Real Estate Taxes by Mortgage Status in Marshall County
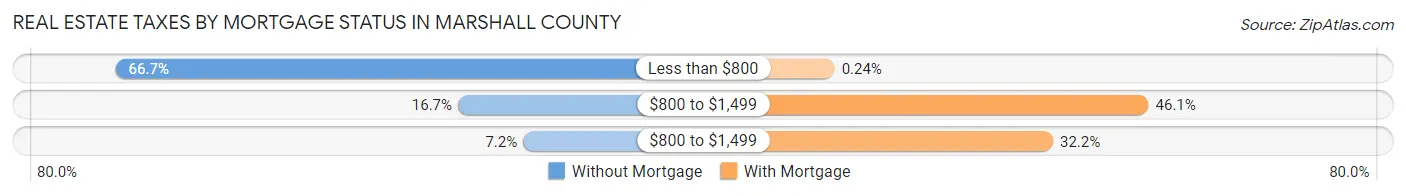
| Property Taxes | Without Mortgage | With Mortgage |
| Less than $800 | 3,635 (66.7%) | 10 (0.2%) |
| $800 to $1,499 | 910 (16.7%) | 1,913 (46.1%) |
| $800 to $1,499 | 391 (7.2%) | 1,334 (32.2%) |
| Total | 5,451 (100.0%) | 4,149 (100.0%) |
Health & Disability in Marshall County
Health Insurance Coverage by Age in Marshall County
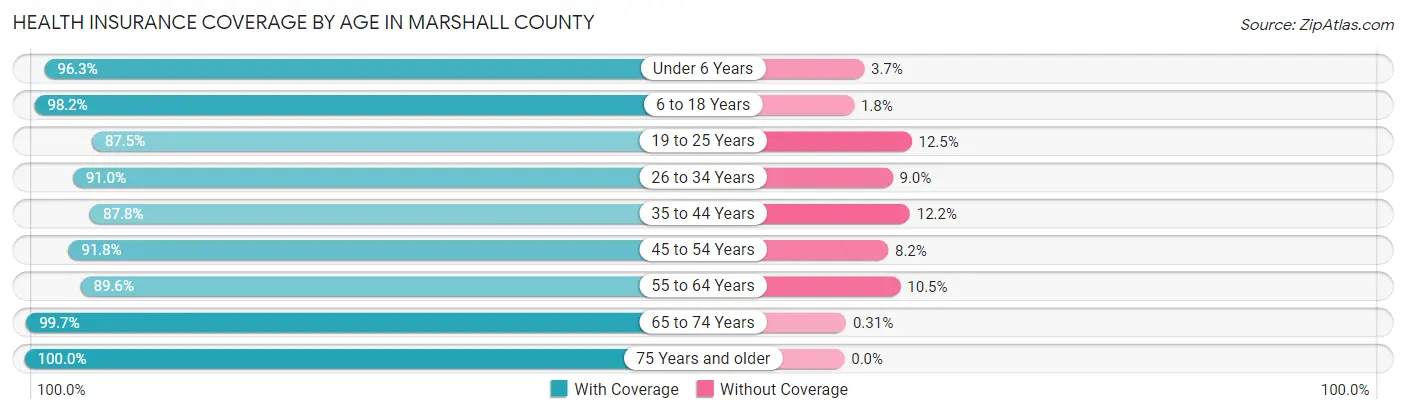
| Age Bracket | With Coverage | Without Coverage |
| Under 6 Years | 1,702 (96.3%) | 65 (3.7%) |
| 6 to 18 Years | 4,072 (98.2%) | 75 (1.8%) |
| 19 to 25 Years | 2,015 (87.5%) | 289 (12.5%) |
| 26 to 34 Years | 2,580 (91.0%) | 255 (9.0%) |
| 35 to 44 Years | 2,924 (87.8%) | 407 (12.2%) |
| 45 to 54 Years | 3,647 (91.8%) | 324 (8.2%) |
| 55 to 64 Years | 4,201 (89.5%) | 490 (10.4%) |
| 65 to 74 Years | 4,211 (99.7%) | 13 (0.3%) |
| 75 Years and older | 2,600 (100.0%) | 0 (0.0%) |
| Total | 27,952 (93.6%) | 1,918 (6.4%) |
Health Insurance Coverage by Citizenship Status in Marshall County
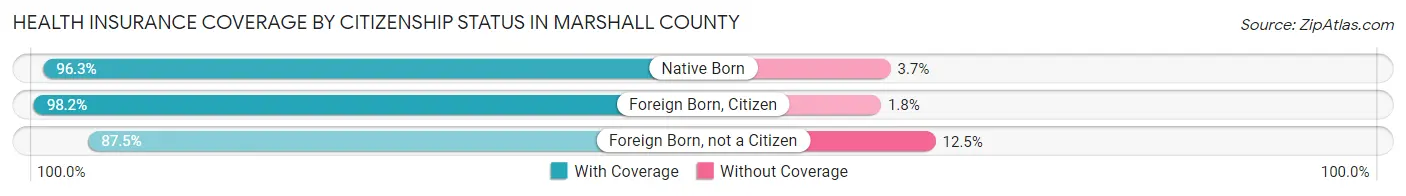
| Citizenship Status | With Coverage | Without Coverage |
| Native Born | 1,702 (96.3%) | 65 (3.7%) |
| Foreign Born, Citizen | 4,072 (98.2%) | 75 (1.8%) |
| Foreign Born, not a Citizen | 2,015 (87.5%) | 289 (12.5%) |
Health Insurance Coverage by Household Income in Marshall County
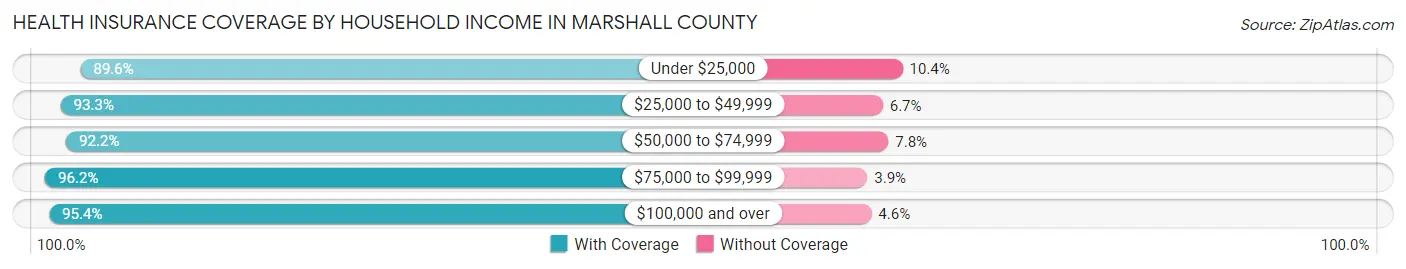
| Household Income | With Coverage | Without Coverage |
| Under $25,000 | 4,307 (89.6%) | 502 (10.4%) |
| $25,000 to $49,999 | 4,482 (93.3%) | 324 (6.7%) |
| $50,000 to $74,999 | 5,444 (92.2%) | 459 (7.8%) |
| $75,000 to $99,999 | 3,272 (96.2%) | 131 (3.8%) |
| $100,000 and over | 10,381 (95.4%) | 502 (4.6%) |
Public vs Private Health Insurance Coverage by Age in Marshall County
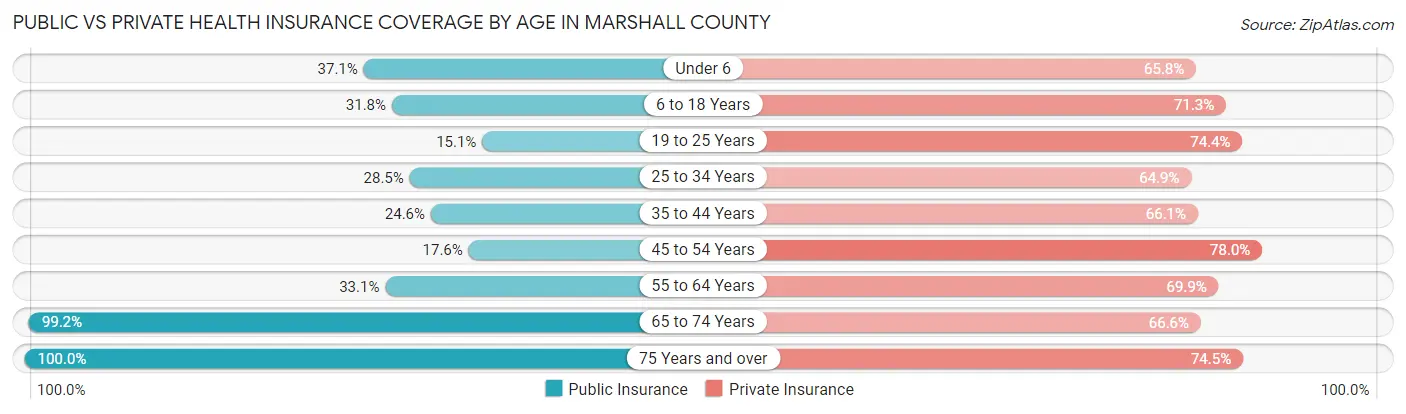
| Age Bracket | Public Insurance | Private Insurance |
| Under 6 | 655 (37.1%) | 1,162 (65.8%) |
| 6 to 18 Years | 1,320 (31.8%) | 2,958 (71.3%) |
| 19 to 25 Years | 347 (15.1%) | 1,713 (74.4%) |
| 25 to 34 Years | 809 (28.5%) | 1,839 (64.9%) |
| 35 to 44 Years | 819 (24.6%) | 2,201 (66.1%) |
| 45 to 54 Years | 698 (17.6%) | 3,098 (78.0%) |
| 55 to 64 Years | 1,551 (33.1%) | 3,281 (69.9%) |
| 65 to 74 Years | 4,190 (99.2%) | 2,815 (66.6%) |
| 75 Years and over | 2,600 (100.0%) | 1,936 (74.5%) |
| Total | 12,989 (43.5%) | 21,003 (70.3%) |
Disability Status by Sex by Age in Marshall County
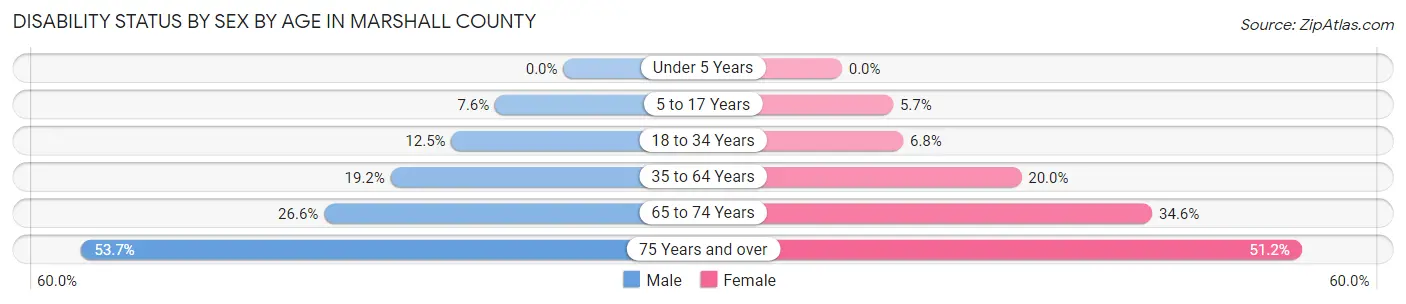
| Age Bracket | Male | Female |
| Under 5 Years | 0 (0.0%) | 0 (0.0%) |
| 5 to 17 Years | 168 (7.6%) | 118 (5.7%) |
| 18 to 34 Years | 359 (12.5%) | 171 (6.8%) |
| 35 to 64 Years | 1,189 (19.2%) | 1,162 (20.0%) |
| 65 to 74 Years | 537 (26.6%) | 763 (34.6%) |
| 75 Years and over | 578 (53.7%) | 780 (51.2%) |
Disability Class by Sex by Age in Marshall County
Disability Class: Hearing Difficulty
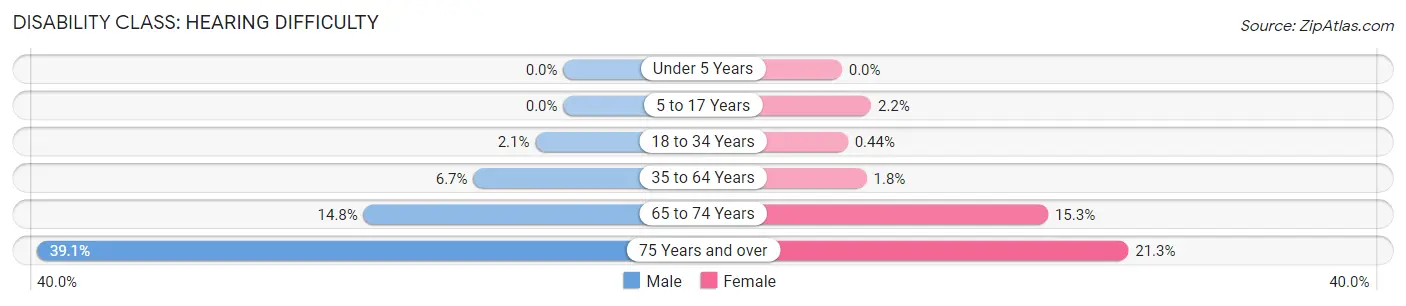
| Age Bracket | Male | Female |
| Under 5 Years | 0 (0.0%) | 0 (0.0%) |
| 5 to 17 Years | 0 (0.0%) | 45 (2.2%) |
| 18 to 34 Years | 60 (2.1%) | 11 (0.4%) |
| 35 to 64 Years | 413 (6.7%) | 107 (1.8%) |
| 65 to 74 Years | 299 (14.8%) | 338 (15.3%) |
| 75 Years and over | 421 (39.1%) | 324 (21.3%) |
Disability Class: Vision Difficulty
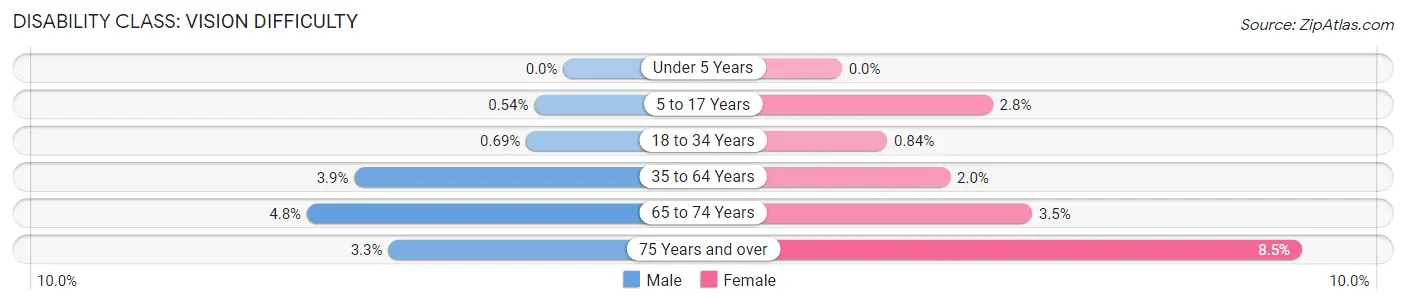
| Age Bracket | Male | Female |
| Under 5 Years | 0 (0.0%) | 0 (0.0%) |
| 5 to 17 Years | 12 (0.5%) | 58 (2.8%) |
| 18 to 34 Years | 20 (0.7%) | 21 (0.8%) |
| 35 to 64 Years | 240 (3.9%) | 117 (2.0%) |
| 65 to 74 Years | 96 (4.8%) | 78 (3.5%) |
| 75 Years and over | 35 (3.3%) | 130 (8.5%) |
Disability Class: Cognitive Difficulty
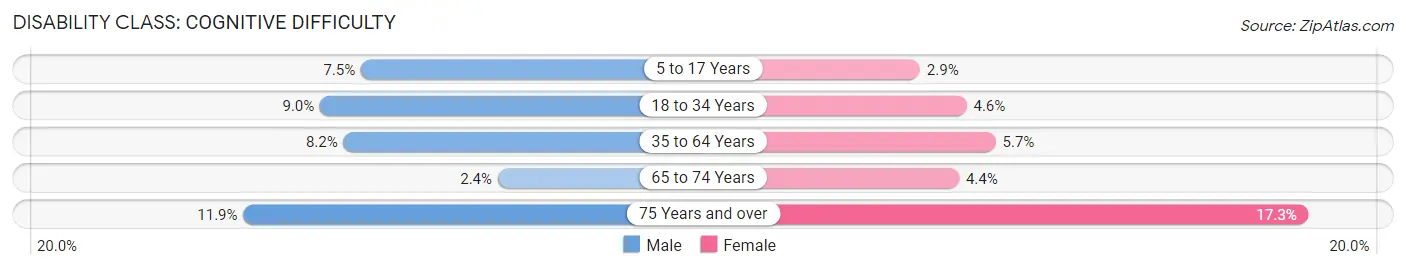
| Age Bracket | Male | Female |
| 5 to 17 Years | 166 (7.5%) | 60 (2.9%) |
| 18 to 34 Years | 260 (9.0%) | 116 (4.6%) |
| 35 to 64 Years | 504 (8.2%) | 332 (5.7%) |
| 65 to 74 Years | 49 (2.4%) | 96 (4.3%) |
| 75 Years and over | 128 (11.9%) | 264 (17.3%) |
Disability Class: Ambulatory Difficulty
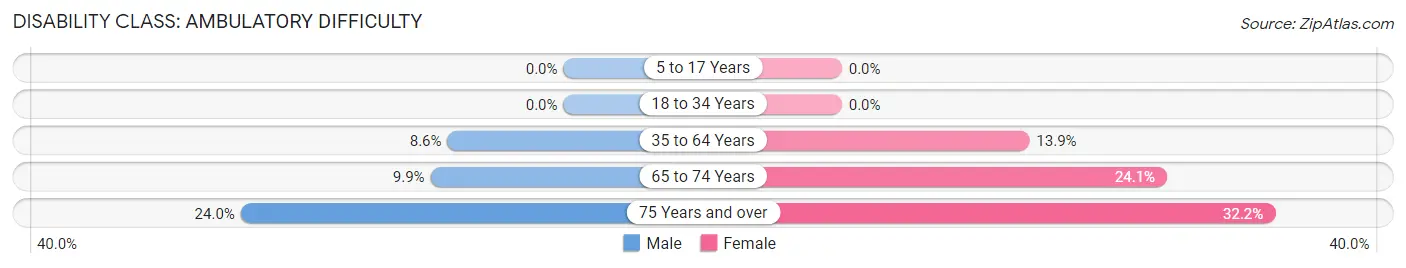
| Age Bracket | Male | Female |
| 5 to 17 Years | 0 (0.0%) | 0 (0.0%) |
| 18 to 34 Years | 0 (0.0%) | 0 (0.0%) |
| 35 to 64 Years | 532 (8.6%) | 810 (13.9%) |
| 65 to 74 Years | 199 (9.9%) | 533 (24.1%) |
| 75 Years and over | 258 (24.0%) | 490 (32.2%) |
Disability Class: Self-Care Difficulty
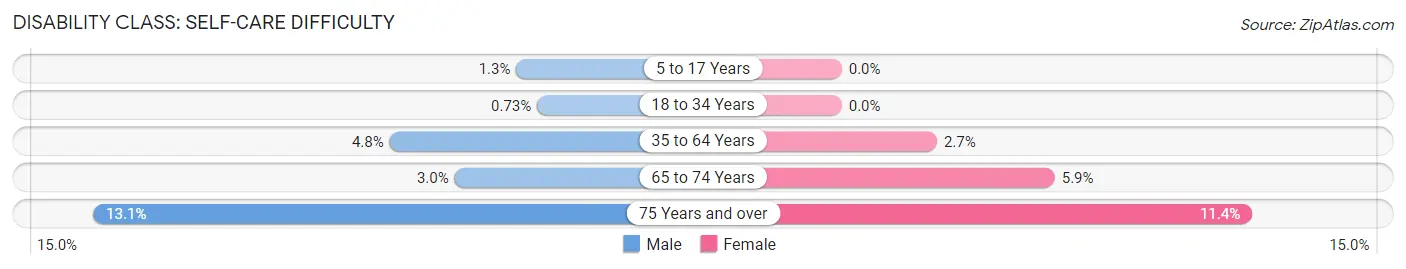
| Age Bracket | Male | Female |
| 5 to 17 Years | 29 (1.3%) | 0 (0.0%) |
| 18 to 34 Years | 21 (0.7%) | 0 (0.0%) |
| 35 to 64 Years | 299 (4.8%) | 154 (2.6%) |
| 65 to 74 Years | 61 (3.0%) | 131 (5.9%) |
| 75 Years and over | 141 (13.1%) | 174 (11.4%) |
Technology Access in Marshall County
Computing Device Access in Marshall County
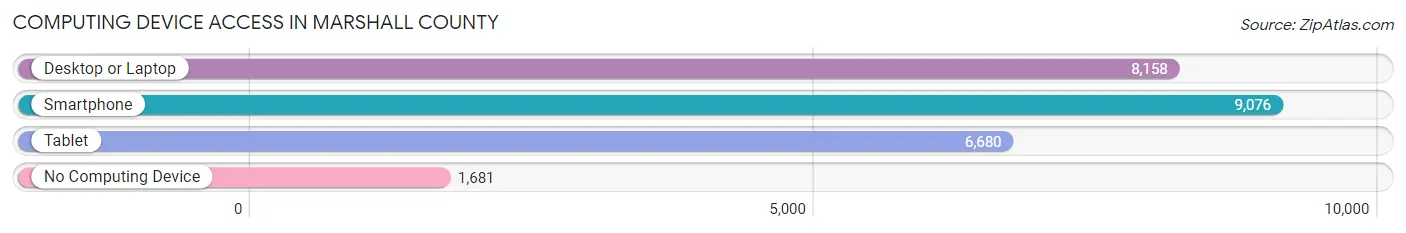
| Device Type | # Households | % Households |
| Desktop or Laptop | 8,158 | 67.7% |
| Smartphone | 9,076 | 75.3% |
| Tablet | 6,680 | 55.4% |
| No Computing Device | 1,681 | 13.9% |
| Total | 12,055 | 100.0% |
Internet Access in Marshall County
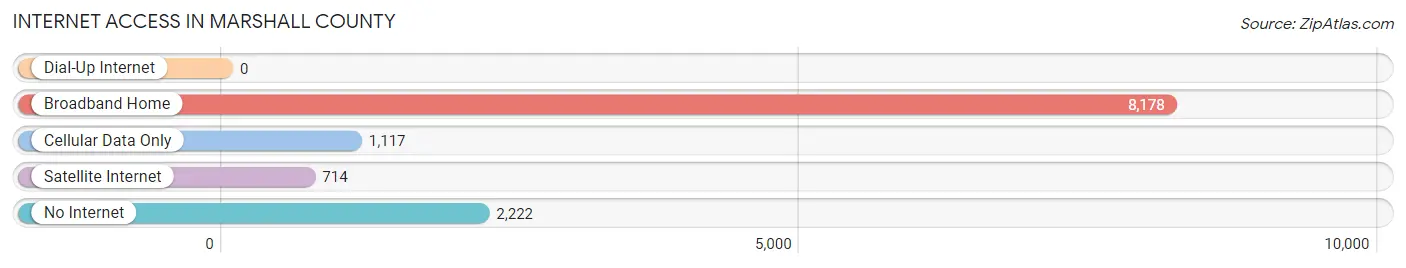
| Internet Type | # Households | % Households |
| Dial-Up Internet | 0 | 0.0% |
| Broadband Home | 8,178 | 67.8% |
| Cellular Data Only | 1,117 | 9.3% |
| Satellite Internet | 714 | 5.9% |
| No Internet | 2,222 | 18.4% |
| Total | 12,055 | 100.0% |
Marshall County Summary
Marshall County, West Virginia is located in the northern panhandle of the state, bordered by Ohio to the north and Pennsylvania to the east. It is part of the Wheeling, West Virginia metropolitan area and is the smallest county in the state. The county was formed in 1835 from parts of Ohio and Tyler counties and was named for Chief Justice John Marshall of the United States Supreme Court.
History
Marshall County was first settled in the late 1700s by European settlers. The county was officially formed in 1835 from parts of Ohio and Tyler counties. The county was named for Chief Justice John Marshall of the United States Supreme Court.
During the Civil War, Marshall County was a major center of activity. The county was the site of several battles, including the Battle of Fetterman, which was fought in 1861. The county was also the site of the Battle of Philippi, which was the first land battle of the Civil War.
In the late 19th century, Marshall County was a major center of the oil and gas industry. The county was home to several oil and gas companies, including the Standard Oil Company. The county was also home to several coal mines, which provided employment for many of the county's residents.
Geography
Marshall County is located in the northern panhandle of West Virginia. It is bordered by Ohio to the north and Pennsylvania to the east. The county is part of the Wheeling, West Virginia metropolitan area and is the smallest county in the state.
The county is mostly rural, with the majority of the land being used for agricultural purposes. The county is home to several state parks, including the Chief Cornstalk State Park and the Little Kanawha State Park.
The county is home to several rivers, including the Ohio River, the Little Kanawha River, and the West Fork River. The county is also home to several lakes, including the Moundsville Reservoir and the Tomlinson Run Reservoir.
Economy
Marshall County has a diverse economy, with a mix of manufacturing, agriculture, and tourism. The county is home to several manufacturing companies, including the Marshall County Glass Company and the Marshall County Steel Company.
Agriculture is also an important part of the county's economy. The county is home to several farms, which produce a variety of crops, including corn, soybeans, and wheat.
Tourism is also an important part of the county's economy. The county is home to several state parks, including the Chief Cornstalk State Park and the Little Kanawha State Park. The county is also home to several historic sites, including the Grave Creek Mound Archaeological Complex and the West Virginia Penitentiary.
Demographics
As of the 2010 census, Marshall County had a population of 31,549. The county is predominantly white, with 91.3% of the population being white and 8.7% being other races. The median household income in the county is $41,945, and the median home value is $112,400.
The county is home to several educational institutions, including Marshall University, West Virginia Northern Community College, and West Liberty University. The county is also home to several hospitals, including the Marshall County Medical Center and the Wheeling Hospital.
Conclusion
Marshall County, West Virginia is a small county located in the northern panhandle of the state. The county has a diverse economy, with a mix of manufacturing, agriculture, and tourism. The county is predominantly white, with a median household income of $41,945 and a median home value of $112,400. The county is home to several educational institutions, hospitals, and state parks, making it an attractive place to live and work.
Common Questions
What is the Total Population of Marshall County?
Total Population of Marshall County is 30,509.
What is the Total Male Population of Marshall County?
Total Male Population of Marshall County is 15,540.
What is the Total Female Population of Marshall County?
Total Female Population of Marshall County is 14,969.
What is the Ratio of Males per 100 Females in Marshall County?
There are 103.81 Males per 100 Females in Marshall County.
What is the Ratio of Females per 100 Males in Marshall County?
There are 96.33 Females per 100 Males in Marshall County.
What is the Median Population Age in Marshall County?
Median Population Age in Marshall County is 46.4 Years.
What is the Average Family Size in Marshall County
Average Family Size in Marshall County is 3.1 People.
What is the Average Household Size in Marshall County
Average Household Size in Marshall County is 2.5 People.
What is Per Capita Income in Marshall County?
Per Capita income in Marshall County is $33,673.
What is the Median Family Income in Marshall County?
Median Family Income in Marshall County is $70,136.
What is the Median Household income in Marshall County?
Median Household Income in Marshall County is $58,129.
What is Income or Wage Gap in Marshall County?
Income or Wage Gap in Marshall County is 41.3%.
Women in Marshall County earn 58.7 cents for every dollar earned by a man.
What is Family Income Deficit in Marshall County?
Family Income Deficit in Marshall County is $10,633.
Families that are below poverty line in Marshall County earn $10,633 less on average than the poverty threshold level.
What is Inequality or Gini Index in Marshall County?
Inequality or Gini Index in Marshall County is 0.49.
How Large is the Labor Force in Marshall County?
There are 13,687 People in the Labor Forcein in Marshall County.
What is the Percentage of People in the Labor Force in Marshall County?
53.6% of People are in the Labor Force in Marshall County.
What is the Unemployment Rate in Marshall County?
Unemployment Rate in Marshall County is 3.9%.