Logan County, WV
Logan County Map
Logan County Overview
32,350
TOTAL POPULATION
16,054
MALE POPULATION
16,296
FEMALE POPULATION
98.51
MALES / 100 FEMALES
101.51
FEMALES / 100 MALES
44.1
MEDIAN AGE
3.0
AVG FAMILY SIZE
2.5
AVG HOUSEHOLD SIZE
$26,111
PER CAPITA INCOME
$51,057
AVG FAMILY INCOME
$42,194
AVG HOUSEHOLD INCOME
44.8%
WAGE / INCOME GAP [ % ]
55.2¢/ $1
WAGE / INCOME GAP [ $ ]
$11,887
FAMILY INCOME DEFICIT
0.50
INEQUALITY / GINI INDEX
10,983
LABOR FORCE [ PEOPLE ]
41.3%
PERCENT IN LABOR FORCE
13.3%
UNEMPLOYMENT RATE
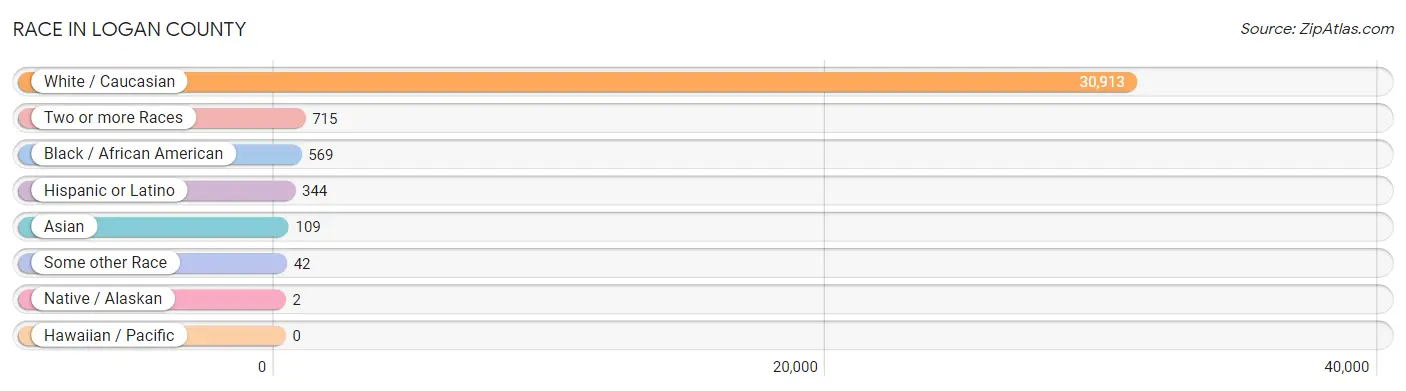
Race in Logan County
The most populous races in Logan County are White / Caucasian (30,913 | 95.6%), Two or more Races (715 | 2.2%), and Black / African American (569 | 1.8%).
| Race | # Population | % Population |
| Asian | 109 | 0.3% |
| Black / African American | 569 | 1.8% |
| Hawaiian / Pacific | 0 | 0.0% |
| Hispanic or Latino | 344 | 1.1% |
| Native / Alaskan | 2 | 0.0% |
| White / Caucasian | 30,913 | 95.6% |
| Two or more Races | 715 | 2.2% |
| Some other Race | 42 | 0.1% |
| Total | 32,350 | 100.0% |
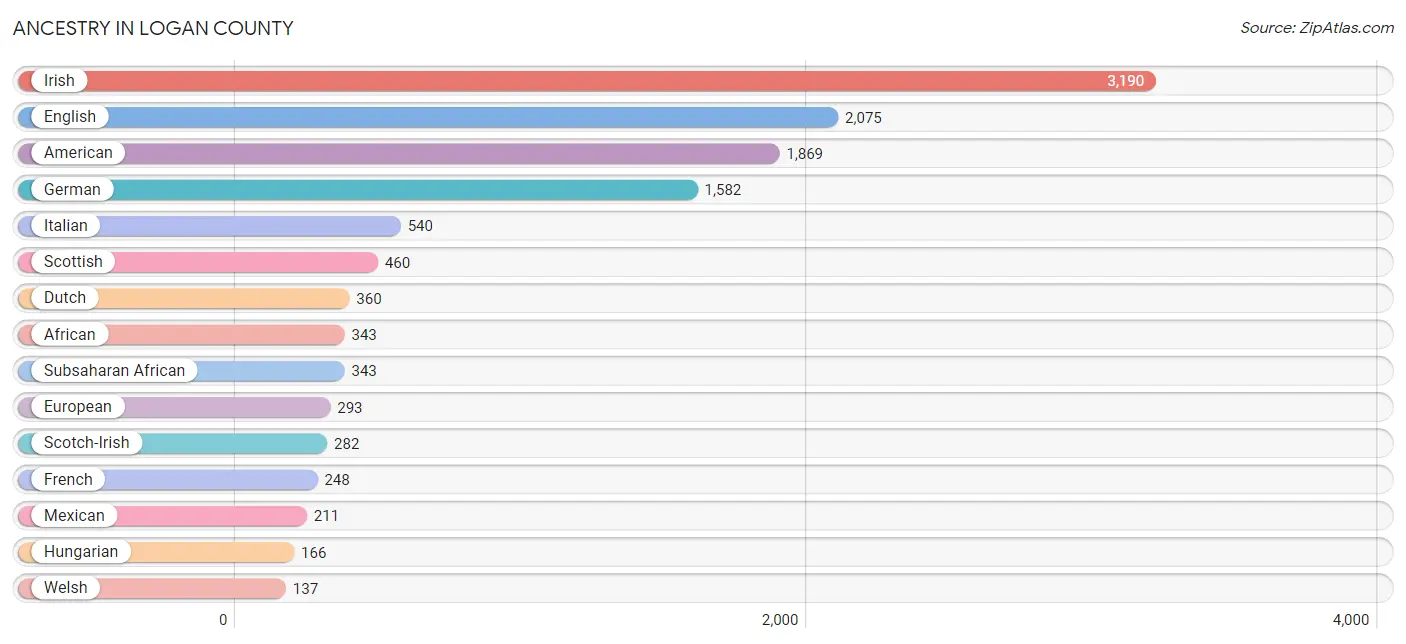
Ancestry in Logan County
The most populous ancestries reported in Logan County are Irish (3,190 | 9.9%), English (2,075 | 6.4%), American (1,869 | 5.8%), German (1,582 | 4.9%), and Italian (540 | 1.7%), together accounting for 28.6% of all Logan County residents.
| Ancestry | # Population | % Population |
| African | 343 | 1.1% |
| American | 1,869 | 5.8% |
| Arab | 7 | 0.0% |
| Austrian | 1 | 0.0% |
| Bhutanese | 105 | 0.3% |
| Blackfeet | 41 | 0.1% |
| British | 58 | 0.2% |
| Bulgarian | 4 | 0.0% |
| Cherokee | 77 | 0.2% |
| Cuban | 50 | 0.2% |
| Czech | 7 | 0.0% |
| Danish | 4 | 0.0% |
| Dominican | 3 | 0.0% |
| Dutch | 360 | 1.1% |
| Eastern European | 24 | 0.1% |
| English | 2,075 | 6.4% |
| European | 293 | 0.9% |
| French | 248 | 0.8% |
| French Canadian | 14 | 0.0% |
| German | 1,582 | 4.9% |
| Greek | 48 | 0.2% |
| Hungarian | 166 | 0.5% |
| Irish | 3,190 | 9.9% |
| Italian | 540 | 1.7% |
| Mexican | 211 | 0.6% |
| Northern European | 15 | 0.1% |
| Norwegian | 33 | 0.1% |
| Polish | 74 | 0.2% |
| Puerto Rican | 9 | 0.0% |
| Romanian | 3 | 0.0% |
| Russian | 29 | 0.1% |
| Scandinavian | 15 | 0.1% |
| Scotch-Irish | 282 | 0.9% |
| Scottish | 460 | 1.4% |
| Spanish | 71 | 0.2% |
| Sri Lankan | 4 | 0.0% |
| Subsaharan African | 343 | 1.1% |
| Swedish | 13 | 0.0% |
| Swiss | 13 | 0.0% |
| Syrian | 2 | 0.0% |
| Thai | 9 | 0.0% |
| Welsh | 137 | 0.4% |
| Yugoslavian | 11 | 0.0% | View All 43 Rows |
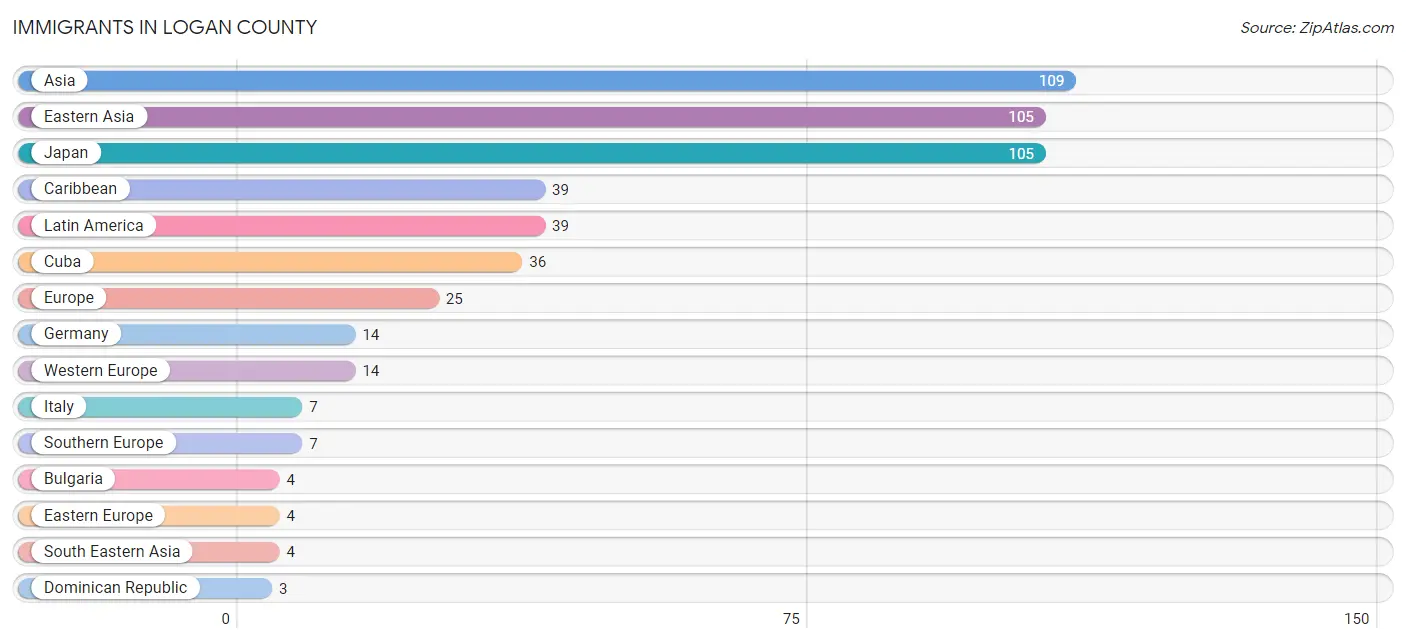
Immigrants in Logan County
The most numerous immigrant groups reported in Logan County came from Asia (109 | 0.3%), Eastern Asia (105 | 0.3%), Japan (105 | 0.3%), Caribbean (39 | 0.1%), and Latin America (39 | 0.1%), together accounting for 1.2% of all Logan County residents.
| Immigration Origin | # Population | % Population |
| Asia | 109 | 0.3% |
| Bulgaria | 4 | 0.0% |
| Caribbean | 39 | 0.1% |
| Cuba | 36 | 0.1% |
| Dominican Republic | 3 | 0.0% |
| Eastern Asia | 105 | 0.3% |
| Eastern Europe | 4 | 0.0% |
| Europe | 25 | 0.1% |
| Germany | 14 | 0.0% |
| Italy | 7 | 0.0% |
| Japan | 105 | 0.3% |
| Latin America | 39 | 0.1% |
| Philippines | 2 | 0.0% |
| South Eastern Asia | 4 | 0.0% |
| Southern Europe | 7 | 0.0% |
| Vietnam | 2 | 0.0% |
| Western Europe | 14 | 0.0% | View All 17 Rows |
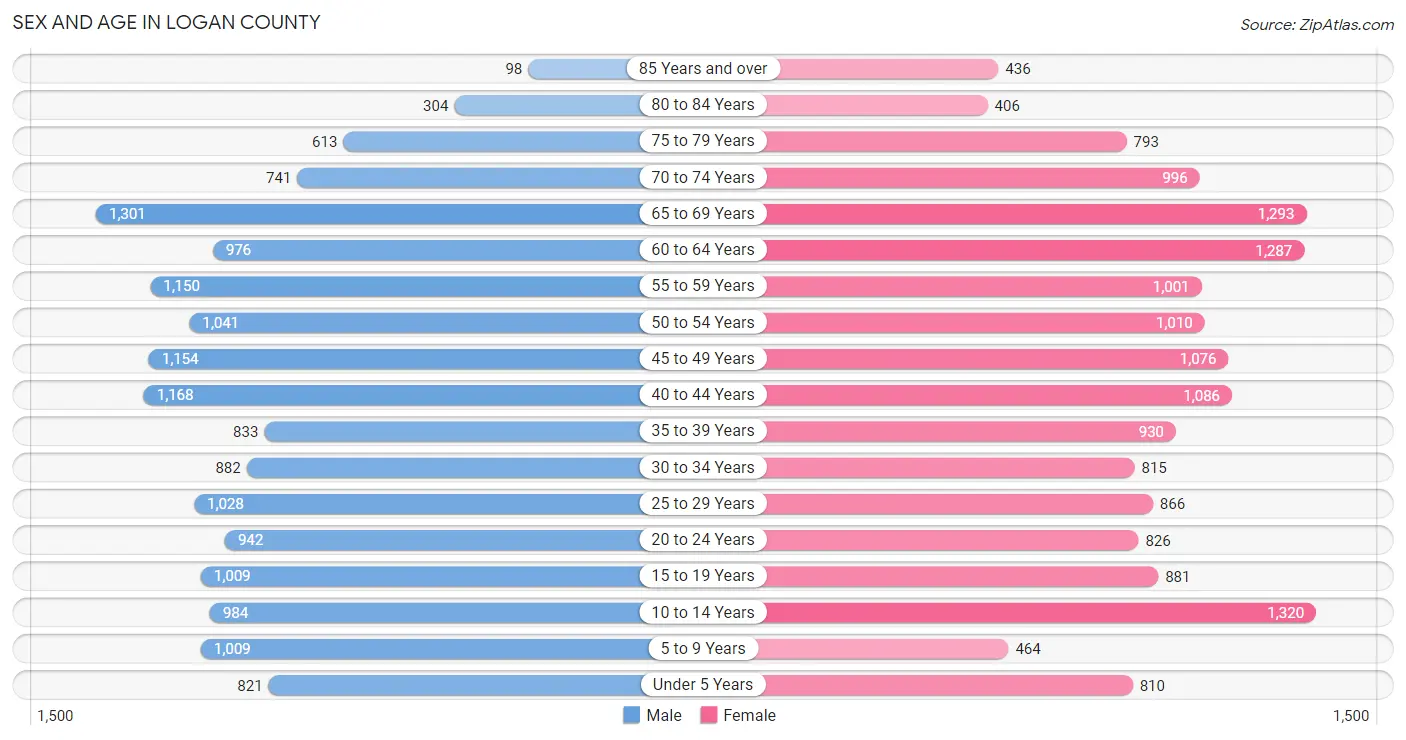
Sex and Age in Logan County
Sex and Age in Logan County
The most populous age groups in Logan County are 65 to 69 Years (1,301 | 8.1%) for men and 10 to 14 Years (1,320 | 8.1%) for women.
| Age Bracket | Male | Female |
| Under 5 Years | 821 (5.1%) | 810 (5.0%) |
| 5 to 9 Years | 1,009 (6.3%) | 464 (2.9%) |
| 10 to 14 Years | 984 (6.1%) | 1,320 (8.1%) |
| 15 to 19 Years | 1,009 (6.3%) | 881 (5.4%) |
| 20 to 24 Years | 942 (5.9%) | 826 (5.1%) |
| 25 to 29 Years | 1,028 (6.4%) | 866 (5.3%) |
| 30 to 34 Years | 882 (5.5%) | 815 (5.0%) |
| 35 to 39 Years | 833 (5.2%) | 930 (5.7%) |
| 40 to 44 Years | 1,168 (7.3%) | 1,086 (6.7%) |
| 45 to 49 Years | 1,154 (7.2%) | 1,076 (6.6%) |
| 50 to 54 Years | 1,041 (6.5%) | 1,010 (6.2%) |
| 55 to 59 Years | 1,150 (7.2%) | 1,001 (6.1%) |
| 60 to 64 Years | 976 (6.1%) | 1,287 (7.9%) |
| 65 to 69 Years | 1,301 (8.1%) | 1,293 (7.9%) |
| 70 to 74 Years | 741 (4.6%) | 996 (6.1%) |
| 75 to 79 Years | 613 (3.8%) | 793 (4.9%) |
| 80 to 84 Years | 304 (1.9%) | 406 (2.5%) |
| 85 Years and over | 98 (0.6%) | 436 (2.7%) |
| Total | 16,054 (100.0%) | 16,296 (100.0%) |
Families and Households in Logan County
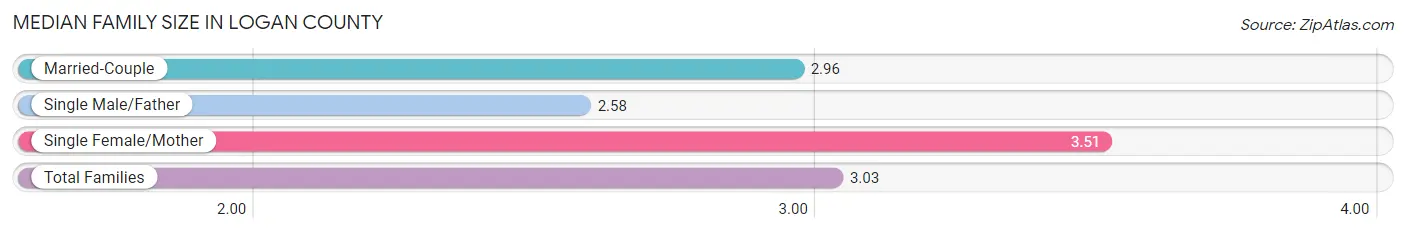
Median Family Size in Logan County
The median family size in Logan County is 3.03 persons per family, with single female/mother families (1,648 | 18.9%) accounting for the largest median family size of 3.51 persons per family. On the other hand, single male/father families (820 | 9.4%) represent the smallest median family size with 2.58 persons per family.
| Family Type | # Families | Family Size |
| Married-Couple | 6,239 (71.7%) | 2.96 |
| Single Male/Father | 820 (9.4%) | 2.58 |
| Single Female/Mother | 1,648 (18.9%) | 3.51 |
| Total Families | 8,707 (100.0%) | 3.03 |
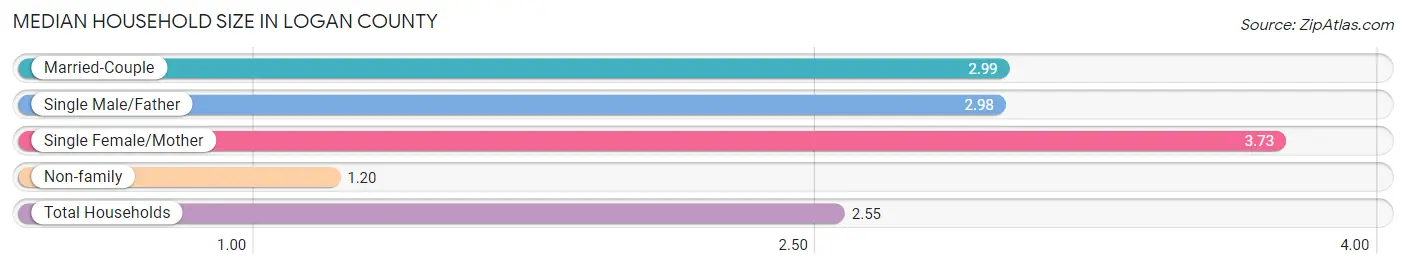
Median Household Size in Logan County
The median household size in Logan County is 2.55 persons per household, with single female/mother households (1,648 | 13.3%) accounting for the largest median household size of 3.73 persons per household. non-family households (3,668 | 29.6%) represent the smallest median household size with 1.20 persons per household.
| Household Type | # Households | Household Size |
| Married-Couple | 6,239 (50.4%) | 2.99 |
| Single Male/Father | 820 (6.6%) | 2.98 |
| Single Female/Mother | 1,648 (13.3%) | 3.73 |
| Non-family | 3,668 (29.6%) | 1.20 |
| Total Households | 12,375 (100.0%) | 2.55 |
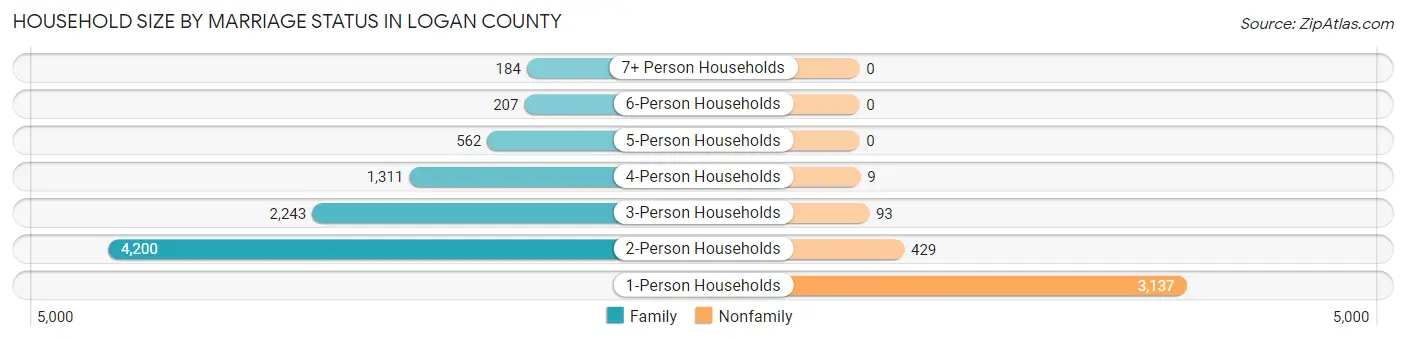
Household Size by Marriage Status in Logan County
Out of a total of 12,375 households in Logan County, 8,707 (70.4%) are family households, while 3,668 (29.6%) are nonfamily households. The most numerous type of family households are 2-person households, comprising 4,200, and the most common type of nonfamily households are 1-person households, comprising 3,137.
| Household Size | Family Households | Nonfamily Households |
| 1-Person Households | - | 3,137 (25.4%) |
| 2-Person Households | 4,200 (33.9%) | 429 (3.5%) |
| 3-Person Households | 2,243 (18.1%) | 93 (0.7%) |
| 4-Person Households | 1,311 (10.6%) | 9 (0.1%) |
| 5-Person Households | 562 (4.5%) | 0 (0.0%) |
| 6-Person Households | 207 (1.7%) | 0 (0.0%) |
| 7+ Person Households | 184 (1.5%) | 0 (0.0%) |
| Total | 8,707 (70.4%) | 3,668 (29.6%) |
Female Fertility in Logan County
Fertility by Age in Logan County
Average fertility rate in Logan County is 40.0 births per 1,000 women. Women in the age bracket of 20 to 34 years have the highest fertility rate with 82.0 births per 1,000 women. Women in the age bracket of 20 to 34 years acount for 76.9% of all women with births.
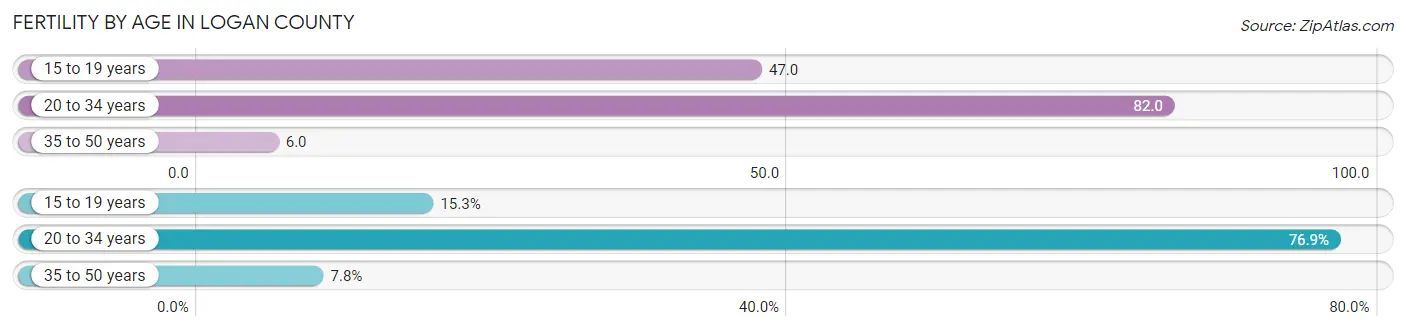
| Age Bracket | Women with Births | Births / 1,000 Women |
| 15 to 19 years | 41 (15.3%) | 47.0 |
| 20 to 34 years | 206 (76.9%) | 82.0 |
| 35 to 50 years | 21 (7.8%) | 6.0 |
| Total | 268 (100.0%) | 40.0 |
Fertility by Age by Marriage Status in Logan County
42.9% of women with births (268) in Logan County are married. The highest percentage of unmarried women with births falls into 15 to 19 years age bracket with 100.0% of them unmarried at the time of birth, while the lowest percentage of unmarried women with births belong to 35 to 50 years age bracket with 0.0% of them unmarried.
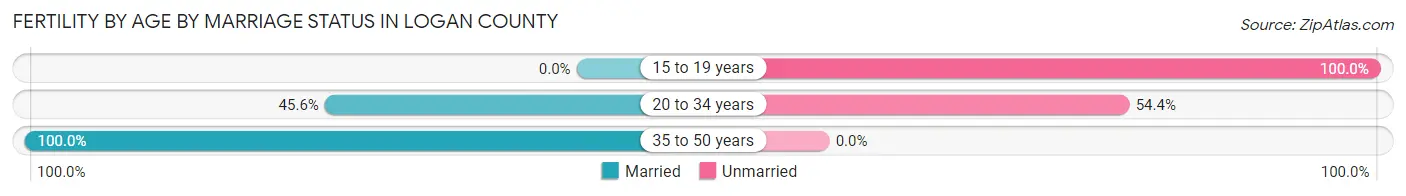
| Age Bracket | Married | Unmarried |
| 15 to 19 years | 0 (0.0%) | 41 (100.0%) |
| 20 to 34 years | 94 (45.6%) | 112 (54.4%) |
| 35 to 50 years | 21 (100.0%) | 0 (0.0%) |
| Total | 115 (42.9%) | 153 (57.1%) |
Fertility by Education in Logan County
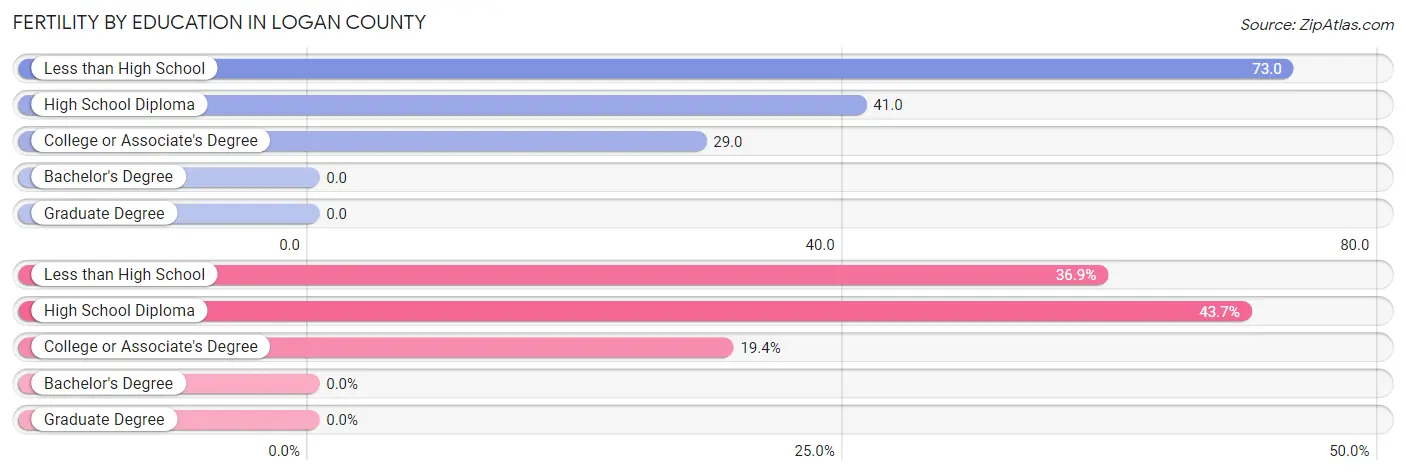
| Educational Attainment | Women with Births | Births / 1,000 Women |
| Less than High School | 99 (36.9%) | 73.0 |
| High School Diploma | 117 (43.7%) | 41.0 |
| College or Associate's Degree | 52 (19.4%) | 29.0 |
| Bachelor's Degree | 0 (0.0%) | 0.0 |
| Graduate Degree | 0 (0.0%) | 0.0 |
| Total | 268 (100.0%) | 40.0 |
Fertility by Education by Marriage Status in Logan County
57.1% of women with births in Logan County are unmarried. Women with the educational attainment of high school diploma are most likely to be married with 72.7% of them married at childbirth, while women with the educational attainment of less than high school are least likely to be married with 100.0% of them unmarried at childbirth.
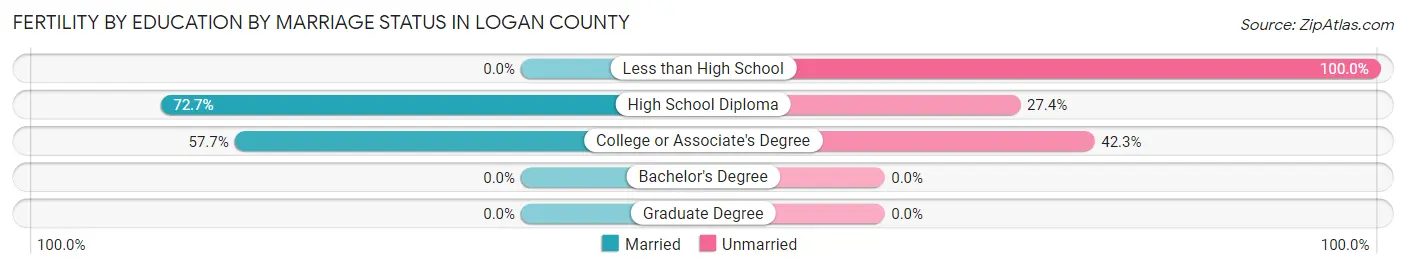
| Educational Attainment | Married | Unmarried |
| Less than High School | 0 (0.0%) | 99 (100.0%) |
| High School Diploma | 85 (72.7%) | 32 (27.4%) |
| College or Associate's Degree | 30 (57.7%) | 22 (42.3%) |
| Bachelor's Degree | 0 (0.0%) | 0 (0.0%) |
| Graduate Degree | 0 (0.0%) | 0 (0.0%) |
| Total | 115 (42.9%) | 153 (57.1%) |
Income in Logan County
Income Overview in Logan County
Per Capita Income in Logan County is $26,111, while median incomes of families and households are $51,057 and $42,194 respectively.
| Characteristic | Number | Measure |
| Per Capita Income | 32,350 | $26,111 |
| Median Family Income | 8,707 | $51,057 |
| Mean Family Income | 8,707 | $75,236 |
| Median Household Income | 12,375 | $42,194 |
| Mean Household Income | 12,375 | $64,626 |
| Income Deficit | 8,707 | $11,887 |
| Wage / Income Gap (%) | 32,350 | 44.81% |
| Wage / Income Gap ($) | 32,350 | 55.19¢ per $1 |
| Gini / Inequality Index | 32,350 | 0.50 |
Earnings by Sex in Logan County
Average Earnings in Logan County are $33,236, $48,207 for men and $26,607 for women, a difference of 44.8%.
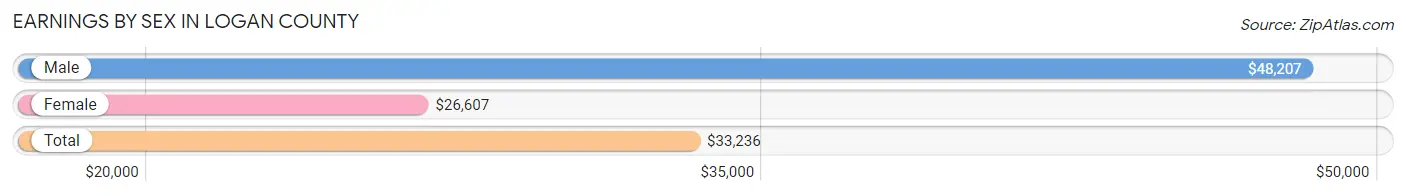
| Sex | Number | Average Earnings |
| Male | 5,530 (51.6%) | $48,207 |
| Female | 5,182 (48.4%) | $26,607 |
| Total | 10,712 (100.0%) | $33,236 |
Earnings by Sex by Income Bracket in Logan County
The most common earnings brackets in Logan County are $100,000+ for men (1,188 | 21.5%) and $25,000 to $29,999 for women (677 | 13.1%).
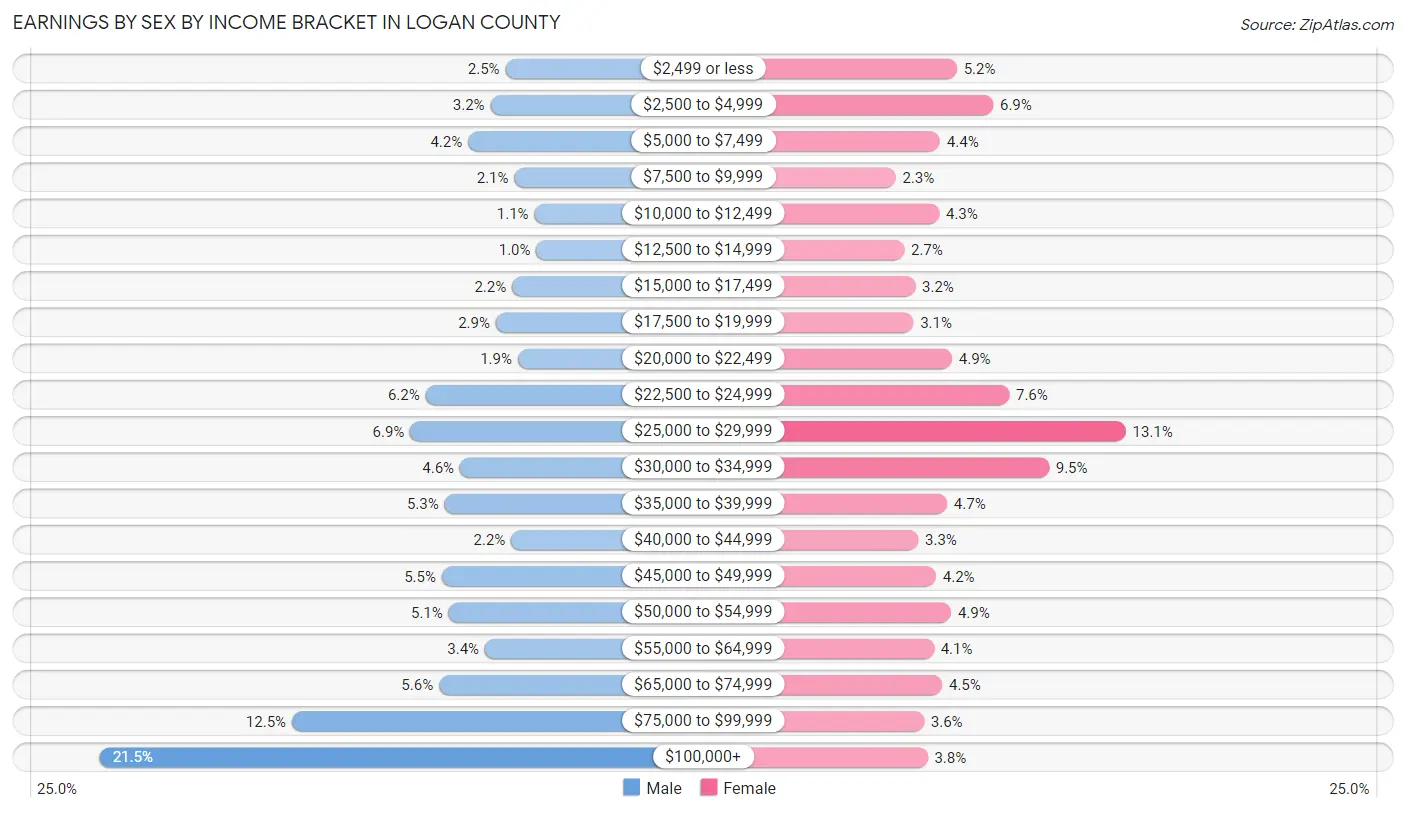
| Income | Male | Female |
| $2,499 or less | 137 (2.5%) | 267 (5.1%) |
| $2,500 to $4,999 | 176 (3.2%) | 355 (6.9%) |
| $5,000 to $7,499 | 234 (4.2%) | 226 (4.4%) |
| $7,500 to $9,999 | 114 (2.1%) | 118 (2.3%) |
| $10,000 to $12,499 | 62 (1.1%) | 224 (4.3%) |
| $12,500 to $14,999 | 57 (1.0%) | 139 (2.7%) |
| $15,000 to $17,499 | 120 (2.2%) | 166 (3.2%) |
| $17,500 to $19,999 | 162 (2.9%) | 161 (3.1%) |
| $20,000 to $22,499 | 105 (1.9%) | 255 (4.9%) |
| $22,500 to $24,999 | 344 (6.2%) | 394 (7.6%) |
| $25,000 to $29,999 | 384 (6.9%) | 677 (13.1%) |
| $30,000 to $34,999 | 255 (4.6%) | 490 (9.5%) |
| $35,000 to $39,999 | 295 (5.3%) | 243 (4.7%) |
| $40,000 to $44,999 | 122 (2.2%) | 173 (3.3%) |
| $45,000 to $49,999 | 302 (5.5%) | 216 (4.2%) |
| $50,000 to $54,999 | 284 (5.1%) | 253 (4.9%) |
| $55,000 to $64,999 | 190 (3.4%) | 211 (4.1%) |
| $65,000 to $74,999 | 309 (5.6%) | 231 (4.5%) |
| $75,000 to $99,999 | 690 (12.5%) | 187 (3.6%) |
| $100,000+ | 1,188 (21.5%) | 196 (3.8%) |
| Total | 5,530 (100.0%) | 5,182 (100.0%) |
Earnings by Sex by Educational Attainment in Logan County
Average earnings in Logan County are $52,197 for men and $28,450 for women, a difference of 45.5%. Men with an educational attainment of graduate degree enjoy the highest average annual earnings of $103,071, while those with less than high school education earn the least with $25,150. Women with an educational attainment of bachelor's degree earn the most with the average annual earnings of $53,532, while those with high school diploma education have the smallest earnings of $23,656.
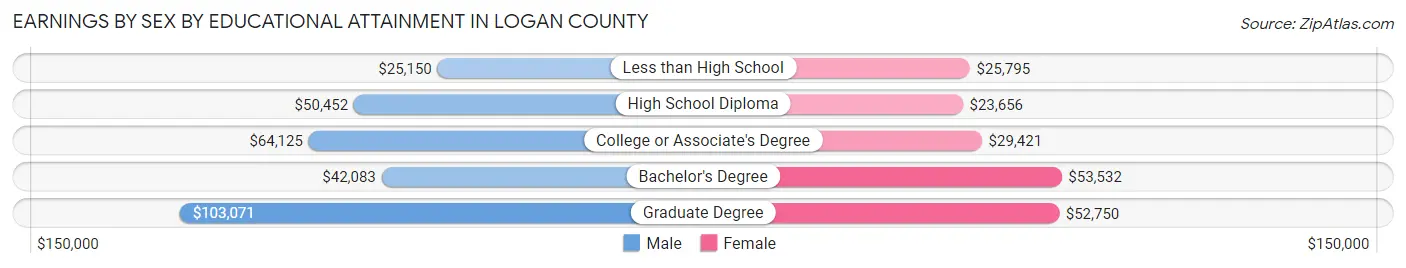
| Educational Attainment | Male Income | Female Income |
| Less than High School | $25,150 | $25,795 |
| High School Diploma | $50,452 | $23,656 |
| College or Associate's Degree | $64,125 | $29,421 |
| Bachelor's Degree | $42,083 | $53,532 |
| Graduate Degree | $103,071 | $52,750 |
| Total | $52,197 | $28,450 |
Family Income in Logan County
Family Income Brackets in Logan County
According to the Logan County family income data, there are 1,602 families falling into the $35,000 to $49,999 income range, which is the most common income bracket and makes up 18.4% of all families. Conversely, the $200,000+ income bracket is the least frequent group with only 270 families (3.1%) belonging to this category.
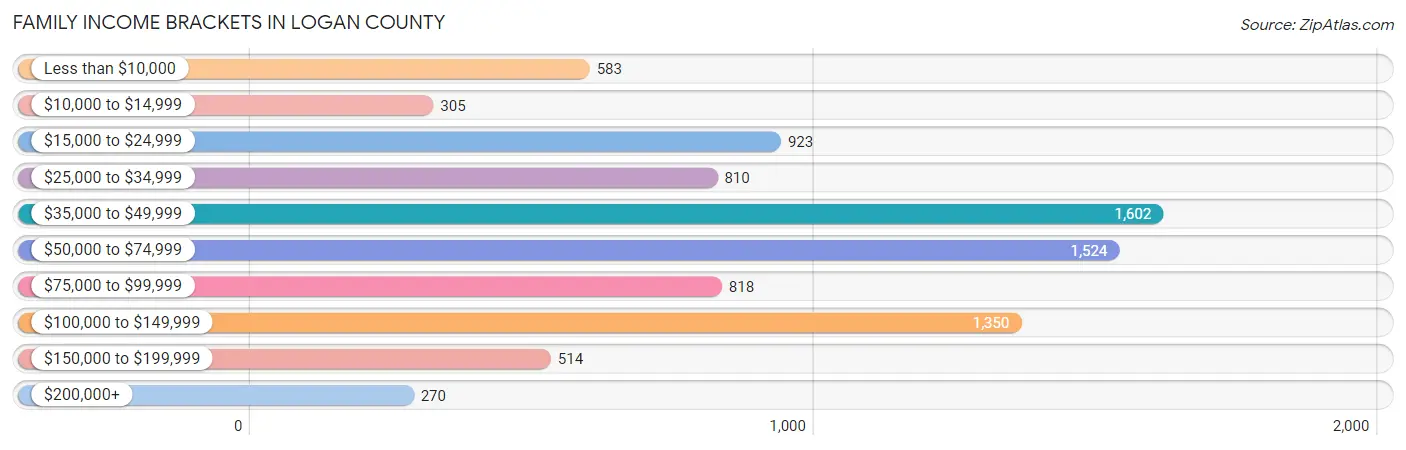
| Income Bracket | # Families | % Families |
| Less than $10,000 | 583 | 6.7% |
| $10,000 to $14,999 | 305 | 3.5% |
| $15,000 to $24,999 | 923 | 10.6% |
| $25,000 to $34,999 | 810 | 9.3% |
| $35,000 to $49,999 | 1,602 | 18.4% |
| $50,000 to $74,999 | 1,524 | 17.5% |
| $75,000 to $99,999 | 818 | 9.4% |
| $100,000 to $149,999 | 1,350 | 15.5% |
| $150,000 to $199,999 | 514 | 5.9% |
| $200,000+ | 270 | 3.1% |
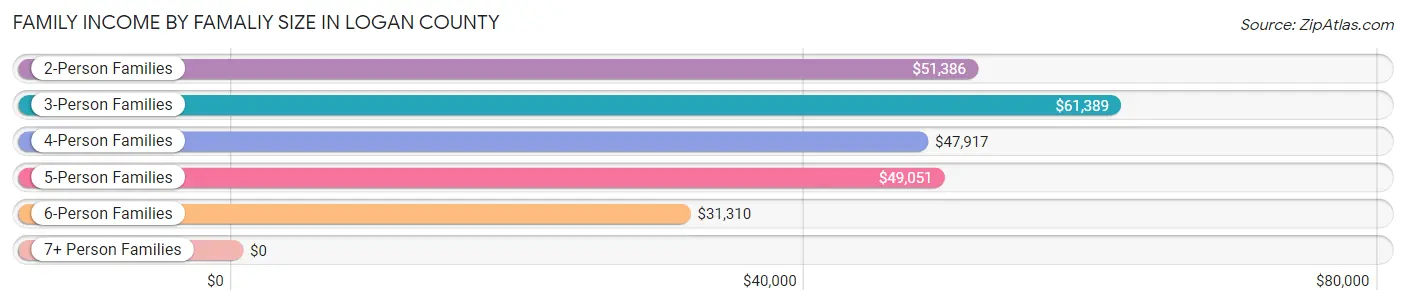
Family Income by Famaliy Size in Logan County
3-person families (2,142 | 24.6%) account for the highest median family income in Logan County with $61,389 per family, while 2-person families (4,518 | 51.9%) have the highest median income of $25,693 per family member.
| Income Bracket | # Families | Median Income |
| 2-Person Families | 4,518 (51.9%) | $51,386 |
| 3-Person Families | 2,142 (24.6%) | $61,389 |
| 4-Person Families | 1,199 (13.8%) | $47,917 |
| 5-Person Families | 505 (5.8%) | $49,051 |
| 6-Person Families | 226 (2.6%) | $31,310 |
| 7+ Person Families | 117 (1.3%) | $0 |
| Total | 8,707 (100.0%) | $51,057 |
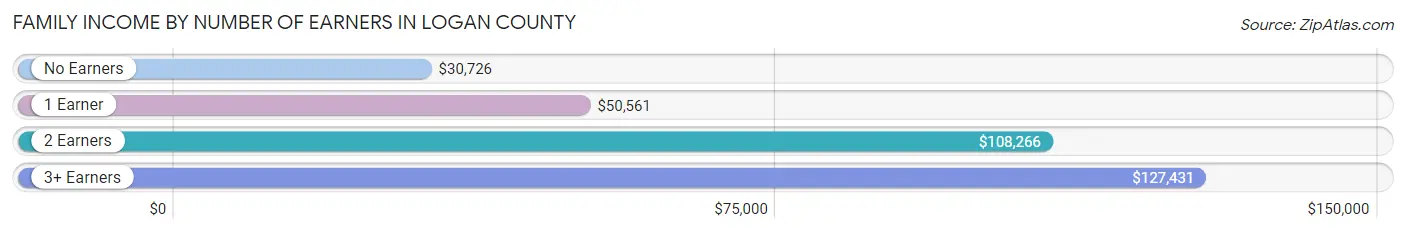
Family Income by Number of Earners in Logan County
The median family income in Logan County is $51,057, with families comprising 3+ earners (305) having the highest median family income of $127,431, while families with no earners (2,978) have the lowest median family income of $30,726, accounting for 3.5% and 34.2% of families, respectively.
| Number of Earners | # Families | Median Income |
| No Earners | 2,978 (34.2%) | $30,726 |
| 1 Earner | 3,635 (41.7%) | $50,561 |
| 2 Earners | 1,789 (20.5%) | $108,266 |
| 3+ Earners | 305 (3.5%) | $127,431 |
| Total | 8,707 (100.0%) | $51,057 |
Household Income in Logan County
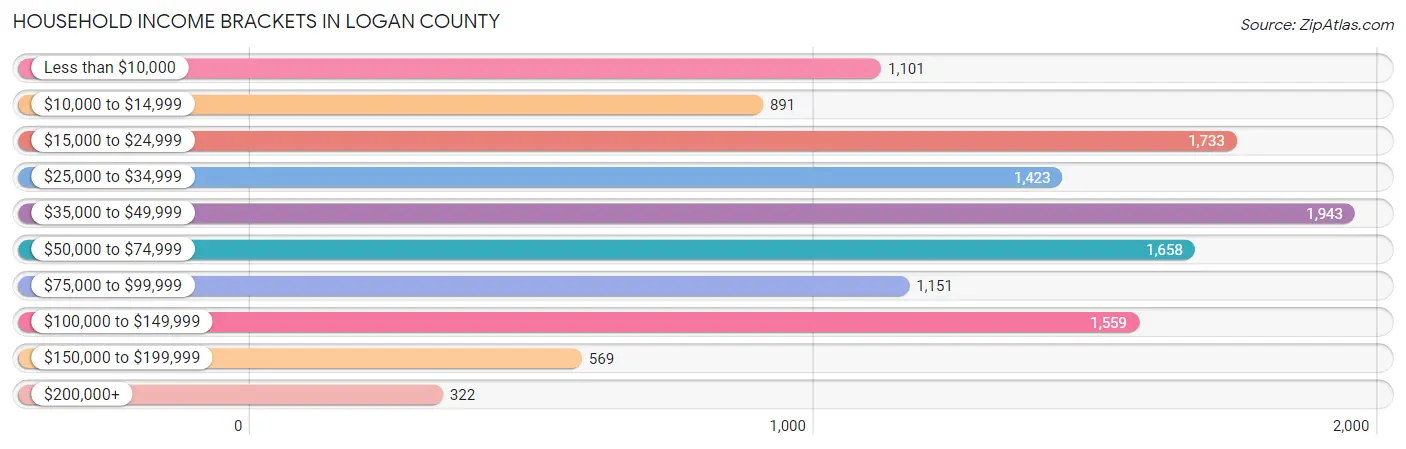
Household Income Brackets in Logan County
With 1,943 households falling in the category, the $35,000 to $49,999 income range is the most frequent in Logan County, accounting for 15.7% of all households. In contrast, only 322 households (2.6%) fall into the $200,000+ income bracket, making it the least populous group.
| Income Bracket | # Households | % Households |
| Less than $10,000 | 1,101 | 8.9% |
| $10,000 to $14,999 | 891 | 7.2% |
| $15,000 to $24,999 | 1,733 | 14.0% |
| $25,000 to $34,999 | 1,423 | 11.5% |
| $35,000 to $49,999 | 1,943 | 15.7% |
| $50,000 to $74,999 | 1,658 | 13.4% |
| $75,000 to $99,999 | 1,151 | 9.3% |
| $100,000 to $149,999 | 1,559 | 12.6% |
| $150,000 to $199,999 | 569 | 4.6% |
| $200,000+ | 322 | 2.6% |
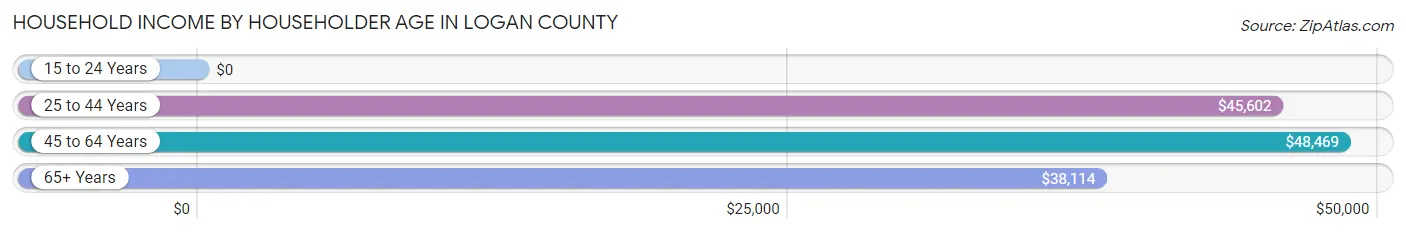
Household Income by Householder Age in Logan County
The median household income in Logan County is $42,194, with the highest median household income of $48,469 found in the 45 to 64 years age bracket for the primary householder. A total of 4,328 households (35.0%) fall into this category. Meanwhile, the 15 to 24 years age bracket for the primary householder has the lowest median household income of $0, with 369 households (3.0%) in this group.
| Income Bracket | # Households | Median Income |
| 15 to 24 Years | 369 (3.0%) | $0 |
| 25 to 44 Years | 3,150 (25.5%) | $45,602 |
| 45 to 64 Years | 4,328 (35.0%) | $48,469 |
| 65+ Years | 4,528 (36.6%) | $38,114 |
| Total | 12,375 (100.0%) | $42,194 |
Poverty in Logan County
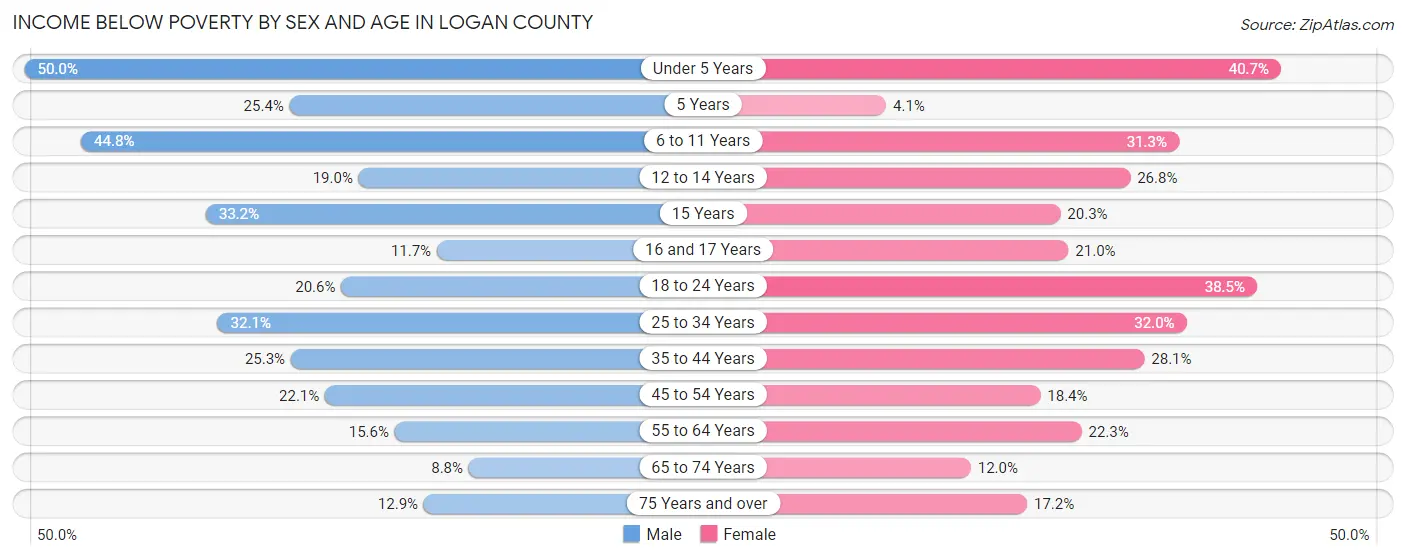
Income Below Poverty by Sex and Age in Logan County
With 23.3% poverty level for males and 24.2% for females among the residents of Logan County, under 5 year old males and under 5 year old females are the most vulnerable to poverty, with 381 males (50.0%) and 330 females (40.7%) in their respective age groups living below the poverty level.
| Age Bracket | Male | Female |
| Under 5 Years | 381 (50.0%) | 330 (40.7%) |
| 5 Years | 16 (25.4%) | 3 (4.1%) |
| 6 to 11 Years | 575 (44.8%) | 227 (31.3%) |
| 12 to 14 Years | 105 (19.0%) | 261 (26.8%) |
| 15 Years | 70 (33.2%) | 28 (20.3%) |
| 16 and 17 Years | 55 (11.7%) | 90 (21.0%) |
| 18 to 24 Years | 256 (20.6%) | 439 (38.5%) |
| 25 to 34 Years | 565 (32.1%) | 529 (32.0%) |
| 35 to 44 Years | 471 (25.3%) | 558 (28.1%) |
| 45 to 54 Years | 466 (22.1%) | 381 (18.4%) |
| 55 to 64 Years | 330 (15.6%) | 509 (22.3%) |
| 65 to 74 Years | 175 (8.8%) | 273 (12.0%) |
| 75 Years and over | 130 (12.9%) | 258 (17.2%) |
| Total | 3,595 (23.3%) | 3,886 (24.2%) |
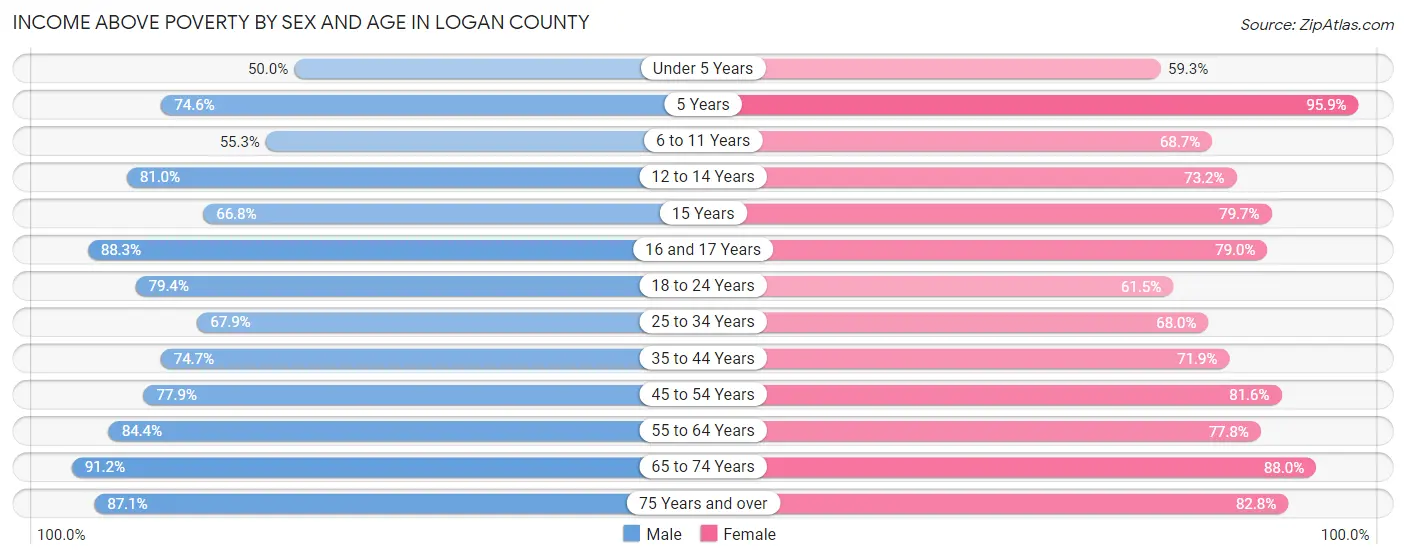
Income Above Poverty by Sex and Age in Logan County
According to the poverty statistics in Logan County, males aged 65 to 74 years and females aged 5 years are the age groups that are most secure financially, with 91.2% of males and 95.9% of females in these age groups living above the poverty line.
| Age Bracket | Male | Female |
| Under 5 Years | 381 (50.0%) | 480 (59.3%) |
| 5 Years | 47 (74.6%) | 70 (95.9%) |
| 6 to 11 Years | 710 (55.2%) | 499 (68.7%) |
| 12 to 14 Years | 448 (81.0%) | 714 (73.2%) |
| 15 Years | 141 (66.8%) | 110 (79.7%) |
| 16 and 17 Years | 414 (88.3%) | 338 (79.0%) |
| 18 to 24 Years | 986 (79.4%) | 701 (61.5%) |
| 25 to 34 Years | 1,196 (67.9%) | 1,125 (68.0%) |
| 35 to 44 Years | 1,392 (74.7%) | 1,429 (71.9%) |
| 45 to 54 Years | 1,642 (77.9%) | 1,686 (81.6%) |
| 55 to 64 Years | 1,780 (84.4%) | 1,779 (77.7%) |
| 65 to 74 Years | 1,820 (91.2%) | 2,008 (88.0%) |
| 75 Years and over | 875 (87.1%) | 1,243 (82.8%) |
| Total | 11,832 (76.7%) | 12,182 (75.8%) |
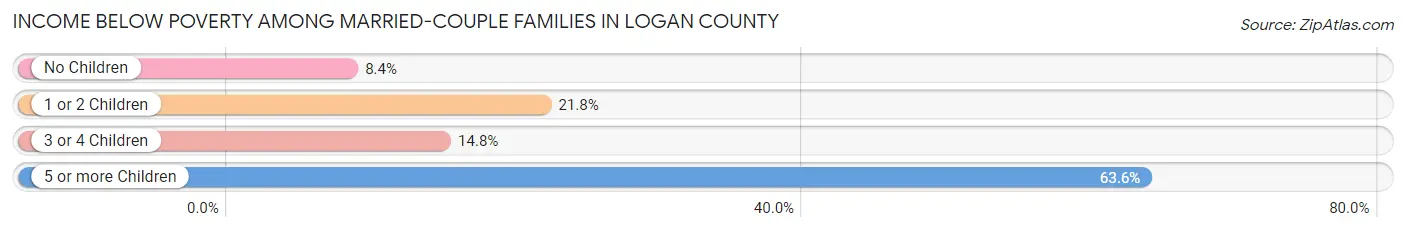
Income Below Poverty Among Married-Couple Families in Logan County
The poverty statistics for married-couple families in Logan County show that 13.1% or 816 of the total 6,239 families live below the poverty line. Families with 5 or more children have the highest poverty rate of 63.6%, comprising of 14 families. On the other hand, families with no children have the lowest poverty rate of 8.4%, which includes 332 families.
| Children | Above Poverty | Below Poverty |
| No Children | 3,633 (91.6%) | 332 (8.4%) |
| 1 or 2 Children | 1,518 (78.2%) | 424 (21.8%) |
| 3 or 4 Children | 264 (85.2%) | 46 (14.8%) |
| 5 or more Children | 8 (36.4%) | 14 (63.6%) |
| Total | 5,423 (86.9%) | 816 (13.1%) |
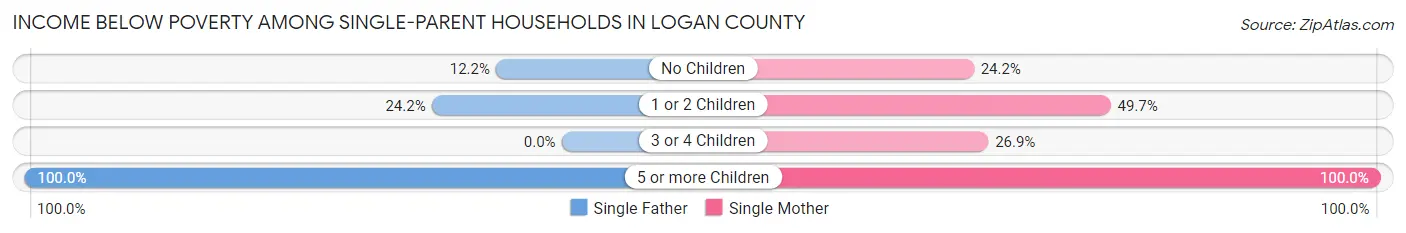
Income Below Poverty Among Single-Parent Households in Logan County
According to the poverty data in Logan County, 18.9% or 155 single-father households and 39.1% or 644 single-mother households are living below the poverty line. Among single-father households, those with 5 or more children have the highest poverty rate, with 15 households (100.0%) experiencing poverty. Likewise, among single-mother households, those with 5 or more children have the highest poverty rate, with 87 households (100.0%) falling below the poverty line.
| Children | Single Father | Single Mother |
| No Children | 56 (12.2%) | 163 (24.2%) |
| 1 or 2 Children | 84 (24.2%) | 338 (49.7%) |
| 3 or 4 Children | 0 (0.0%) | 56 (26.9%) |
| 5 or more Children | 15 (100.0%) | 87 (100.0%) |
| Total | 155 (18.9%) | 644 (39.1%) |
Income Below Poverty Among Married-Couple vs Single-Parent Households in Logan County
The poverty data for Logan County shows that 816 of the married-couple family households (13.1%) and 799 of the single-parent households (32.4%) are living below the poverty level. Within the married-couple family households, those with 5 or more children have the highest poverty rate, with 14 households (63.6%) falling below the poverty line. Among the single-parent households, those with 5 or more children have the highest poverty rate, with 102 household (100.0%) living below poverty.
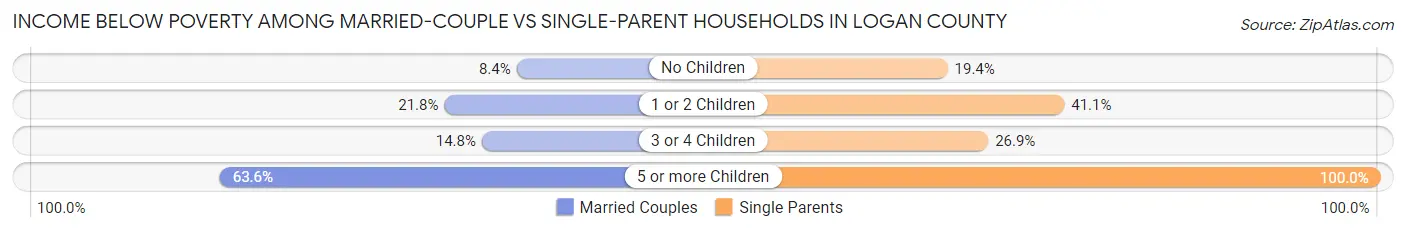
| Children | Married-Couple Families | Single-Parent Households |
| No Children | 332 (8.4%) | 219 (19.4%) |
| 1 or 2 Children | 424 (21.8%) | 422 (41.1%) |
| 3 or 4 Children | 46 (14.8%) | 56 (26.9%) |
| 5 or more Children | 14 (63.6%) | 102 (100.0%) |
| Total | 816 (13.1%) | 799 (32.4%) |
Employment Characteristics in Logan County
Employment by Class of Employer in Logan County
Among the 9,181 employed individuals in Logan County, private company employees (6,319 | 68.8%), state government employees (1,307 | 14.2%), and local government employees (686 | 7.5%) make up the most common classes of employment.
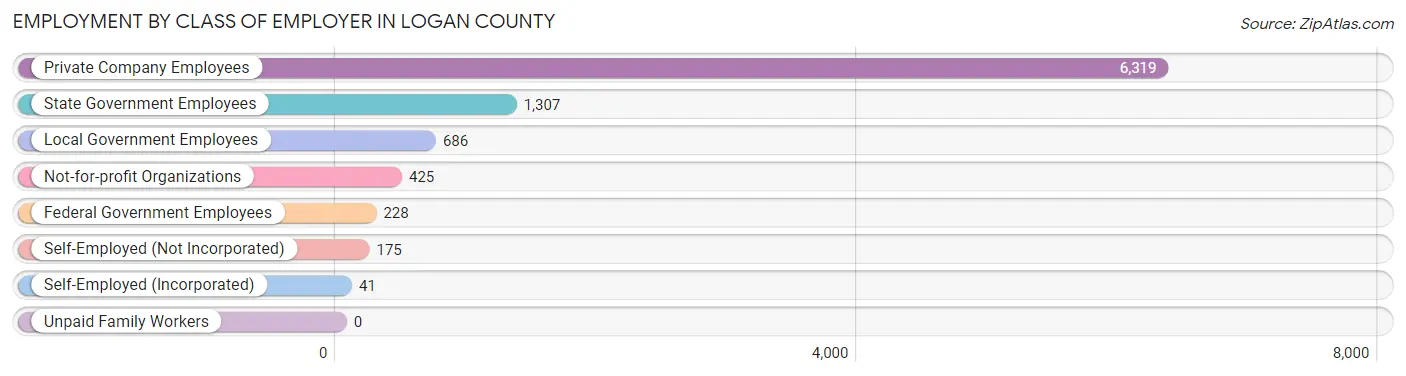
| Employer Class | # Employees | % Employees |
| Private Company Employees | 6,319 | 68.8% |
| Self-Employed (Incorporated) | 41 | 0.4% |
| Self-Employed (Not Incorporated) | 175 | 1.9% |
| Not-for-profit Organizations | 425 | 4.6% |
| Local Government Employees | 686 | 7.5% |
| State Government Employees | 1,307 | 14.2% |
| Federal Government Employees | 228 | 2.5% |
| Unpaid Family Workers | 0 | 0.0% |
| Total | 9,181 | 100.0% |
Employment Status by Age in Logan County
According to the labor force statistics for Logan County, out of the total population over 16 years of age (26,593), 41.3% or 10,983 individuals are in the labor force, with 13.3% or 1,461 of them unemployed. The age group with the highest labor force participation rate is 25 to 29 years, with 72.8% or 1,379 individuals in the labor force. Within the labor force, the 20 to 24 years age range has the highest percentage of unemployed individuals, with 31.8% or 377 of them being unemployed.
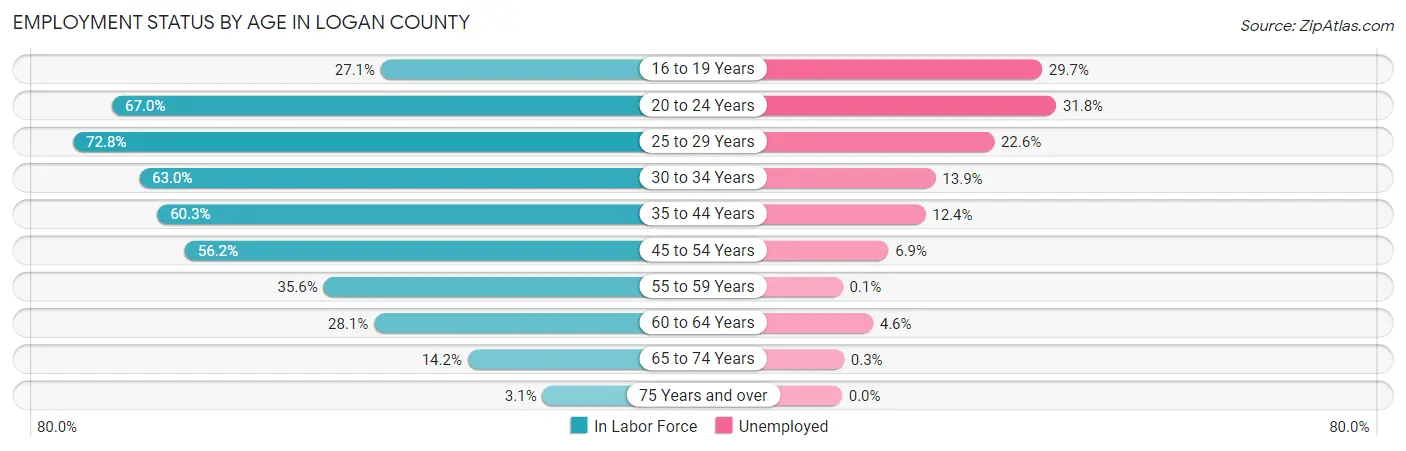
| Age Bracket | In Labor Force | Unemployed |
| 16 to 19 Years | 418 (27.1%) | 124 (29.7%) |
| 20 to 24 Years | 1,185 (67.0%) | 377 (31.8%) |
| 25 to 29 Years | 1,379 (72.8%) | 312 (22.6%) |
| 30 to 34 Years | 1,069 (63.0%) | 149 (13.9%) |
| 35 to 44 Years | 2,422 (60.3%) | 300 (12.4%) |
| 45 to 54 Years | 2,406 (56.2%) | 166 (6.9%) |
| 55 to 59 Years | 766 (35.6%) | 1 (0.1%) |
| 60 to 64 Years | 636 (28.1%) | 29 (4.6%) |
| 65 to 74 Years | 615 (14.2%) | 2 (0.3%) |
| 75 Years and over | 82 (3.1%) | 0 (0.0%) |
| Total | 10,983 (41.3%) | 1,461 (13.3%) |
Employment Status by Educational Attainment in Logan County
According to labor force statistics for Logan County, 53.2% of individuals (8,673) out of the total population between 25 and 64 years of age (16,303) are in the labor force, with 11.0% or 954 of them being unemployed. The group with the highest labor force participation rate are those with the educational attainment of bachelor's degree or higher, with 77.8% or 1,584 individuals in the labor force. Within the labor force, individuals with less than high school education have the highest percentage of unemployment, with 37.2% or 261 of them being unemployed.
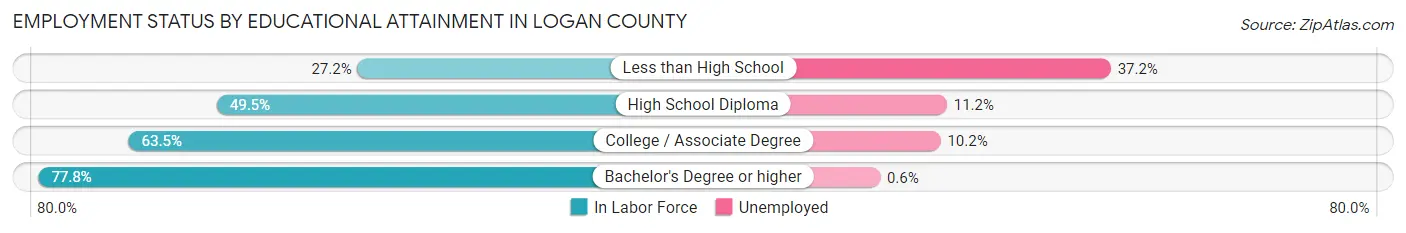
| Educational Attainment | In Labor Force | Unemployed |
| Less than High School | 702 (27.2%) | 960 (37.2%) |
| High School Diploma | 3,645 (49.5%) | 825 (11.2%) |
| College / Associate Degree | 2,745 (63.5%) | 441 (10.2%) |
| Bachelor's Degree or higher | 1,584 (77.8%) | 12 (0.6%) |
| Total | 8,673 (53.2%) | 1,793 (11.0%) |
Employment Occupations by Sex in Logan County
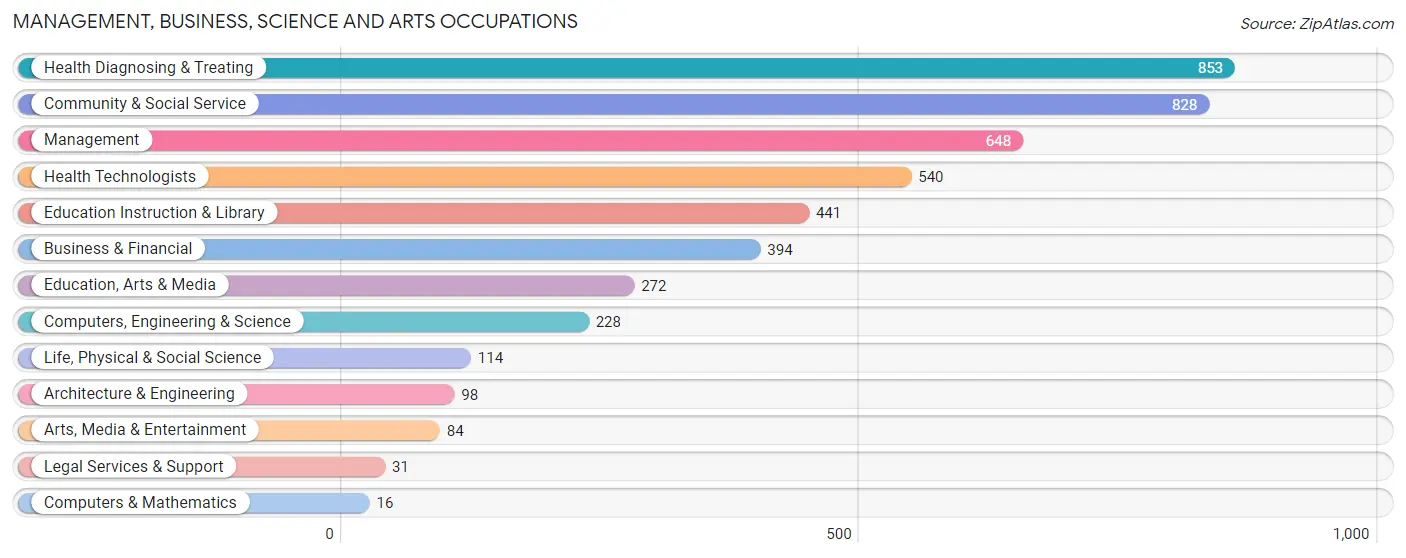
Management, Business, Science and Arts Occupations
The most common Management, Business, Science and Arts occupations in Logan County are Health Diagnosing & Treating (853 | 9.0%), Community & Social Service (828 | 8.7%), Management (648 | 6.8%), Health Technologists (540 | 5.7%), and Education Instruction & Library (441 | 4.6%).
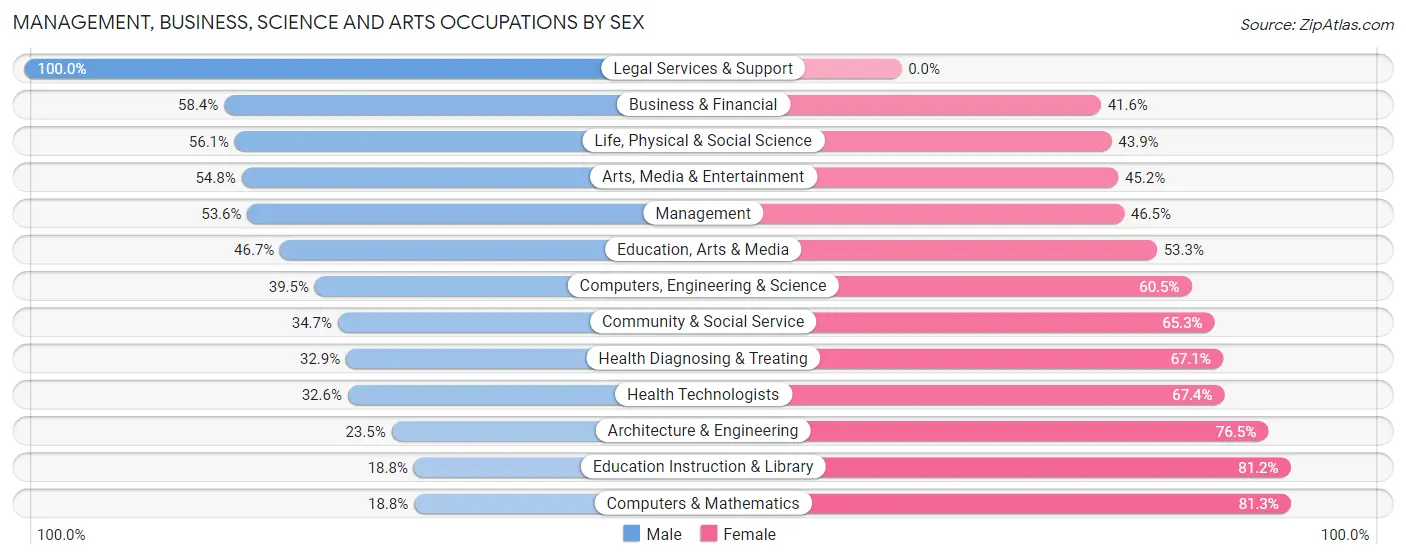
Management, Business, Science and Arts Occupations by Sex
Within the Management, Business, Science and Arts occupations in Logan County, the most male-oriented occupations are Legal Services & Support (100.0%), Business & Financial (58.4%), and Life, Physical & Social Science (56.1%), while the most female-oriented occupations are Computers & Mathematics (81.2%), Education Instruction & Library (81.2%), and Architecture & Engineering (76.5%).
| Occupation | Male | Female |
| Management | 347 (53.5%) | 301 (46.5%) |
| Business & Financial | 230 (58.4%) | 164 (41.6%) |
| Computers, Engineering & Science | 90 (39.5%) | 138 (60.5%) |
| Computers & Mathematics | 3 (18.8%) | 13 (81.2%) |
| Architecture & Engineering | 23 (23.5%) | 75 (76.5%) |
| Life, Physical & Social Science | 64 (56.1%) | 50 (43.9%) |
| Community & Social Service | 287 (34.7%) | 541 (65.3%) |
| Education, Arts & Media | 127 (46.7%) | 145 (53.3%) |
| Legal Services & Support | 31 (100.0%) | 0 (0.0%) |
| Education Instruction & Library | 83 (18.8%) | 358 (81.2%) |
| Arts, Media & Entertainment | 46 (54.8%) | 38 (45.2%) |
| Health Diagnosing & Treating | 281 (32.9%) | 572 (67.1%) |
| Health Technologists | 176 (32.6%) | 364 (67.4%) |
| Total (Category) | 1,235 (41.8%) | 1,716 (58.2%) |
| Total (Overall) | 4,965 (52.1%) | 4,555 (47.8%) |
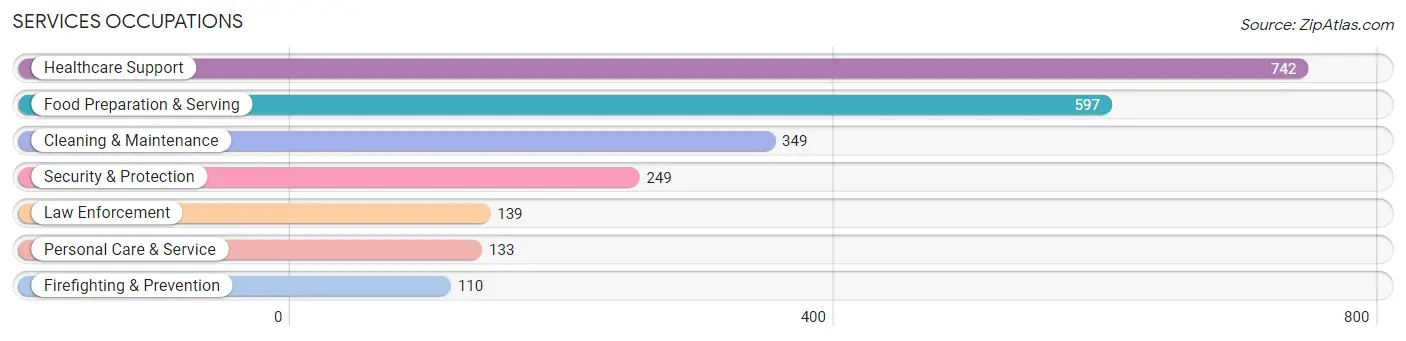
Services Occupations
The most common Services occupations in Logan County are Healthcare Support (742 | 7.8%), Food Preparation & Serving (597 | 6.3%), Cleaning & Maintenance (349 | 3.7%), Security & Protection (249 | 2.6%), and Law Enforcement (139 | 1.5%).
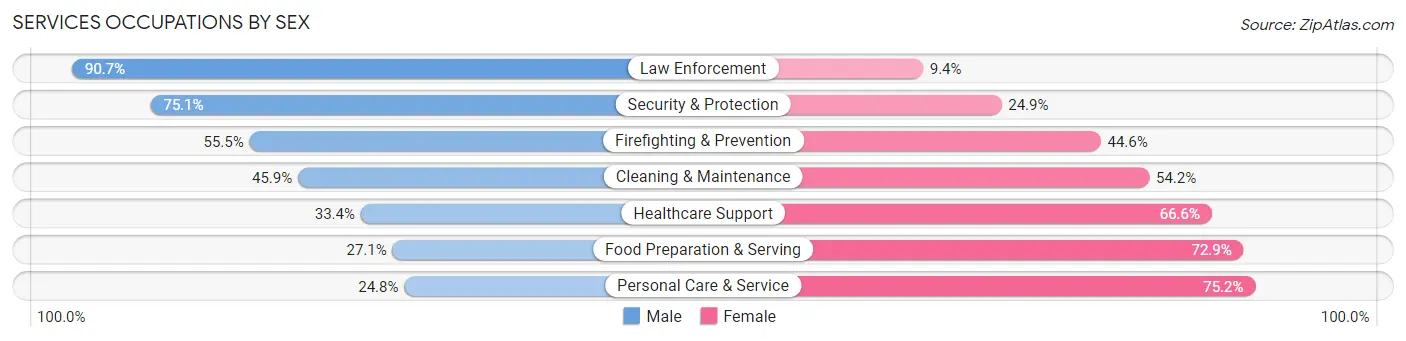
Services Occupations by Sex
Within the Services occupations in Logan County, the most male-oriented occupations are Law Enforcement (90.6%), Security & Protection (75.1%), and Firefighting & Prevention (55.4%), while the most female-oriented occupations are Personal Care & Service (75.2%), Food Preparation & Serving (72.9%), and Healthcare Support (66.6%).
| Occupation | Male | Female |
| Healthcare Support | 248 (33.4%) | 494 (66.6%) |
| Security & Protection | 187 (75.1%) | 62 (24.9%) |
| Firefighting & Prevention | 61 (55.4%) | 49 (44.6%) |
| Law Enforcement | 126 (90.6%) | 13 (9.3%) |
| Food Preparation & Serving | 162 (27.1%) | 435 (72.9%) |
| Cleaning & Maintenance | 160 (45.9%) | 189 (54.1%) |
| Personal Care & Service | 33 (24.8%) | 100 (75.2%) |
| Total (Category) | 790 (38.2%) | 1,280 (61.8%) |
| Total (Overall) | 4,965 (52.1%) | 4,555 (47.8%) |
Sales and Office Occupations
The most common Sales and Office occupations in Logan County are Office & Administration (1,241 | 13.0%), and Sales & Related (776 | 8.2%).
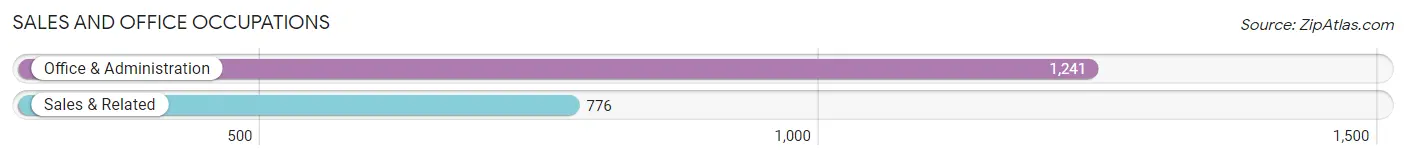
Sales and Office Occupations by Sex

| Occupation | Male | Female |
| Sales & Related | 302 (38.9%) | 474 (61.1%) |
| Office & Administration | 314 (25.3%) | 927 (74.7%) |
| Total (Category) | 616 (30.5%) | 1,401 (69.5%) |
| Total (Overall) | 4,965 (52.1%) | 4,555 (47.8%) |
Natural Resources, Construction and Maintenance Occupations
The most common Natural Resources, Construction and Maintenance occupations in Logan County are Construction & Extraction (745 | 7.8%), Installation, Maintenance & Repair (481 | 5.1%), and Farming, Fishing & Forestry (25 | 0.3%).
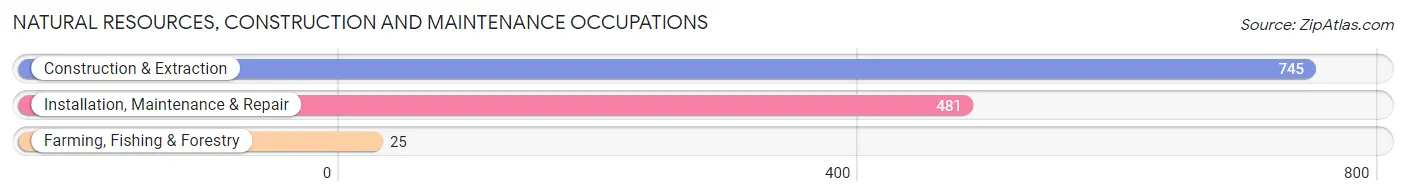
Natural Resources, Construction and Maintenance Occupations by Sex
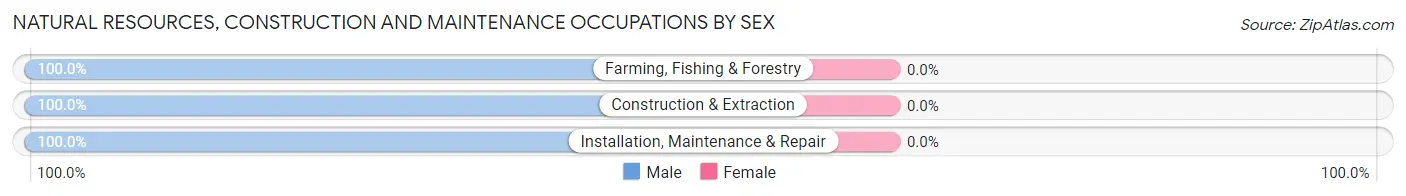
| Occupation | Male | Female |
| Farming, Fishing & Forestry | 25 (100.0%) | 0 (0.0%) |
| Construction & Extraction | 745 (100.0%) | 0 (0.0%) |
| Installation, Maintenance & Repair | 481 (100.0%) | 0 (0.0%) |
| Total (Category) | 1,251 (100.0%) | 0 (0.0%) |
| Total (Overall) | 4,965 (52.1%) | 4,555 (47.8%) |
Production, Transportation and Moving Occupations
The most common Production, Transportation and Moving occupations in Logan County are Transportation (533 | 5.6%), Production (468 | 4.9%), and Material Moving (230 | 2.4%).
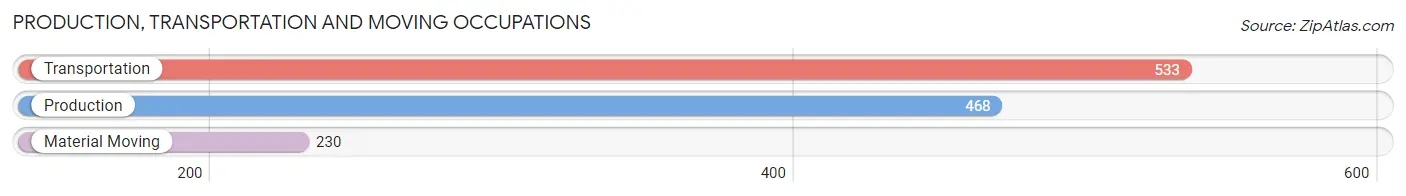
Production, Transportation and Moving Occupations by Sex
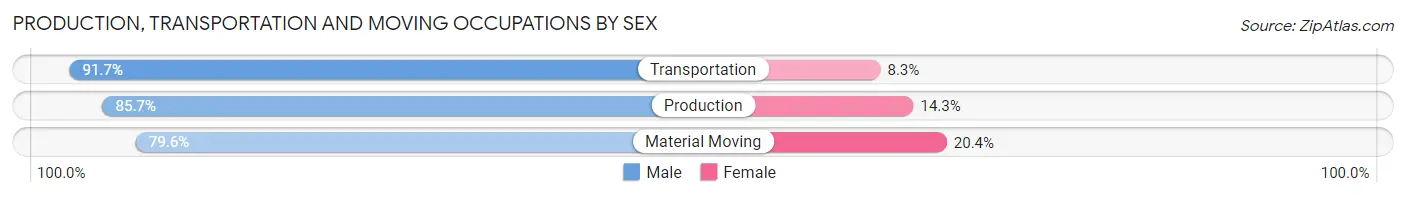
| Occupation | Male | Female |
| Production | 401 (85.7%) | 67 (14.3%) |
| Transportation | 489 (91.7%) | 44 (8.3%) |
| Material Moving | 183 (79.6%) | 47 (20.4%) |
| Total (Category) | 1,073 (87.2%) | 158 (12.8%) |
| Total (Overall) | 4,965 (52.1%) | 4,555 (47.8%) |
Employment Industries by Sex in Logan County
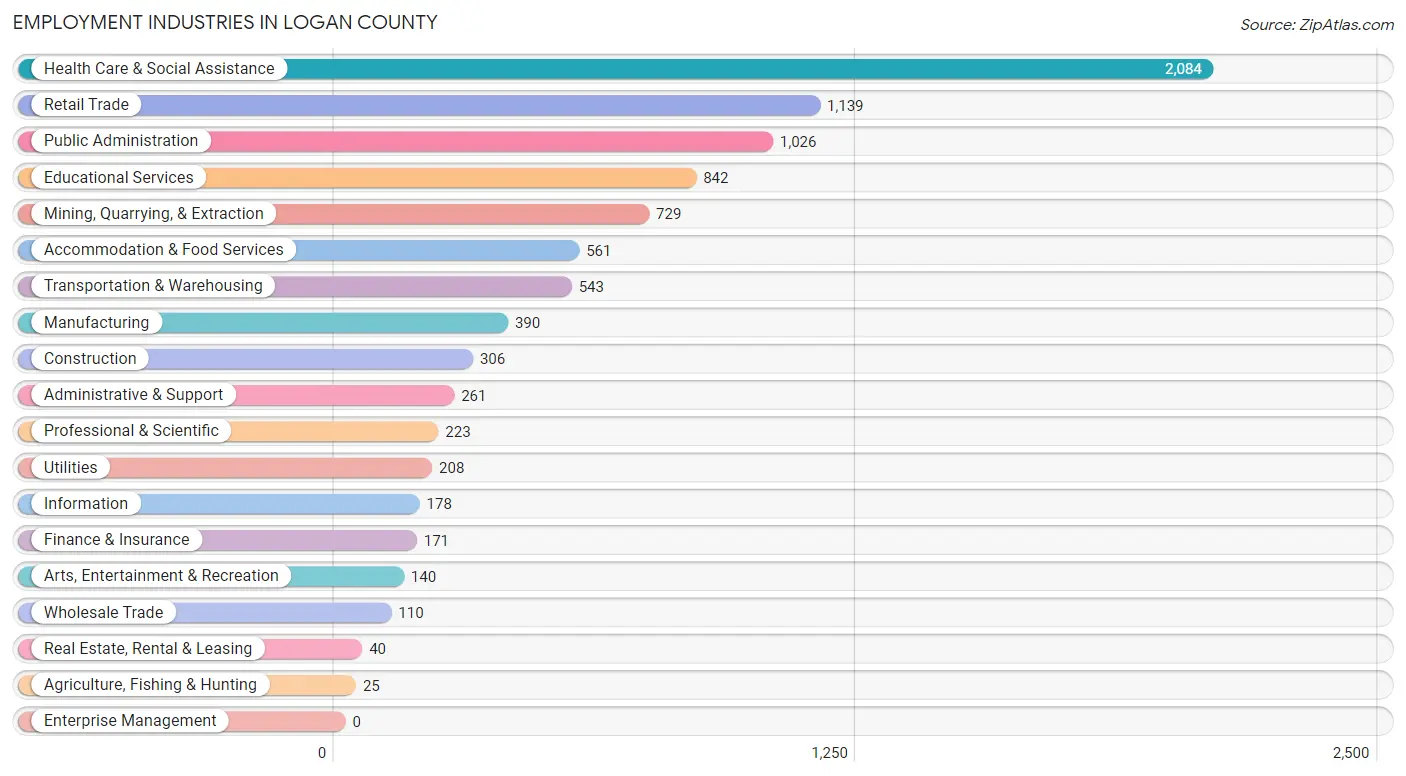
Employment Industries in Logan County
The major employment industries in Logan County include Health Care & Social Assistance (2,084 | 21.9%), Retail Trade (1,139 | 12.0%), Public Administration (1,026 | 10.8%), Educational Services (842 | 8.8%), and Mining, Quarrying, & Extraction (729 | 7.7%).
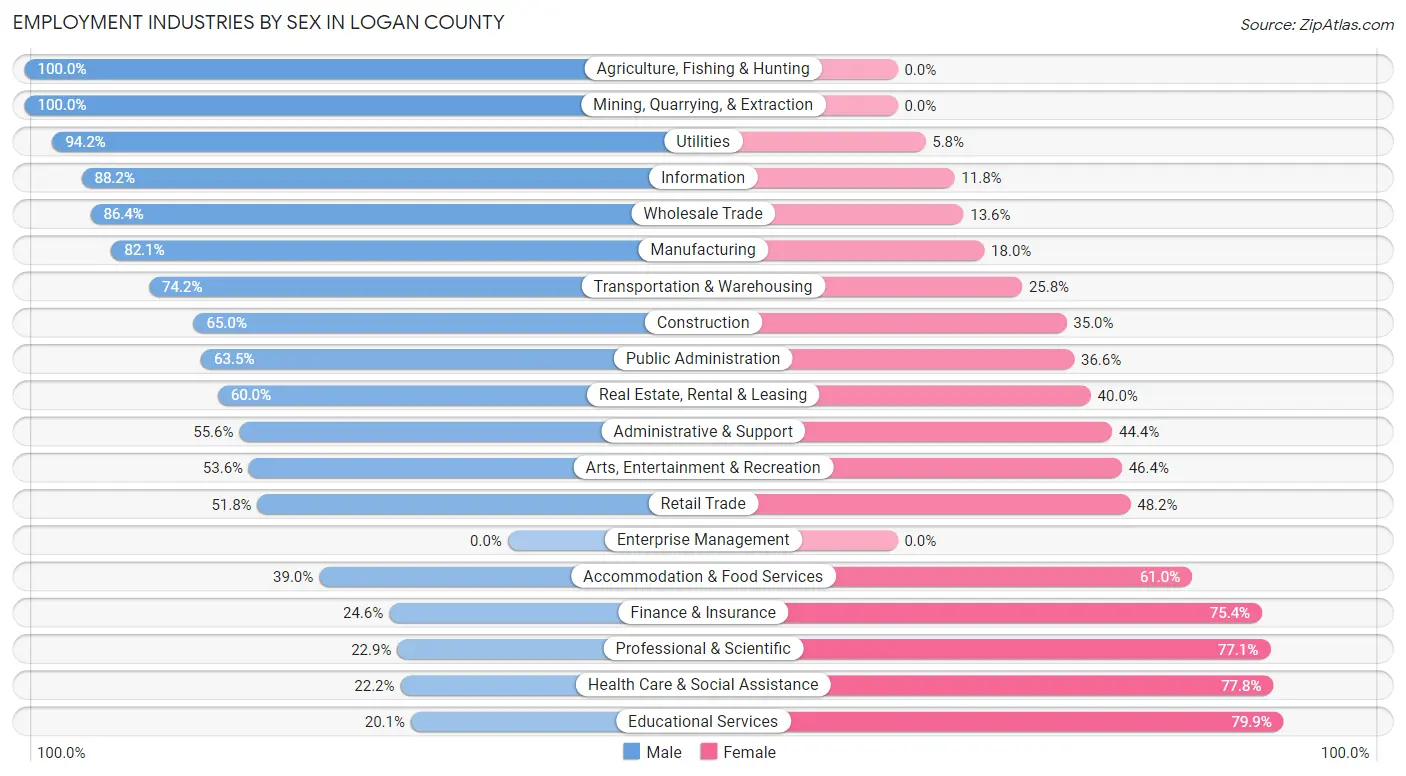
Employment Industries by Sex in Logan County
The Logan County industries that see more men than women are Agriculture, Fishing & Hunting (100.0%), Mining, Quarrying, & Extraction (100.0%), and Utilities (94.2%), whereas the industries that tend to have a higher number of women are Educational Services (79.9%), Health Care & Social Assistance (77.8%), and Professional & Scientific (77.1%).
| Industry | Male | Female |
| Agriculture, Fishing & Hunting | 25 (100.0%) | 0 (0.0%) |
| Mining, Quarrying, & Extraction | 729 (100.0%) | 0 (0.0%) |
| Construction | 199 (65.0%) | 107 (35.0%) |
| Manufacturing | 320 (82.1%) | 70 (17.9%) |
| Wholesale Trade | 95 (86.4%) | 15 (13.6%) |
| Retail Trade | 590 (51.8%) | 549 (48.2%) |
| Transportation & Warehousing | 403 (74.2%) | 140 (25.8%) |
| Utilities | 196 (94.2%) | 12 (5.8%) |
| Information | 157 (88.2%) | 21 (11.8%) |
| Finance & Insurance | 42 (24.6%) | 129 (75.4%) |
| Real Estate, Rental & Leasing | 24 (60.0%) | 16 (40.0%) |
| Professional & Scientific | 51 (22.9%) | 172 (77.1%) |
| Enterprise Management | 0 (0.0%) | 0 (0.0%) |
| Administrative & Support | 145 (55.6%) | 116 (44.4%) |
| Educational Services | 169 (20.1%) | 673 (79.9%) |
| Health Care & Social Assistance | 463 (22.2%) | 1,621 (77.8%) |
| Arts, Entertainment & Recreation | 75 (53.6%) | 65 (46.4%) |
| Accommodation & Food Services | 219 (39.0%) | 342 (61.0%) |
| Public Administration | 651 (63.4%) | 375 (36.5%) |
| Total | 4,965 (52.1%) | 4,555 (47.8%) |
Education in Logan County
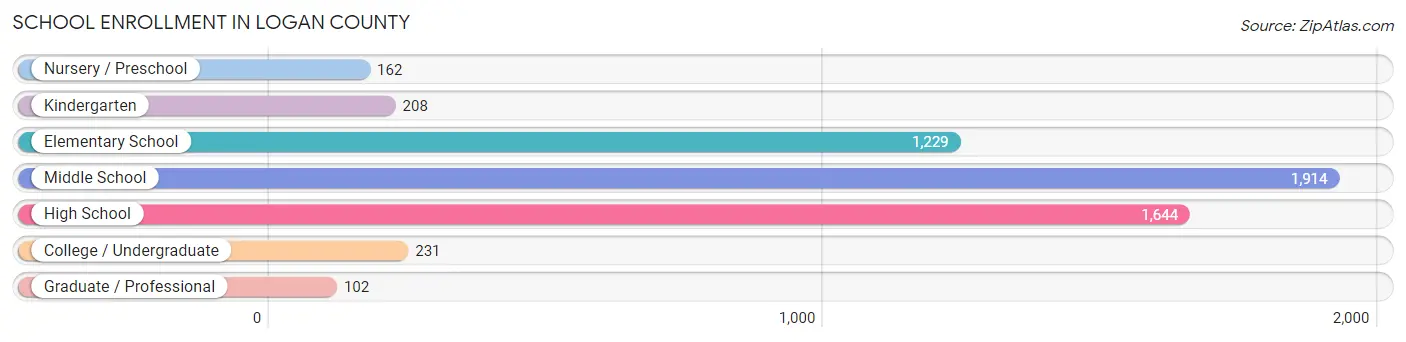
School Enrollment in Logan County
The most common levels of schooling among the 5,490 students in Logan County are middle school (1,914 | 34.9%), high school (1,644 | 29.9%), and elementary school (1,229 | 22.4%).
| School Level | # Students | % Students |
| Nursery / Preschool | 162 | 2.9% |
| Kindergarten | 208 | 3.8% |
| Elementary School | 1,229 | 22.4% |
| Middle School | 1,914 | 34.9% |
| High School | 1,644 | 29.9% |
| College / Undergraduate | 231 | 4.2% |
| Graduate / Professional | 102 | 1.9% |
| Total | 5,490 | 100.0% |
School Enrollment by Age by Funding Source in Logan County
Out of a total of 5,490 students who are enrolled in schools in Logan County, 165 (3.0%) attend a private institution, while the remaining 5,325 (97.0%) are enrolled in public schools. The age group of 25 to 34 year olds has the highest likelihood of being enrolled in private schools, with 21 (24.4% in the age bracket) enrolled. Conversely, the age group of 20 to 24 year olds has the lowest likelihood of being enrolled in a private school, with 129 (100.0% in the age bracket) attending a public institution.
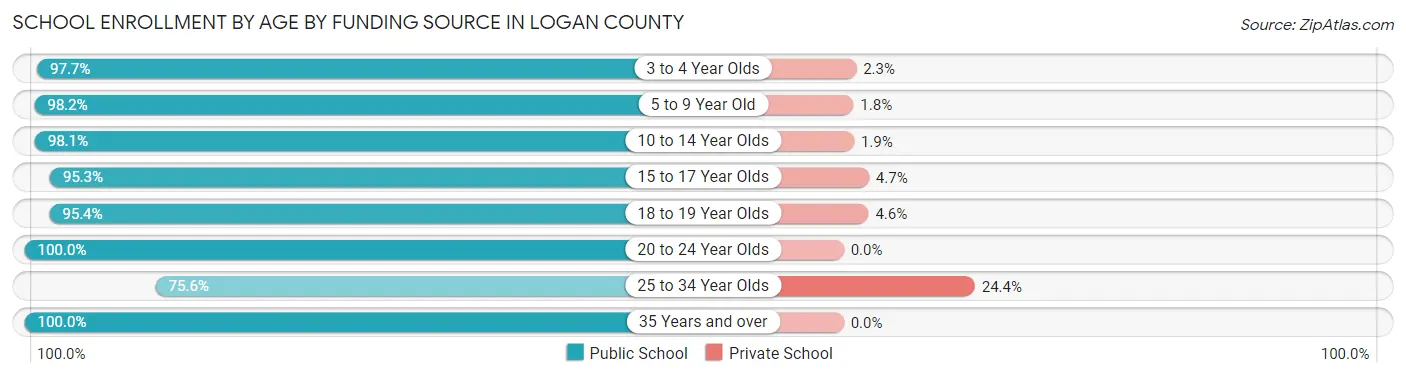
| Age Bracket | Public School | Private School |
| 3 to 4 Year Olds | 167 (97.7%) | 4 (2.3%) |
| 5 to 9 Year Old | 1,357 (98.2%) | 25 (1.8%) |
| 10 to 14 Year Olds | 2,109 (98.1%) | 41 (1.9%) |
| 15 to 17 Year Olds | 1,135 (95.3%) | 56 (4.7%) |
| 18 to 19 Year Olds | 310 (95.4%) | 15 (4.6%) |
| 20 to 24 Year Olds | 129 (100.0%) | 0 (0.0%) |
| 25 to 34 Year Olds | 65 (75.6%) | 21 (24.4%) |
| 35 Years and over | 56 (100.0%) | 0 (0.0%) |
| Total | 5,325 (97.0%) | 165 (3.0%) |
Educational Attainment by Field of Study in Logan County
Education (916 | 25.8%), science & technology (670 | 18.9%), business (343 | 9.7%), physical & health sciences (285 | 8.0%), and arts & humanities (267 | 7.5%) are the most common fields of study among 3,552 individuals in Logan County who have obtained a bachelor's degree or higher.
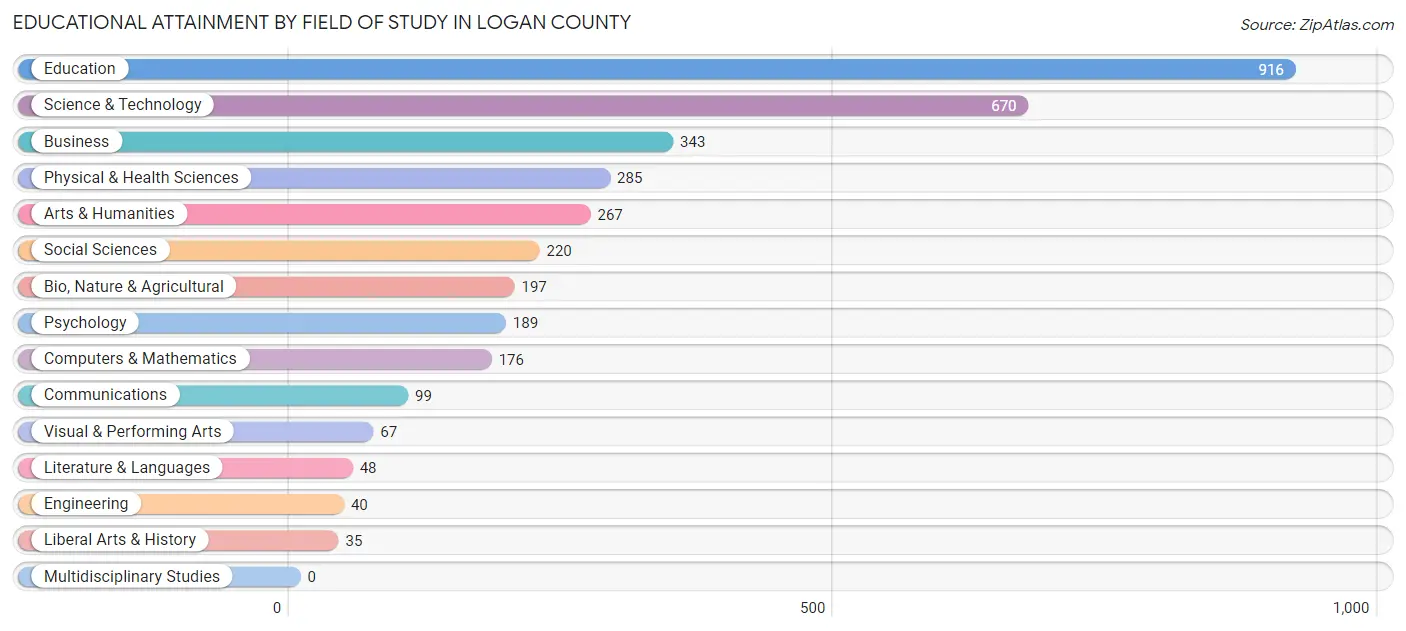
| Field of Study | # Graduates | % Graduates |
| Computers & Mathematics | 176 | 5.0% |
| Bio, Nature & Agricultural | 197 | 5.6% |
| Physical & Health Sciences | 285 | 8.0% |
| Psychology | 189 | 5.3% |
| Social Sciences | 220 | 6.2% |
| Engineering | 40 | 1.1% |
| Multidisciplinary Studies | 0 | 0.0% |
| Science & Technology | 670 | 18.9% |
| Business | 343 | 9.7% |
| Education | 916 | 25.8% |
| Literature & Languages | 48 | 1.3% |
| Liberal Arts & History | 35 | 1.0% |
| Visual & Performing Arts | 67 | 1.9% |
| Communications | 99 | 2.8% |
| Arts & Humanities | 267 | 7.5% |
| Total | 3,552 | 100.0% |
Transportation & Commute in Logan County
Vehicle Availability by Sex in Logan County
The most prevalent vehicle ownership categories in Logan County are males with 2 vehicles (2,224, accounting for 47.2%) and females with 2 vehicles (1,904, making up 49.9%).
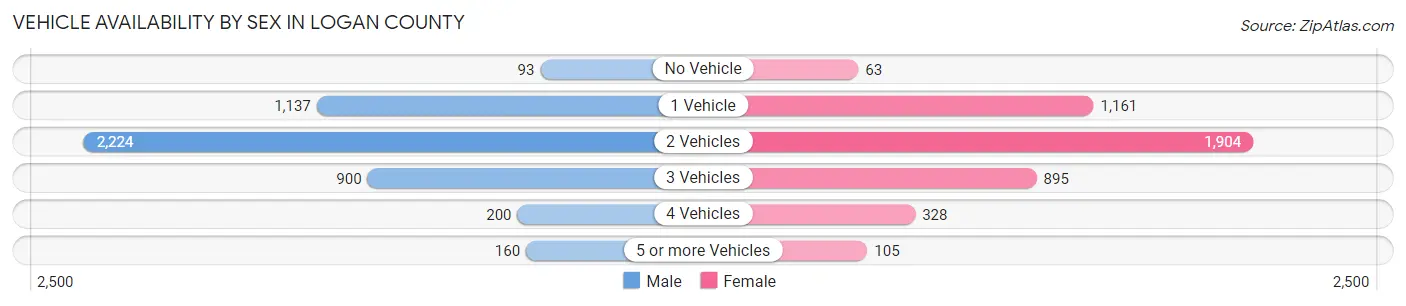
| Vehicles Available | Male | Female |
| No Vehicle | 93 (2.0%) | 63 (1.4%) |
| 1 Vehicle | 1,137 (24.1%) | 1,161 (26.1%) |
| 2 Vehicles | 2,224 (47.2%) | 1,904 (42.7%) |
| 3 Vehicles | 900 (19.1%) | 895 (20.1%) |
| 4 Vehicles | 200 (4.2%) | 328 (7.4%) |
| 5 or more Vehicles | 160 (3.4%) | 105 (2.4%) |
| Total | 4,714 (100.0%) | 4,456 (100.0%) |
Commute Time in Logan County
The most frequently occuring commute durations in Logan County are 10 to 14 minutes (1,493 commuters, 17.0%), 15 to 19 minutes (1,240 commuters, 14.1%), and 20 to 24 minutes (1,194 commuters, 13.6%).
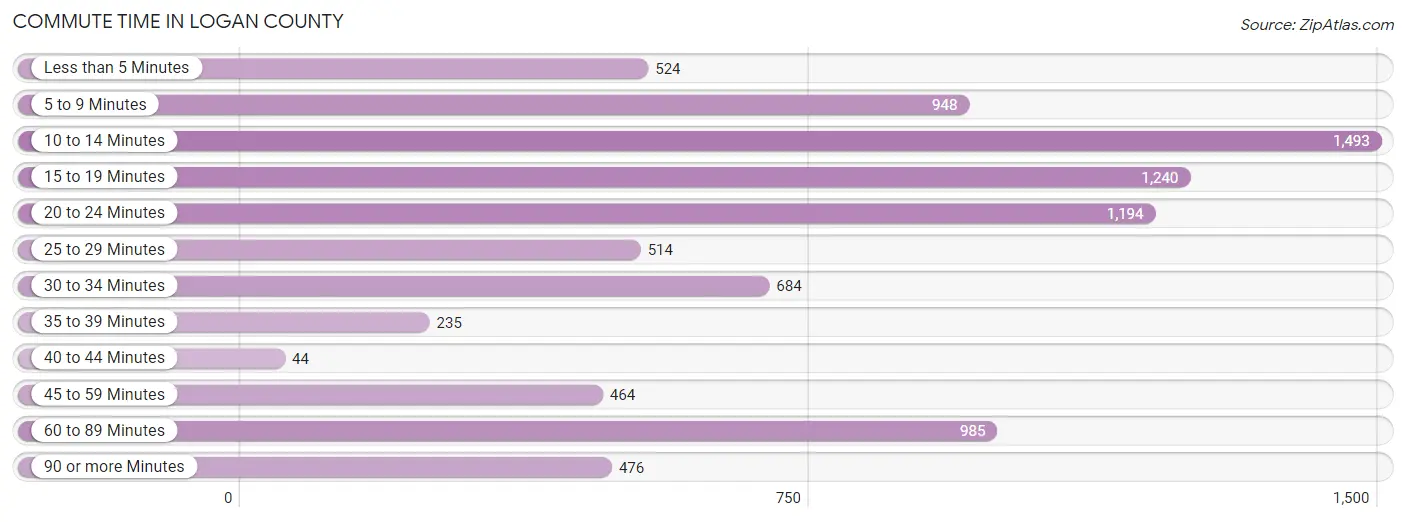
| Commute Time | # Commuters | % Commuters |
| Less than 5 Minutes | 524 | 5.9% |
| 5 to 9 Minutes | 948 | 10.8% |
| 10 to 14 Minutes | 1,493 | 17.0% |
| 15 to 19 Minutes | 1,240 | 14.1% |
| 20 to 24 Minutes | 1,194 | 13.6% |
| 25 to 29 Minutes | 514 | 5.8% |
| 30 to 34 Minutes | 684 | 7.8% |
| 35 to 39 Minutes | 235 | 2.7% |
| 40 to 44 Minutes | 44 | 0.5% |
| 45 to 59 Minutes | 464 | 5.3% |
| 60 to 89 Minutes | 985 | 11.2% |
| 90 or more Minutes | 476 | 5.4% |
Commute Time by Sex in Logan County
The most common commute times in Logan County are 10 to 14 minutes (866 commuters, 18.9%) for males and 5 to 9 minutes (702 commuters, 16.7%) for females.
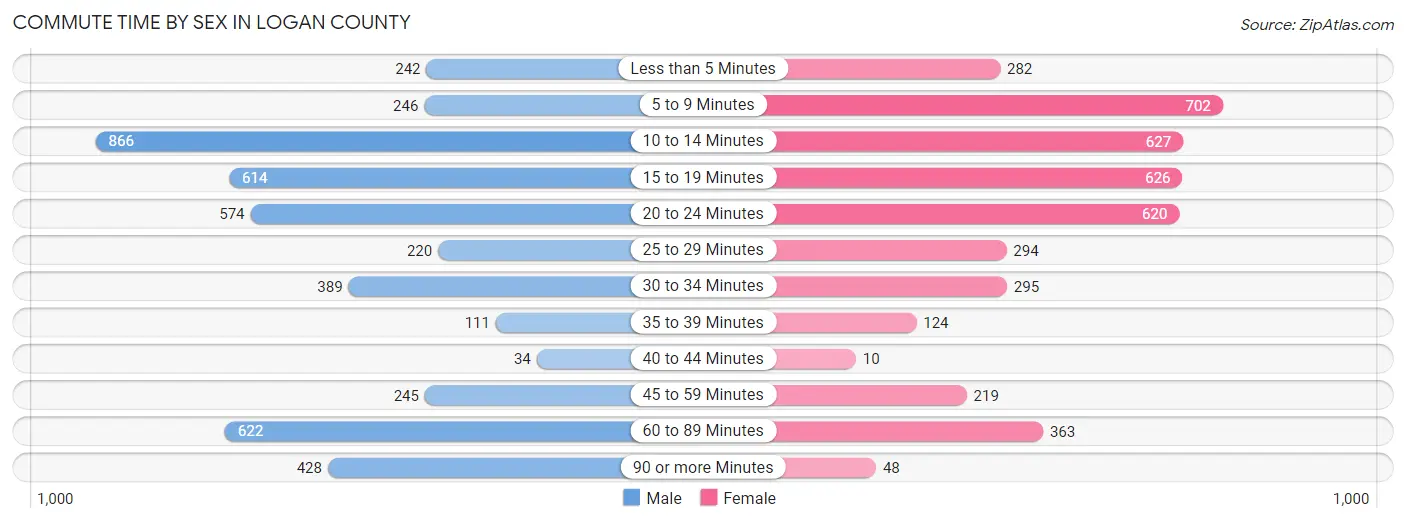
| Commute Time | Male | Female |
| Less than 5 Minutes | 242 (5.3%) | 282 (6.7%) |
| 5 to 9 Minutes | 246 (5.4%) | 702 (16.7%) |
| 10 to 14 Minutes | 866 (18.9%) | 627 (14.9%) |
| 15 to 19 Minutes | 614 (13.4%) | 626 (14.9%) |
| 20 to 24 Minutes | 574 (12.5%) | 620 (14.7%) |
| 25 to 29 Minutes | 220 (4.8%) | 294 (7.0%) |
| 30 to 34 Minutes | 389 (8.5%) | 295 (7.0%) |
| 35 to 39 Minutes | 111 (2.4%) | 124 (2.9%) |
| 40 to 44 Minutes | 34 (0.7%) | 10 (0.2%) |
| 45 to 59 Minutes | 245 (5.3%) | 219 (5.2%) |
| 60 to 89 Minutes | 622 (13.6%) | 363 (8.6%) |
| 90 or more Minutes | 428 (9.3%) | 48 (1.1%) |
Time of Departure to Work by Sex in Logan County
The most frequent times of departure to work in Logan County are 8:00 AM to 8:29 AM (619, 13.5%) for males and 8:00 AM to 8:29 AM (613, 14.6%) for females.
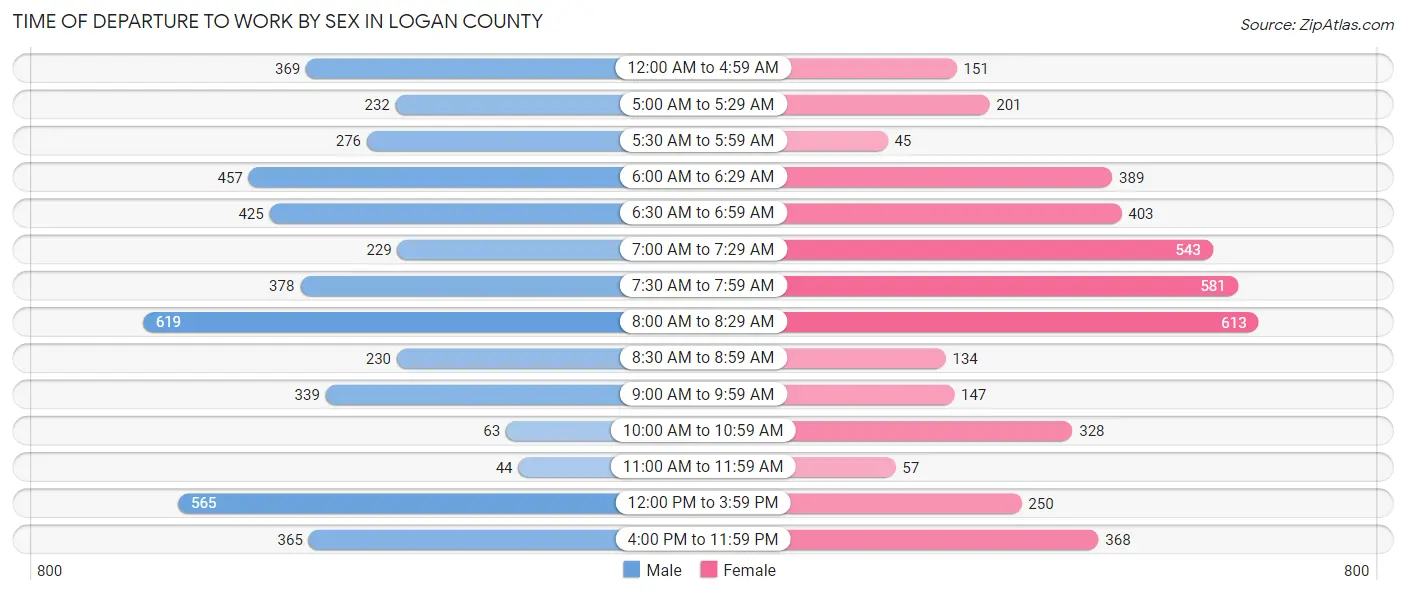
| Time of Departure | Male | Female |
| 12:00 AM to 4:59 AM | 369 (8.0%) | 151 (3.6%) |
| 5:00 AM to 5:29 AM | 232 (5.1%) | 201 (4.8%) |
| 5:30 AM to 5:59 AM | 276 (6.0%) | 45 (1.1%) |
| 6:00 AM to 6:29 AM | 457 (10.0%) | 389 (9.2%) |
| 6:30 AM to 6:59 AM | 425 (9.3%) | 403 (9.6%) |
| 7:00 AM to 7:29 AM | 229 (5.0%) | 543 (12.9%) |
| 7:30 AM to 7:59 AM | 378 (8.2%) | 581 (13.8%) |
| 8:00 AM to 8:29 AM | 619 (13.5%) | 613 (14.6%) |
| 8:30 AM to 8:59 AM | 230 (5.0%) | 134 (3.2%) |
| 9:00 AM to 9:59 AM | 339 (7.4%) | 147 (3.5%) |
| 10:00 AM to 10:59 AM | 63 (1.4%) | 328 (7.8%) |
| 11:00 AM to 11:59 AM | 44 (1.0%) | 57 (1.3%) |
| 12:00 PM to 3:59 PM | 565 (12.3%) | 250 (5.9%) |
| 4:00 PM to 11:59 PM | 365 (8.0%) | 368 (8.7%) |
| Total | 4,591 (100.0%) | 4,210 (100.0%) |
Housing Occupancy in Logan County
Occupancy by Ownership in Logan County
Of the total 12,375 dwellings in Logan County, owner-occupied units account for 9,370 (75.7%), while renter-occupied units make up 3,005 (24.3%).
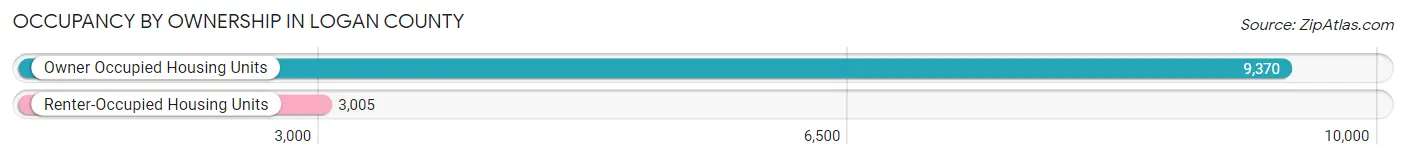
| Occupancy | # Housing Units | % Housing Units |
| Owner Occupied Housing Units | 9,370 | 75.7% |
| Renter-Occupied Housing Units | 3,005 | 24.3% |
| Total Occupied Housing Units | 12,375 | 100.0% |
Occupancy by Household Size in Logan County
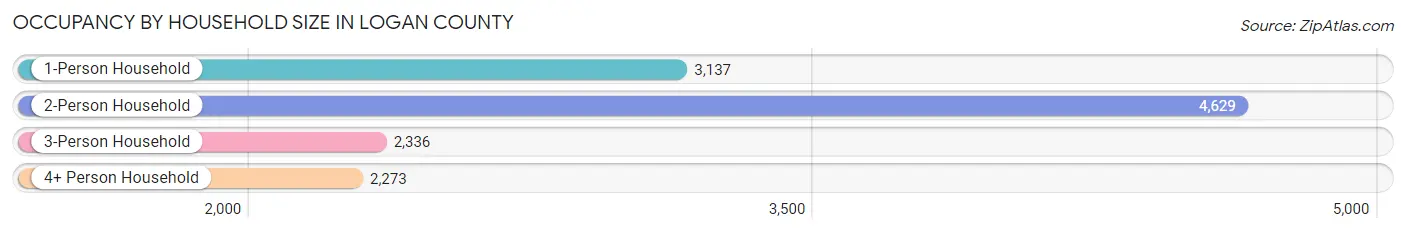
| Household Size | # Housing Units | % Housing Units |
| 1-Person Household | 3,137 | 25.4% |
| 2-Person Household | 4,629 | 37.4% |
| 3-Person Household | 2,336 | 18.9% |
| 4+ Person Household | 2,273 | 18.4% |
| Total Housing Units | 12,375 | 100.0% |
Occupancy by Ownership by Household Size in Logan County
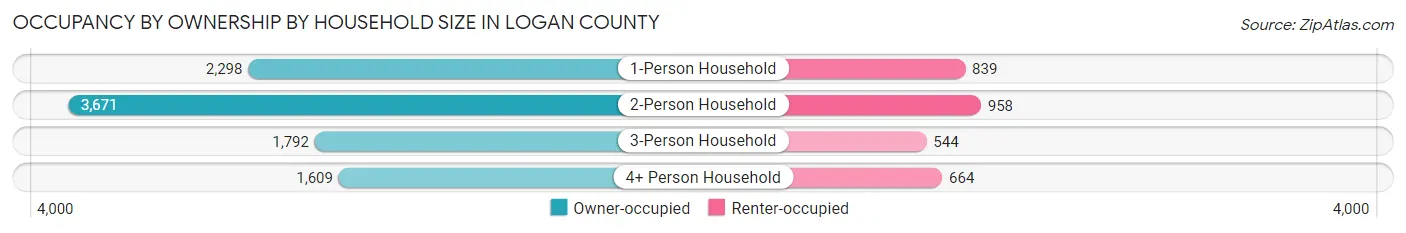
| Household Size | Owner-occupied | Renter-occupied |
| 1-Person Household | 2,298 (73.3%) | 839 (26.8%) |
| 2-Person Household | 3,671 (79.3%) | 958 (20.7%) |
| 3-Person Household | 1,792 (76.7%) | 544 (23.3%) |
| 4+ Person Household | 1,609 (70.8%) | 664 (29.2%) |
| Total Housing Units | 9,370 (75.7%) | 3,005 (24.3%) |
Occupancy by Educational Attainment in Logan County
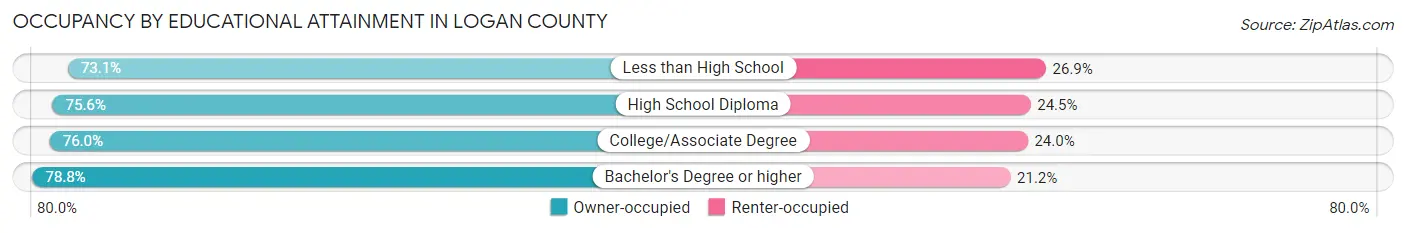
| Household Size | Owner-occupied | Renter-occupied |
| Less than High School | 1,692 (73.1%) | 622 (26.9%) |
| High School Diploma | 3,841 (75.5%) | 1,243 (24.4%) |
| College/Associate Degree | 2,283 (76.0%) | 721 (24.0%) |
| Bachelor's Degree or higher | 1,554 (78.8%) | 419 (21.2%) |
Occupancy by Age of Householder in Logan County
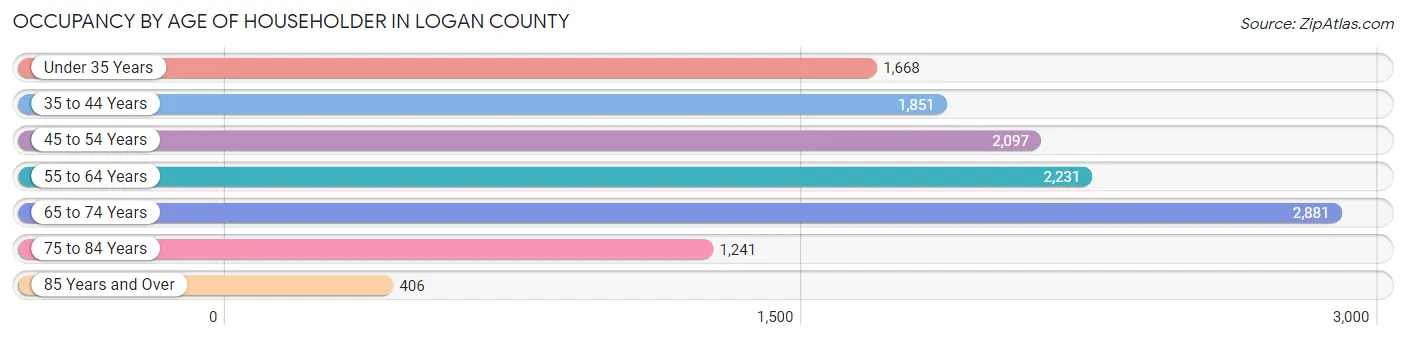
| Age Bracket | # Households | % Households |
| Under 35 Years | 1,668 | 13.5% |
| 35 to 44 Years | 1,851 | 15.0% |
| 45 to 54 Years | 2,097 | 17.0% |
| 55 to 64 Years | 2,231 | 18.0% |
| 65 to 74 Years | 2,881 | 23.3% |
| 75 to 84 Years | 1,241 | 10.0% |
| 85 Years and Over | 406 | 3.3% |
| Total | 12,375 | 100.0% |
Housing Finances in Logan County
Median Income by Occupancy in Logan County
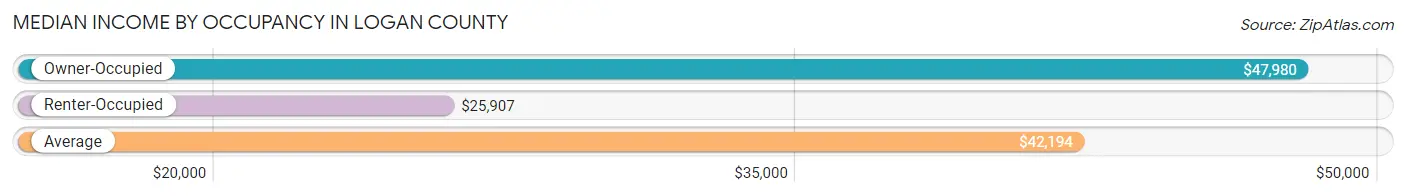
| Occupancy Type | # Households | Median Income |
| Owner-Occupied | 9,370 (75.7%) | $47,980 |
| Renter-Occupied | 3,005 (24.3%) | $25,907 |
| Average | 12,375 (100.0%) | $42,194 |
Occupancy by Householder Income Bracket in Logan County
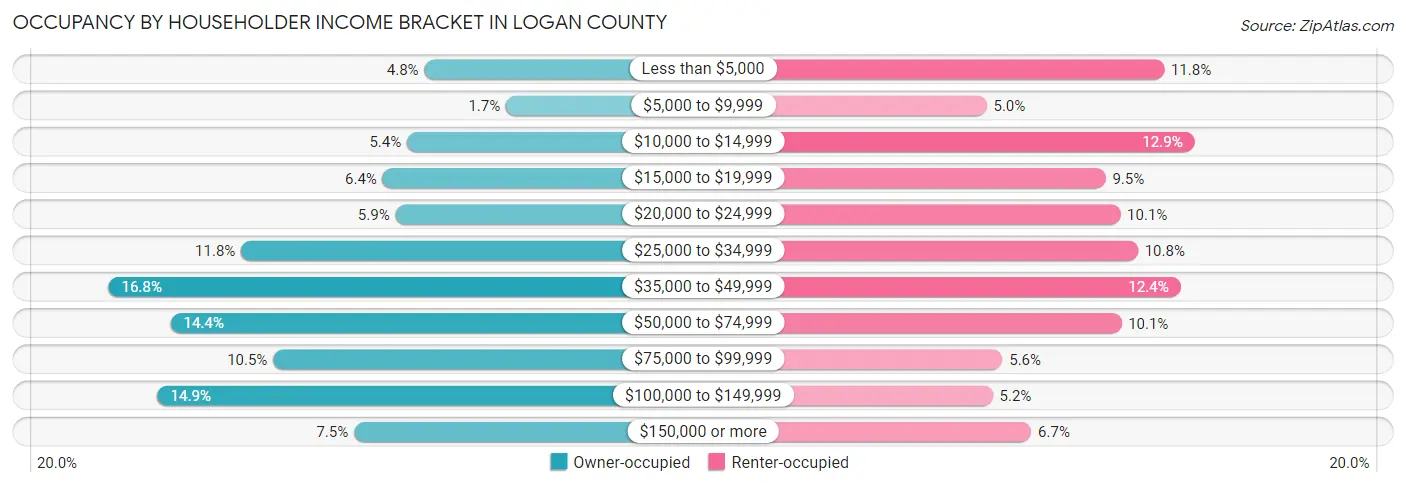
| Income Bracket | Owner-occupied | Renter-occupied |
| Less than $5,000 | 447 (4.8%) | 353 (11.7%) |
| $5,000 to $9,999 | 156 (1.7%) | 150 (5.0%) |
| $10,000 to $14,999 | 509 (5.4%) | 388 (12.9%) |
| $15,000 to $19,999 | 596 (6.4%) | 286 (9.5%) |
| $20,000 to $24,999 | 550 (5.9%) | 303 (10.1%) |
| $25,000 to $34,999 | 1,101 (11.7%) | 323 (10.7%) |
| $35,000 to $49,999 | 1,574 (16.8%) | 372 (12.4%) |
| $50,000 to $74,999 | 1,353 (14.4%) | 304 (10.1%) |
| $75,000 to $99,999 | 987 (10.5%) | 168 (5.6%) |
| $100,000 to $149,999 | 1,399 (14.9%) | 157 (5.2%) |
| $150,000 or more | 698 (7.4%) | 201 (6.7%) |
| Total | 9,370 (100.0%) | 3,005 (100.0%) |
Monthly Housing Cost Tiers in Logan County
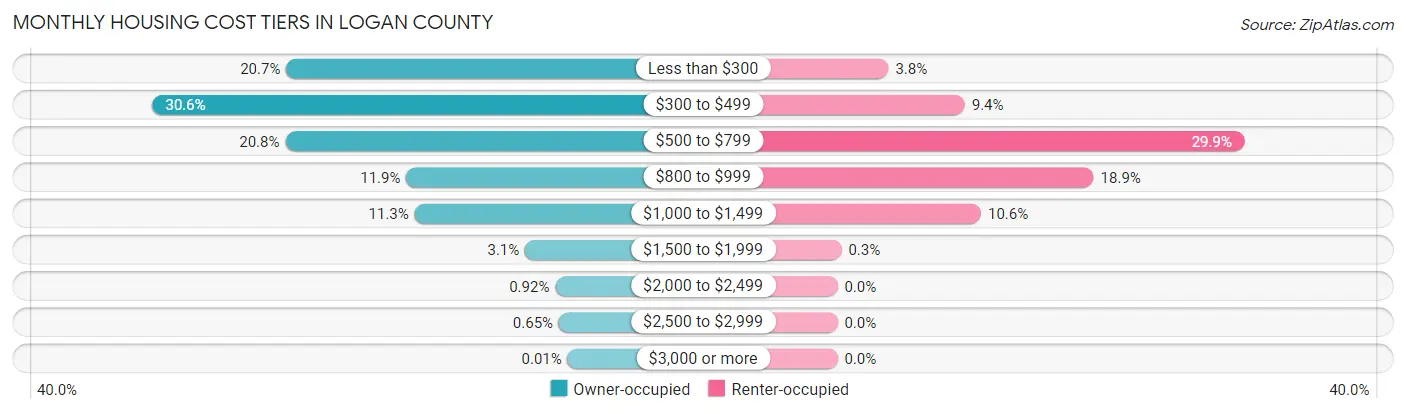
| Monthly Cost | Owner-occupied | Renter-occupied |
| Less than $300 | 1,942 (20.7%) | 113 (3.8%) |
| $300 to $499 | 2,866 (30.6%) | 282 (9.4%) |
| $500 to $799 | 1,949 (20.8%) | 899 (29.9%) |
| $800 to $999 | 1,114 (11.9%) | 567 (18.9%) |
| $1,000 to $1,499 | 1,057 (11.3%) | 318 (10.6%) |
| $1,500 to $1,999 | 294 (3.1%) | 9 (0.3%) |
| $2,000 to $2,499 | 86 (0.9%) | 0 (0.0%) |
| $2,500 to $2,999 | 61 (0.6%) | 0 (0.0%) |
| $3,000 or more | 1 (0.0%) | 0 (0.0%) |
| Total | 9,370 (100.0%) | 3,005 (100.0%) |
Physical Housing Characteristics in Logan County
Housing Structures in Logan County
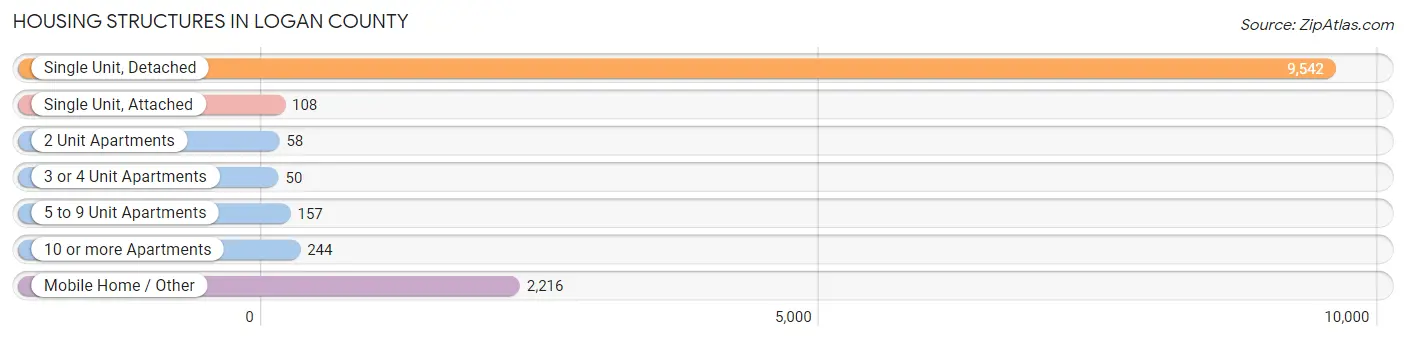
| Structure Type | # Housing Units | % Housing Units |
| Single Unit, Detached | 9,542 | 77.1% |
| Single Unit, Attached | 108 | 0.9% |
| 2 Unit Apartments | 58 | 0.5% |
| 3 or 4 Unit Apartments | 50 | 0.4% |
| 5 to 9 Unit Apartments | 157 | 1.3% |
| 10 or more Apartments | 244 | 2.0% |
| Mobile Home / Other | 2,216 | 17.9% |
| Total | 12,375 | 100.0% |
Housing Structures by Occupancy in Logan County
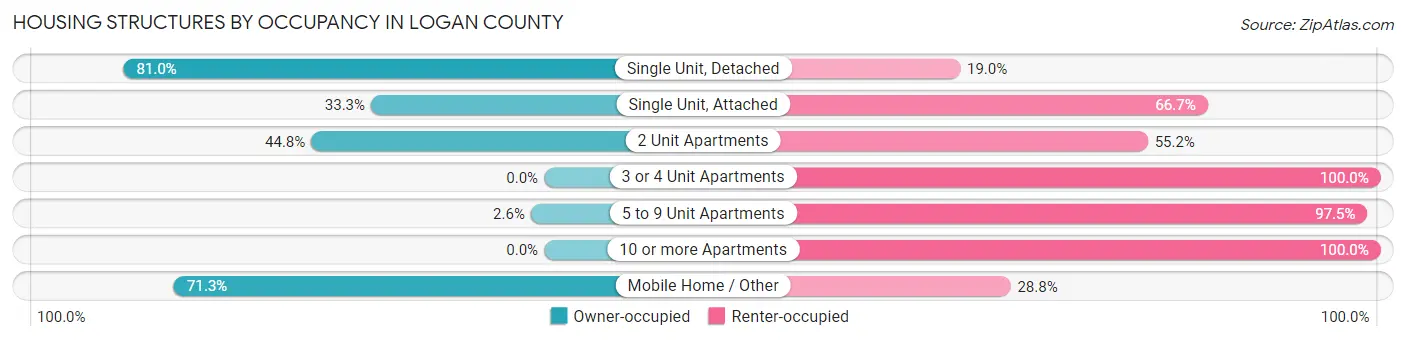
| Structure Type | Owner-occupied | Renter-occupied |
| Single Unit, Detached | 7,725 (81.0%) | 1,817 (19.0%) |
| Single Unit, Attached | 36 (33.3%) | 72 (66.7%) |
| 2 Unit Apartments | 26 (44.8%) | 32 (55.2%) |
| 3 or 4 Unit Apartments | 0 (0.0%) | 50 (100.0%) |
| 5 to 9 Unit Apartments | 4 (2.5%) | 153 (97.5%) |
| 10 or more Apartments | 0 (0.0%) | 244 (100.0%) |
| Mobile Home / Other | 1,579 (71.3%) | 637 (28.7%) |
| Total | 9,370 (75.7%) | 3,005 (24.3%) |
Housing Structures by Number of Rooms in Logan County
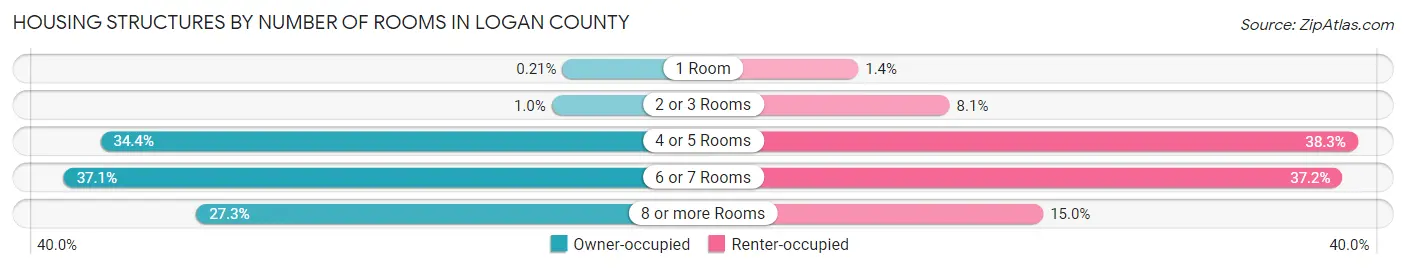
| Number of Rooms | Owner-occupied | Renter-occupied |
| 1 Room | 20 (0.2%) | 41 (1.4%) |
| 2 or 3 Rooms | 95 (1.0%) | 244 (8.1%) |
| 4 or 5 Rooms | 3,221 (34.4%) | 1,151 (38.3%) |
| 6 or 7 Rooms | 3,476 (37.1%) | 1,117 (37.2%) |
| 8 or more Rooms | 2,558 (27.3%) | 452 (15.0%) |
| Total | 9,370 (100.0%) | 3,005 (100.0%) |
Housing Structure by Heating Type in Logan County
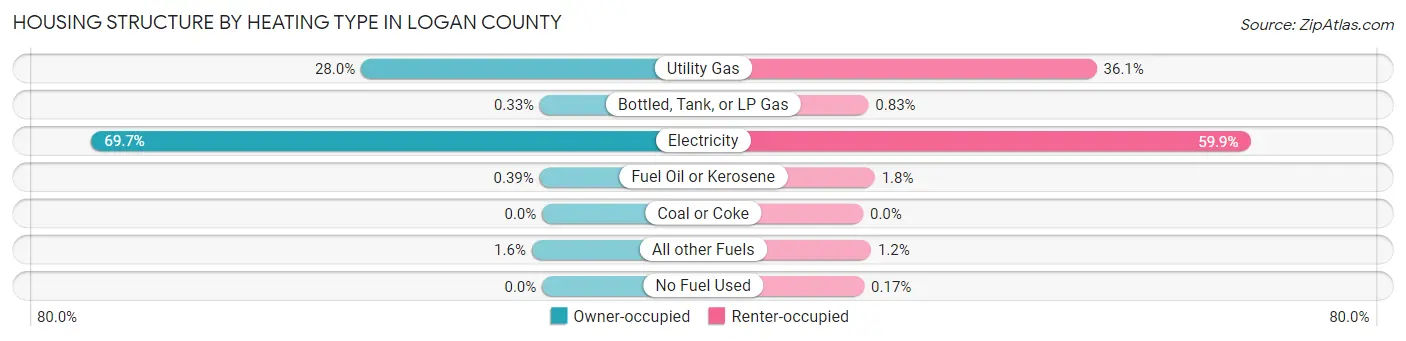
| Heating Type | Owner-occupied | Renter-occupied |
| Utility Gas | 2,624 (28.0%) | 1,085 (36.1%) |
| Bottled, Tank, or LP Gas | 31 (0.3%) | 25 (0.8%) |
| Electricity | 6,528 (69.7%) | 1,799 (59.9%) |
| Fuel Oil or Kerosene | 37 (0.4%) | 54 (1.8%) |
| Coal or Coke | 0 (0.0%) | 0 (0.0%) |
| All other Fuels | 150 (1.6%) | 37 (1.2%) |
| No Fuel Used | 0 (0.0%) | 5 (0.2%) |
| Total | 9,370 (100.0%) | 3,005 (100.0%) |
Household Vehicle Usage in Logan County
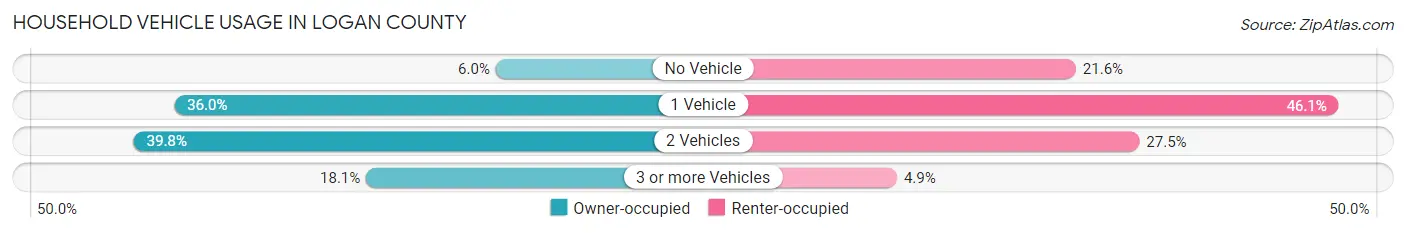
| Vehicles per Household | Owner-occupied | Renter-occupied |
| No Vehicle | 564 (6.0%) | 648 (21.6%) |
| 1 Vehicle | 3,377 (36.0%) | 1,385 (46.1%) |
| 2 Vehicles | 3,731 (39.8%) | 826 (27.5%) |
| 3 or more Vehicles | 1,698 (18.1%) | 146 (4.9%) |
| Total | 9,370 (100.0%) | 3,005 (100.0%) |
Real Estate & Mortgages in Logan County
Real Estate and Mortgage Overview in Logan County
| Characteristic | Without Mortgage | With Mortgage |
| Housing Units | 6,312 | 3,058 |
| Median Property Value | $94,300 | $118,200 |
| Median Household Income | $44,438 | $363 |
| Monthly Housing Costs | $366 | $0 |
| Real Estate Taxes | $508 | $225 |
Property Value by Mortgage Status in Logan County
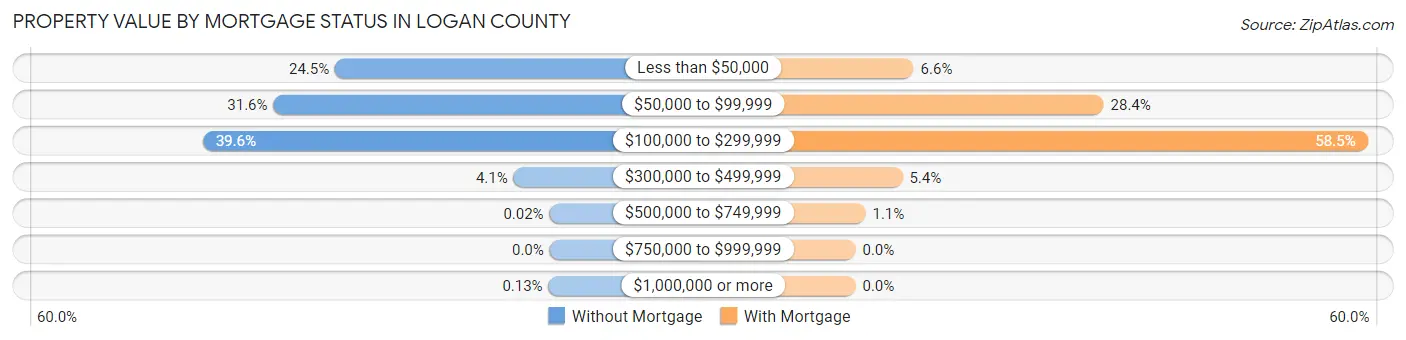
| Property Value | Without Mortgage | With Mortgage |
| Less than $50,000 | 1,548 (24.5%) | 203 (6.6%) |
| $50,000 to $99,999 | 1,993 (31.6%) | 867 (28.3%) |
| $100,000 to $299,999 | 2,502 (39.6%) | 1,789 (58.5%) |
| $300,000 to $499,999 | 260 (4.1%) | 164 (5.4%) |
| $500,000 to $749,999 | 1 (0.0%) | 35 (1.1%) |
| $750,000 to $999,999 | 0 (0.0%) | 0 (0.0%) |
| $1,000,000 or more | 8 (0.1%) | 0 (0.0%) |
| Total | 6,312 (100.0%) | 3,058 (100.0%) |
Household Income by Mortgage Status in Logan County
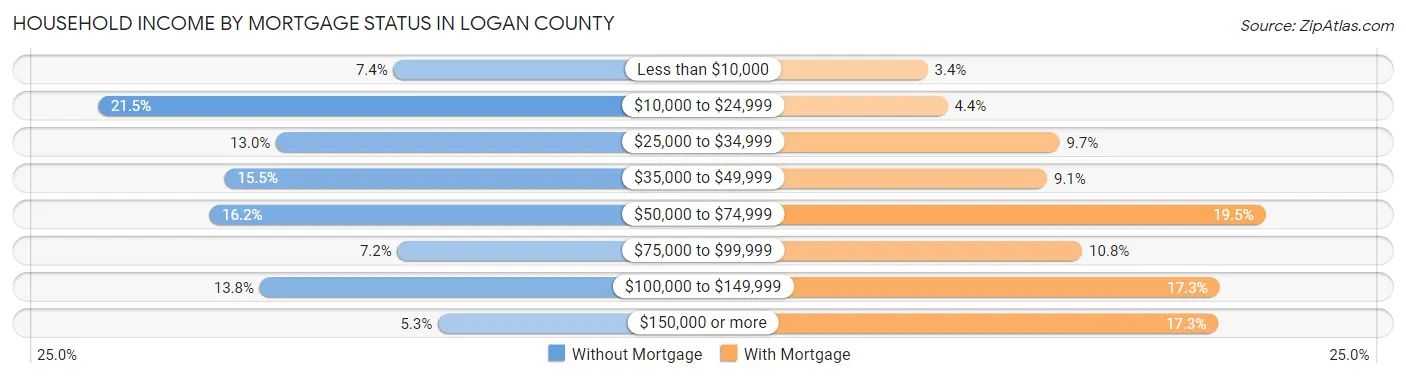
| Household Income | Without Mortgage | With Mortgage |
| Less than $10,000 | 469 (7.4%) | 105 (3.4%) |
| $10,000 to $24,999 | 1,358 (21.5%) | 134 (4.4%) |
| $25,000 to $34,999 | 822 (13.0%) | 297 (9.7%) |
| $35,000 to $49,999 | 977 (15.5%) | 279 (9.1%) |
| $50,000 to $74,999 | 1,023 (16.2%) | 597 (19.5%) |
| $75,000 to $99,999 | 457 (7.2%) | 330 (10.8%) |
| $100,000 to $149,999 | 871 (13.8%) | 530 (17.3%) |
| $150,000 or more | 335 (5.3%) | 528 (17.3%) |
| Total | 6,312 (100.0%) | 3,058 (100.0%) |
Property Value to Household Income Ratio in Logan County
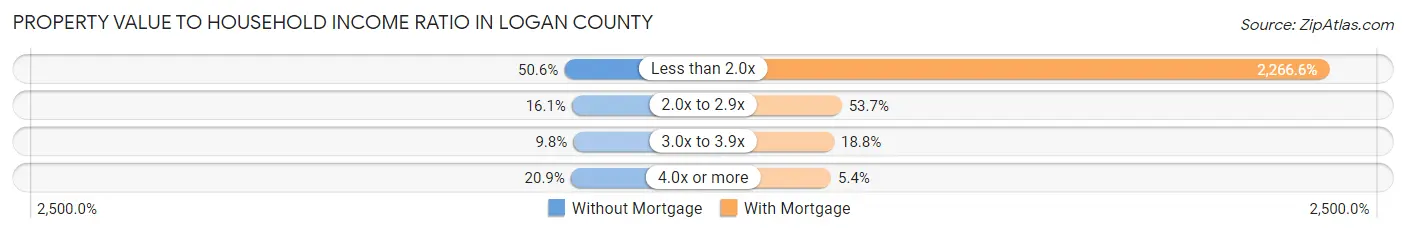
| Value-to-Income Ratio | Without Mortgage | With Mortgage |
| Less than 2.0x | 3,196 (50.6%) | 69,314 (2,266.6%) |
| 2.0x to 2.9x | 1,016 (16.1%) | 1,643 (53.7%) |
| 3.0x to 3.9x | 621 (9.8%) | 576 (18.8%) |
| 4.0x or more | 1,319 (20.9%) | 166 (5.4%) |
| Total | 6,312 (100.0%) | 3,058 (100.0%) |
Real Estate Taxes by Mortgage Status in Logan County
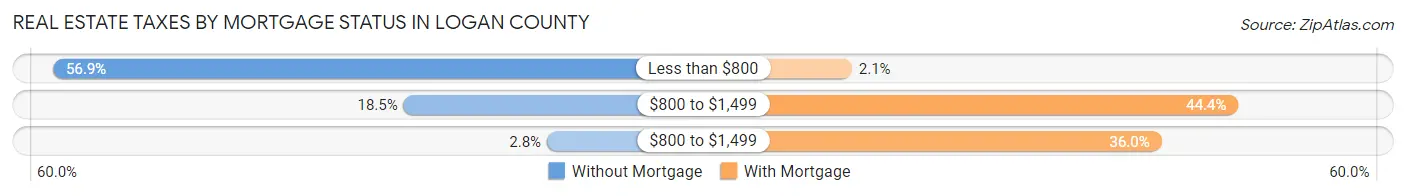
| Property Taxes | Without Mortgage | With Mortgage |
| Less than $800 | 3,591 (56.9%) | 63 (2.1%) |
| $800 to $1,499 | 1,166 (18.5%) | 1,358 (44.4%) |
| $800 to $1,499 | 174 (2.8%) | 1,101 (36.0%) |
| Total | 6,312 (100.0%) | 3,058 (100.0%) |
Health & Disability in Logan County
Health Insurance Coverage by Age in Logan County
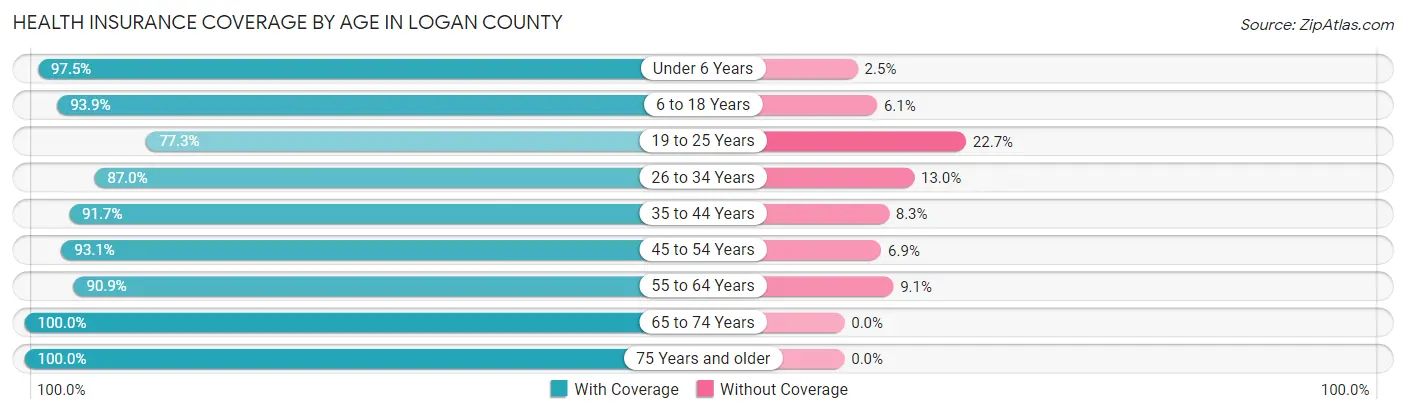
| Age Bracket | With Coverage | Without Coverage |
| Under 6 Years | 1,723 (97.5%) | 44 (2.5%) |
| 6 to 18 Years | 4,949 (93.9%) | 321 (6.1%) |
| 19 to 25 Years | 1,885 (77.3%) | 553 (22.7%) |
| 26 to 34 Years | 2,589 (87.0%) | 387 (13.0%) |
| 35 to 44 Years | 3,531 (91.7%) | 319 (8.3%) |
| 45 to 54 Years | 3,888 (93.1%) | 287 (6.9%) |
| 55 to 64 Years | 3,997 (90.9%) | 401 (9.1%) |
| 65 to 74 Years | 4,276 (100.0%) | 0 (0.0%) |
| 75 Years and older | 2,506 (100.0%) | 0 (0.0%) |
| Total | 29,344 (92.7%) | 2,312 (7.3%) |
Health Insurance Coverage by Citizenship Status in Logan County
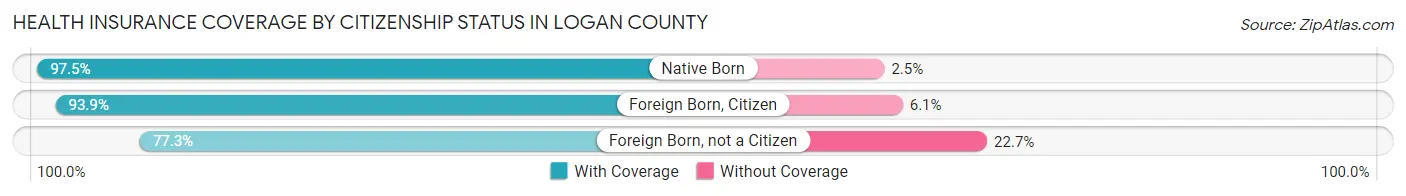
| Citizenship Status | With Coverage | Without Coverage |
| Native Born | 1,723 (97.5%) | 44 (2.5%) |
| Foreign Born, Citizen | 4,949 (93.9%) | 321 (6.1%) |
| Foreign Born, not a Citizen | 1,885 (77.3%) | 553 (22.7%) |
Health Insurance Coverage by Household Income in Logan County
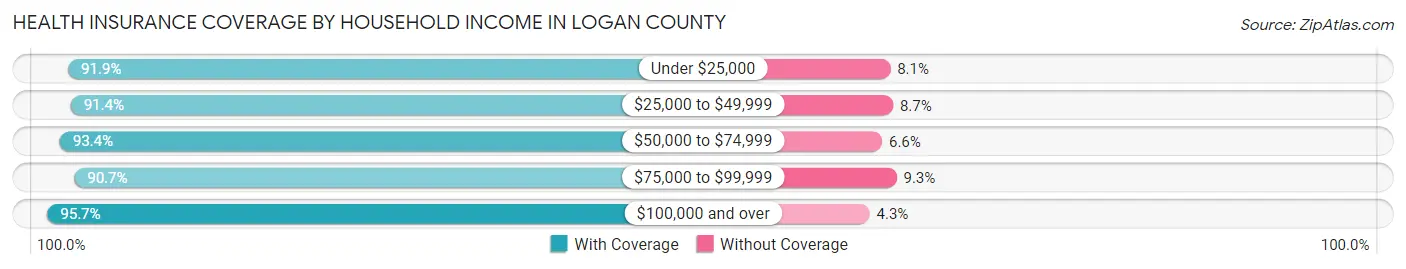
| Household Income | With Coverage | Without Coverage |
| Under $25,000 | 6,797 (91.9%) | 602 (8.1%) |
| $25,000 to $49,999 | 8,436 (91.3%) | 799 (8.6%) |
| $50,000 to $74,999 | 4,021 (93.4%) | 284 (6.6%) |
| $75,000 to $99,999 | 2,969 (90.7%) | 305 (9.3%) |
| $100,000 and over | 7,088 (95.7%) | 316 (4.3%) |
Public vs Private Health Insurance Coverage by Age in Logan County
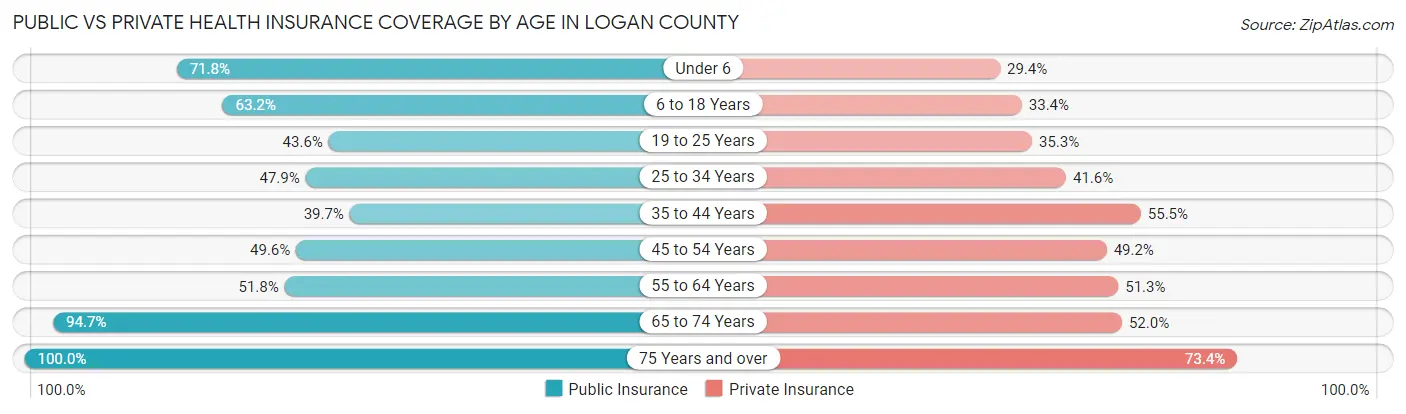
| Age Bracket | Public Insurance | Private Insurance |
| Under 6 | 1,268 (71.8%) | 519 (29.4%) |
| 6 to 18 Years | 3,333 (63.2%) | 1,761 (33.4%) |
| 19 to 25 Years | 1,062 (43.6%) | 861 (35.3%) |
| 25 to 34 Years | 1,424 (47.8%) | 1,239 (41.6%) |
| 35 to 44 Years | 1,527 (39.7%) | 2,137 (55.5%) |
| 45 to 54 Years | 2,071 (49.6%) | 2,053 (49.2%) |
| 55 to 64 Years | 2,276 (51.7%) | 2,257 (51.3%) |
| 65 to 74 Years | 4,049 (94.7%) | 2,224 (52.0%) |
| 75 Years and over | 2,506 (100.0%) | 1,839 (73.4%) |
| Total | 19,516 (61.7%) | 14,890 (47.0%) |
Disability Status by Sex by Age in Logan County
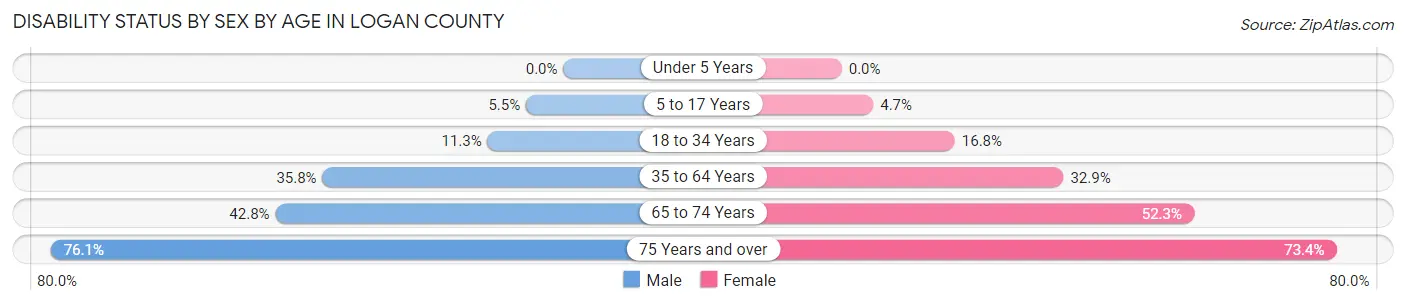
| Age Bracket | Male | Female |
| Under 5 Years | 0 (0.0%) | 0 (0.0%) |
| 5 to 17 Years | 148 (5.5%) | 110 (4.7%) |
| 18 to 34 Years | 338 (11.3%) | 469 (16.8%) |
| 35 to 64 Years | 2,175 (35.8%) | 2,088 (32.9%) |
| 65 to 74 Years | 853 (42.8%) | 1,192 (52.3%) |
| 75 Years and over | 765 (76.1%) | 1,102 (73.4%) |
Disability Class by Sex by Age in Logan County
Disability Class: Hearing Difficulty
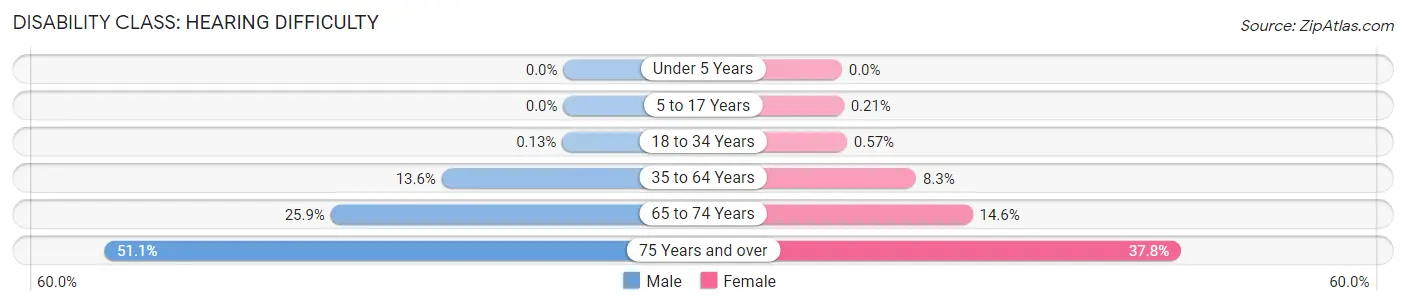
| Age Bracket | Male | Female |
| Under 5 Years | 0 (0.0%) | 0 (0.0%) |
| 5 to 17 Years | 0 (0.0%) | 5 (0.2%) |
| 18 to 34 Years | 4 (0.1%) | 16 (0.6%) |
| 35 to 64 Years | 824 (13.6%) | 524 (8.3%) |
| 65 to 74 Years | 517 (25.9%) | 332 (14.6%) |
| 75 Years and over | 514 (51.1%) | 567 (37.8%) |
Disability Class: Vision Difficulty
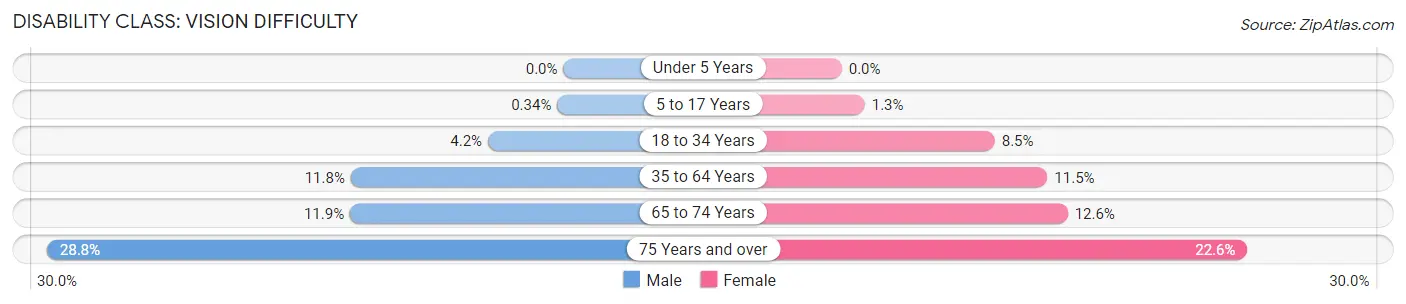
| Age Bracket | Male | Female |
| Under 5 Years | 0 (0.0%) | 0 (0.0%) |
| 5 to 17 Years | 9 (0.3%) | 30 (1.3%) |
| 18 to 34 Years | 126 (4.2%) | 238 (8.5%) |
| 35 to 64 Years | 720 (11.8%) | 726 (11.5%) |
| 65 to 74 Years | 237 (11.9%) | 287 (12.6%) |
| 75 Years and over | 289 (28.8%) | 339 (22.6%) |
Disability Class: Cognitive Difficulty
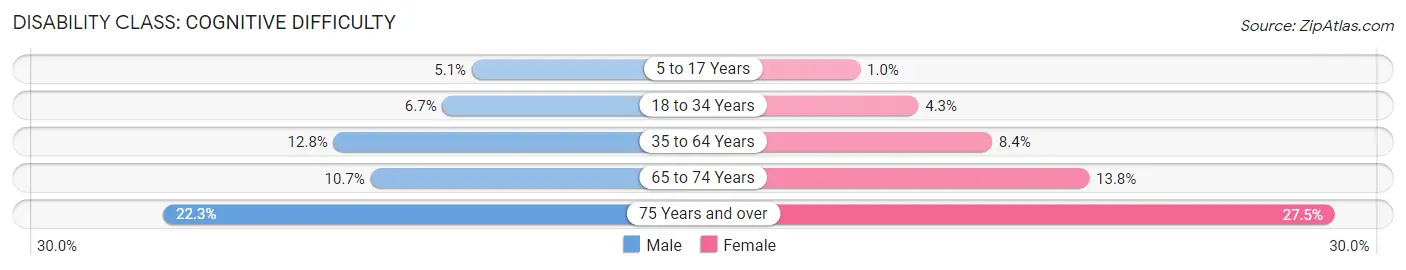
| Age Bracket | Male | Female |
| 5 to 17 Years | 136 (5.1%) | 24 (1.0%) |
| 18 to 34 Years | 202 (6.7%) | 119 (4.3%) |
| 35 to 64 Years | 778 (12.8%) | 530 (8.4%) |
| 65 to 74 Years | 214 (10.7%) | 314 (13.8%) |
| 75 Years and over | 224 (22.3%) | 412 (27.5%) |
Disability Class: Ambulatory Difficulty
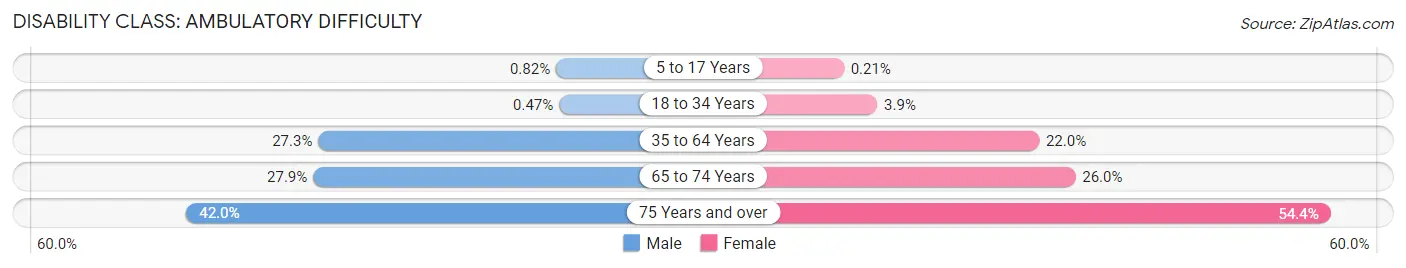
| Age Bracket | Male | Female |
| 5 to 17 Years | 22 (0.8%) | 5 (0.2%) |
| 18 to 34 Years | 14 (0.5%) | 110 (3.9%) |
| 35 to 64 Years | 1,660 (27.3%) | 1,393 (22.0%) |
| 65 to 74 Years | 556 (27.9%) | 593 (26.0%) |
| 75 Years and over | 422 (42.0%) | 817 (54.4%) |
Disability Class: Self-Care Difficulty
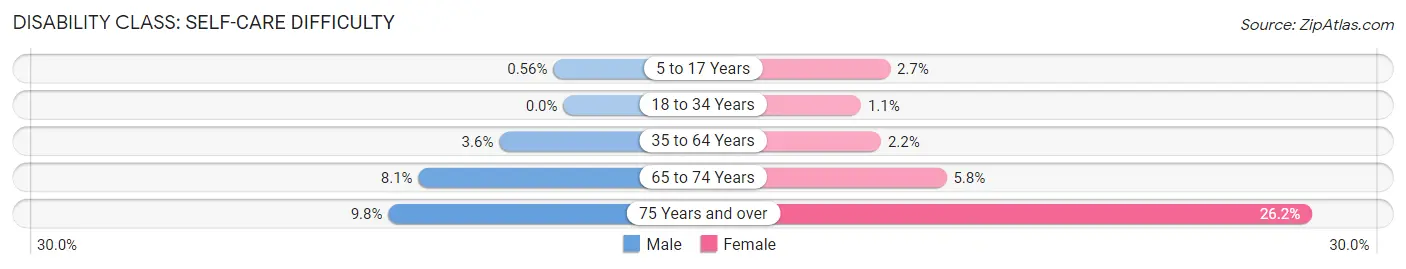
| Age Bracket | Male | Female |
| 5 to 17 Years | 15 (0.6%) | 63 (2.7%) |
| 18 to 34 Years | 0 (0.0%) | 30 (1.1%) |
| 35 to 64 Years | 217 (3.6%) | 138 (2.2%) |
| 65 to 74 Years | 161 (8.1%) | 133 (5.8%) |
| 75 Years and over | 98 (9.8%) | 393 (26.2%) |
Technology Access in Logan County
Computing Device Access in Logan County
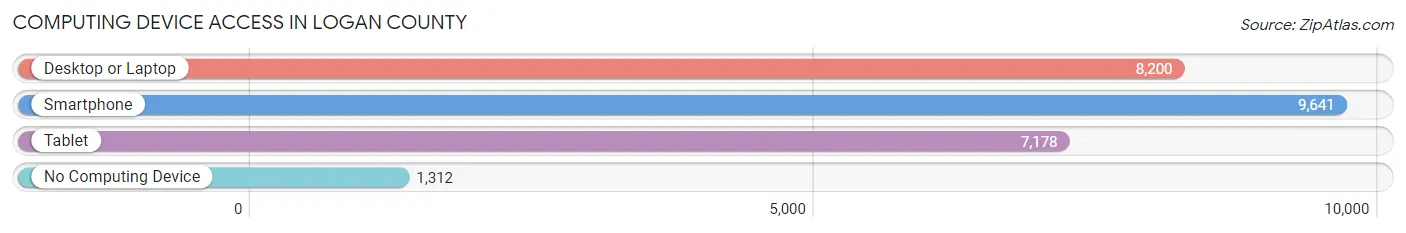
| Device Type | # Households | % Households |
| Desktop or Laptop | 8,200 | 66.3% |
| Smartphone | 9,641 | 77.9% |
| Tablet | 7,178 | 58.0% |
| No Computing Device | 1,312 | 10.6% |
| Total | 12,375 | 100.0% |
Internet Access in Logan County
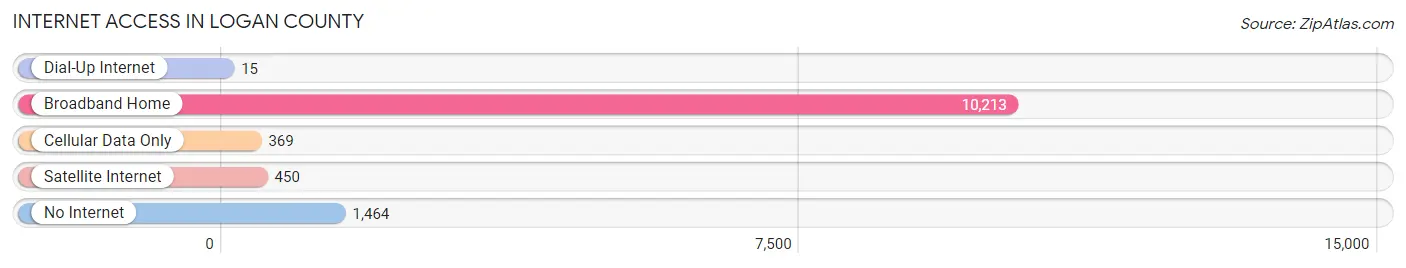
| Internet Type | # Households | % Households |
| Dial-Up Internet | 15 | 0.1% |
| Broadband Home | 10,213 | 82.5% |
| Cellular Data Only | 369 | 3.0% |
| Satellite Internet | 450 | 3.6% |
| No Internet | 1,464 | 11.8% |
| Total | 12,375 | 100.0% |
Logan County Summary
Logan County, West Virginia is located in the southwestern part of the state and is part of the Appalachian region. It is bordered by Boone, Mingo, and Wyoming counties to the north, McDowell and Mercer counties to the east, and Mingo and Lincoln counties to the south. The county seat is Logan, and the largest city is Man. The county was created in 1824 from parts of Cabell, Giles, and Kanawha counties and was named for Chief Logan of the Mingo tribe.
Geography
Logan County is located in the Appalachian Mountains and is part of the Allegheny Plateau. The county is mostly mountainous, with the highest point being Big Ugly Mountain at 3,890 feet. The Guyandotte River runs through the county, and there are several smaller creeks and streams. The county is mostly forested, with the majority of the land being used for timber production.
Economy
Logan County has a diverse economy, with the largest industries being coal mining, timber, and tourism. Coal mining has been a major industry in the county since the late 19th century, and it is still a major employer. The county is home to several large coal companies, including Alpha Natural Resources, Arch Coal, and Patriot Coal. Timber is also an important industry in the county, with several large timber companies operating in the area. Tourism is also a major industry in the county, with several popular attractions, such as Chief Logan State Park, Hatfield-McCoy Trails, and the Hatfield-McCoy Reunion.
Demographics
As of the 2010 census, Logan County had a population of 36,743. The population is mostly white (94.3%), with small percentages of African Americans (3.2%), Native Americans (0.5%), Asians (0.3%), and other races (1.7%). The median household income is $30,945, and the median age is 41.7. The county has a poverty rate of 19.3%, and the unemployment rate is 8.2%.
Conclusion
Logan County, West Virginia is a rural county located in the Appalachian Mountains. It has a diverse economy, with the largest industries being coal mining, timber, and tourism. The population is mostly white, with a median household income of $30,945 and a poverty rate of 19.3%. The county is home to several popular attractions, such as Chief Logan State Park, Hatfield-McCoy Trails, and the Hatfield-McCoy Reunion.
Common Questions
What is the Total Population of Logan County?
Total Population of Logan County is 32,350.
What is the Total Male Population of Logan County?
Total Male Population of Logan County is 16,054.
What is the Total Female Population of Logan County?
Total Female Population of Logan County is 16,296.
What is the Ratio of Males per 100 Females in Logan County?
There are 98.51 Males per 100 Females in Logan County.
What is the Ratio of Females per 100 Males in Logan County?
There are 101.51 Females per 100 Males in Logan County.
What is the Median Population Age in Logan County?
Median Population Age in Logan County is 44.1 Years.
What is the Average Family Size in Logan County
Average Family Size in Logan County is 3.0 People.
What is the Average Household Size in Logan County
Average Household Size in Logan County is 2.5 People.
What is Per Capita Income in Logan County?
Per Capita income in Logan County is $26,111.
What is the Median Family Income in Logan County?
Median Family Income in Logan County is $51,057.
What is the Median Household income in Logan County?
Median Household Income in Logan County is $42,194.
What is Income or Wage Gap in Logan County?
Income or Wage Gap in Logan County is 44.8%.
Women in Logan County earn 55.2 cents for every dollar earned by a man.
What is Family Income Deficit in Logan County?
Family Income Deficit in Logan County is $11,887.
Families that are below poverty line in Logan County earn $11,887 less on average than the poverty threshold level.
What is Inequality or Gini Index in Logan County?
Inequality or Gini Index in Logan County is 0.50.
How Large is the Labor Force in Logan County?
There are 10,983 People in the Labor Forcein in Logan County.
What is the Percentage of People in the Labor Force in Logan County?
41.3% of People are in the Labor Force in Logan County.
What is the Unemployment Rate in Logan County?
Unemployment Rate in Logan County is 13.3%.