Kanawha County, WV
Kanawha County Overview
179,895
TOTAL POPULATION
87,343
MALE POPULATION
92,552
FEMALE POPULATION
94.37
MALES / 100 FEMALES
105.96
FEMALES / 100 MALES
43.6
MEDIAN AGE
2.9
AVG FAMILY SIZE
2.3
AVG HOUSEHOLD SIZE
$34,976
PER CAPITA INCOME
$72,983
AVG FAMILY INCOME
$55,226
AVG HOUSEHOLD INCOME
22.1%
WAGE / INCOME GAP [ % ]
77.9¢/ $1
WAGE / INCOME GAP [ $ ]
$11,005
FAMILY INCOME DEFICIT
0.49
INEQUALITY / GINI INDEX
81,733
LABOR FORCE [ PEOPLE ]
55.1%
PERCENT IN LABOR FORCE
5.4%
UNEMPLOYMENT RATE
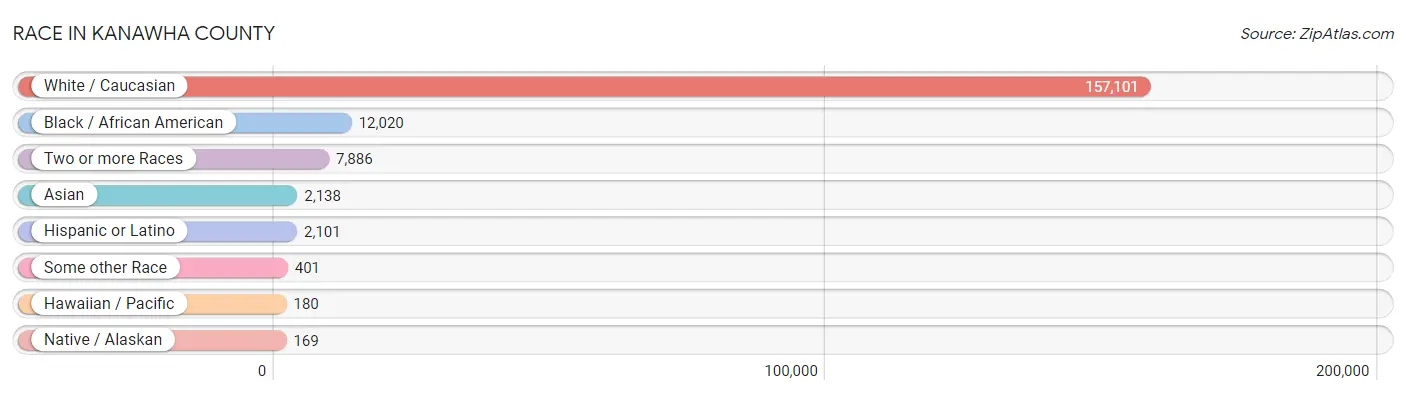
Race in Kanawha County
The most populous races in Kanawha County are White / Caucasian (157,101 | 87.3%), Black / African American (12,020 | 6.7%), and Two or more Races (7,886 | 4.4%).
| Race | # Population | % Population |
| Asian | 2,138 | 1.2% |
| Black / African American | 12,020 | 6.7% |
| Hawaiian / Pacific | 180 | 0.1% |
| Hispanic or Latino | 2,101 | 1.2% |
| Native / Alaskan | 169 | 0.1% |
| White / Caucasian | 157,101 | 87.3% |
| Two or more Races | 7,886 | 4.4% |
| Some other Race | 401 | 0.2% |
| Total | 179,895 | 100.0% |
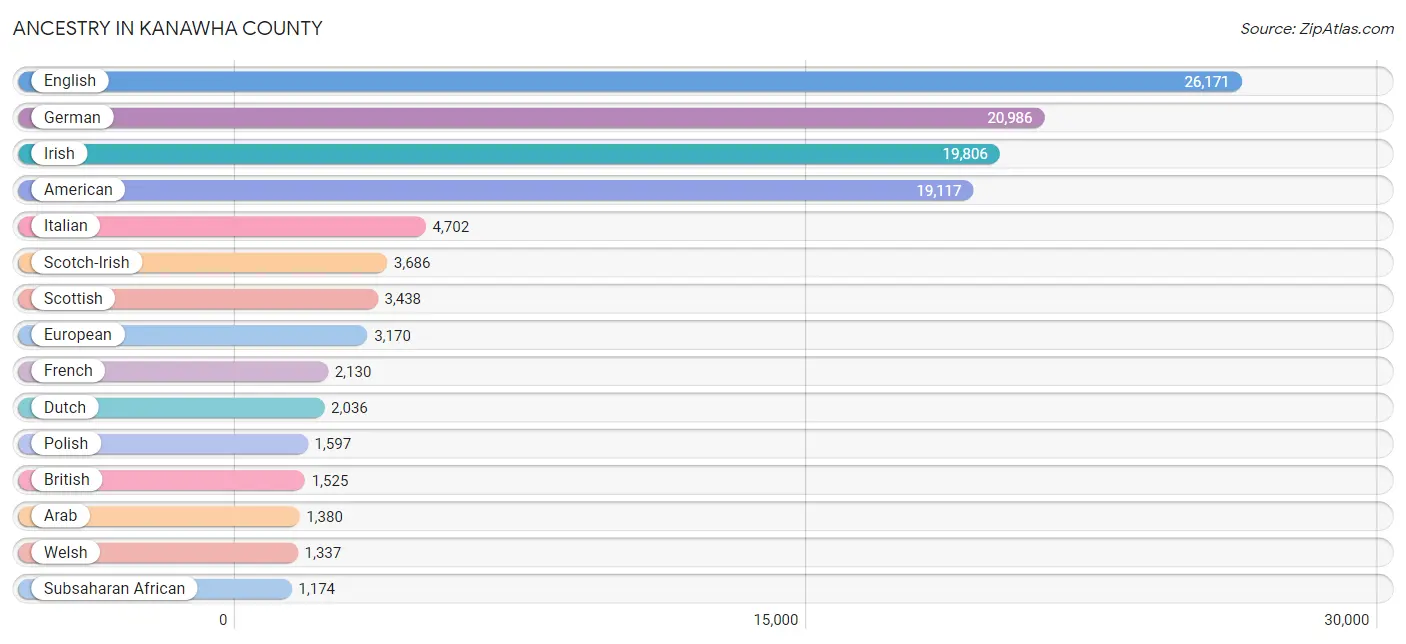
Ancestry in Kanawha County
The most populous ancestries reported in Kanawha County are English (26,171 | 14.5%), German (20,986 | 11.7%), Irish (19,806 | 11.0%), American (19,117 | 10.6%), and Italian (4,702 | 2.6%), together accounting for 50.5% of all Kanawha County residents.
| Ancestry | # Population | % Population |
| African | 689 | 0.4% |
| Alsatian | 9 | 0.0% |
| American | 19,117 | 10.6% |
| Apache | 5 | 0.0% |
| Arab | 1,380 | 0.8% |
| Argentinean | 44 | 0.0% |
| Armenian | 38 | 0.0% |
| Australian | 3 | 0.0% |
| Austrian | 107 | 0.1% |
| Belgian | 138 | 0.1% |
| Bhutanese | 107 | 0.1% |
| Blackfeet | 65 | 0.0% |
| Brazilian | 22 | 0.0% |
| British | 1,525 | 0.9% |
| Bulgarian | 7 | 0.0% |
| Burmese | 468 | 0.3% |
| Cajun | 10 | 0.0% |
| Canadian | 209 | 0.1% |
| Celtic | 390 | 0.2% |
| Central American | 249 | 0.1% |
| Cherokee | 494 | 0.3% |
| Chippewa | 14 | 0.0% |
| Colombian | 39 | 0.0% |
| Costa Rican | 10 | 0.0% |
| Creek | 21 | 0.0% |
| Croatian | 63 | 0.0% |
| Cuban | 106 | 0.1% |
| Cypriot | 28 | 0.0% |
| Czech | 401 | 0.2% |
| Czechoslovakian | 39 | 0.0% |
| Danish | 220 | 0.1% |
| Delaware | 2 | 0.0% |
| Dominican | 57 | 0.0% |
| Dutch | 2,036 | 1.1% |
| Dutch West Indian | 18 | 0.0% |
| Eastern European | 432 | 0.2% |
| Ecuadorian | 5 | 0.0% |
| Egyptian | 18 | 0.0% |
| English | 26,171 | 14.5% |
| Estonian | 16 | 0.0% |
| Ethiopian | 71 | 0.0% |
| European | 3,170 | 1.8% |
| Finnish | 69 | 0.0% |
| French | 2,130 | 1.2% |
| French American Indian | 6 | 0.0% |
| French Canadian | 50 | 0.0% |
| German | 20,986 | 11.7% |
| Ghanaian | 28 | 0.0% |
| Greek | 534 | 0.3% |
| Guatemalan | 62 | 0.0% |
| Guyanese | 124 | 0.1% |
| Haitian | 14 | 0.0% |
| Honduran | 22 | 0.0% |
| Hungarian | 855 | 0.5% |
| Indian (Asian) | 260 | 0.1% |
| Indonesian | 22 | 0.0% |
| Inupiat | 9 | 0.0% |
| Iranian | 320 | 0.2% |
| Irish | 19,806 | 11.0% |
| Iroquois | 10 | 0.0% |
| Israeli | 2 | 0.0% |
| Italian | 4,702 | 2.6% |
| Jamaican | 238 | 0.1% |
| Jordanian | 33 | 0.0% |
| Korean | 346 | 0.2% |
| Lebanese | 768 | 0.4% |
| Lithuanian | 12 | 0.0% |
| Luxembourger | 10 | 0.0% |
| Mexican | 859 | 0.5% |
| Mexican American Indian | 7 | 0.0% |
| Native Hawaiian | 38 | 0.0% |
| Nigerian | 200 | 0.1% |
| Northern European | 240 | 0.1% |
| Norwegian | 614 | 0.3% |
| Pakistani | 66 | 0.0% |
| Panamanian | 126 | 0.1% |
| Pennsylvania German | 88 | 0.1% |
| Polish | 1,597 | 0.9% |
| Portuguese | 55 | 0.0% |
| Puerto Rican | 482 | 0.3% |
| Romanian | 90 | 0.1% |
| Russian | 235 | 0.1% |
| Salvadoran | 29 | 0.0% |
| Samoan | 28 | 0.0% |
| Scandinavian | 234 | 0.1% |
| Scotch-Irish | 3,686 | 2.1% |
| Scottish | 3,438 | 1.9% |
| Sioux | 3 | 0.0% |
| Slavic | 151 | 0.1% |
| Slovak | 314 | 0.2% |
| Slovene | 20 | 0.0% |
| South American | 94 | 0.1% |
| Spaniard | 72 | 0.0% |
| Spanish | 81 | 0.1% |
| Sri Lankan | 100 | 0.1% |
| Subsaharan African | 1,174 | 0.6% |
| Sudanese | 186 | 0.1% |
| Swedish | 606 | 0.3% |
| Swiss | 210 | 0.1% |
| Syrian | 468 | 0.3% |
| Thai | 1,018 | 0.6% |
| Trinidadian and Tobagonian | 26 | 0.0% |
| Turkish | 59 | 0.0% |
| Ukrainian | 40 | 0.0% |
| Venezuelan | 6 | 0.0% |
| Welsh | 1,337 | 0.7% |
| Yugoslavian | 21 | 0.0% | View All 107 Rows |
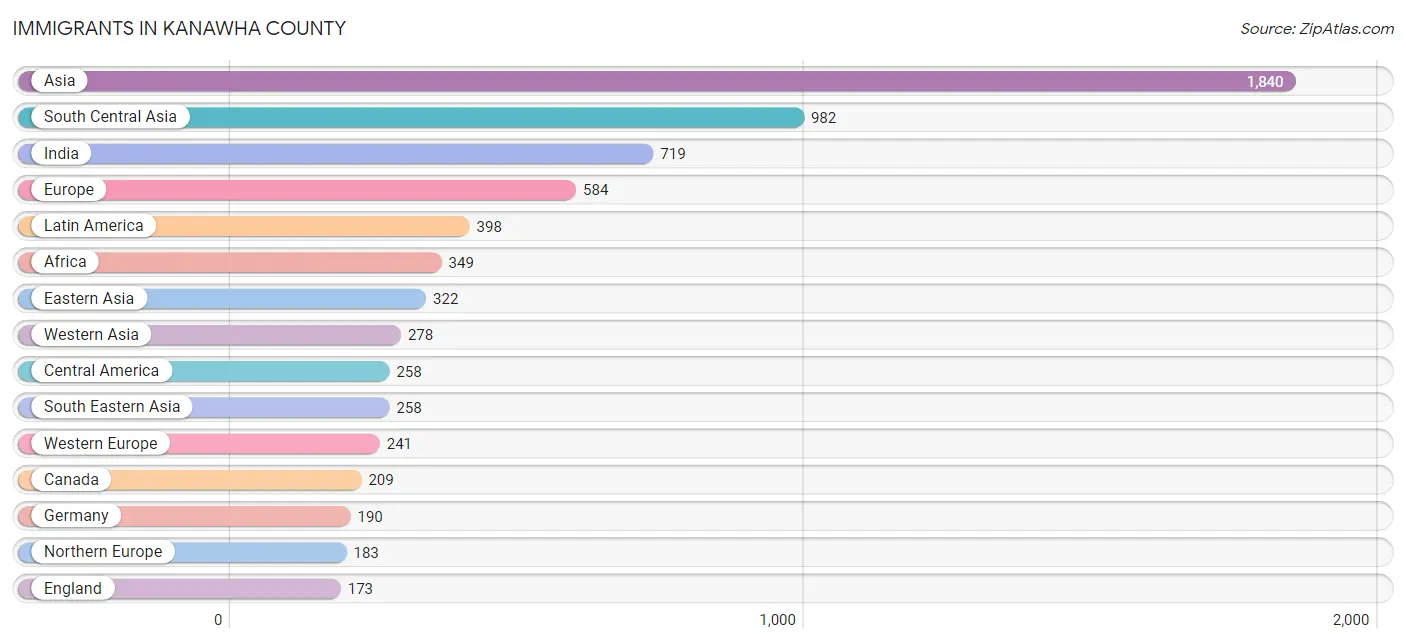
Immigrants in Kanawha County
The most numerous immigrant groups reported in Kanawha County came from Asia (1,840 | 1.0%), South Central Asia (982 | 0.5%), India (719 | 0.4%), Europe (584 | 0.3%), and Latin America (398 | 0.2%), together accounting for 2.5% of all Kanawha County residents.
| Immigration Origin | # Population | % Population |
| Africa | 349 | 0.2% |
| Argentina | 25 | 0.0% |
| Asia | 1,840 | 1.0% |
| Australia | 24 | 0.0% |
| Bangladesh | 46 | 0.0% |
| Belarus | 97 | 0.1% |
| Bulgaria | 7 | 0.0% |
| Cambodia | 14 | 0.0% |
| Canada | 209 | 0.1% |
| Caribbean | 89 | 0.1% |
| Central America | 258 | 0.1% |
| China | 123 | 0.1% |
| Colombia | 10 | 0.0% |
| Croatia | 6 | 0.0% |
| Cuba | 19 | 0.0% |
| Dominican Republic | 10 | 0.0% |
| Eastern Africa | 36 | 0.0% |
| Eastern Asia | 322 | 0.2% |
| Eastern Europe | 144 | 0.1% |
| Ecuador | 5 | 0.0% |
| El Salvador | 17 | 0.0% |
| England | 173 | 0.1% |
| Ethiopia | 36 | 0.0% |
| Europe | 584 | 0.3% |
| France | 12 | 0.0% |
| Germany | 190 | 0.1% |
| Ghana | 16 | 0.0% |
| Guatemala | 58 | 0.0% |
| Guyana | 11 | 0.0% |
| Haiti | 2 | 0.0% |
| Honduras | 21 | 0.0% |
| India | 719 | 0.4% |
| Iran | 32 | 0.0% |
| Italy | 10 | 0.0% |
| Jamaica | 48 | 0.0% |
| Japan | 58 | 0.0% |
| Jordan | 27 | 0.0% |
| Korea | 141 | 0.1% |
| Latin America | 398 | 0.2% |
| Lebanon | 21 | 0.0% |
| Mexico | 162 | 0.1% |
| Nepal | 51 | 0.0% |
| Netherlands | 39 | 0.0% |
| Nigeria | 94 | 0.1% |
| Northern Africa | 130 | 0.1% |
| Northern Europe | 183 | 0.1% |
| Oceania | 24 | 0.0% |
| Pakistan | 92 | 0.1% |
| Philippines | 126 | 0.1% |
| Romania | 4 | 0.0% |
| Russia | 14 | 0.0% |
| Scotland | 2 | 0.0% |
| South Africa | 43 | 0.0% |
| South America | 51 | 0.0% |
| South Central Asia | 982 | 0.5% |
| South Eastern Asia | 258 | 0.1% |
| Southern Europe | 16 | 0.0% |
| Spain | 6 | 0.0% |
| Sri Lanka | 42 | 0.0% |
| Sudan | 86 | 0.1% |
| Syria | 137 | 0.1% |
| Taiwan | 23 | 0.0% |
| Thailand | 56 | 0.0% |
| Trinidad and Tobago | 10 | 0.0% |
| Turkey | 49 | 0.0% |
| Vietnam | 44 | 0.0% |
| Western Africa | 140 | 0.1% |
| Western Asia | 278 | 0.2% |
| Western Europe | 241 | 0.1% | View All 69 Rows |
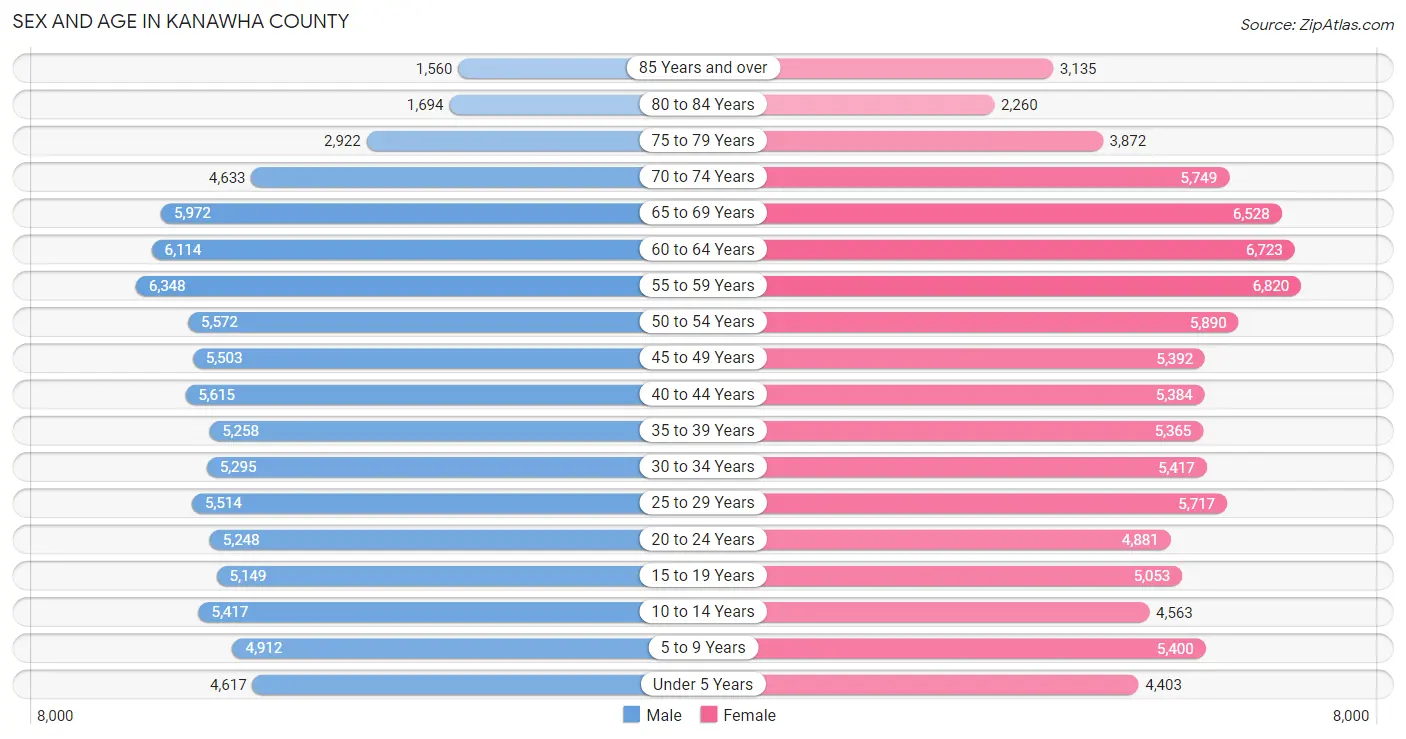
Sex and Age in Kanawha County
Sex and Age in Kanawha County
The most populous age groups in Kanawha County are 55 to 59 Years (6,348 | 7.3%) for men and 55 to 59 Years (6,820 | 7.4%) for women.
| Age Bracket | Male | Female |
| Under 5 Years | 4,617 (5.3%) | 4,403 (4.8%) |
| 5 to 9 Years | 4,912 (5.6%) | 5,400 (5.8%) |
| 10 to 14 Years | 5,417 (6.2%) | 4,563 (4.9%) |
| 15 to 19 Years | 5,149 (5.9%) | 5,053 (5.5%) |
| 20 to 24 Years | 5,248 (6.0%) | 4,881 (5.3%) |
| 25 to 29 Years | 5,514 (6.3%) | 5,717 (6.2%) |
| 30 to 34 Years | 5,295 (6.1%) | 5,417 (5.9%) |
| 35 to 39 Years | 5,258 (6.0%) | 5,365 (5.8%) |
| 40 to 44 Years | 5,615 (6.4%) | 5,384 (5.8%) |
| 45 to 49 Years | 5,503 (6.3%) | 5,392 (5.8%) |
| 50 to 54 Years | 5,572 (6.4%) | 5,890 (6.4%) |
| 55 to 59 Years | 6,348 (7.3%) | 6,820 (7.4%) |
| 60 to 64 Years | 6,114 (7.0%) | 6,723 (7.3%) |
| 65 to 69 Years | 5,972 (6.8%) | 6,528 (7.0%) |
| 70 to 74 Years | 4,633 (5.3%) | 5,749 (6.2%) |
| 75 to 79 Years | 2,922 (3.4%) | 3,872 (4.2%) |
| 80 to 84 Years | 1,694 (1.9%) | 2,260 (2.4%) |
| 85 Years and over | 1,560 (1.8%) | 3,135 (3.4%) |
| Total | 87,343 (100.0%) | 92,552 (100.0%) |
Families and Households in Kanawha County
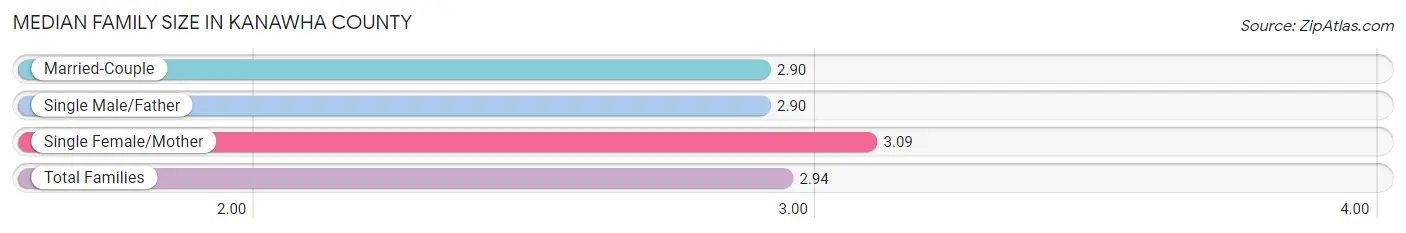
Median Family Size in Kanawha County
The median family size in Kanawha County is 2.94 persons per family, with single female/mother families (9,639 | 20.8%) accounting for the largest median family size of 3.09 persons per family. On the other hand, married-couple families (32,883 | 71.0%) represent the smallest median family size with 2.90 persons per family.
| Family Type | # Families | Family Size |
| Married-Couple | 32,883 (71.0%) | 2.90 |
| Single Male/Father | 3,813 (8.2%) | 2.90 |
| Single Female/Mother | 9,639 (20.8%) | 3.09 |
| Total Families | 46,335 (100.0%) | 2.94 |
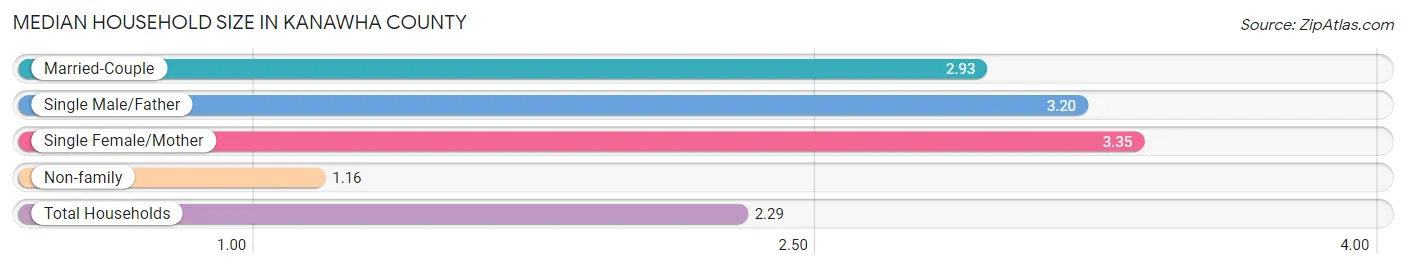
Median Household Size in Kanawha County
The median household size in Kanawha County is 2.29 persons per household, with single female/mother households (9,639 | 12.5%) accounting for the largest median household size of 3.35 persons per household. non-family households (30,917 | 40.0%) represent the smallest median household size with 1.16 persons per household.
| Household Type | # Households | Household Size |
| Married-Couple | 32,883 (42.6%) | 2.93 |
| Single Male/Father | 3,813 (4.9%) | 3.20 |
| Single Female/Mother | 9,639 (12.5%) | 3.35 |
| Non-family | 30,917 (40.0%) | 1.16 |
| Total Households | 77,252 (100.0%) | 2.29 |
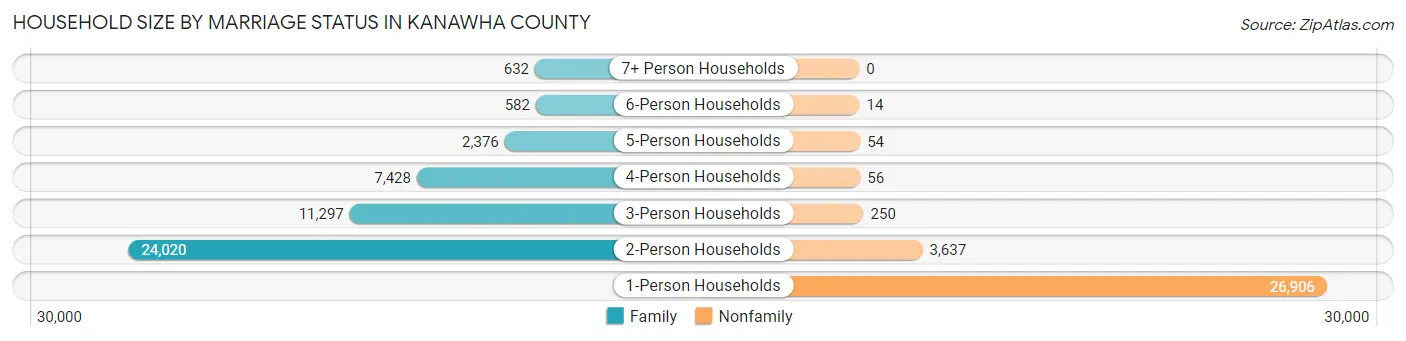
Household Size by Marriage Status in Kanawha County
Out of a total of 77,252 households in Kanawha County, 46,335 (60.0%) are family households, while 30,917 (40.0%) are nonfamily households. The most numerous type of family households are 2-person households, comprising 24,020, and the most common type of nonfamily households are 1-person households, comprising 26,906.
| Household Size | Family Households | Nonfamily Households |
| 1-Person Households | - | 26,906 (34.8%) |
| 2-Person Households | 24,020 (31.1%) | 3,637 (4.7%) |
| 3-Person Households | 11,297 (14.6%) | 250 (0.3%) |
| 4-Person Households | 7,428 (9.6%) | 56 (0.1%) |
| 5-Person Households | 2,376 (3.1%) | 54 (0.1%) |
| 6-Person Households | 582 (0.7%) | 14 (0.0%) |
| 7+ Person Households | 632 (0.8%) | 0 (0.0%) |
| Total | 46,335 (60.0%) | 30,917 (40.0%) |
Female Fertility in Kanawha County
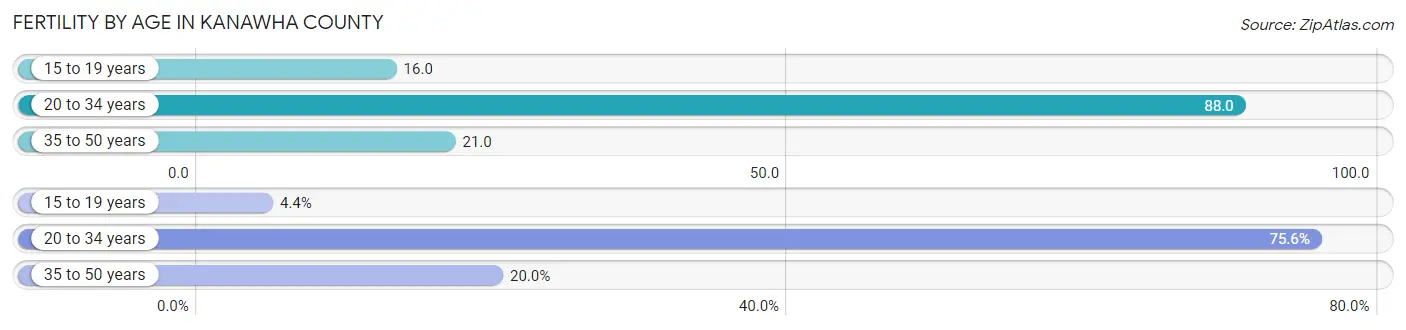
Fertility by Age in Kanawha County
Average fertility rate in Kanawha County is 48.0 births per 1,000 women. Women in the age bracket of 20 to 34 years have the highest fertility rate with 88.0 births per 1,000 women. Women in the age bracket of 20 to 34 years acount for 75.6% of all women with births.
| Age Bracket | Women with Births | Births / 1,000 Women |
| 15 to 19 years | 82 (4.4%) | 16.0 |
| 20 to 34 years | 1,404 (75.6%) | 88.0 |
| 35 to 50 years | 372 (20.0%) | 21.0 |
| Total | 1,858 (100.0%) | 48.0 |
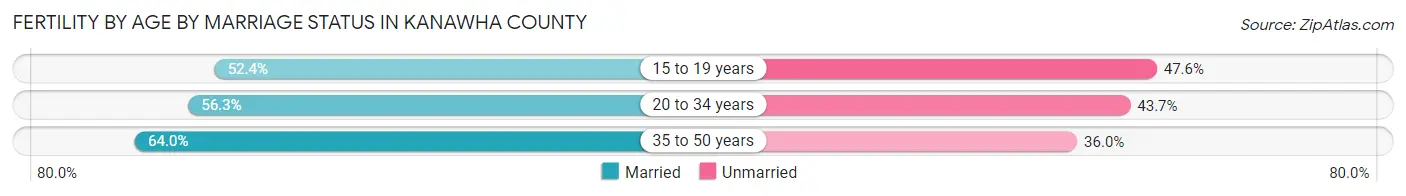
Fertility by Age by Marriage Status in Kanawha County
57.6% of women with births (1,858) in Kanawha County are married. The highest percentage of unmarried women with births falls into 15 to 19 years age bracket with 47.6% of them unmarried at the time of birth, while the lowest percentage of unmarried women with births belong to 35 to 50 years age bracket with 36.0% of them unmarried.
| Age Bracket | Married | Unmarried |
| 15 to 19 years | 43 (52.4%) | 39 (47.6%) |
| 20 to 34 years | 790 (56.3%) | 614 (43.7%) |
| 35 to 50 years | 238 (64.0%) | 134 (36.0%) |
| Total | 1,070 (57.6%) | 788 (42.4%) |
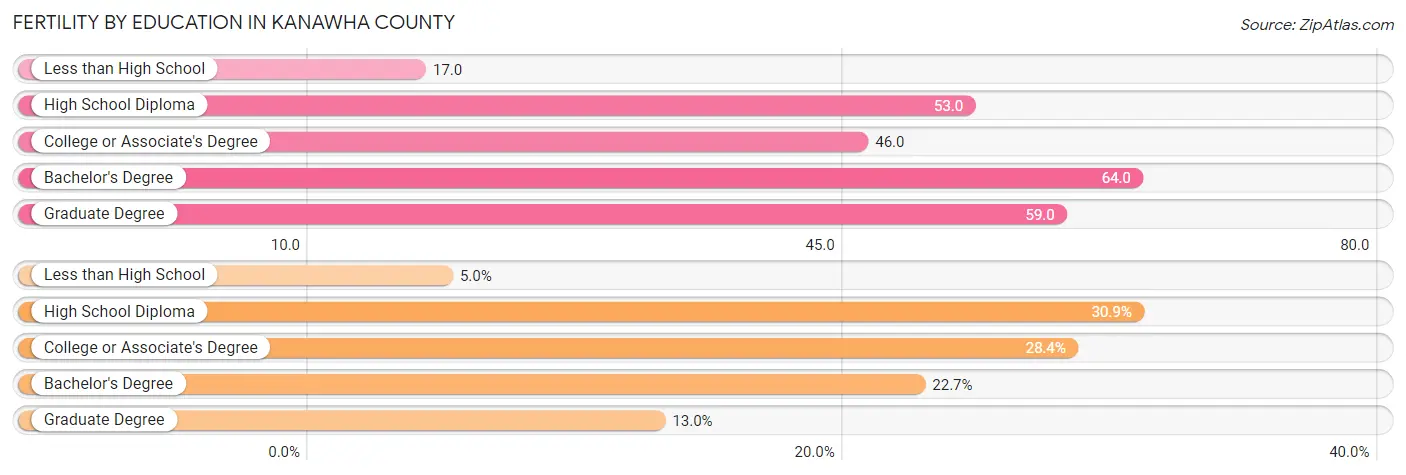
Fertility by Education in Kanawha County
Average fertility rate in Kanawha County is 48.0 births per 1,000 women. Women with the education attainment of bachelor's degree have the highest fertility rate of 64.0 births per 1,000 women, while women with the education attainment of less than high school have the lowest fertility at 17.0 births per 1,000 women. Women with the education attainment of high school diploma represent 30.9% of all women with births.
| Educational Attainment | Women with Births | Births / 1,000 Women |
| Less than High School | 93 (5.0%) | 17.0 |
| High School Diploma | 574 (30.9%) | 53.0 |
| College or Associate's Degree | 528 (28.4%) | 46.0 |
| Bachelor's Degree | 422 (22.7%) | 64.0 |
| Graduate Degree | 241 (13.0%) | 59.0 |
| Total | 1,858 (100.0%) | 48.0 |
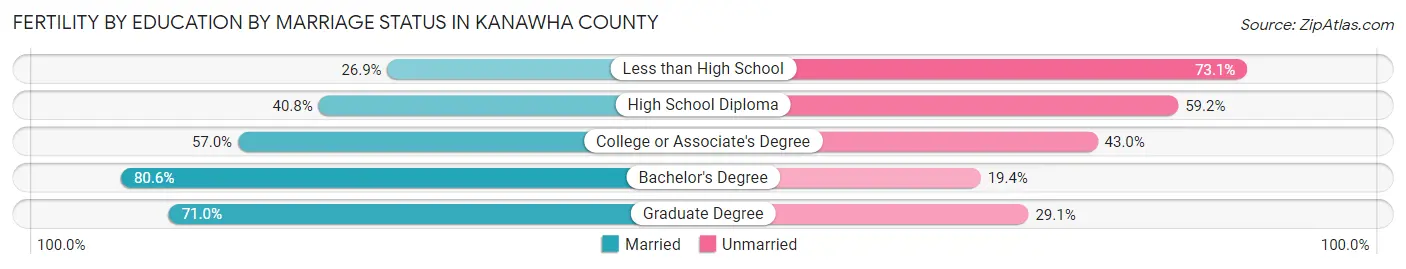
Fertility by Education by Marriage Status in Kanawha County
42.4% of women with births in Kanawha County are unmarried. Women with the educational attainment of bachelor's degree are most likely to be married with 80.6% of them married at childbirth, while women with the educational attainment of less than high school are least likely to be married with 73.1% of them unmarried at childbirth.
| Educational Attainment | Married | Unmarried |
| Less than High School | 25 (26.9%) | 68 (73.1%) |
| High School Diploma | 234 (40.8%) | 340 (59.2%) |
| College or Associate's Degree | 301 (57.0%) | 227 (43.0%) |
| Bachelor's Degree | 340 (80.6%) | 82 (19.4%) |
| Graduate Degree | 171 (71.0%) | 70 (29.0%) |
| Total | 1,070 (57.6%) | 788 (42.4%) |
Income in Kanawha County
Income Overview in Kanawha County
Per Capita Income in Kanawha County is $34,976, while median incomes of families and households are $72,983 and $55,226 respectively.
| Characteristic | Number | Measure |
| Per Capita Income | 179,895 | $34,976 |
| Median Family Income | 46,335 | $72,983 |
| Mean Family Income | 46,335 | $96,803 |
| Median Household Income | 77,252 | $55,226 |
| Mean Household Income | 77,252 | $79,069 |
| Income Deficit | 46,335 | $11,005 |
| Wage / Income Gap (%) | 179,895 | 22.10% |
| Wage / Income Gap ($) | 179,895 | 77.90¢ per $1 |
| Gini / Inequality Index | 179,895 | 0.49 |
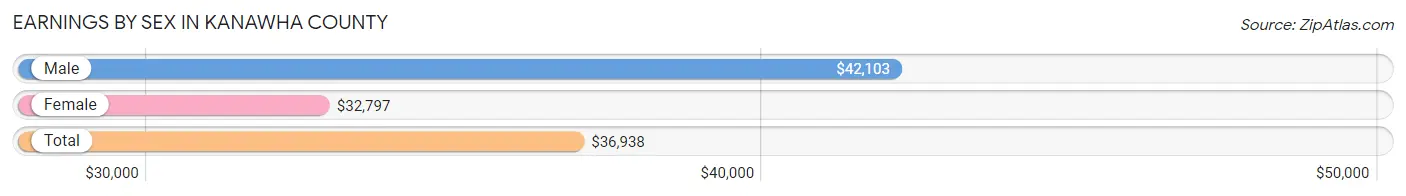
Earnings by Sex in Kanawha County
Average Earnings in Kanawha County are $36,938, $42,103 for men and $32,797 for women, a difference of 22.1%.
| Sex | Number | Average Earnings |
| Male | 43,664 (51.1%) | $42,103 |
| Female | 41,859 (48.9%) | $32,797 |
| Total | 85,523 (100.0%) | $36,938 |
Earnings by Sex by Income Bracket in Kanawha County
The most common earnings brackets in Kanawha County are $100,000+ for men (6,309 | 14.4%) and $25,000 to $29,999 for women (4,149 | 9.9%).
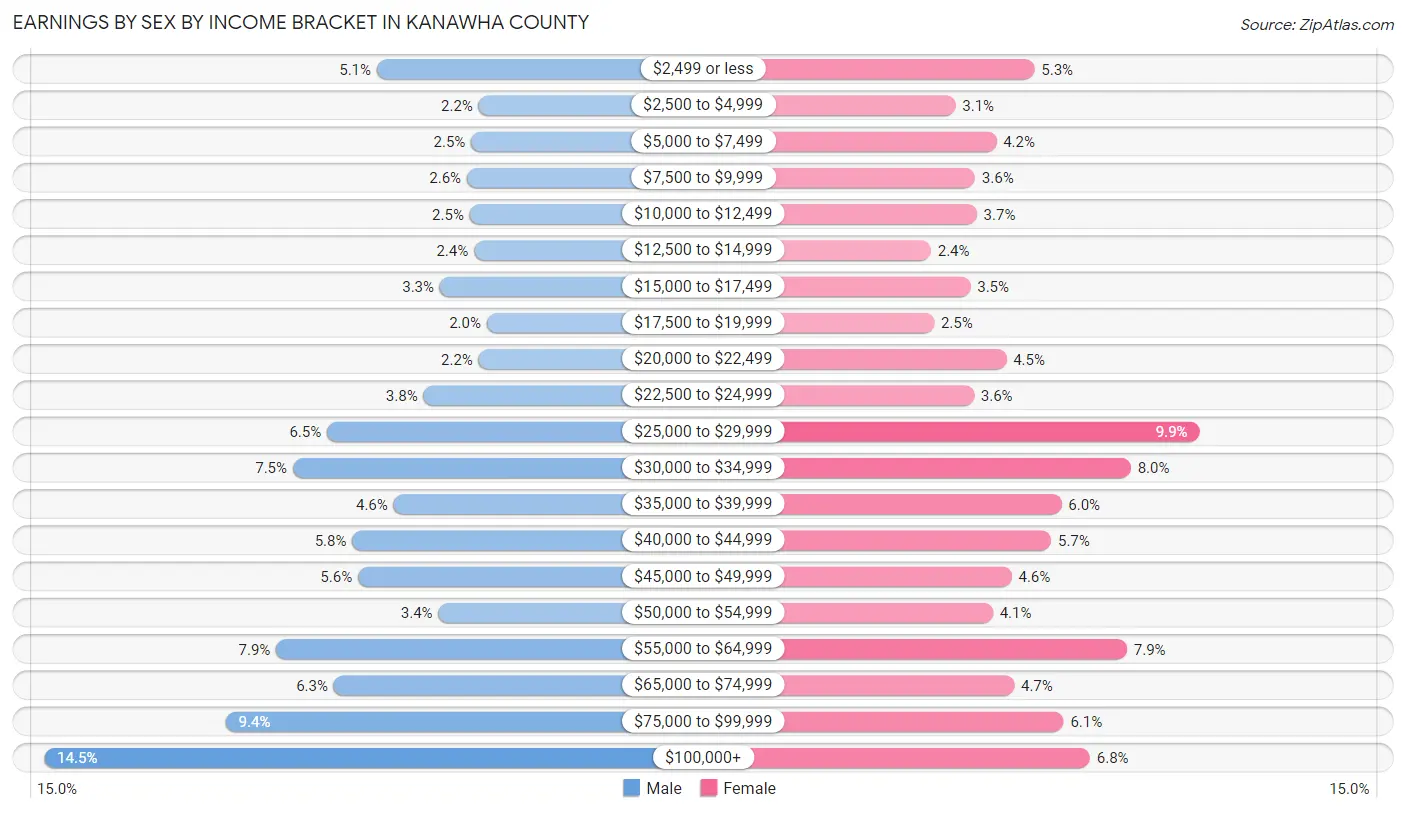
| Income | Male | Female |
| $2,499 or less | 2,226 (5.1%) | 2,206 (5.3%) |
| $2,500 to $4,999 | 980 (2.2%) | 1,278 (3.0%) |
| $5,000 to $7,499 | 1,071 (2.5%) | 1,759 (4.2%) |
| $7,500 to $9,999 | 1,120 (2.6%) | 1,505 (3.6%) |
| $10,000 to $12,499 | 1,087 (2.5%) | 1,529 (3.6%) |
| $12,500 to $14,999 | 1,033 (2.4%) | 989 (2.4%) |
| $15,000 to $17,499 | 1,453 (3.3%) | 1,453 (3.5%) |
| $17,500 to $19,999 | 878 (2.0%) | 1,025 (2.5%) |
| $20,000 to $22,499 | 977 (2.2%) | 1,877 (4.5%) |
| $22,500 to $24,999 | 1,656 (3.8%) | 1,496 (3.6%) |
| $25,000 to $29,999 | 2,839 (6.5%) | 4,149 (9.9%) |
| $30,000 to $34,999 | 3,256 (7.5%) | 3,341 (8.0%) |
| $35,000 to $39,999 | 2,022 (4.6%) | 2,523 (6.0%) |
| $40,000 to $44,999 | 2,528 (5.8%) | 2,402 (5.7%) |
| $45,000 to $49,999 | 2,458 (5.6%) | 1,939 (4.6%) |
| $50,000 to $54,999 | 1,470 (3.4%) | 1,716 (4.1%) |
| $55,000 to $64,999 | 3,462 (7.9%) | 3,296 (7.9%) |
| $65,000 to $74,999 | 2,757 (6.3%) | 1,968 (4.7%) |
| $75,000 to $99,999 | 4,082 (9.3%) | 2,549 (6.1%) |
| $100,000+ | 6,309 (14.4%) | 2,859 (6.8%) |
| Total | 43,664 (100.0%) | 41,859 (100.0%) |
Earnings by Sex by Educational Attainment in Kanawha County
Average earnings in Kanawha County are $46,804 for men and $36,590 for women, a difference of 21.8%. Men with an educational attainment of graduate degree enjoy the highest average annual earnings of $95,742, while those with less than high school education earn the least with $28,446. Women with an educational attainment of graduate degree earn the most with the average annual earnings of $65,473, while those with less than high school education have the smallest earnings of $22,002.
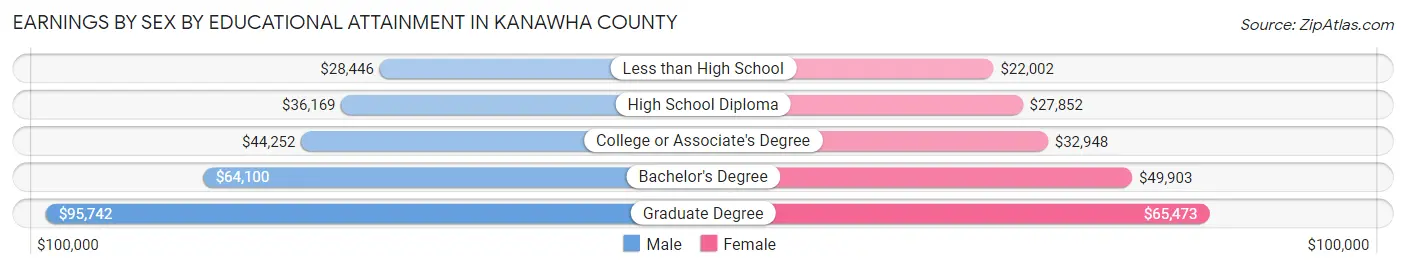
| Educational Attainment | Male Income | Female Income |
| Less than High School | $28,446 | $22,002 |
| High School Diploma | $36,169 | $27,852 |
| College or Associate's Degree | $44,252 | $32,948 |
| Bachelor's Degree | $64,100 | $49,903 |
| Graduate Degree | $95,742 | $65,473 |
| Total | $46,804 | $36,590 |
Family Income in Kanawha County
Family Income Brackets in Kanawha County
According to the Kanawha County family income data, there are 8,479 families falling into the $50,000 to $74,999 income range, which is the most common income bracket and makes up 18.3% of all families. Conversely, the $10,000 to $14,999 income bracket is the least frequent group with only 1,436 families (3.1%) belonging to this category.
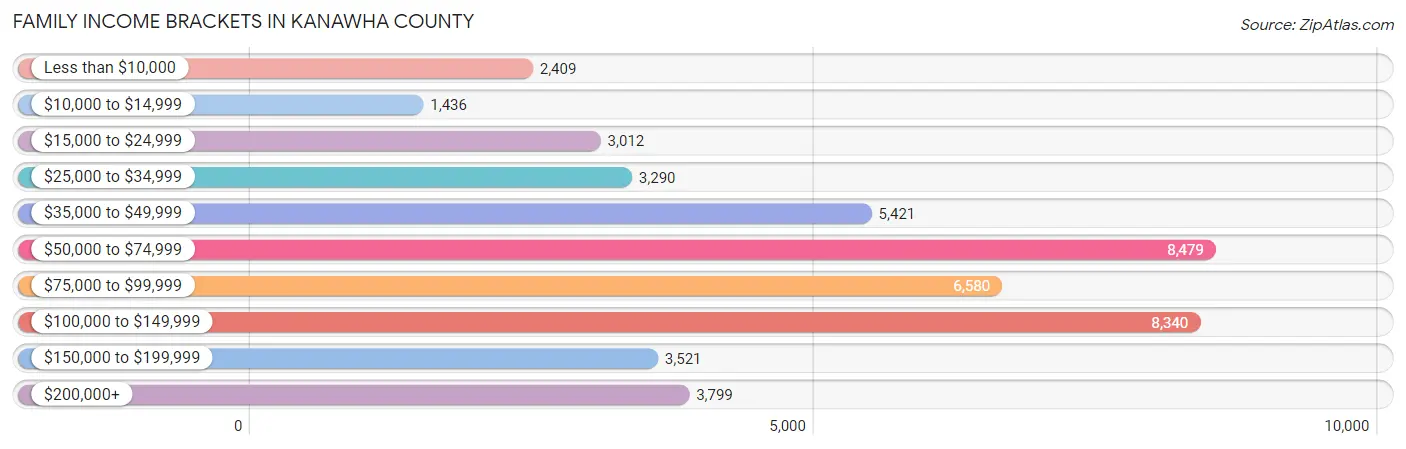
| Income Bracket | # Families | % Families |
| Less than $10,000 | 2,409 | 5.2% |
| $10,000 to $14,999 | 1,436 | 3.1% |
| $15,000 to $24,999 | 3,012 | 6.5% |
| $25,000 to $34,999 | 3,290 | 7.1% |
| $35,000 to $49,999 | 5,421 | 11.7% |
| $50,000 to $74,999 | 8,479 | 18.3% |
| $75,000 to $99,999 | 6,580 | 14.2% |
| $100,000 to $149,999 | 8,340 | 18.0% |
| $150,000 to $199,999 | 3,521 | 7.6% |
| $200,000+ | 3,799 | 8.2% |
Family Income by Famaliy Size in Kanawha County
7+ person families (511 | 1.1%) account for the highest median family income in Kanawha County with $112,656 per family, while 2-person families (25,752 | 55.6%) have the highest median income of $31,852 per family member.
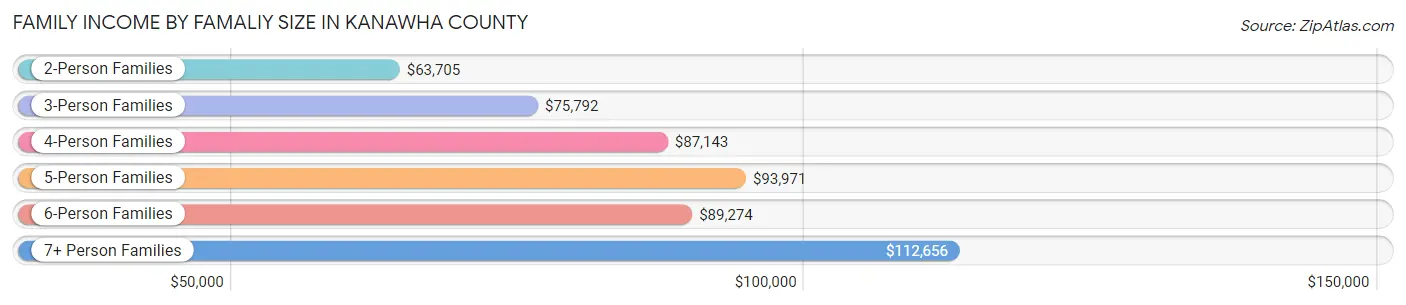
| Income Bracket | # Families | Median Income |
| 2-Person Families | 25,752 (55.6%) | $63,705 |
| 3-Person Families | 11,032 (23.8%) | $75,792 |
| 4-Person Families | 6,608 (14.3%) | $87,143 |
| 5-Person Families | 1,808 (3.9%) | $93,971 |
| 6-Person Families | 624 (1.3%) | $89,274 |
| 7+ Person Families | 511 (1.1%) | $112,656 |
| Total | 46,335 (100.0%) | $72,983 |
Family Income by Number of Earners in Kanawha County
The median family income in Kanawha County is $72,983, with families comprising 3+ earners (2,994) having the highest median family income of $141,531, while families with no earners (11,100) have the lowest median family income of $38,034, accounting for 6.5% and 24.0% of families, respectively.
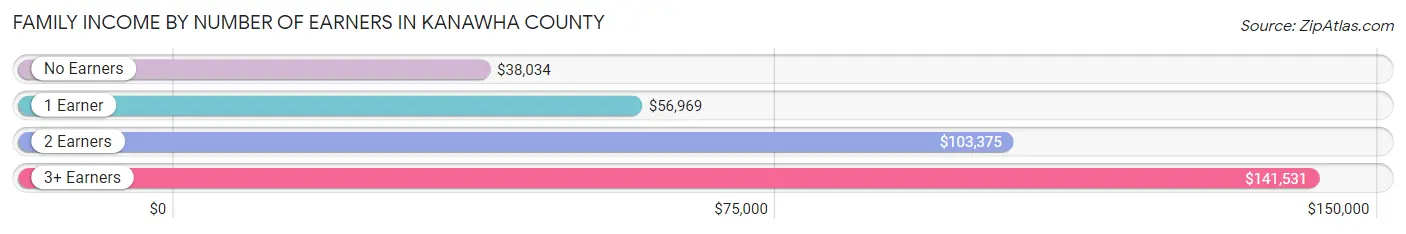
| Number of Earners | # Families | Median Income |
| No Earners | 11,100 (24.0%) | $38,034 |
| 1 Earner | 15,507 (33.5%) | $56,969 |
| 2 Earners | 16,734 (36.1%) | $103,375 |
| 3+ Earners | 2,994 (6.5%) | $141,531 |
| Total | 46,335 (100.0%) | $72,983 |
Household Income in Kanawha County
Household Income Brackets in Kanawha County
With 14,060 households falling in the category, the $50,000 to $74,999 income range is the most frequent in Kanawha County, accounting for 18.2% of all households. In contrast, only 4,094 households (5.3%) fall into the $150,000 to $199,999 income bracket, making it the least populous group.
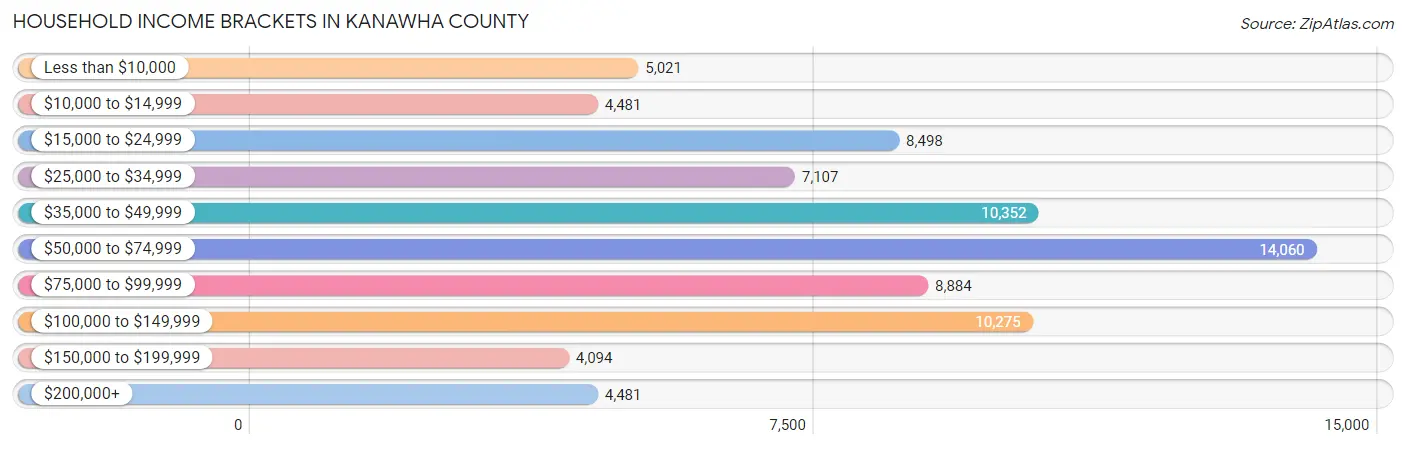
| Income Bracket | # Households | % Households |
| Less than $10,000 | 5,021 | 6.5% |
| $10,000 to $14,999 | 4,481 | 5.8% |
| $15,000 to $24,999 | 8,498 | 11.0% |
| $25,000 to $34,999 | 7,107 | 9.2% |
| $35,000 to $49,999 | 10,352 | 13.4% |
| $50,000 to $74,999 | 14,060 | 18.2% |
| $75,000 to $99,999 | 8,884 | 11.5% |
| $100,000 to $149,999 | 10,275 | 13.3% |
| $150,000 to $199,999 | 4,094 | 5.3% |
| $200,000+ | 4,481 | 5.8% |
Household Income by Householder Age in Kanawha County
The median household income in Kanawha County is $55,226, with the highest median household income of $64,849 found in the 45 to 64 years age bracket for the primary householder. A total of 27,803 households (36.0%) fall into this category. Meanwhile, the 15 to 24 years age bracket for the primary householder has the lowest median household income of $26,604, with 2,565 households (3.3%) in this group.
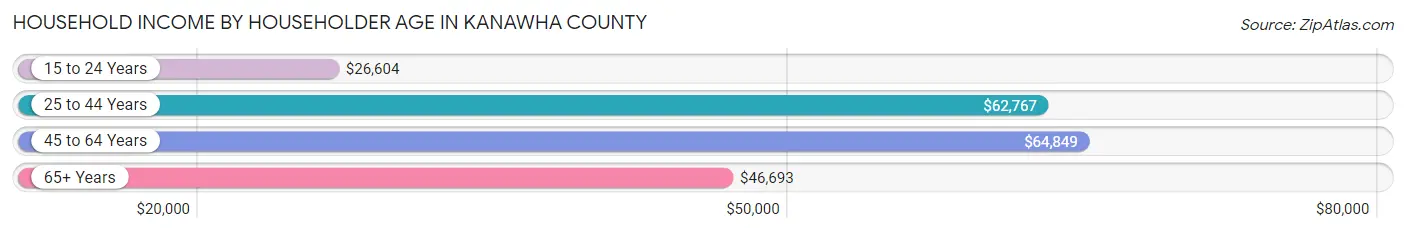
| Income Bracket | # Households | Median Income |
| 15 to 24 Years | 2,565 (3.3%) | $26,604 |
| 25 to 44 Years | 21,363 (27.7%) | $62,767 |
| 45 to 64 Years | 27,803 (36.0%) | $64,849 |
| 65+ Years | 25,521 (33.0%) | $46,693 |
| Total | 77,252 (100.0%) | $55,226 |
Poverty in Kanawha County
Income Below Poverty by Sex and Age in Kanawha County
With 15.5% poverty level for males and 17.3% for females among the residents of Kanawha County, 12 to 14 year old males and 5 year old females are the most vulnerable to poverty, with 1,033 males (31.3%) and 408 females (36.5%) in their respective age groups living below the poverty level.
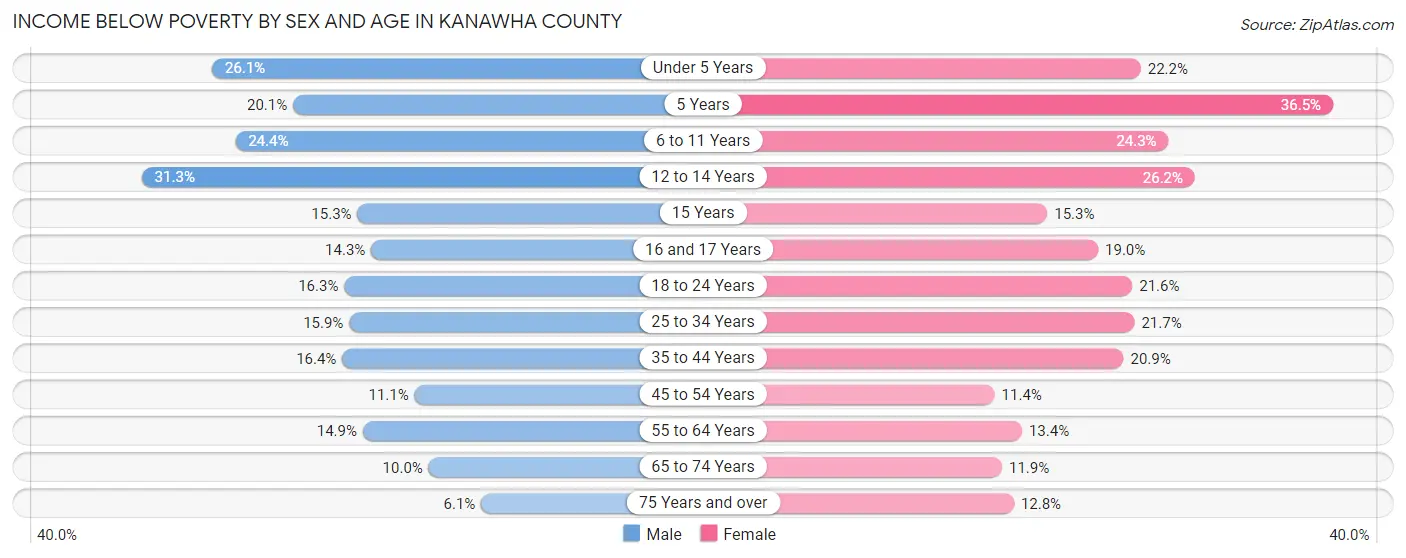
| Age Bracket | Male | Female |
| Under 5 Years | 1,169 (26.1%) | 959 (22.2%) |
| 5 Years | 171 (20.1%) | 408 (36.5%) |
| 6 to 11 Years | 1,474 (24.4%) | 1,434 (24.2%) |
| 12 to 14 Years | 1,033 (31.3%) | 702 (26.2%) |
| 15 Years | 187 (15.3%) | 156 (15.3%) |
| 16 and 17 Years | 287 (14.3%) | 408 (19.0%) |
| 18 to 24 Years | 1,085 (16.3%) | 1,387 (21.6%) |
| 25 to 34 Years | 1,678 (15.9%) | 2,399 (21.7%) |
| 35 to 44 Years | 1,746 (16.4%) | 2,227 (20.9%) |
| 45 to 54 Years | 1,221 (11.1%) | 1,276 (11.4%) |
| 55 to 64 Years | 1,845 (14.9%) | 1,805 (13.4%) |
| 65 to 74 Years | 1,051 (10.0%) | 1,444 (11.9%) |
| 75 Years and over | 363 (6.1%) | 1,143 (12.8%) |
| Total | 13,310 (15.5%) | 15,748 (17.3%) |
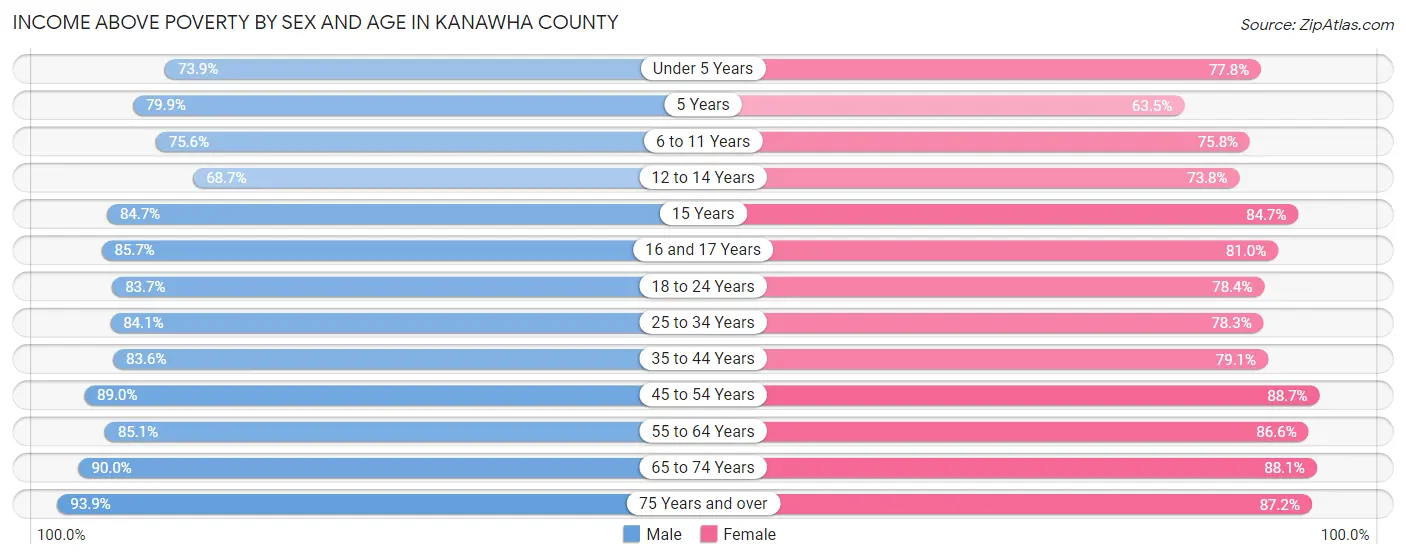
Income Above Poverty by Sex and Age in Kanawha County
According to the poverty statistics in Kanawha County, males aged 75 years and over and females aged 45 to 54 years are the age groups that are most secure financially, with 93.9% of males and 88.6% of females in these age groups living above the poverty line.
| Age Bracket | Male | Female |
| Under 5 Years | 3,311 (73.9%) | 3,361 (77.8%) |
| 5 Years | 681 (79.9%) | 711 (63.5%) |
| 6 to 11 Years | 4,578 (75.6%) | 4,480 (75.7%) |
| 12 to 14 Years | 2,266 (68.7%) | 1,976 (73.8%) |
| 15 Years | 1,036 (84.7%) | 866 (84.7%) |
| 16 and 17 Years | 1,724 (85.7%) | 1,736 (81.0%) |
| 18 to 24 Years | 5,583 (83.7%) | 5,044 (78.4%) |
| 25 to 34 Years | 8,875 (84.1%) | 8,642 (78.3%) |
| 35 to 44 Years | 8,888 (83.6%) | 8,420 (79.1%) |
| 45 to 54 Years | 9,825 (88.9%) | 9,969 (88.6%) |
| 55 to 64 Years | 10,544 (85.1%) | 11,686 (86.6%) |
| 65 to 74 Years | 9,463 (90.0%) | 10,694 (88.1%) |
| 75 Years and over | 5,588 (93.9%) | 7,798 (87.2%) |
| Total | 72,362 (84.5%) | 75,383 (82.7%) |
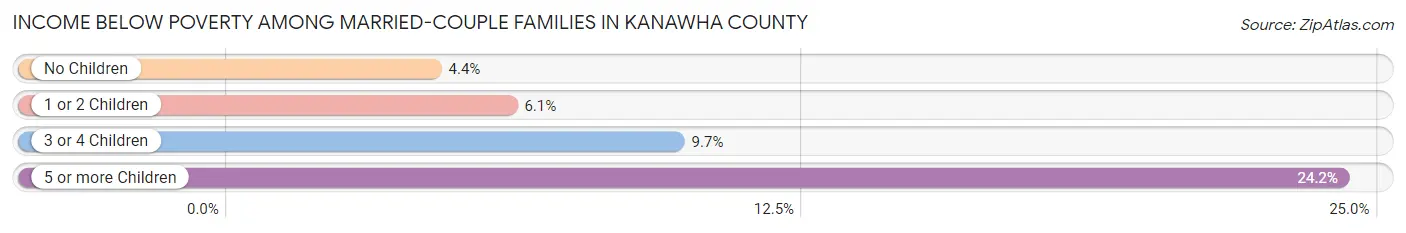
Income Below Poverty Among Married-Couple Families in Kanawha County
The poverty statistics for married-couple families in Kanawha County show that 5.2% or 1,717 of the total 32,883 families live below the poverty line. Families with 5 or more children have the highest poverty rate of 24.2%, comprising of 30 families. On the other hand, families with no children have the lowest poverty rate of 4.4%, which includes 968 families.
| Children | Above Poverty | Below Poverty |
| No Children | 20,881 (95.6%) | 968 (4.4%) |
| 1 or 2 Children | 8,797 (93.9%) | 569 (6.1%) |
| 3 or 4 Children | 1,394 (90.3%) | 150 (9.7%) |
| 5 or more Children | 94 (75.8%) | 30 (24.2%) |
| Total | 31,166 (94.8%) | 1,717 (5.2%) |
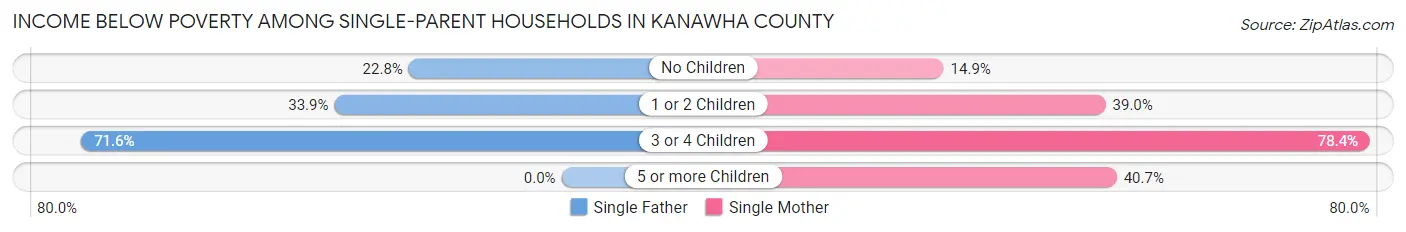
Income Below Poverty Among Single-Parent Households in Kanawha County
According to the poverty data in Kanawha County, 31.0% or 1,181 single-father households and 32.2% or 3,108 single-mother households are living below the poverty line. Among single-father households, those with 3 or 4 children have the highest poverty rate, with 156 households (71.6%) experiencing poverty. Likewise, among single-mother households, those with 3 or 4 children have the highest poverty rate, with 563 households (78.4%) falling below the poverty line.
| Children | Single Father | Single Mother |
| No Children | 391 (22.8%) | 580 (14.9%) |
| 1 or 2 Children | 634 (33.9%) | 1,906 (39.0%) |
| 3 or 4 Children | 156 (71.6%) | 563 (78.4%) |
| 5 or more Children | 0 (0.0%) | 59 (40.7%) |
| Total | 1,181 (31.0%) | 3,108 (32.2%) |
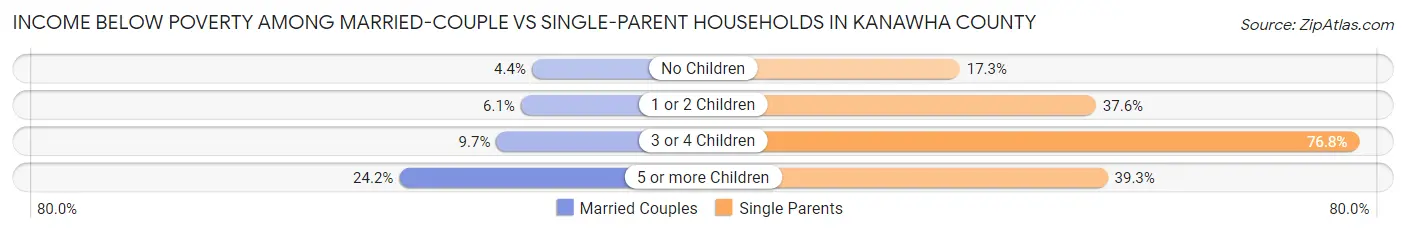
Income Below Poverty Among Married-Couple vs Single-Parent Households in Kanawha County
The poverty data for Kanawha County shows that 1,717 of the married-couple family households (5.2%) and 4,289 of the single-parent households (31.9%) are living below the poverty level. Within the married-couple family households, those with 5 or more children have the highest poverty rate, with 30 households (24.2%) falling below the poverty line. Among the single-parent households, those with 3 or 4 children have the highest poverty rate, with 719 household (76.8%) living below poverty.
| Children | Married-Couple Families | Single-Parent Households |
| No Children | 968 (4.4%) | 971 (17.3%) |
| 1 or 2 Children | 569 (6.1%) | 2,540 (37.6%) |
| 3 or 4 Children | 150 (9.7%) | 719 (76.8%) |
| 5 or more Children | 30 (24.2%) | 59 (39.3%) |
| Total | 1,717 (5.2%) | 4,289 (31.9%) |
Employment Characteristics in Kanawha County
Employment by Class of Employer in Kanawha County
Among the 76,292 employed individuals in Kanawha County, private company employees (47,760 | 62.6%), not-for-profit organizations (8,390 | 11.0%), and state government employees (7,688 | 10.1%) make up the most common classes of employment.
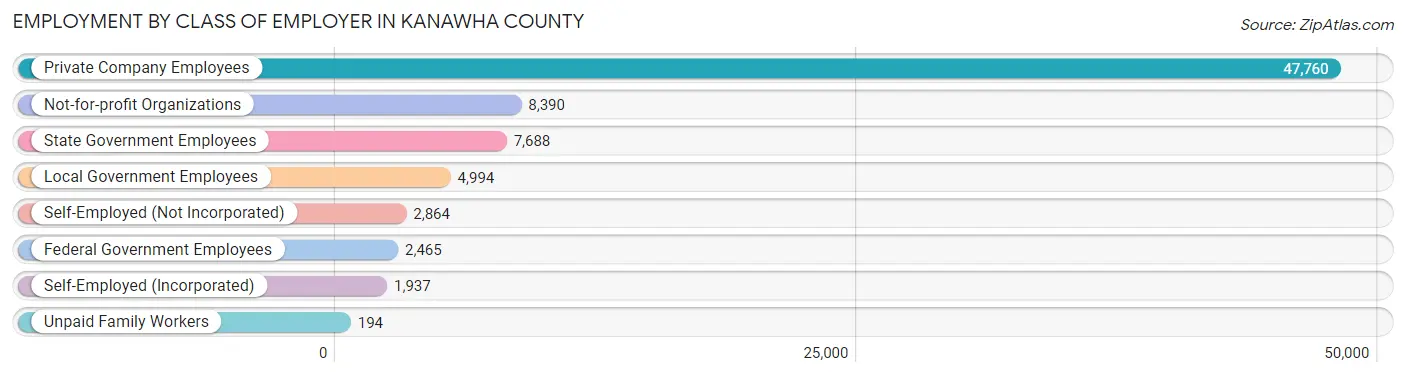
| Employer Class | # Employees | % Employees |
| Private Company Employees | 47,760 | 62.6% |
| Self-Employed (Incorporated) | 1,937 | 2.5% |
| Self-Employed (Not Incorporated) | 2,864 | 3.7% |
| Not-for-profit Organizations | 8,390 | 11.0% |
| Local Government Employees | 4,994 | 6.6% |
| State Government Employees | 7,688 | 10.1% |
| Federal Government Employees | 2,465 | 3.2% |
| Unpaid Family Workers | 194 | 0.3% |
| Total | 76,292 | 100.0% |
Employment Status by Age in Kanawha County
According to the labor force statistics for Kanawha County, out of the total population over 16 years of age (148,335), 55.1% or 81,733 individuals are in the labor force, with 5.4% or 4,414 of them unemployed. The age group with the highest labor force participation rate is 30 to 34 years, with 80.3% or 8,602 individuals in the labor force. Within the labor force, the 16 to 19 years age range has the highest percentage of unemployed individuals, with 16.4% or 462 of them being unemployed.
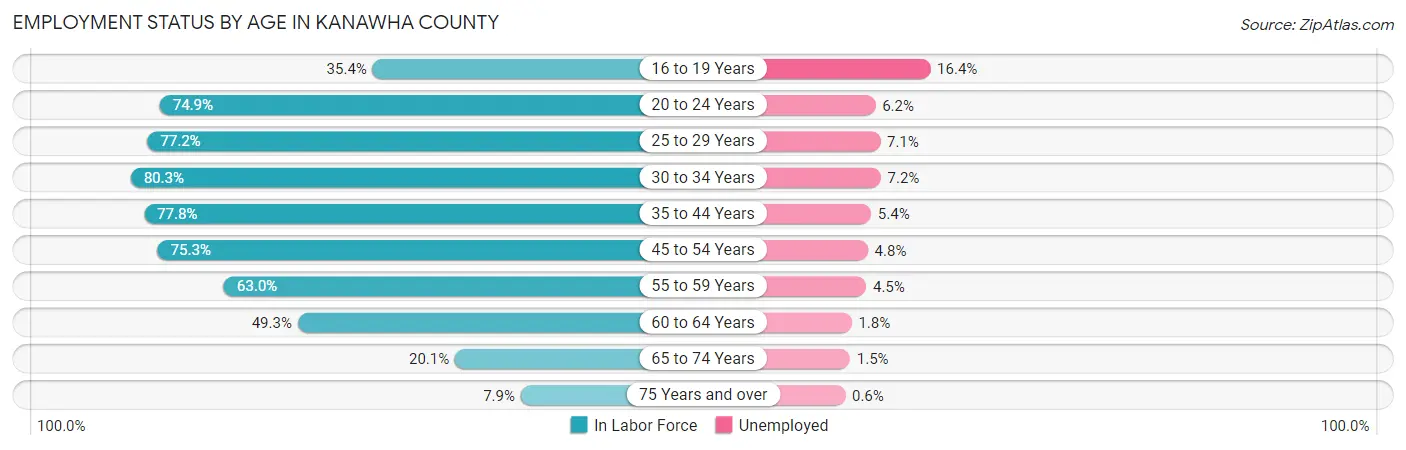
| Age Bracket | In Labor Force | Unemployed |
| 16 to 19 Years | 2,816 (35.4%) | 462 (16.4%) |
| 20 to 24 Years | 7,587 (74.9%) | 470 (6.2%) |
| 25 to 29 Years | 8,670 (77.2%) | 616 (7.1%) |
| 30 to 34 Years | 8,602 (80.3%) | 619 (7.2%) |
| 35 to 44 Years | 16,822 (77.8%) | 908 (5.4%) |
| 45 to 54 Years | 16,835 (75.3%) | 808 (4.8%) |
| 55 to 59 Years | 8,296 (63.0%) | 373 (4.5%) |
| 60 to 64 Years | 6,329 (49.3%) | 114 (1.8%) |
| 65 to 74 Years | 4,599 (20.1%) | 69 (1.5%) |
| 75 Years and over | 1,220 (7.9%) | 7 (0.6%) |
| Total | 81,733 (55.1%) | 4,414 (5.4%) |
Employment Status by Educational Attainment in Kanawha County
According to labor force statistics for Kanawha County, 71.3% of individuals (65,544) out of the total population between 25 and 64 years of age (91,927) are in the labor force, with 5.2% or 3,408 of them being unemployed. The group with the highest labor force participation rate are those with the educational attainment of bachelor's degree or higher, with 85.0% or 22,930 individuals in the labor force. Within the labor force, individuals with less than high school education have the highest percentage of unemployment, with 10.7% or 365 of them being unemployed.
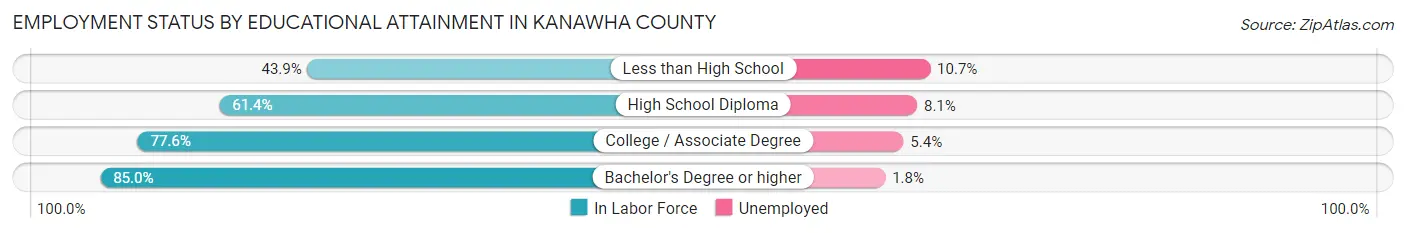
| Educational Attainment | In Labor Force | Unemployed |
| Less than High School | 3,414 (43.9%) | 832 (10.7%) |
| High School Diploma | 19,445 (61.4%) | 2,565 (8.1%) |
| College / Associate Degree | 19,792 (77.6%) | 1,377 (5.4%) |
| Bachelor's Degree or higher | 22,930 (85.0%) | 486 (1.8%) |
| Total | 65,544 (71.3%) | 4,780 (5.2%) |
Employment Occupations by Sex in Kanawha County
Management, Business, Science and Arts Occupations
The most common Management, Business, Science and Arts occupations in Kanawha County are Community & Social Service (8,793 | 11.4%), Health Diagnosing & Treating (7,435 | 9.7%), Management (6,151 | 8.0%), Health Technologists (5,051 | 6.6%), and Business & Financial (4,521 | 5.9%).
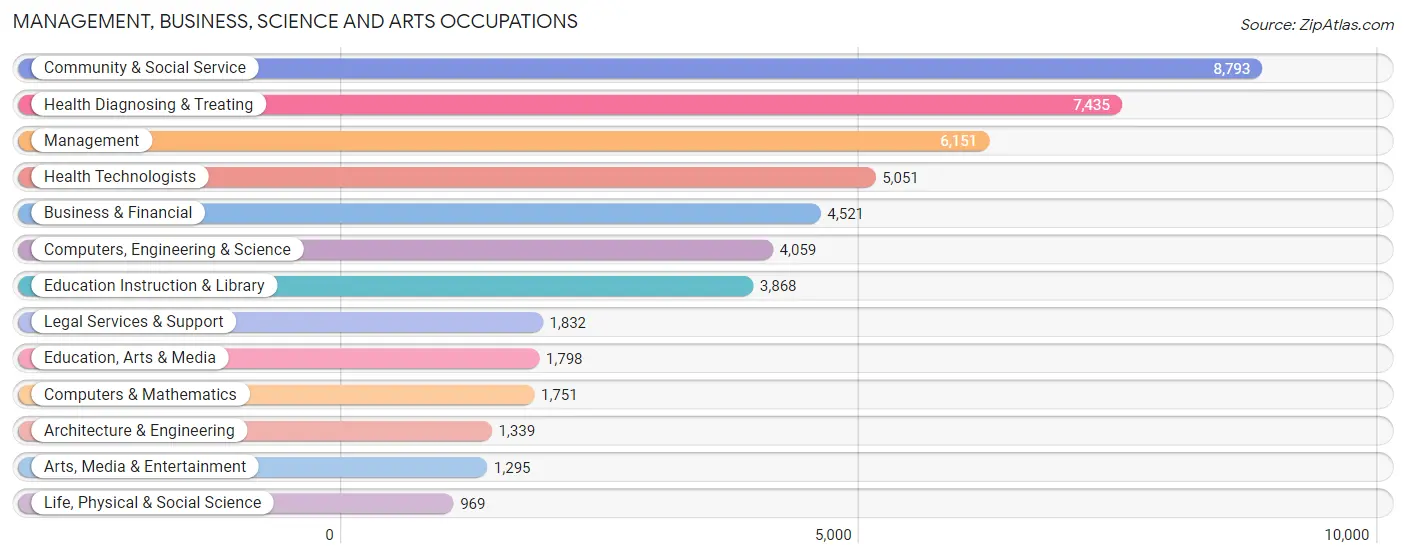
Management, Business, Science and Arts Occupations by Sex
Within the Management, Business, Science and Arts occupations in Kanawha County, the most male-oriented occupations are Architecture & Engineering (81.8%), Computers & Mathematics (77.6%), and Computers, Engineering & Science (71.9%), while the most female-oriented occupations are Health Diagnosing & Treating (74.0%), Education Instruction & Library (72.5%), and Health Technologists (70.7%).
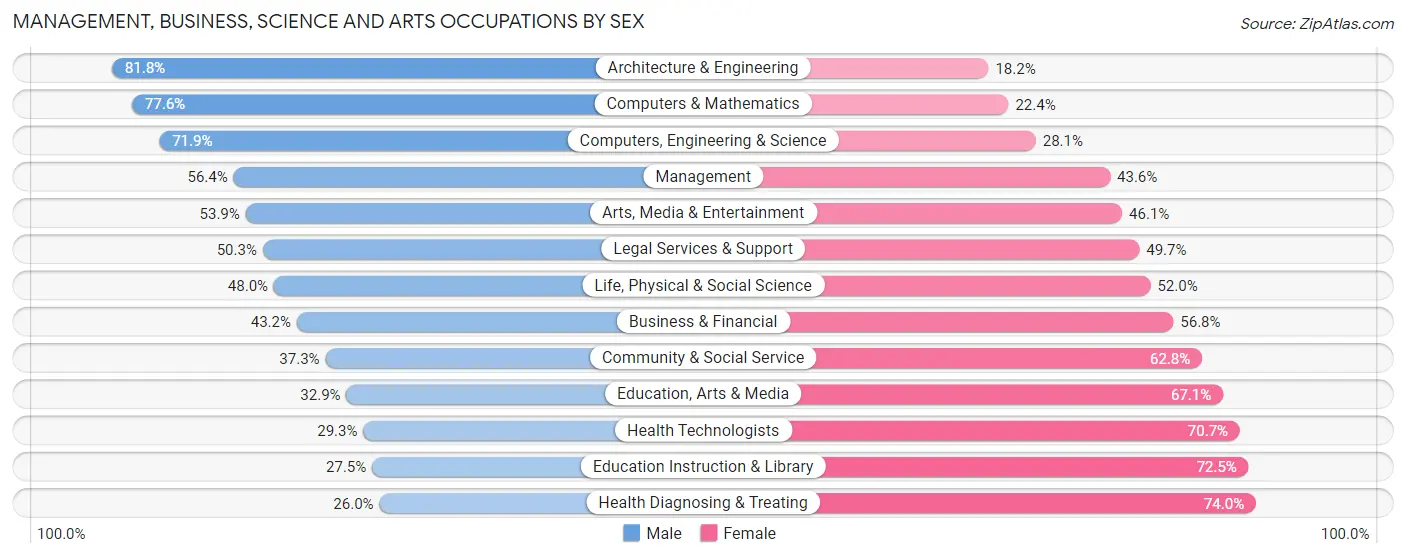
| Occupation | Male | Female |
| Management | 3,470 (56.4%) | 2,681 (43.6%) |
| Business & Financial | 1,954 (43.2%) | 2,567 (56.8%) |
| Computers, Engineering & Science | 2,919 (71.9%) | 1,140 (28.1%) |
| Computers & Mathematics | 1,359 (77.6%) | 392 (22.4%) |
| Architecture & Engineering | 1,095 (81.8%) | 244 (18.2%) |
| Life, Physical & Social Science | 465 (48.0%) | 504 (52.0%) |
| Community & Social Service | 3,275 (37.2%) | 5,518 (62.7%) |
| Education, Arts & Media | 591 (32.9%) | 1,207 (67.1%) |
| Legal Services & Support | 922 (50.3%) | 910 (49.7%) |
| Education Instruction & Library | 1,064 (27.5%) | 2,804 (72.5%) |
| Arts, Media & Entertainment | 698 (53.9%) | 597 (46.1%) |
| Health Diagnosing & Treating | 1,932 (26.0%) | 5,503 (74.0%) |
| Health Technologists | 1,482 (29.3%) | 3,569 (70.7%) |
| Total (Category) | 13,550 (43.8%) | 17,409 (56.2%) |
| Total (Overall) | 38,791 (50.5%) | 38,044 (49.5%) |
Services Occupations
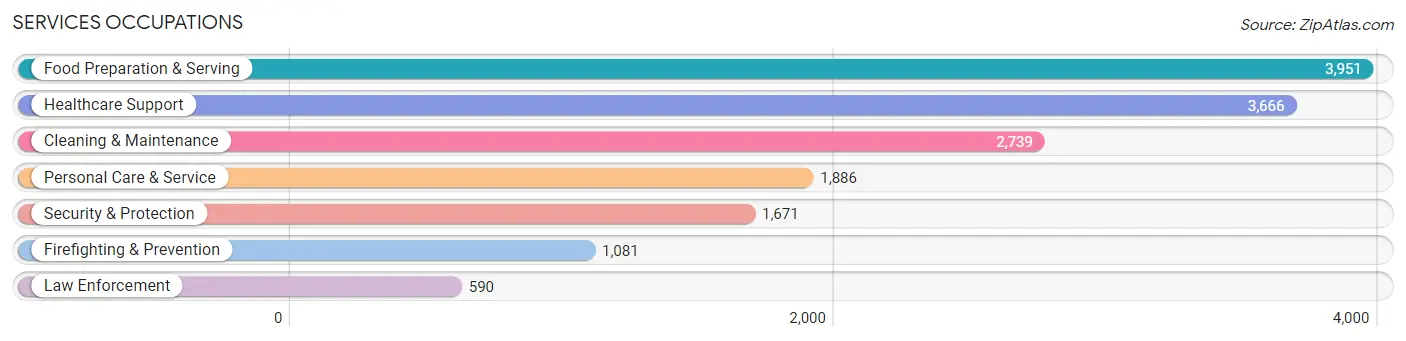
The most common Services occupations in Kanawha County are Food Preparation & Serving (3,951 | 5.1%), Healthcare Support (3,666 | 4.8%), Cleaning & Maintenance (2,739 | 3.6%), Personal Care & Service (1,886 | 2.5%), and Security & Protection (1,671 | 2.2%).
Services Occupations by Sex
Within the Services occupations in Kanawha County, the most male-oriented occupations are Firefighting & Prevention (89.7%), Security & Protection (89.2%), and Law Enforcement (88.1%), while the most female-oriented occupations are Healthcare Support (84.3%), Personal Care & Service (70.7%), and Food Preparation & Serving (58.2%).
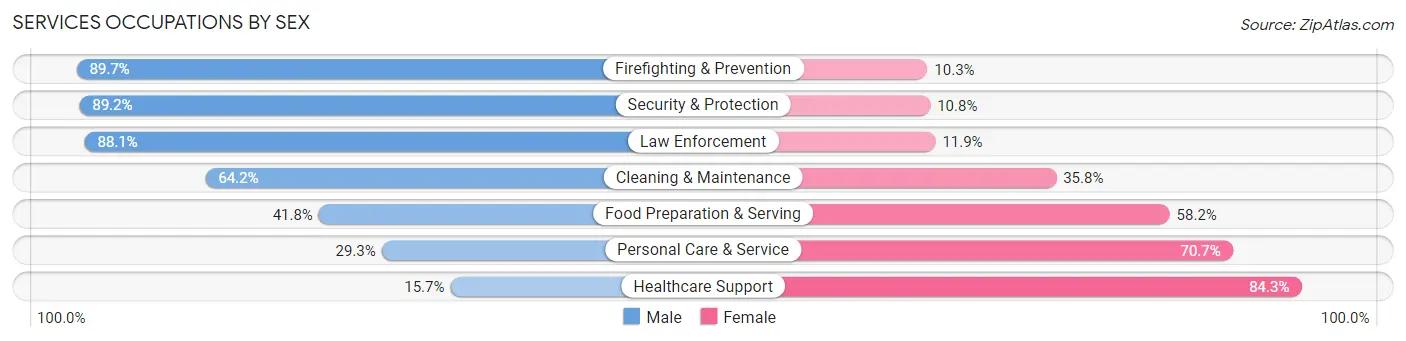
| Occupation | Male | Female |
| Healthcare Support | 576 (15.7%) | 3,090 (84.3%) |
| Security & Protection | 1,490 (89.2%) | 181 (10.8%) |
| Firefighting & Prevention | 970 (89.7%) | 111 (10.3%) |
| Law Enforcement | 520 (88.1%) | 70 (11.9%) |
| Food Preparation & Serving | 1,650 (41.8%) | 2,301 (58.2%) |
| Cleaning & Maintenance | 1,759 (64.2%) | 980 (35.8%) |
| Personal Care & Service | 553 (29.3%) | 1,333 (70.7%) |
| Total (Category) | 6,028 (43.3%) | 7,885 (56.7%) |
| Total (Overall) | 38,791 (50.5%) | 38,044 (49.5%) |
Sales and Office Occupations
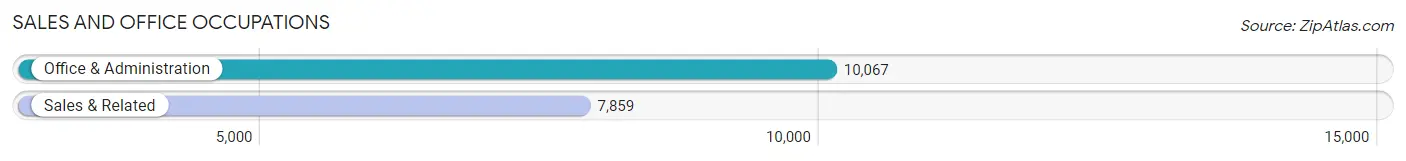
The most common Sales and Office occupations in Kanawha County are Office & Administration (10,067 | 13.1%), and Sales & Related (7,859 | 10.2%).
Sales and Office Occupations by Sex
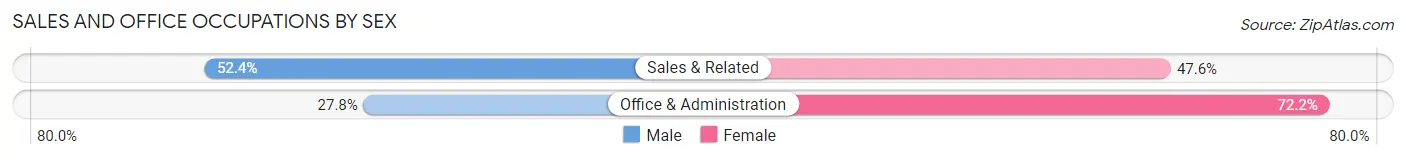
| Occupation | Male | Female |
| Sales & Related | 4,118 (52.4%) | 3,741 (47.6%) |
| Office & Administration | 2,803 (27.8%) | 7,264 (72.2%) |
| Total (Category) | 6,921 (38.6%) | 11,005 (61.4%) |
| Total (Overall) | 38,791 (50.5%) | 38,044 (49.5%) |
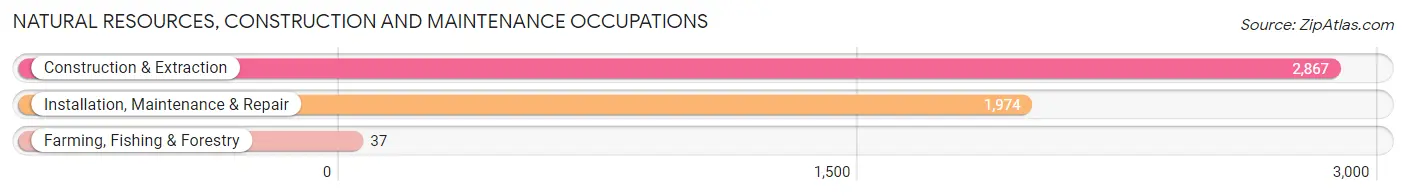
Natural Resources, Construction and Maintenance Occupations
The most common Natural Resources, Construction and Maintenance occupations in Kanawha County are Construction & Extraction (2,867 | 3.7%), Installation, Maintenance & Repair (1,974 | 2.6%), and Farming, Fishing & Forestry (37 | 0.1%).
Natural Resources, Construction and Maintenance Occupations by Sex
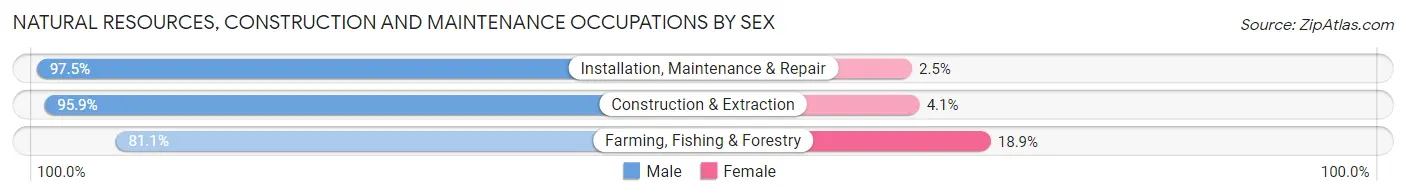
| Occupation | Male | Female |
| Farming, Fishing & Forestry | 30 (81.1%) | 7 (18.9%) |
| Construction & Extraction | 2,749 (95.9%) | 118 (4.1%) |
| Installation, Maintenance & Repair | 1,924 (97.5%) | 50 (2.5%) |
| Total (Category) | 4,703 (96.4%) | 175 (3.6%) |
| Total (Overall) | 38,791 (50.5%) | 38,044 (49.5%) |
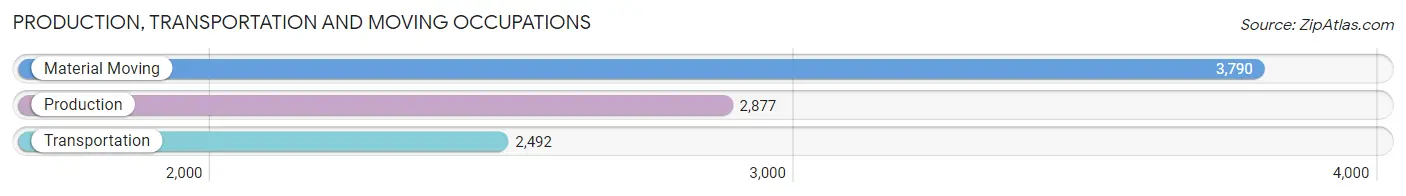
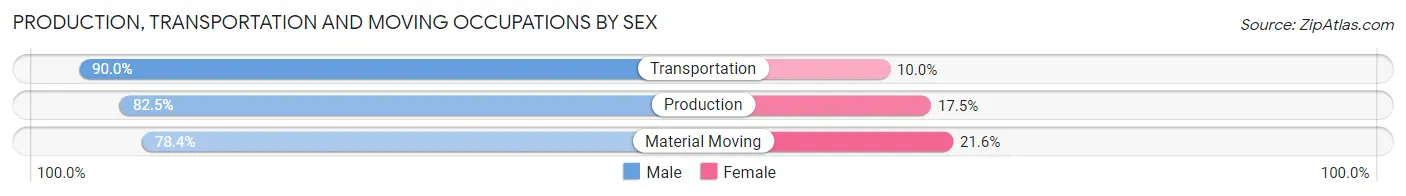
Production, Transportation and Moving Occupations
The most common Production, Transportation and Moving occupations in Kanawha County are Material Moving (3,790 | 4.9%), Production (2,877 | 3.7%), and Transportation (2,492 | 3.2%).
Production, Transportation and Moving Occupations by Sex
| Occupation | Male | Female |
| Production | 2,373 (82.5%) | 504 (17.5%) |
| Transportation | 2,243 (90.0%) | 249 (10.0%) |
| Material Moving | 2,973 (78.4%) | 817 (21.6%) |
| Total (Category) | 7,589 (82.9%) | 1,570 (17.1%) |
| Total (Overall) | 38,791 (50.5%) | 38,044 (49.5%) |
Employment Industries by Sex in Kanawha County
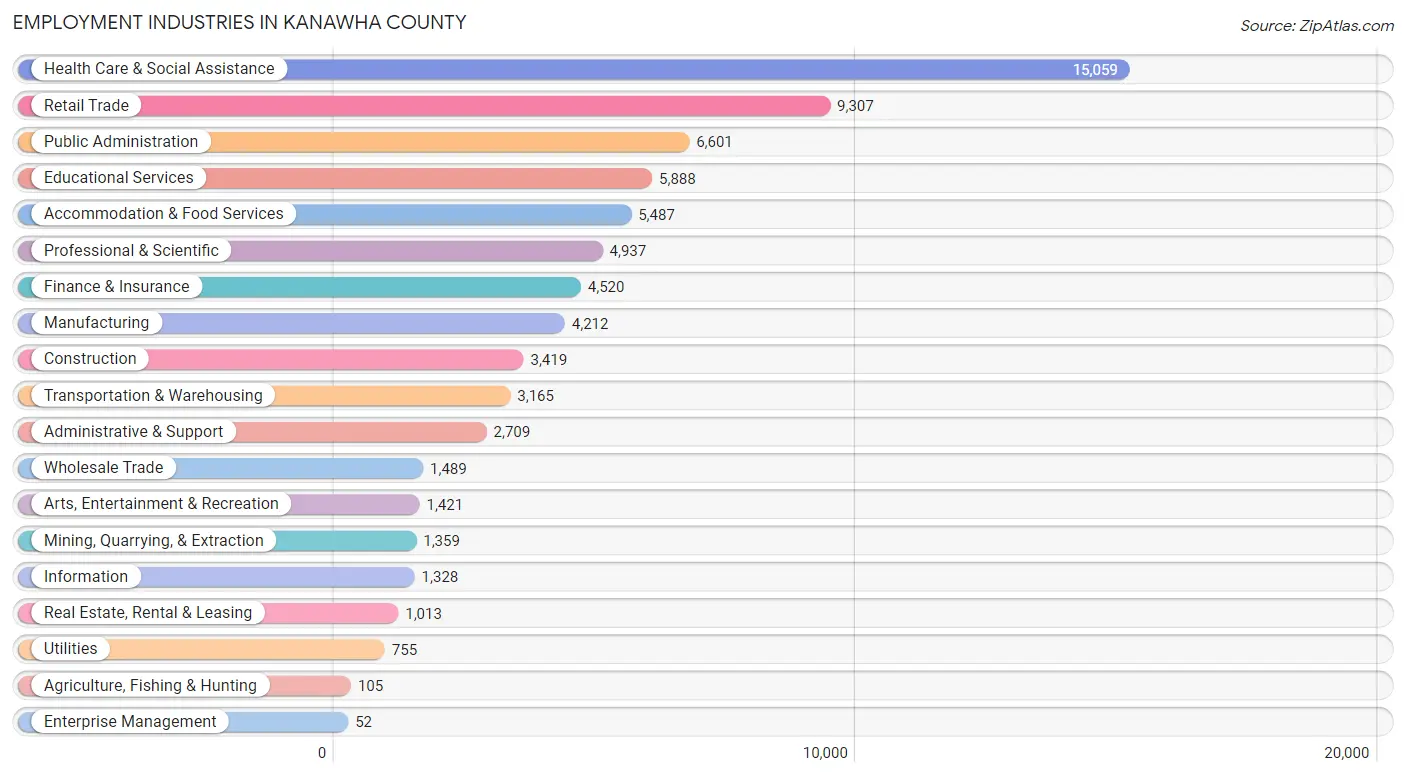
Employment Industries in Kanawha County
The major employment industries in Kanawha County include Health Care & Social Assistance (15,059 | 19.6%), Retail Trade (9,307 | 12.1%), Public Administration (6,601 | 8.6%), Educational Services (5,888 | 7.7%), and Accommodation & Food Services (5,487 | 7.1%).
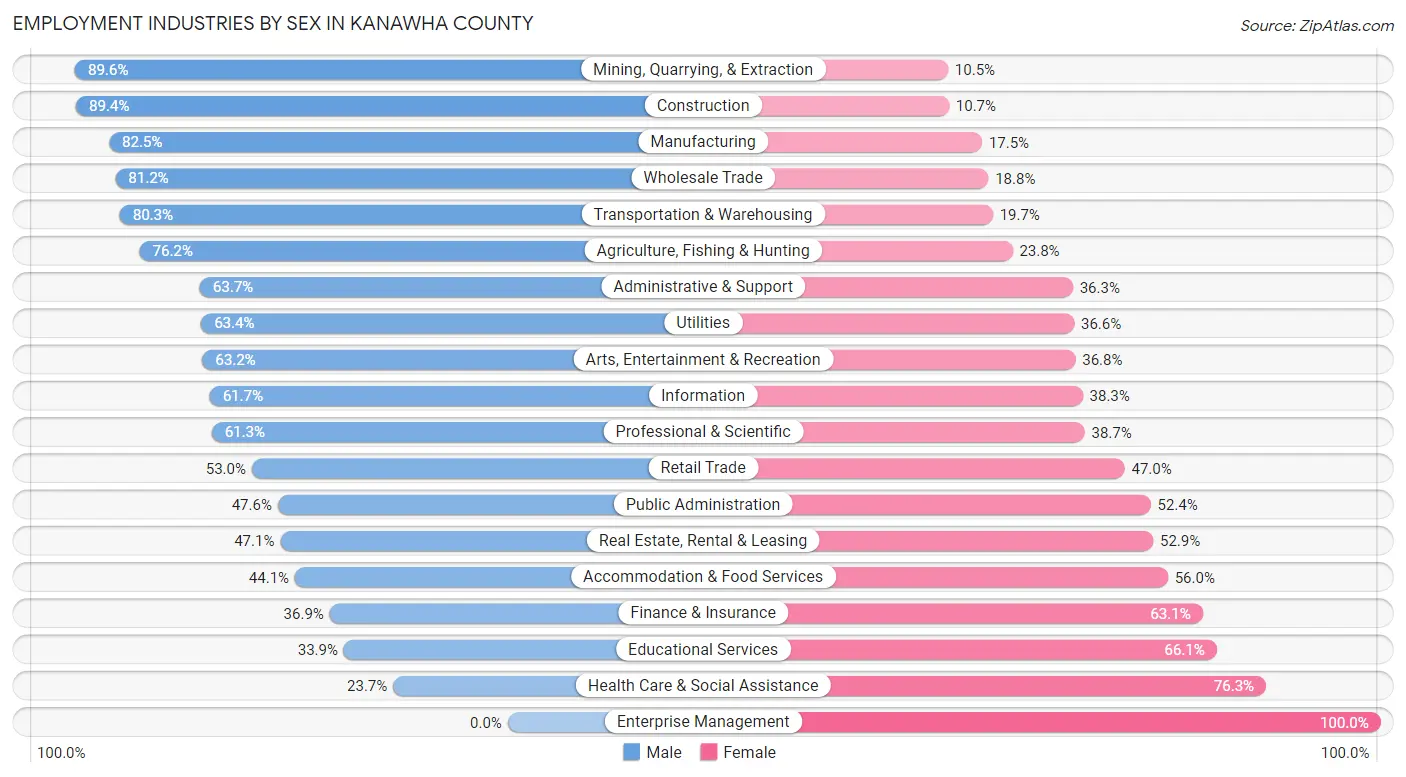
Employment Industries by Sex in Kanawha County
The Kanawha County industries that see more men than women are Mining, Quarrying, & Extraction (89.5%), Construction (89.3%), and Manufacturing (82.5%), whereas the industries that tend to have a higher number of women are Enterprise Management (100.0%), Health Care & Social Assistance (76.3%), and Educational Services (66.1%).
| Industry | Male | Female |
| Agriculture, Fishing & Hunting | 80 (76.2%) | 25 (23.8%) |
| Mining, Quarrying, & Extraction | 1,217 (89.5%) | 142 (10.4%) |
| Construction | 3,055 (89.3%) | 364 (10.6%) |
| Manufacturing | 3,475 (82.5%) | 737 (17.5%) |
| Wholesale Trade | 1,209 (81.2%) | 280 (18.8%) |
| Retail Trade | 4,931 (53.0%) | 4,376 (47.0%) |
| Transportation & Warehousing | 2,541 (80.3%) | 624 (19.7%) |
| Utilities | 479 (63.4%) | 276 (36.6%) |
| Information | 819 (61.7%) | 509 (38.3%) |
| Finance & Insurance | 1,666 (36.9%) | 2,854 (63.1%) |
| Real Estate, Rental & Leasing | 477 (47.1%) | 536 (52.9%) |
| Professional & Scientific | 3,025 (61.3%) | 1,912 (38.7%) |
| Enterprise Management | 0 (0.0%) | 52 (100.0%) |
| Administrative & Support | 1,726 (63.7%) | 983 (36.3%) |
| Educational Services | 1,998 (33.9%) | 3,890 (66.1%) |
| Health Care & Social Assistance | 3,573 (23.7%) | 11,486 (76.3%) |
| Arts, Entertainment & Recreation | 898 (63.2%) | 523 (36.8%) |
| Accommodation & Food Services | 2,417 (44.1%) | 3,070 (55.9%) |
| Public Administration | 3,143 (47.6%) | 3,458 (52.4%) |
| Total | 38,791 (50.5%) | 38,044 (49.5%) |
Education in Kanawha County
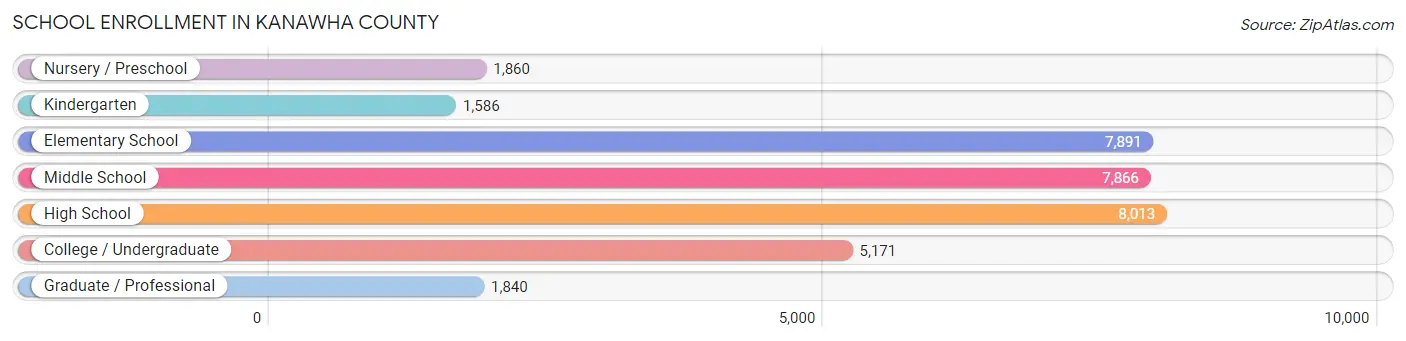
School Enrollment in Kanawha County
The most common levels of schooling among the 34,227 students in Kanawha County are high school (8,013 | 23.4%), elementary school (7,891 | 23.1%), and middle school (7,866 | 23.0%).
| School Level | # Students | % Students |
| Nursery / Preschool | 1,860 | 5.4% |
| Kindergarten | 1,586 | 4.6% |
| Elementary School | 7,891 | 23.1% |
| Middle School | 7,866 | 23.0% |
| High School | 8,013 | 23.4% |
| College / Undergraduate | 5,171 | 15.1% |
| Graduate / Professional | 1,840 | 5.4% |
| Total | 34,227 | 100.0% |
School Enrollment by Age by Funding Source in Kanawha County
Out of a total of 34,227 students who are enrolled in schools in Kanawha County, 5,134 (15.0%) attend a private institution, while the remaining 29,093 (85.0%) are enrolled in public schools. The age group of 35 years and over has the highest likelihood of being enrolled in private schools, with 453 (33.0% in the age bracket) enrolled. Conversely, the age group of 15 to 17 year olds has the lowest likelihood of being enrolled in a private school, with 5,769 (95.7% in the age bracket) attending a public institution.
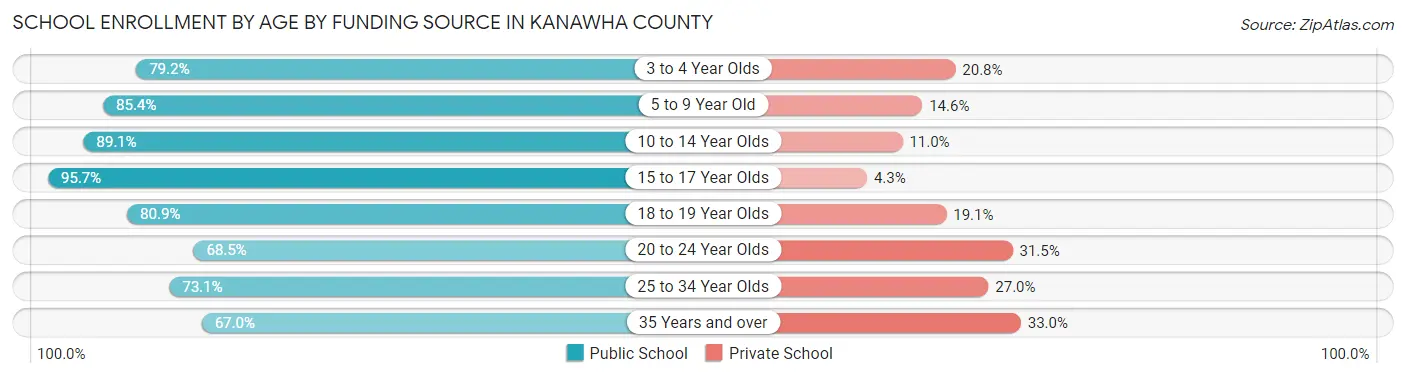
| Age Bracket | Public School | Private School |
| 3 to 4 Year Olds | 777 (79.2%) | 204 (20.8%) |
| 5 to 9 Year Old | 8,080 (85.4%) | 1,385 (14.6%) |
| 10 to 14 Year Olds | 8,393 (89.0%) | 1,032 (11.0%) |
| 15 to 17 Year Olds | 5,769 (95.7%) | 262 (4.3%) |
| 18 to 19 Year Olds | 1,972 (80.9%) | 466 (19.1%) |
| 20 to 24 Year Olds | 1,723 (68.5%) | 791 (31.5%) |
| 25 to 34 Year Olds | 1,461 (73.1%) | 539 (27.0%) |
| 35 Years and over | 920 (67.0%) | 453 (33.0%) |
| Total | 29,093 (85.0%) | 5,134 (15.0%) |
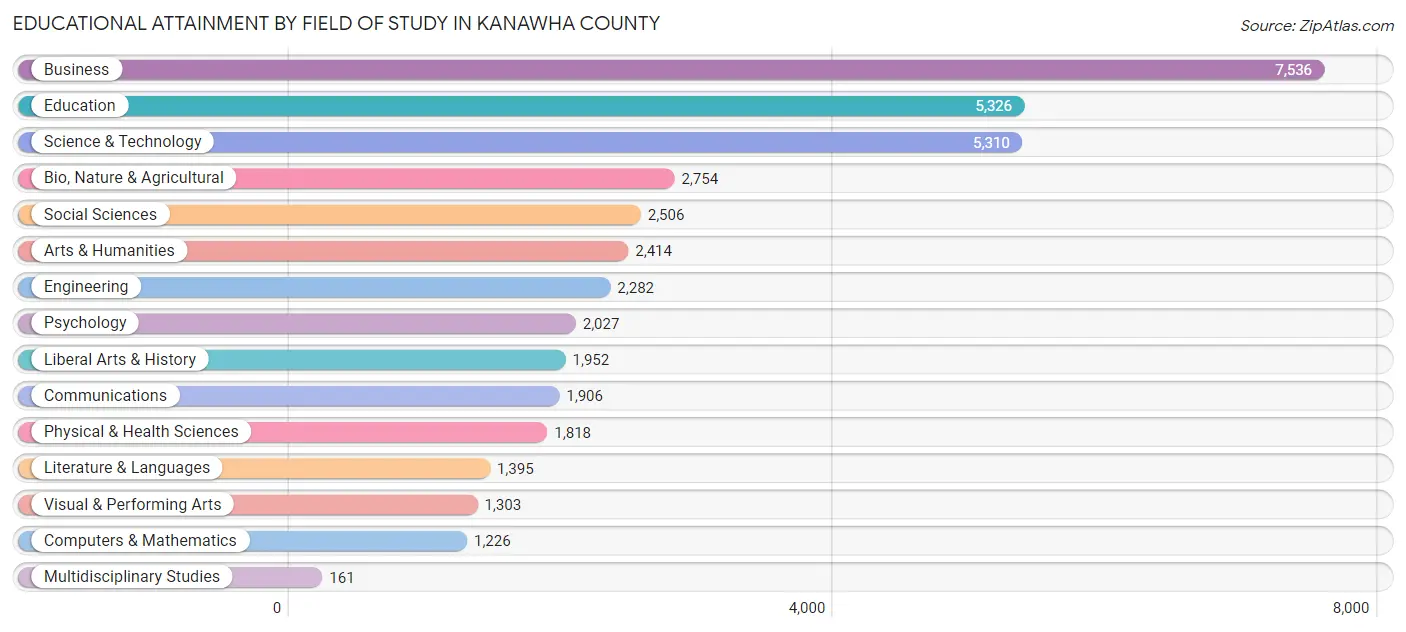
Educational Attainment by Field of Study in Kanawha County
Business (7,536 | 18.9%), education (5,326 | 13.3%), science & technology (5,310 | 13.3%), bio, nature & agricultural (2,754 | 6.9%), and social sciences (2,506 | 6.3%) are the most common fields of study among 39,916 individuals in Kanawha County who have obtained a bachelor's degree or higher.
| Field of Study | # Graduates | % Graduates |
| Computers & Mathematics | 1,226 | 3.1% |
| Bio, Nature & Agricultural | 2,754 | 6.9% |
| Physical & Health Sciences | 1,818 | 4.5% |
| Psychology | 2,027 | 5.1% |
| Social Sciences | 2,506 | 6.3% |
| Engineering | 2,282 | 5.7% |
| Multidisciplinary Studies | 161 | 0.4% |
| Science & Technology | 5,310 | 13.3% |
| Business | 7,536 | 18.9% |
| Education | 5,326 | 13.3% |
| Literature & Languages | 1,395 | 3.5% |
| Liberal Arts & History | 1,952 | 4.9% |
| Visual & Performing Arts | 1,303 | 3.3% |
| Communications | 1,906 | 4.8% |
| Arts & Humanities | 2,414 | 6.0% |
| Total | 39,916 | 100.0% |
Transportation & Commute in Kanawha County
Vehicle Availability by Sex in Kanawha County
The most prevalent vehicle ownership categories in Kanawha County are males with 2 vehicles (17,992, accounting for 46.6%) and females with 2 vehicles (16,064, making up 48.2%).
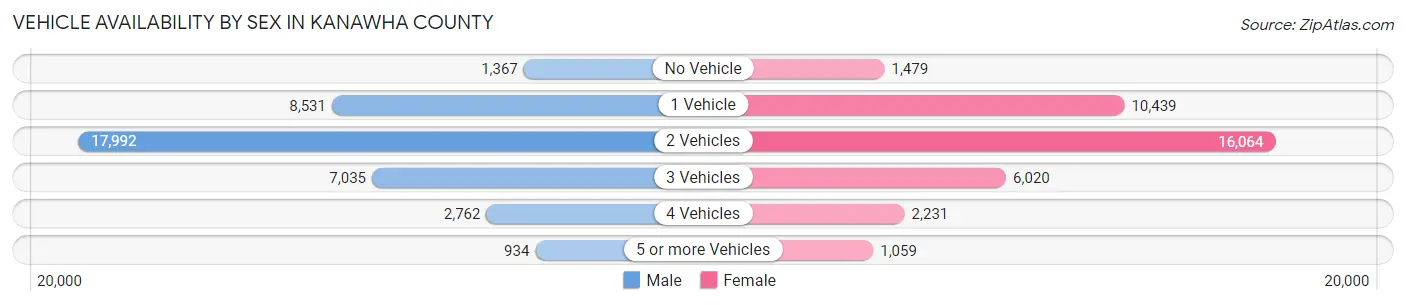
| Vehicles Available | Male | Female |
| No Vehicle | 1,367 (3.5%) | 1,479 (4.0%) |
| 1 Vehicle | 8,531 (22.1%) | 10,439 (28.0%) |
| 2 Vehicles | 17,992 (46.6%) | 16,064 (43.1%) |
| 3 Vehicles | 7,035 (18.2%) | 6,020 (16.1%) |
| 4 Vehicles | 2,762 (7.1%) | 2,231 (6.0%) |
| 5 or more Vehicles | 934 (2.4%) | 1,059 (2.8%) |
| Total | 38,621 (100.0%) | 37,292 (100.0%) |
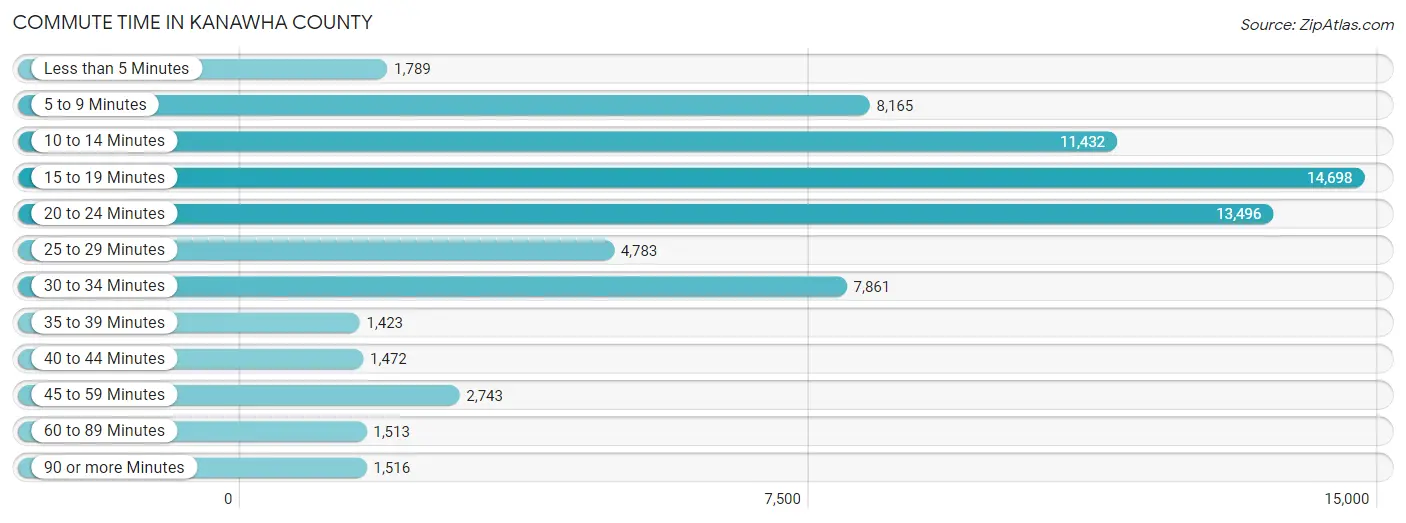
Commute Time in Kanawha County
The most frequently occuring commute durations in Kanawha County are 15 to 19 minutes (14,698 commuters, 20.7%), 20 to 24 minutes (13,496 commuters, 19.0%), and 10 to 14 minutes (11,432 commuters, 16.1%).
| Commute Time | # Commuters | % Commuters |
| Less than 5 Minutes | 1,789 | 2.5% |
| 5 to 9 Minutes | 8,165 | 11.5% |
| 10 to 14 Minutes | 11,432 | 16.1% |
| 15 to 19 Minutes | 14,698 | 20.7% |
| 20 to 24 Minutes | 13,496 | 19.0% |
| 25 to 29 Minutes | 4,783 | 6.8% |
| 30 to 34 Minutes | 7,861 | 11.1% |
| 35 to 39 Minutes | 1,423 | 2.0% |
| 40 to 44 Minutes | 1,472 | 2.1% |
| 45 to 59 Minutes | 2,743 | 3.9% |
| 60 to 89 Minutes | 1,513 | 2.1% |
| 90 or more Minutes | 1,516 | 2.1% |
Commute Time by Sex in Kanawha County
The most common commute times in Kanawha County are 15 to 19 minutes (7,651 commuters, 20.9%) for males and 15 to 19 minutes (7,047 commuters, 20.6%) for females.
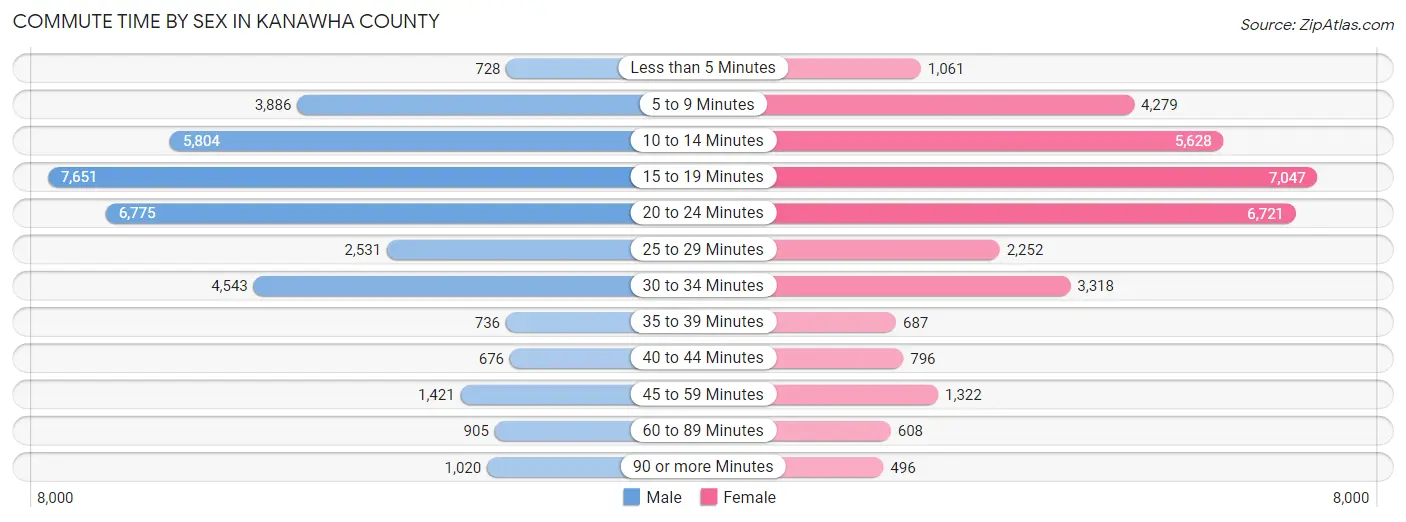
| Commute Time | Male | Female |
| Less than 5 Minutes | 728 (2.0%) | 1,061 (3.1%) |
| 5 to 9 Minutes | 3,886 (10.6%) | 4,279 (12.5%) |
| 10 to 14 Minutes | 5,804 (15.8%) | 5,628 (16.5%) |
| 15 to 19 Minutes | 7,651 (20.9%) | 7,047 (20.6%) |
| 20 to 24 Minutes | 6,775 (18.5%) | 6,721 (19.6%) |
| 25 to 29 Minutes | 2,531 (6.9%) | 2,252 (6.6%) |
| 30 to 34 Minutes | 4,543 (12.4%) | 3,318 (9.7%) |
| 35 to 39 Minutes | 736 (2.0%) | 687 (2.0%) |
| 40 to 44 Minutes | 676 (1.8%) | 796 (2.3%) |
| 45 to 59 Minutes | 1,421 (3.9%) | 1,322 (3.9%) |
| 60 to 89 Minutes | 905 (2.5%) | 608 (1.8%) |
| 90 or more Minutes | 1,020 (2.8%) | 496 (1.5%) |
Time of Departure to Work by Sex in Kanawha County
The most frequent times of departure to work in Kanawha County are 7:00 AM to 7:29 AM (4,929, 13.4%) for males and 7:30 AM to 7:59 AM (5,811, 17.0%) for females.
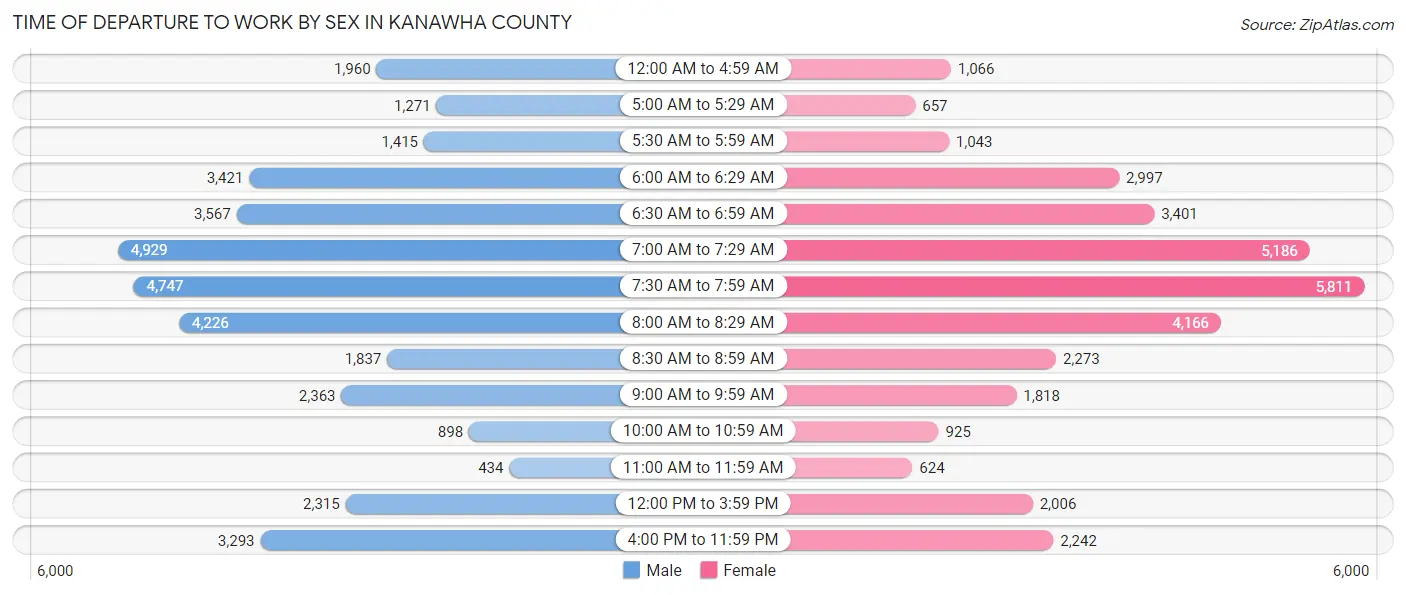
| Time of Departure | Male | Female |
| 12:00 AM to 4:59 AM | 1,960 (5.3%) | 1,066 (3.1%) |
| 5:00 AM to 5:29 AM | 1,271 (3.5%) | 657 (1.9%) |
| 5:30 AM to 5:59 AM | 1,415 (3.9%) | 1,043 (3.0%) |
| 6:00 AM to 6:29 AM | 3,421 (9.3%) | 2,997 (8.8%) |
| 6:30 AM to 6:59 AM | 3,567 (9.7%) | 3,401 (9.9%) |
| 7:00 AM to 7:29 AM | 4,929 (13.4%) | 5,186 (15.2%) |
| 7:30 AM to 7:59 AM | 4,747 (12.9%) | 5,811 (17.0%) |
| 8:00 AM to 8:29 AM | 4,226 (11.5%) | 4,166 (12.2%) |
| 8:30 AM to 8:59 AM | 1,837 (5.0%) | 2,273 (6.6%) |
| 9:00 AM to 9:59 AM | 2,363 (6.4%) | 1,818 (5.3%) |
| 10:00 AM to 10:59 AM | 898 (2.5%) | 925 (2.7%) |
| 11:00 AM to 11:59 AM | 434 (1.2%) | 624 (1.8%) |
| 12:00 PM to 3:59 PM | 2,315 (6.3%) | 2,006 (5.9%) |
| 4:00 PM to 11:59 PM | 3,293 (9.0%) | 2,242 (6.6%) |
| Total | 36,676 (100.0%) | 34,215 (100.0%) |
Housing Occupancy in Kanawha County
Occupancy by Ownership in Kanawha County
Of the total 77,252 dwellings in Kanawha County, owner-occupied units account for 53,855 (69.7%), while renter-occupied units make up 23,397 (30.3%).
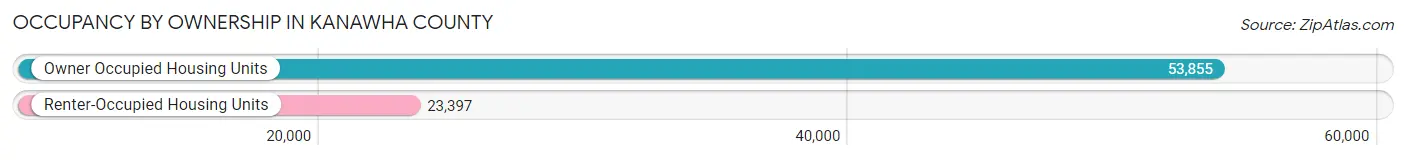
| Occupancy | # Housing Units | % Housing Units |
| Owner Occupied Housing Units | 53,855 | 69.7% |
| Renter-Occupied Housing Units | 23,397 | 30.3% |
| Total Occupied Housing Units | 77,252 | 100.0% |
Occupancy by Household Size in Kanawha County
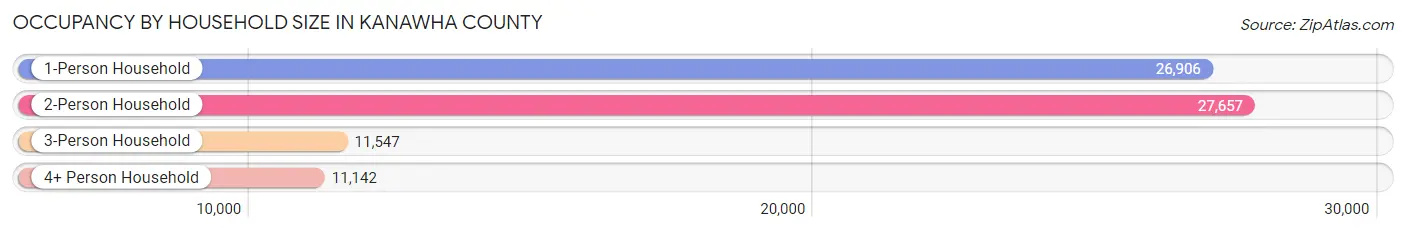
| Household Size | # Housing Units | % Housing Units |
| 1-Person Household | 26,906 | 34.8% |
| 2-Person Household | 27,657 | 35.8% |
| 3-Person Household | 11,547 | 14.9% |
| 4+ Person Household | 11,142 | 14.4% |
| Total Housing Units | 77,252 | 100.0% |
Occupancy by Ownership by Household Size in Kanawha County
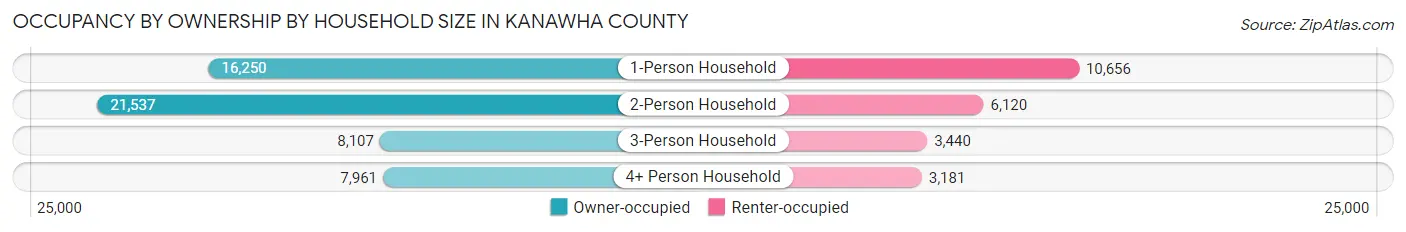
| Household Size | Owner-occupied | Renter-occupied |
| 1-Person Household | 16,250 (60.4%) | 10,656 (39.6%) |
| 2-Person Household | 21,537 (77.9%) | 6,120 (22.1%) |
| 3-Person Household | 8,107 (70.2%) | 3,440 (29.8%) |
| 4+ Person Household | 7,961 (71.5%) | 3,181 (28.5%) |
| Total Housing Units | 53,855 (69.7%) | 23,397 (30.3%) |
Occupancy by Educational Attainment in Kanawha County
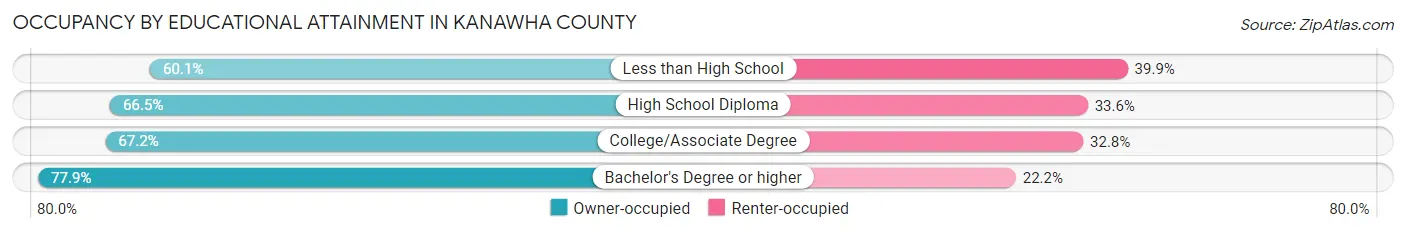
| Household Size | Owner-occupied | Renter-occupied |
| Less than High School | 3,573 (60.1%) | 2,371 (39.9%) |
| High School Diploma | 16,789 (66.4%) | 8,476 (33.6%) |
| College/Associate Degree | 14,797 (67.2%) | 7,230 (32.8%) |
| Bachelor's Degree or higher | 18,696 (77.8%) | 5,320 (22.2%) |
Occupancy by Age of Householder in Kanawha County
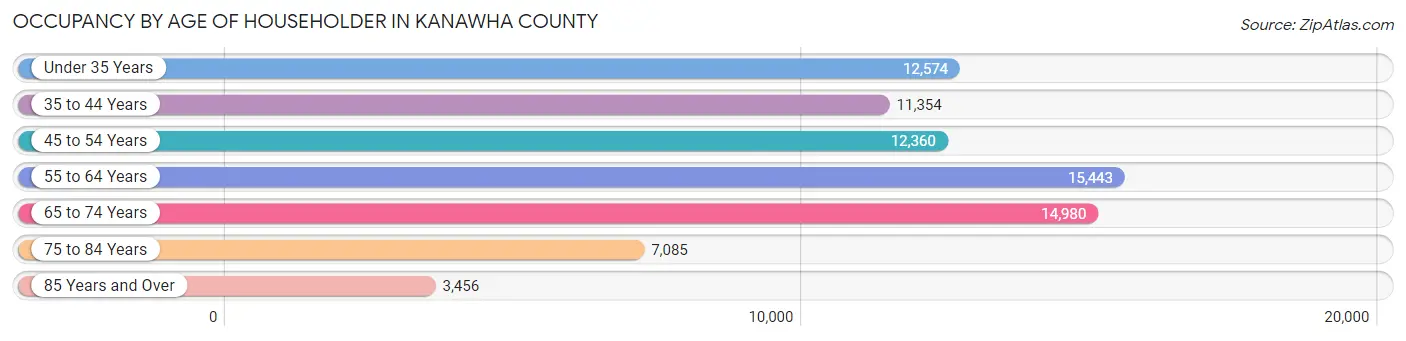
| Age Bracket | # Households | % Households |
| Under 35 Years | 12,574 | 16.3% |
| 35 to 44 Years | 11,354 | 14.7% |
| 45 to 54 Years | 12,360 | 16.0% |
| 55 to 64 Years | 15,443 | 20.0% |
| 65 to 74 Years | 14,980 | 19.4% |
| 75 to 84 Years | 7,085 | 9.2% |
| 85 Years and Over | 3,456 | 4.5% |
| Total | 77,252 | 100.0% |
Housing Finances in Kanawha County
Median Income by Occupancy in Kanawha County
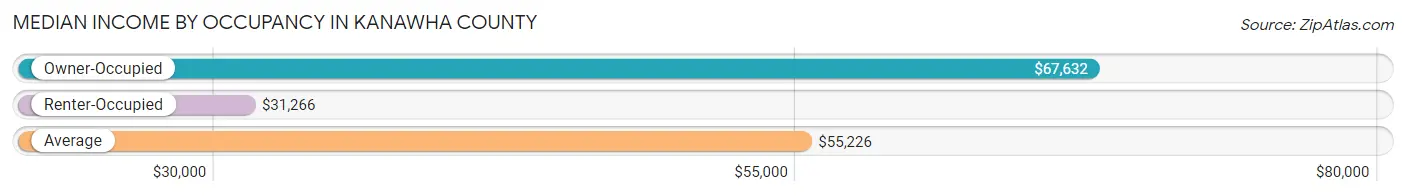
| Occupancy Type | # Households | Median Income |
| Owner-Occupied | 53,855 (69.7%) | $67,632 |
| Renter-Occupied | 23,397 (30.3%) | $31,266 |
| Average | 77,252 (100.0%) | $55,226 |
Occupancy by Householder Income Bracket in Kanawha County
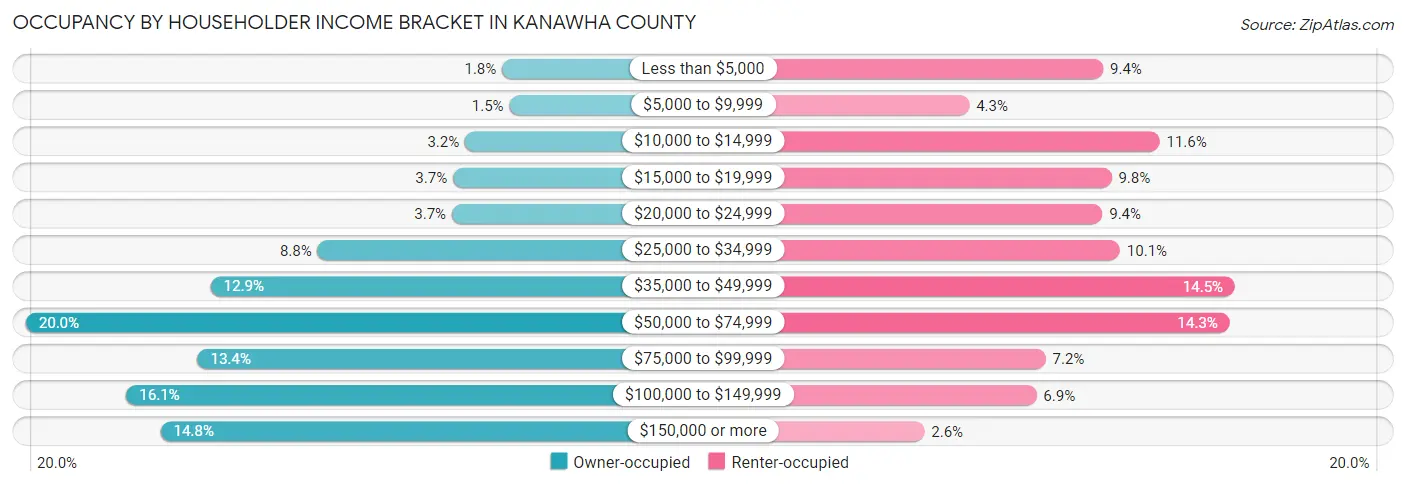
| Income Bracket | Owner-occupied | Renter-occupied |
| Less than $5,000 | 977 (1.8%) | 2,207 (9.4%) |
| $5,000 to $9,999 | 822 (1.5%) | 1,012 (4.3%) |
| $10,000 to $14,999 | 1,733 (3.2%) | 2,710 (11.6%) |
| $15,000 to $19,999 | 1,980 (3.7%) | 2,282 (9.8%) |
| $20,000 to $24,999 | 2,006 (3.7%) | 2,199 (9.4%) |
| $25,000 to $34,999 | 4,762 (8.8%) | 2,356 (10.1%) |
| $35,000 to $49,999 | 6,950 (12.9%) | 3,381 (14.4%) |
| $50,000 to $74,999 | 10,746 (20.0%) | 3,333 (14.2%) |
| $75,000 to $99,999 | 7,221 (13.4%) | 1,694 (7.2%) |
| $100,000 to $149,999 | 8,679 (16.1%) | 1,611 (6.9%) |
| $150,000 or more | 7,979 (14.8%) | 612 (2.6%) |
| Total | 53,855 (100.0%) | 23,397 (100.0%) |
Monthly Housing Cost Tiers in Kanawha County
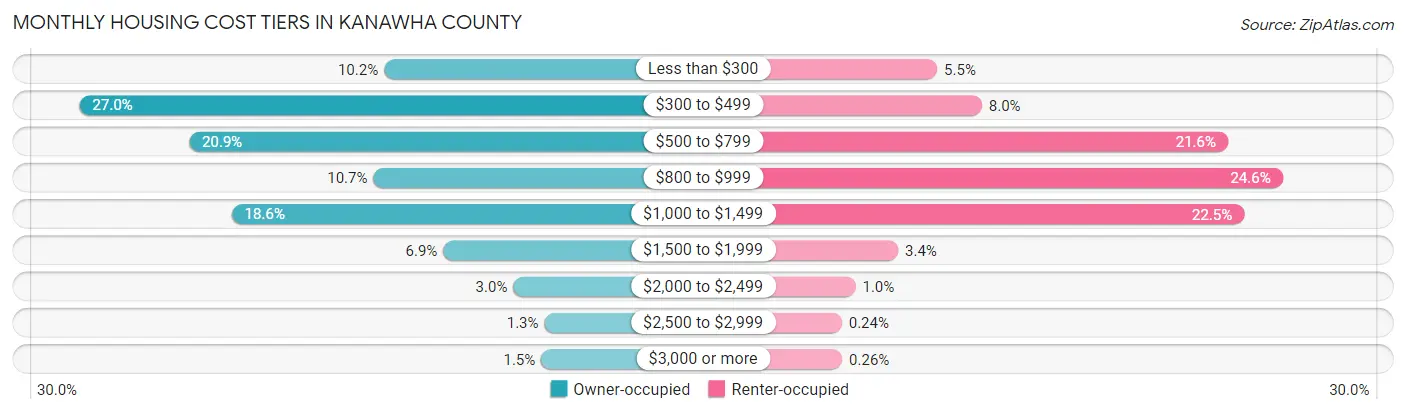
| Monthly Cost | Owner-occupied | Renter-occupied |
| Less than $300 | 5,468 (10.2%) | 1,290 (5.5%) |
| $300 to $499 | 14,525 (27.0%) | 1,866 (8.0%) |
| $500 to $799 | 11,269 (20.9%) | 5,044 (21.6%) |
| $800 to $999 | 5,783 (10.7%) | 5,750 (24.6%) |
| $1,000 to $1,499 | 10,000 (18.6%) | 5,256 (22.5%) |
| $1,500 to $1,999 | 3,703 (6.9%) | 784 (3.4%) |
| $2,000 to $2,499 | 1,621 (3.0%) | 234 (1.0%) |
| $2,500 to $2,999 | 693 (1.3%) | 56 (0.2%) |
| $3,000 or more | 793 (1.5%) | 60 (0.3%) |
| Total | 53,855 (100.0%) | 23,397 (100.0%) |
Physical Housing Characteristics in Kanawha County
Housing Structures in Kanawha County
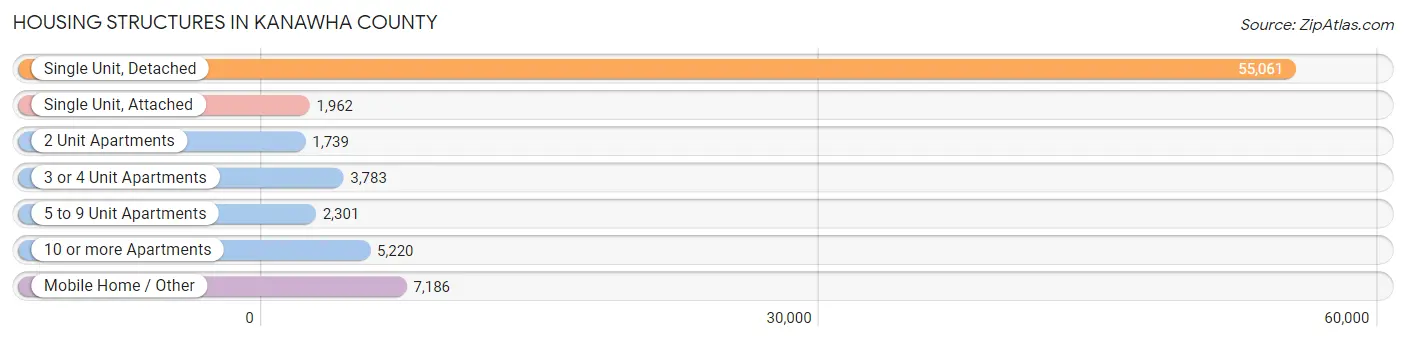
| Structure Type | # Housing Units | % Housing Units |
| Single Unit, Detached | 55,061 | 71.3% |
| Single Unit, Attached | 1,962 | 2.5% |
| 2 Unit Apartments | 1,739 | 2.2% |
| 3 or 4 Unit Apartments | 3,783 | 4.9% |
| 5 to 9 Unit Apartments | 2,301 | 3.0% |
| 10 or more Apartments | 5,220 | 6.8% |
| Mobile Home / Other | 7,186 | 9.3% |
| Total | 77,252 | 100.0% |
Housing Structures by Occupancy in Kanawha County
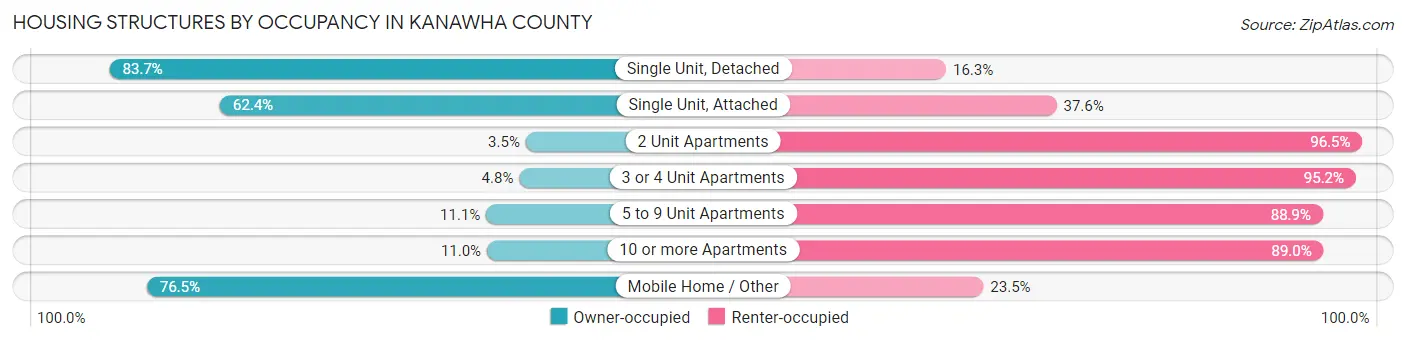
| Structure Type | Owner-occupied | Renter-occupied |
| Single Unit, Detached | 46,066 (83.7%) | 8,995 (16.3%) |
| Single Unit, Attached | 1,224 (62.4%) | 738 (37.6%) |
| 2 Unit Apartments | 61 (3.5%) | 1,678 (96.5%) |
| 3 or 4 Unit Apartments | 180 (4.8%) | 3,603 (95.2%) |
| 5 to 9 Unit Apartments | 256 (11.1%) | 2,045 (88.9%) |
| 10 or more Apartments | 573 (11.0%) | 4,647 (89.0%) |
| Mobile Home / Other | 5,495 (76.5%) | 1,691 (23.5%) |
| Total | 53,855 (69.7%) | 23,397 (30.3%) |
Housing Structures by Number of Rooms in Kanawha County
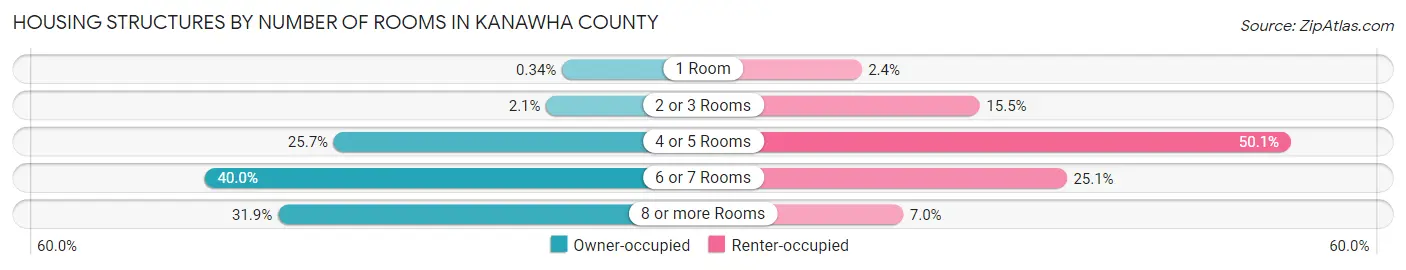
| Number of Rooms | Owner-occupied | Renter-occupied |
| 1 Room | 181 (0.3%) | 551 (2.4%) |
| 2 or 3 Rooms | 1,125 (2.1%) | 3,622 (15.5%) |
| 4 or 5 Rooms | 13,824 (25.7%) | 11,710 (50.0%) |
| 6 or 7 Rooms | 21,560 (40.0%) | 5,882 (25.1%) |
| 8 or more Rooms | 17,165 (31.9%) | 1,632 (7.0%) |
| Total | 53,855 (100.0%) | 23,397 (100.0%) |
Housing Structure by Heating Type in Kanawha County
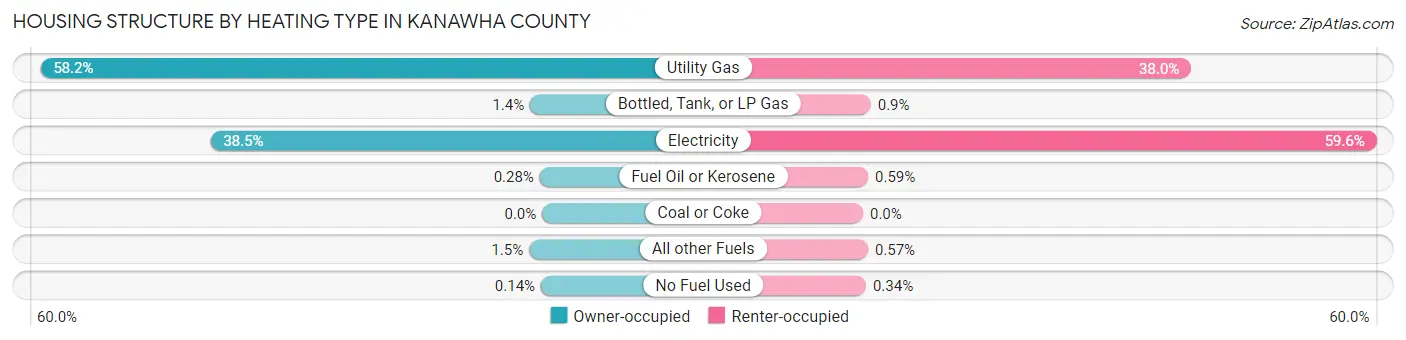
| Heating Type | Owner-occupied | Renter-occupied |
| Utility Gas | 31,336 (58.2%) | 8,901 (38.0%) |
| Bottled, Tank, or LP Gas | 755 (1.4%) | 210 (0.9%) |
| Electricity | 20,725 (38.5%) | 13,934 (59.6%) |
| Fuel Oil or Kerosene | 150 (0.3%) | 138 (0.6%) |
| Coal or Coke | 0 (0.0%) | 0 (0.0%) |
| All other Fuels | 811 (1.5%) | 134 (0.6%) |
| No Fuel Used | 78 (0.1%) | 80 (0.3%) |
| Total | 53,855 (100.0%) | 23,397 (100.0%) |
Household Vehicle Usage in Kanawha County
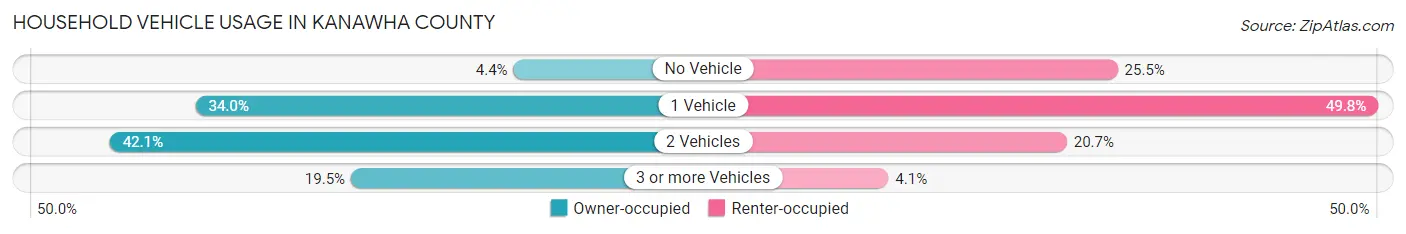
| Vehicles per Household | Owner-occupied | Renter-occupied |
| No Vehicle | 2,351 (4.4%) | 5,957 (25.5%) |
| 1 Vehicle | 18,333 (34.0%) | 11,644 (49.8%) |
| 2 Vehicles | 22,647 (42.0%) | 4,845 (20.7%) |
| 3 or more Vehicles | 10,524 (19.5%) | 951 (4.1%) |
| Total | 53,855 (100.0%) | 23,397 (100.0%) |
Real Estate & Mortgages in Kanawha County
Real Estate and Mortgage Overview in Kanawha County
| Characteristic | Without Mortgage | With Mortgage |
| Housing Units | 28,890 | 24,965 |
| Median Property Value | $108,100 | $154,700 |
| Median Household Income | $53,052 | $5,255 |
| Monthly Housing Costs | $418 | $789 |
| Real Estate Taxes | $781 | $492 |
Property Value by Mortgage Status in Kanawha County
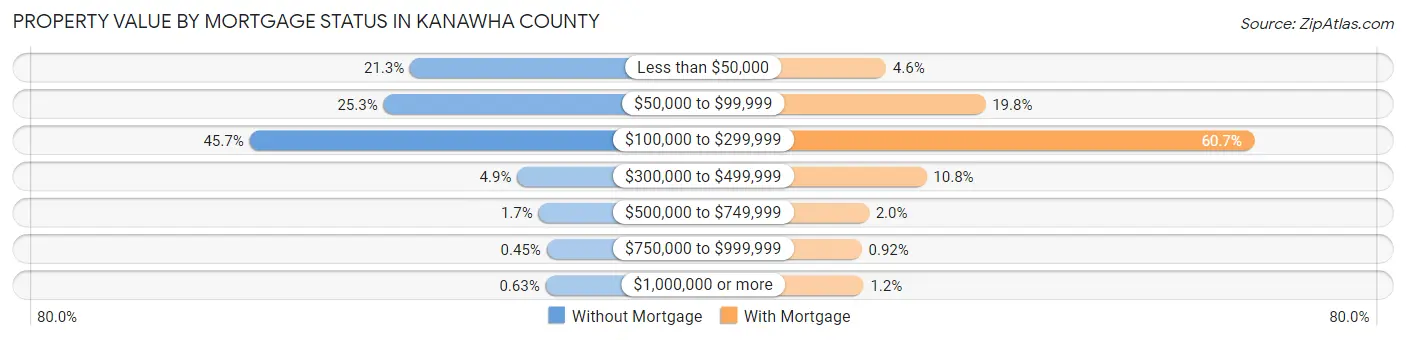
| Property Value | Without Mortgage | With Mortgage |
| Less than $50,000 | 6,143 (21.3%) | 1,156 (4.6%) |
| $50,000 to $99,999 | 7,313 (25.3%) | 4,933 (19.8%) |
| $100,000 to $299,999 | 13,211 (45.7%) | 15,146 (60.7%) |
| $300,000 to $499,999 | 1,424 (4.9%) | 2,697 (10.8%) |
| $500,000 to $749,999 | 488 (1.7%) | 502 (2.0%) |
| $750,000 to $999,999 | 129 (0.4%) | 230 (0.9%) |
| $1,000,000 or more | 182 (0.6%) | 301 (1.2%) |
| Total | 28,890 (100.0%) | 24,965 (100.0%) |
Household Income by Mortgage Status in Kanawha County
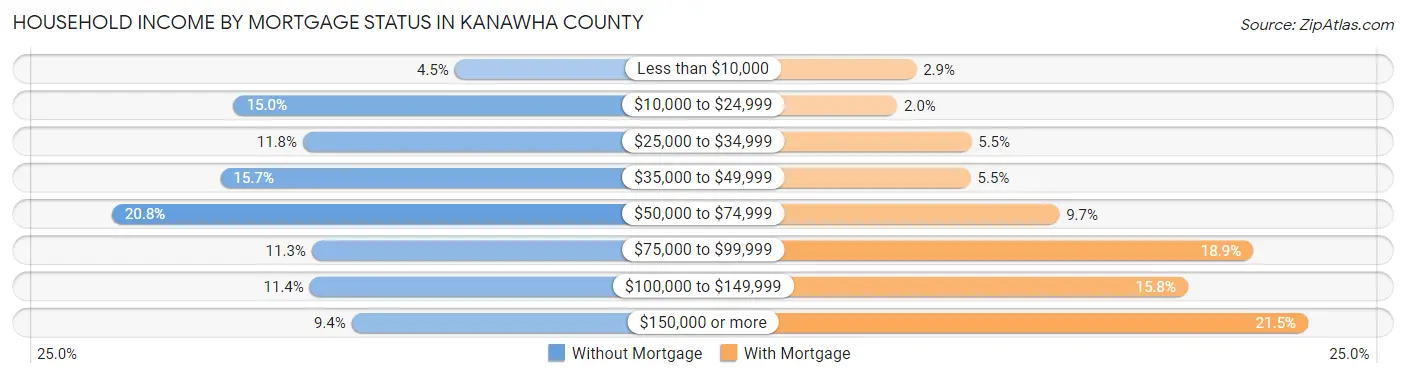
| Household Income | Without Mortgage | With Mortgage |
| Less than $10,000 | 1,305 (4.5%) | 721 (2.9%) |
| $10,000 to $24,999 | 4,344 (15.0%) | 494 (2.0%) |
| $25,000 to $34,999 | 3,395 (11.7%) | 1,375 (5.5%) |
| $35,000 to $49,999 | 4,528 (15.7%) | 1,367 (5.5%) |
| $50,000 to $74,999 | 6,020 (20.8%) | 2,422 (9.7%) |
| $75,000 to $99,999 | 3,272 (11.3%) | 4,726 (18.9%) |
| $100,000 to $149,999 | 3,302 (11.4%) | 3,949 (15.8%) |
| $150,000 or more | 2,724 (9.4%) | 5,377 (21.5%) |
| Total | 28,890 (100.0%) | 24,965 (100.0%) |
Property Value to Household Income Ratio in Kanawha County
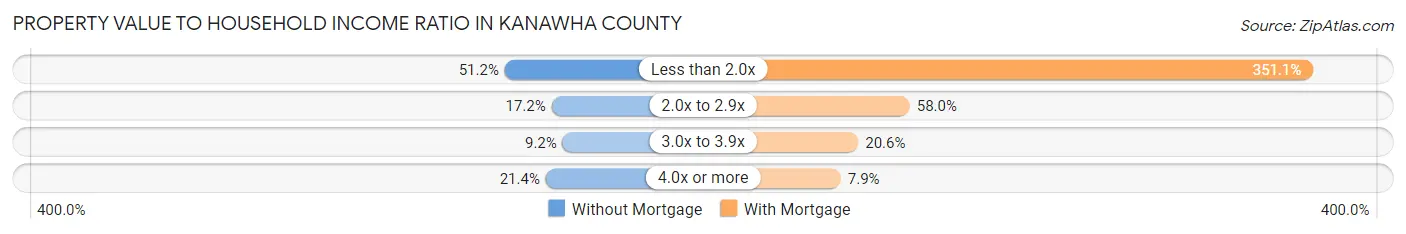
| Value-to-Income Ratio | Without Mortgage | With Mortgage |
| Less than 2.0x | 14,797 (51.2%) | 87,656 (351.1%) |
| 2.0x to 2.9x | 4,962 (17.2%) | 14,487 (58.0%) |
| 3.0x to 3.9x | 2,648 (9.2%) | 5,151 (20.6%) |
| 4.0x or more | 6,190 (21.4%) | 1,977 (7.9%) |
| Total | 28,890 (100.0%) | 24,965 (100.0%) |
Real Estate Taxes by Mortgage Status in Kanawha County
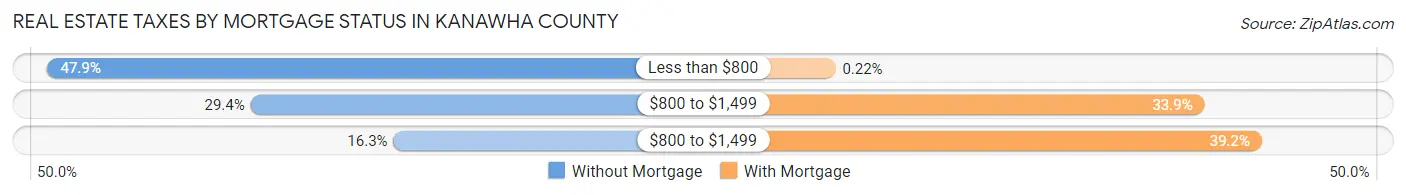
| Property Taxes | Without Mortgage | With Mortgage |
| Less than $800 | 13,839 (47.9%) | 56 (0.2%) |
| $800 to $1,499 | 8,484 (29.4%) | 8,467 (33.9%) |
| $800 to $1,499 | 4,714 (16.3%) | 9,775 (39.2%) |
| Total | 28,890 (100.0%) | 24,965 (100.0%) |
Health & Disability in Kanawha County
Health Insurance Coverage by Age in Kanawha County
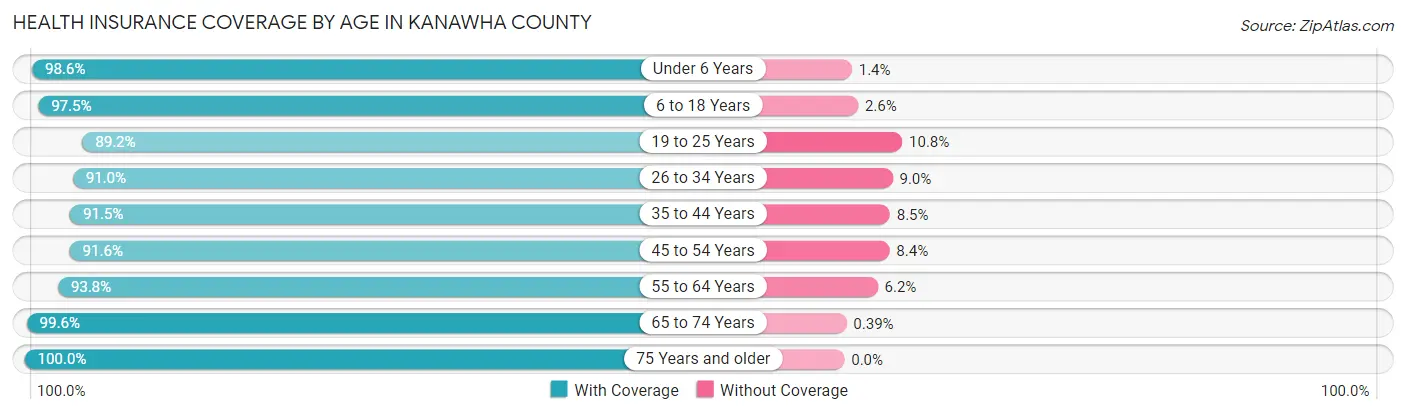
| Age Bracket | With Coverage | Without Coverage |
| Under 6 Years | 10,842 (98.6%) | 154 (1.4%) |
| 6 to 18 Years | 26,297 (97.5%) | 689 (2.5%) |
| 19 to 25 Years | 12,563 (89.2%) | 1,518 (10.8%) |
| 26 to 34 Years | 17,230 (91.0%) | 1,702 (9.0%) |
| 35 to 44 Years | 19,166 (91.5%) | 1,777 (8.5%) |
| 45 to 54 Years | 20,394 (91.6%) | 1,873 (8.4%) |
| 55 to 64 Years | 24,269 (93.8%) | 1,606 (6.2%) |
| 65 to 74 Years | 22,564 (99.6%) | 88 (0.4%) |
| 75 Years and older | 14,892 (100.0%) | 0 (0.0%) |
| Total | 168,217 (94.7%) | 9,407 (5.3%) |
Health Insurance Coverage by Citizenship Status in Kanawha County
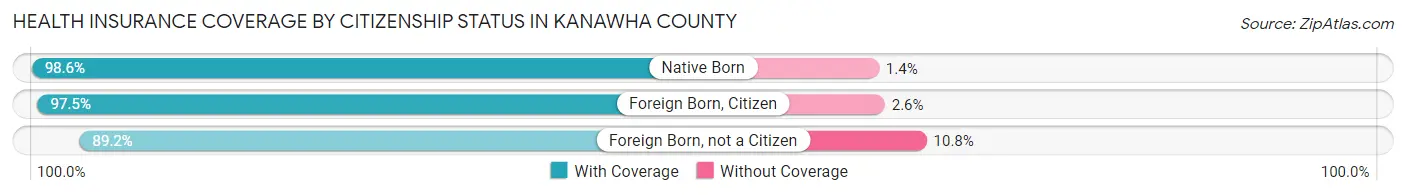
| Citizenship Status | With Coverage | Without Coverage |
| Native Born | 10,842 (98.6%) | 154 (1.4%) |
| Foreign Born, Citizen | 26,297 (97.5%) | 689 (2.5%) |
| Foreign Born, not a Citizen | 12,563 (89.2%) | 1,518 (10.8%) |
Health Insurance Coverage by Household Income in Kanawha County
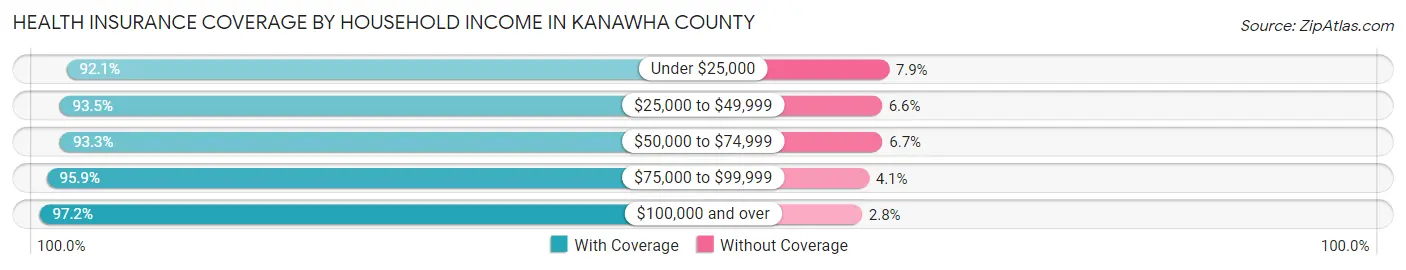
| Household Income | With Coverage | Without Coverage |
| Under $25,000 | 28,515 (92.1%) | 2,440 (7.9%) |
| $25,000 to $49,999 | 32,845 (93.4%) | 2,301 (6.6%) |
| $50,000 to $74,999 | 28,316 (93.3%) | 2,021 (6.7%) |
| $75,000 to $99,999 | 22,191 (95.9%) | 953 (4.1%) |
| $100,000 and over | 54,991 (97.2%) | 1,595 (2.8%) |
Public vs Private Health Insurance Coverage by Age in Kanawha County
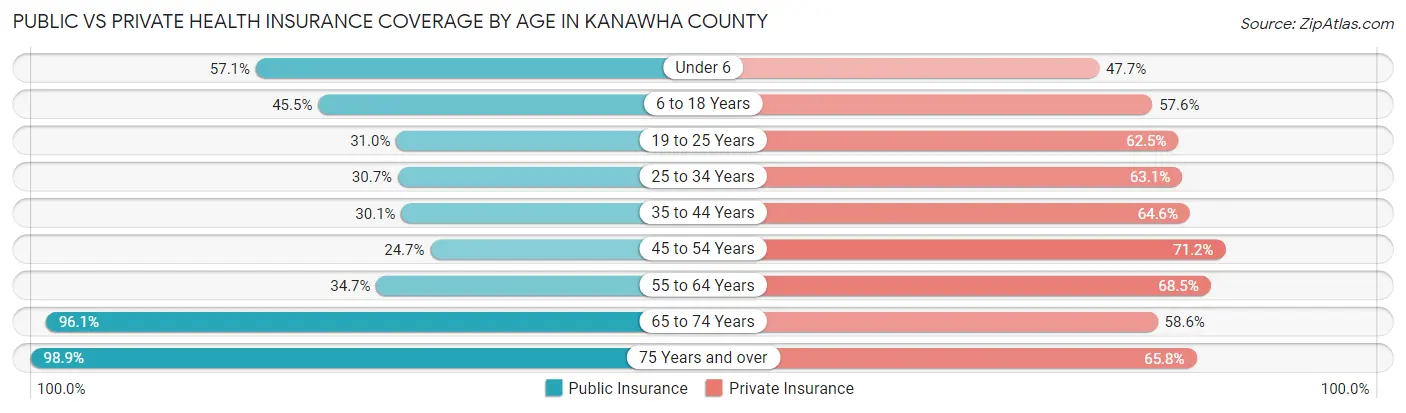
| Age Bracket | Public Insurance | Private Insurance |
| Under 6 | 6,277 (57.1%) | 5,249 (47.7%) |
| 6 to 18 Years | 12,278 (45.5%) | 15,550 (57.6%) |
| 19 to 25 Years | 4,368 (31.0%) | 8,793 (62.5%) |
| 25 to 34 Years | 5,814 (30.7%) | 11,954 (63.1%) |
| 35 to 44 Years | 6,295 (30.1%) | 13,529 (64.6%) |
| 45 to 54 Years | 5,498 (24.7%) | 15,852 (71.2%) |
| 55 to 64 Years | 8,980 (34.7%) | 17,711 (68.4%) |
| 65 to 74 Years | 21,764 (96.1%) | 13,280 (58.6%) |
| 75 Years and over | 14,724 (98.9%) | 9,798 (65.8%) |
| Total | 85,998 (48.4%) | 111,716 (62.9%) |
Disability Status by Sex by Age in Kanawha County
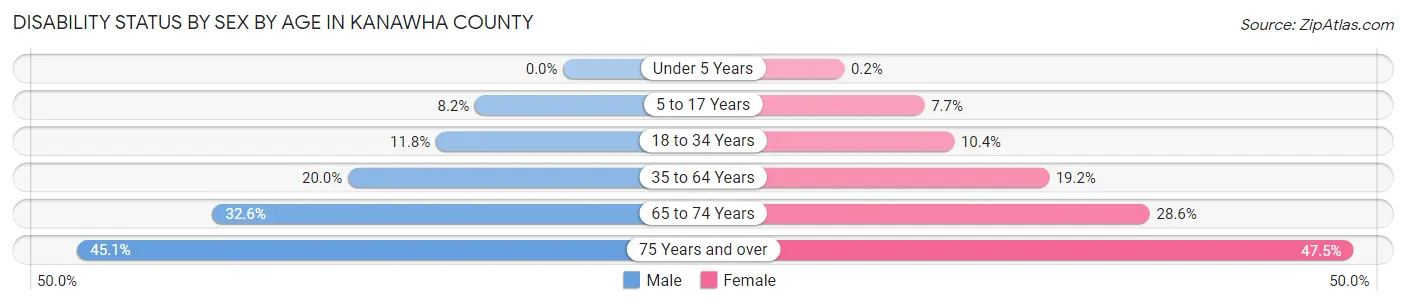
| Age Bracket | Male | Female |
| Under 5 Years | 0 (0.0%) | 9 (0.2%) |
| 5 to 17 Years | 1,110 (8.2%) | 1,004 (7.6%) |
| 18 to 34 Years | 2,073 (11.8%) | 1,846 (10.4%) |
| 35 to 64 Years | 6,730 (20.0%) | 6,798 (19.2%) |
| 65 to 74 Years | 3,422 (32.6%) | 3,467 (28.6%) |
| 75 Years and over | 2,684 (45.1%) | 4,245 (47.5%) |
Disability Class by Sex by Age in Kanawha County
Disability Class: Hearing Difficulty
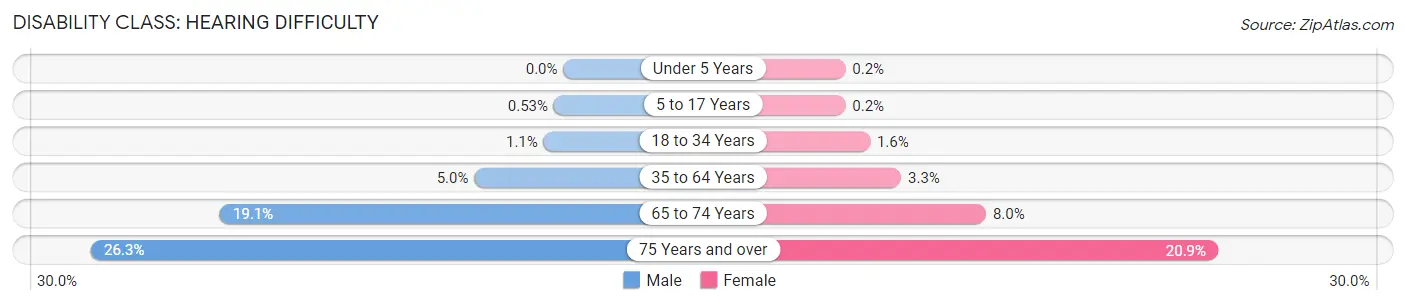
| Age Bracket | Male | Female |
| Under 5 Years | 0 (0.0%) | 9 (0.2%) |
| 5 to 17 Years | 72 (0.5%) | 26 (0.2%) |
| 18 to 34 Years | 193 (1.1%) | 279 (1.6%) |
| 35 to 64 Years | 1,671 (5.0%) | 1,169 (3.3%) |
| 65 to 74 Years | 2,010 (19.1%) | 975 (8.0%) |
| 75 Years and over | 1,565 (26.3%) | 1,872 (20.9%) |
Disability Class: Vision Difficulty
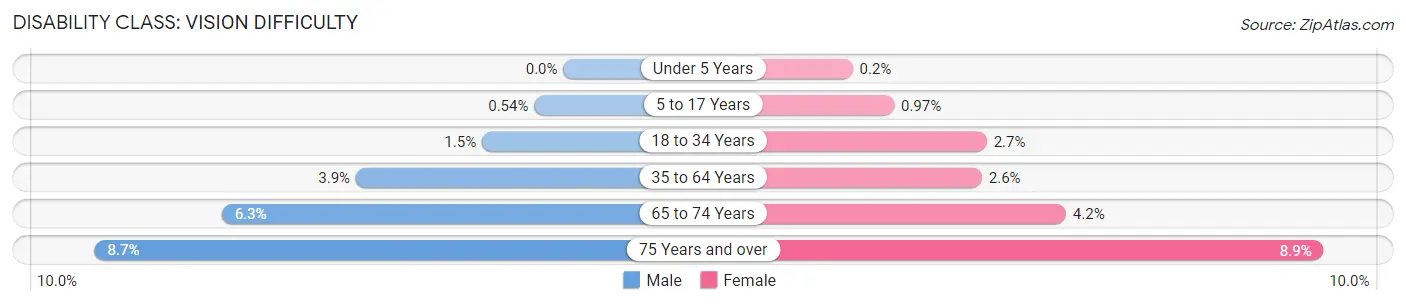
| Age Bracket | Male | Female |
| Under 5 Years | 0 (0.0%) | 9 (0.2%) |
| 5 to 17 Years | 73 (0.5%) | 127 (1.0%) |
| 18 to 34 Years | 265 (1.5%) | 477 (2.7%) |
| 35 to 64 Years | 1,296 (3.8%) | 920 (2.6%) |
| 65 to 74 Years | 667 (6.3%) | 505 (4.2%) |
| 75 Years and over | 518 (8.7%) | 799 (8.9%) |
Disability Class: Cognitive Difficulty
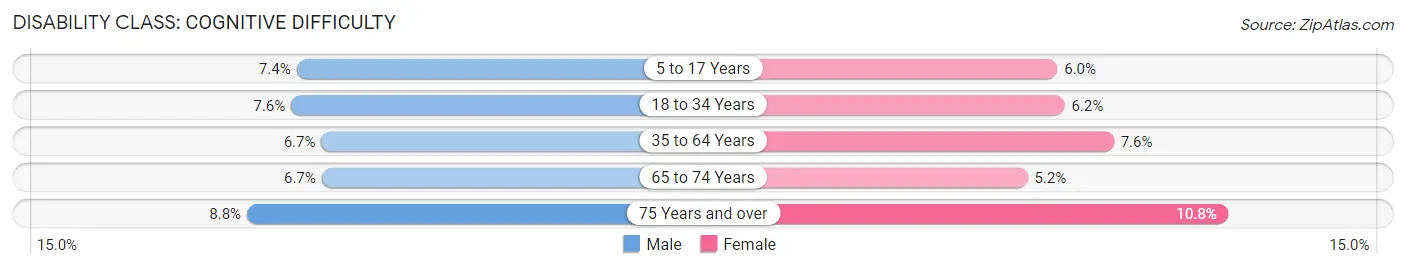
| Age Bracket | Male | Female |
| 5 to 17 Years | 1,008 (7.4%) | 788 (6.0%) |
| 18 to 34 Years | 1,331 (7.6%) | 1,099 (6.2%) |
| 35 to 64 Years | 2,270 (6.7%) | 2,679 (7.6%) |
| 65 to 74 Years | 708 (6.7%) | 627 (5.2%) |
| 75 Years and over | 524 (8.8%) | 963 (10.8%) |
Disability Class: Ambulatory Difficulty
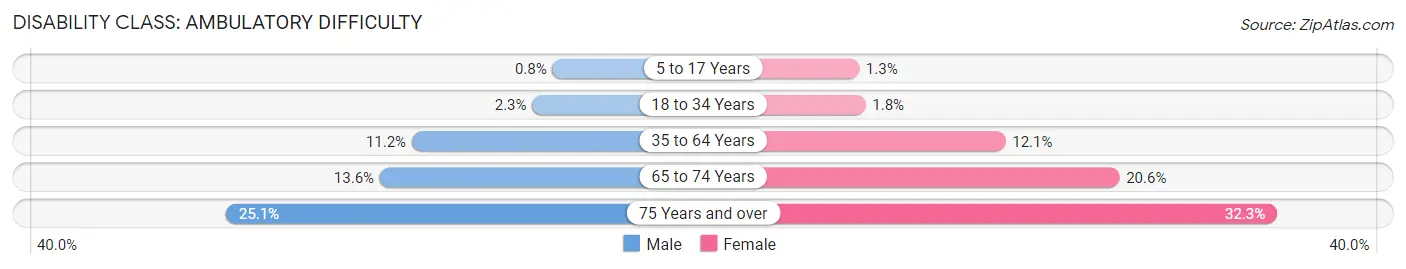
| Age Bracket | Male | Female |
| 5 to 17 Years | 109 (0.8%) | 167 (1.3%) |
| 18 to 34 Years | 404 (2.3%) | 311 (1.8%) |
| 35 to 64 Years | 3,786 (11.2%) | 4,296 (12.1%) |
| 65 to 74 Years | 1,432 (13.6%) | 2,500 (20.6%) |
| 75 Years and over | 1,491 (25.1%) | 2,890 (32.3%) |
Disability Class: Self-Care Difficulty
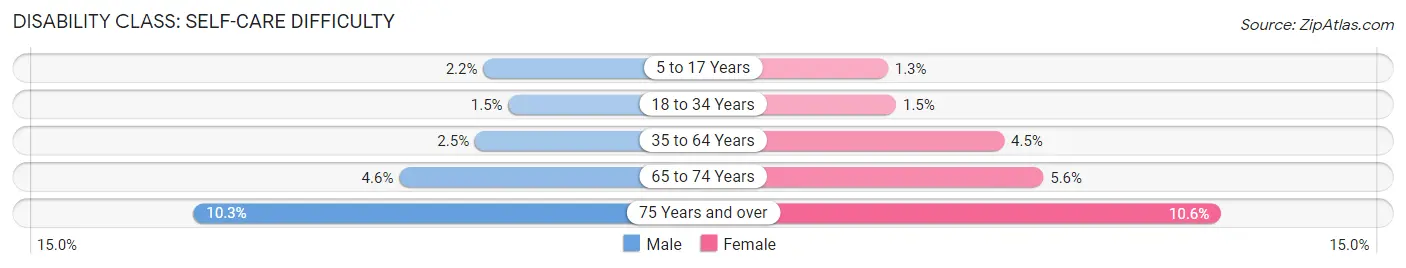
| Age Bracket | Male | Female |
| 5 to 17 Years | 303 (2.2%) | 168 (1.3%) |
| 18 to 34 Years | 268 (1.5%) | 267 (1.5%) |
| 35 to 64 Years | 828 (2.5%) | 1,601 (4.5%) |
| 65 to 74 Years | 480 (4.6%) | 681 (5.6%) |
| 75 Years and over | 613 (10.3%) | 944 (10.6%) |
Technology Access in Kanawha County
Computing Device Access in Kanawha County
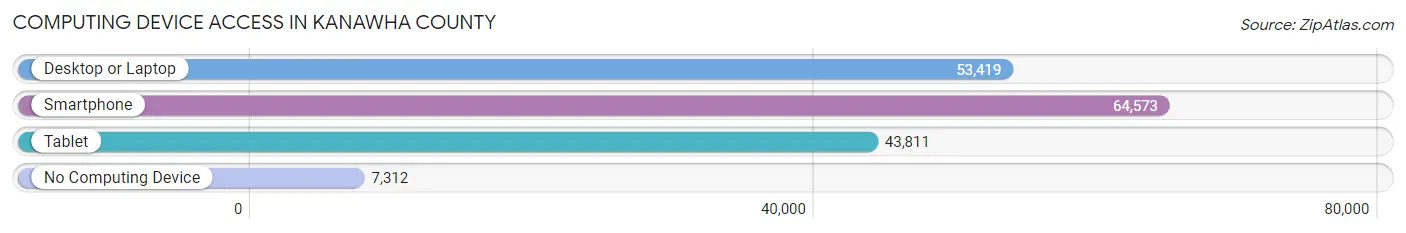
| Device Type | # Households | % Households |
| Desktop or Laptop | 53,419 | 69.2% |
| Smartphone | 64,573 | 83.6% |
| Tablet | 43,811 | 56.7% |
| No Computing Device | 7,312 | 9.5% |
| Total | 77,252 | 100.0% |
Internet Access in Kanawha County
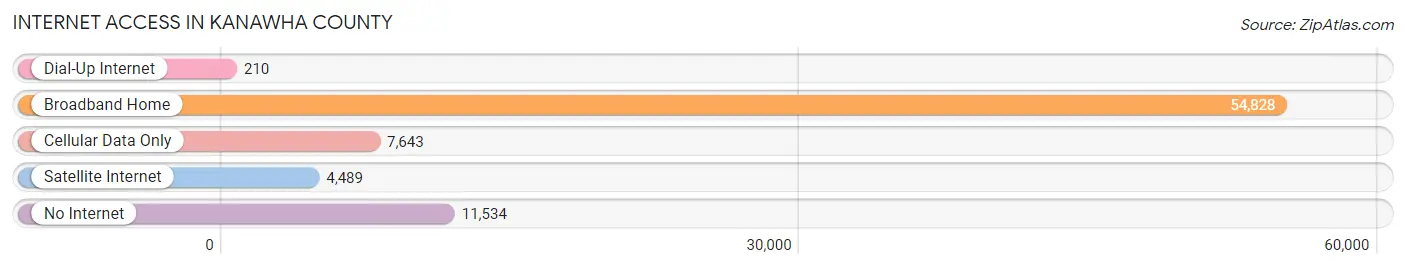
| Internet Type | # Households | % Households |
| Dial-Up Internet | 210 | 0.3% |
| Broadband Home | 54,828 | 71.0% |
| Cellular Data Only | 7,643 | 9.9% |
| Satellite Internet | 4,489 | 5.8% |
| No Internet | 11,534 | 14.9% |
| Total | 77,252 | 100.0% |
Kanawha County Summary
Kanawha County, West Virginia is located in the south-central part of the state and is the most populous county in West Virginia. It is bordered by Boone, Clay, Fayette, Jackson, Lincoln, Putnam, and Roane counties. The county seat is Charleston, the state capital. The county was created in 1789 and named for the Kanawha River, which flows through the county.
History
Kanawha County was formed in 1789 from parts of Greenbrier and Montgomery counties. It was named for the Kanawha River, which flows through the county. The county was originally part of the Virginia Colony and was part of the state of Virginia until 1863, when West Virginia was formed.
The county was home to several Native American tribes, including the Shawnee, Mingo, and Cherokee. The first European settlers arrived in the area in the late 1700s. The county was an important part of the Civil War, with several battles taking place in the area.
Geography
Kanawha County is located in the south-central part of West Virginia. It is bordered by Boone, Clay, Fayette, Jackson, Lincoln, Putnam, and Roane counties. The county covers an area of 1,039 square miles and has a population of 193,063.
The county is located in the Appalachian Mountains and is home to several rivers, including the Kanawha, Coal, Elk, and Gauley. The county is also home to several state parks, including Kanawha State Forest, Little Beaver State Park, and Coopers Rock State Forest.
Economy
Kanawha County is home to several major industries, including energy, manufacturing, and healthcare. The county is home to several major energy companies, including Appalachian Power, Dominion Energy, and American Electric Power. The county is also home to several manufacturing companies, including Bayer, DuPont, and Dow Chemical.
The county is also home to several healthcare companies, including Charleston Area Medical Center, Thomas Memorial Hospital, and St. Francis Hospital. The county is also home to several universities, including West Virginia University, Marshall University, and West Virginia State University.
Demographics
Kanawha County has a population of 193,063, making it the most populous county in West Virginia. The population is spread out, with 48.3% male and 51.7% female. The median age is 41.7 years.
The racial makeup of the county is 92.3% White, 4.2% African American, 0.5% Native American, 1.2% Asian, 0.1% Pacific Islander, 0.7% from other races, and 1.2% from two or more races. The median household income is $45,837 and the median family income is $54,837.
Conclusion
Kanawha County is located in the south-central part of West Virginia and is the most populous county in the state. The county was formed in 1789 and was originally part of the Virginia Colony. The county is home to several major industries, including energy, manufacturing, and healthcare. The population of the county is 193,063, with a median age of 41.7 years. The racial makeup of the county is 92.3% White, 4.2% African American, 0.5% Native American, 1.2% Asian, 0.1% Pacific Islander, 0.7% from other races, and 1.2% from two or more races. The median household income is $45,837 and the median family income is $54,837.
Common Questions
What is the Total Population of Kanawha County?
Total Population of Kanawha County is 179,895.
What is the Total Male Population of Kanawha County?
Total Male Population of Kanawha County is 87,343.
What is the Total Female Population of Kanawha County?
Total Female Population of Kanawha County is 92,552.
What is the Ratio of Males per 100 Females in Kanawha County?
There are 94.37 Males per 100 Females in Kanawha County.
What is the Ratio of Females per 100 Males in Kanawha County?
There are 105.96 Females per 100 Males in Kanawha County.
What is the Median Population Age in Kanawha County?
Median Population Age in Kanawha County is 43.6 Years.
What is the Average Family Size in Kanawha County
Average Family Size in Kanawha County is 2.9 People.
What is the Average Household Size in Kanawha County
Average Household Size in Kanawha County is 2.3 People.
What is Per Capita Income in Kanawha County?
Per Capita income in Kanawha County is $34,976.
What is the Median Family Income in Kanawha County?
Median Family Income in Kanawha County is $72,983.
What is the Median Household income in Kanawha County?
Median Household Income in Kanawha County is $55,226.
What is Income or Wage Gap in Kanawha County?
Income or Wage Gap in Kanawha County is 22.1%.
Women in Kanawha County earn 77.9 cents for every dollar earned by a man.
What is Family Income Deficit in Kanawha County?
Family Income Deficit in Kanawha County is $11,005.
Families that are below poverty line in Kanawha County earn $11,005 less on average than the poverty threshold level.
What is Inequality or Gini Index in Kanawha County?
Inequality or Gini Index in Kanawha County is 0.49.
How Large is the Labor Force in Kanawha County?
There are 81,733 People in the Labor Forcein in Kanawha County.
What is the Percentage of People in the Labor Force in Kanawha County?
55.1% of People are in the Labor Force in Kanawha County.
What is the Unemployment Rate in Kanawha County?
Unemployment Rate in Kanawha County is 5.4%.