Jackson County, WV
Jackson County Map
Jackson County Overview
27,868
TOTAL POPULATION
13,896
MALE POPULATION
13,972
FEMALE POPULATION
99.46
MALES / 100 FEMALES
100.55
FEMALES / 100 MALES
43.3
MEDIAN AGE
3.1
AVG FAMILY SIZE
2.5
AVG HOUSEHOLD SIZE
$34,014
PER CAPITA INCOME
$72,829
AVG FAMILY INCOME
$55,173
AVG HOUSEHOLD INCOME
29.4%
WAGE / INCOME GAP [ % ]
70.6¢/ $1
WAGE / INCOME GAP [ $ ]
$8,980
FAMILY INCOME DEFICIT
0.50
INEQUALITY / GINI INDEX
10,552
LABOR FORCE [ PEOPLE ]
46.8%
PERCENT IN LABOR FORCE
3.6%
UNEMPLOYMENT RATE
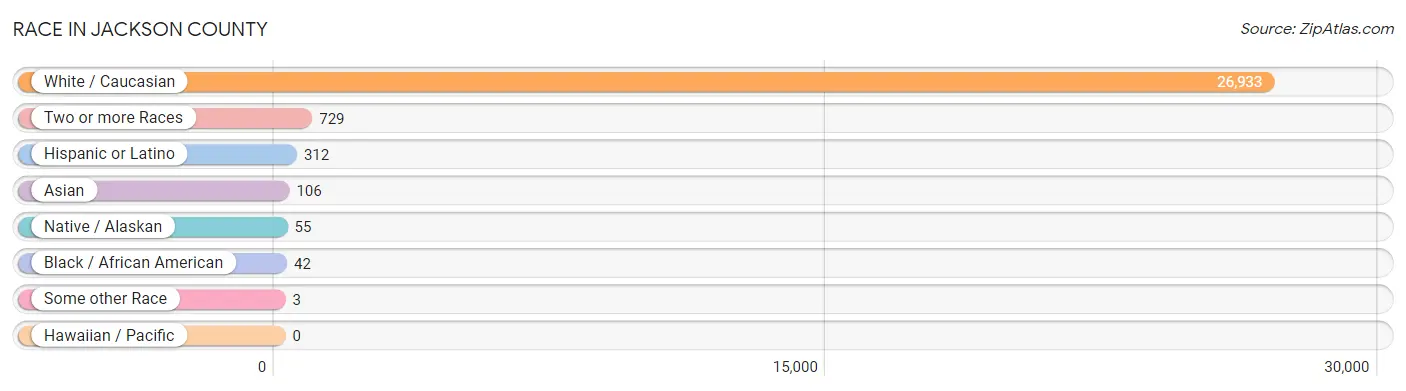
Race in Jackson County
The most populous races in Jackson County are White / Caucasian (26,933 | 96.6%), Two or more Races (729 | 2.6%), and Hispanic or Latino (312 | 1.1%).
| Race | # Population | % Population |
| Asian | 106 | 0.4% |
| Black / African American | 42 | 0.2% |
| Hawaiian / Pacific | 0 | 0.0% |
| Hispanic or Latino | 312 | 1.1% |
| Native / Alaskan | 55 | 0.2% |
| White / Caucasian | 26,933 | 96.6% |
| Two or more Races | 729 | 2.6% |
| Some other Race | 3 | 0.0% |
| Total | 27,868 | 100.0% |
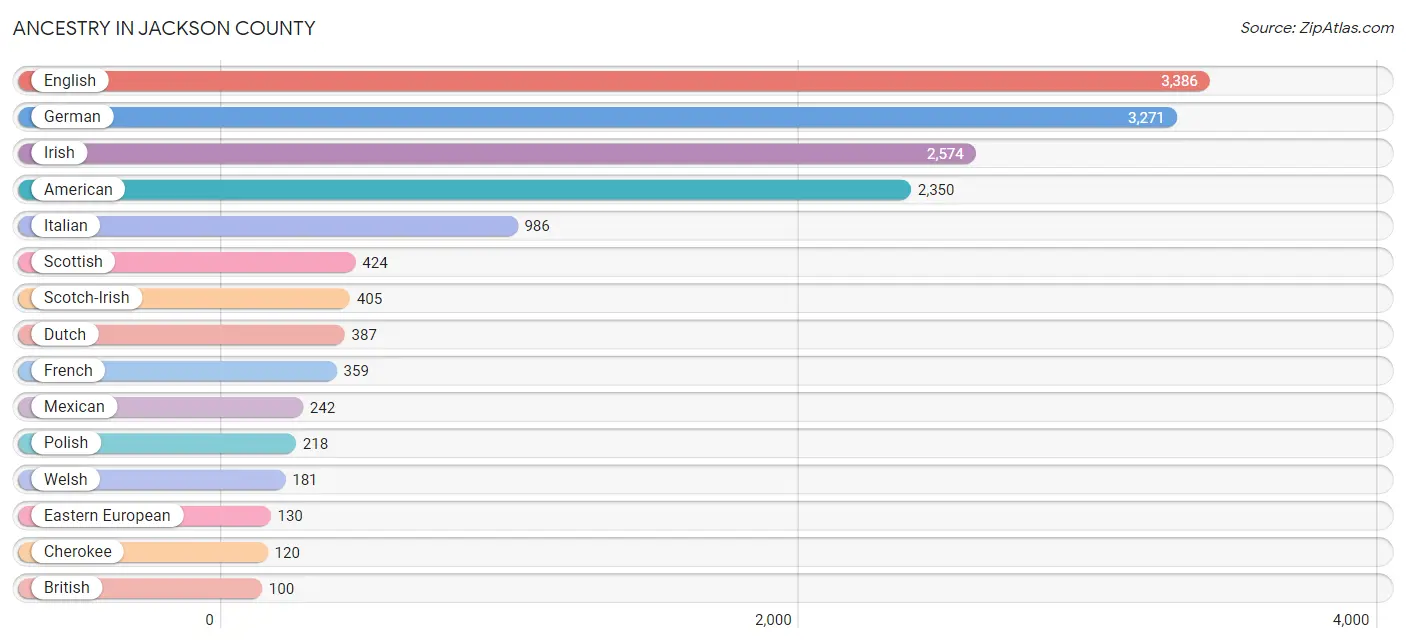
Ancestry in Jackson County
The most populous ancestries reported in Jackson County are English (3,386 | 12.1%), German (3,271 | 11.7%), Irish (2,574 | 9.2%), American (2,350 | 8.4%), and Italian (986 | 3.5%), together accounting for 45.1% of all Jackson County residents.
| Ancestry | # Population | % Population |
| African | 8 | 0.0% |
| American | 2,350 | 8.4% |
| Arab | 41 | 0.2% |
| Austrian | 38 | 0.1% |
| Belgian | 40 | 0.1% |
| Bhutanese | 51 | 0.2% |
| British | 100 | 0.4% |
| Burmese | 9 | 0.0% |
| Celtic | 57 | 0.2% |
| Cherokee | 120 | 0.4% |
| Colombian | 3 | 0.0% |
| Czech | 62 | 0.2% |
| Dutch | 387 | 1.4% |
| Eastern European | 130 | 0.5% |
| English | 3,386 | 12.1% |
| European | 88 | 0.3% |
| French | 359 | 1.3% |
| French Canadian | 39 | 0.1% |
| German | 3,271 | 11.7% |
| Greek | 41 | 0.2% |
| Hungarian | 53 | 0.2% |
| Indian (Asian) | 75 | 0.3% |
| Irish | 2,574 | 9.2% |
| Iroquois | 19 | 0.1% |
| Italian | 986 | 3.5% |
| Korean | 14 | 0.1% |
| Lebanese | 41 | 0.2% |
| Mexican | 242 | 0.9% |
| Nigerian | 21 | 0.1% |
| Norwegian | 61 | 0.2% |
| Pennsylvania German | 20 | 0.1% |
| Polish | 218 | 0.8% |
| Russian | 14 | 0.1% |
| Scotch-Irish | 405 | 1.5% |
| Scottish | 424 | 1.5% |
| Slovak | 78 | 0.3% |
| Slovene | 58 | 0.2% |
| South American | 3 | 0.0% |
| Spanish | 67 | 0.2% |
| Subsaharan African | 37 | 0.1% |
| Swedish | 27 | 0.1% |
| Ukrainian | 15 | 0.1% |
| Welsh | 181 | 0.6% | View All 43 Rows |
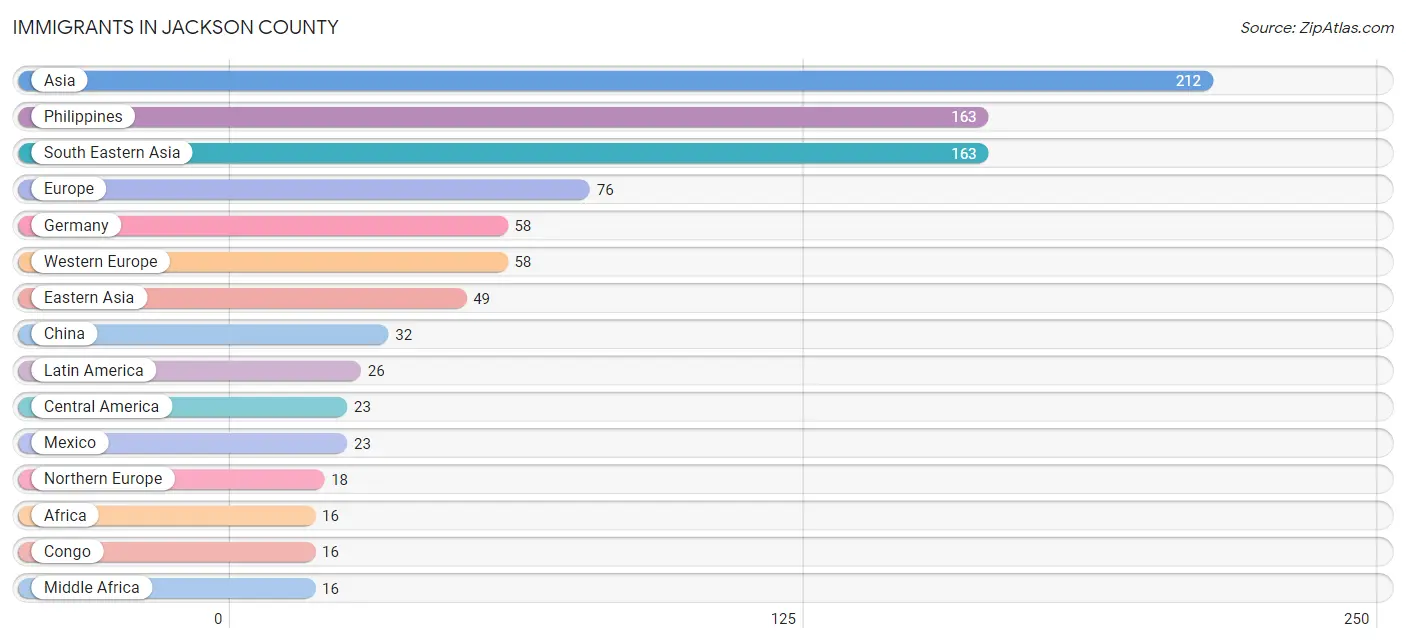
Immigrants in Jackson County
The most numerous immigrant groups reported in Jackson County came from Asia (212 | 0.8%), Philippines (163 | 0.6%), South Eastern Asia (163 | 0.6%), Europe (76 | 0.3%), and Germany (58 | 0.2%), together accounting for 2.4% of all Jackson County residents.
| Immigration Origin | # Population | % Population |
| Africa | 16 | 0.1% |
| Argentina | 2 | 0.0% |
| Asia | 212 | 0.8% |
| Central America | 23 | 0.1% |
| China | 32 | 0.1% |
| Colombia | 1 | 0.0% |
| Congo | 16 | 0.1% |
| Eastern Asia | 49 | 0.2% |
| Europe | 76 | 0.3% |
| Germany | 58 | 0.2% |
| Hong Kong | 7 | 0.0% |
| Japan | 8 | 0.0% |
| Korea | 9 | 0.0% |
| Latin America | 26 | 0.1% |
| Mexico | 23 | 0.1% |
| Middle Africa | 16 | 0.1% |
| Northern Europe | 18 | 0.1% |
| Philippines | 163 | 0.6% |
| South America | 3 | 0.0% |
| South Eastern Asia | 163 | 0.6% |
| Western Europe | 58 | 0.2% | View All 21 Rows |
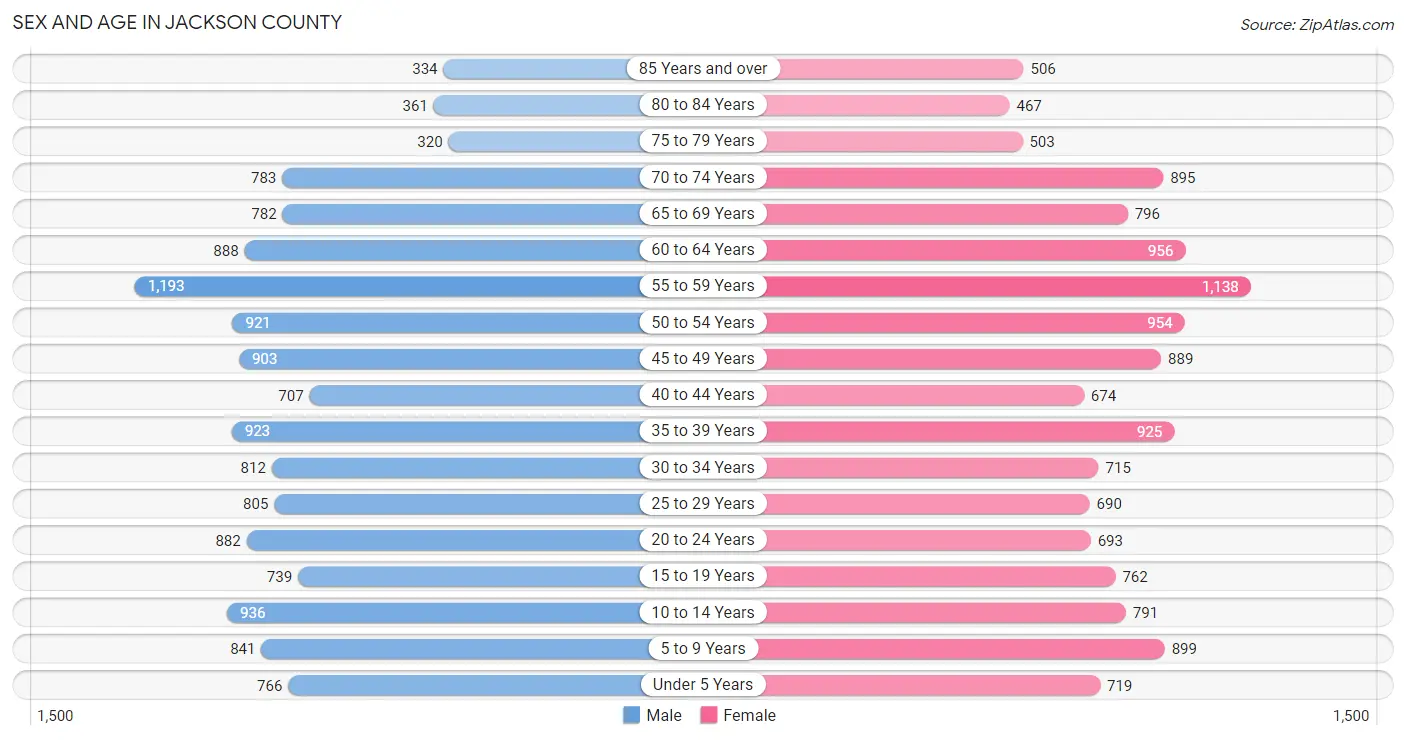
Sex and Age in Jackson County
Sex and Age in Jackson County
The most populous age groups in Jackson County are 55 to 59 Years (1,193 | 8.6%) for men and 55 to 59 Years (1,138 | 8.1%) for women.
| Age Bracket | Male | Female |
| Under 5 Years | 766 (5.5%) | 719 (5.1%) |
| 5 to 9 Years | 841 (6.0%) | 899 (6.4%) |
| 10 to 14 Years | 936 (6.7%) | 791 (5.7%) |
| 15 to 19 Years | 739 (5.3%) | 762 (5.4%) |
| 20 to 24 Years | 882 (6.4%) | 693 (5.0%) |
| 25 to 29 Years | 805 (5.8%) | 690 (4.9%) |
| 30 to 34 Years | 812 (5.8%) | 715 (5.1%) |
| 35 to 39 Years | 923 (6.6%) | 925 (6.6%) |
| 40 to 44 Years | 707 (5.1%) | 674 (4.8%) |
| 45 to 49 Years | 903 (6.5%) | 889 (6.4%) |
| 50 to 54 Years | 921 (6.6%) | 954 (6.8%) |
| 55 to 59 Years | 1,193 (8.6%) | 1,138 (8.1%) |
| 60 to 64 Years | 888 (6.4%) | 956 (6.8%) |
| 65 to 69 Years | 782 (5.6%) | 796 (5.7%) |
| 70 to 74 Years | 783 (5.6%) | 895 (6.4%) |
| 75 to 79 Years | 320 (2.3%) | 503 (3.6%) |
| 80 to 84 Years | 361 (2.6%) | 467 (3.3%) |
| 85 Years and over | 334 (2.4%) | 506 (3.6%) |
| Total | 13,896 (100.0%) | 13,972 (100.0%) |
Families and Households in Jackson County
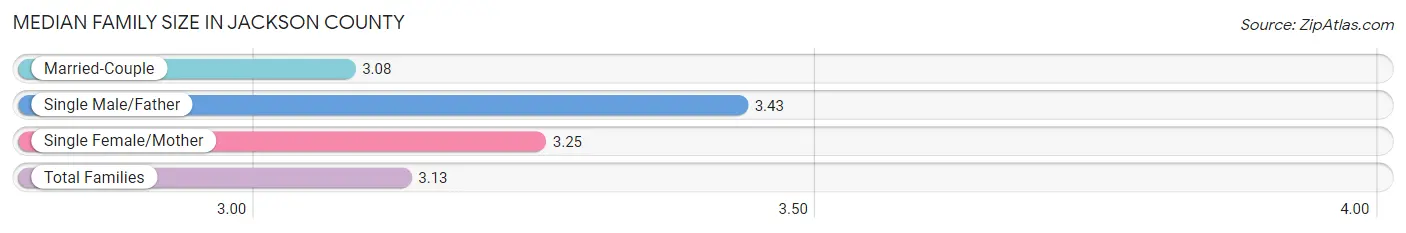
Median Family Size in Jackson County
The median family size in Jackson County is 3.13 persons per family, with single male/father families (463 | 6.4%) accounting for the largest median family size of 3.43 persons per family. On the other hand, married-couple families (5,714 | 78.5%) represent the smallest median family size with 3.08 persons per family.
| Family Type | # Families | Family Size |
| Married-Couple | 5,714 (78.5%) | 3.08 |
| Single Male/Father | 463 (6.4%) | 3.43 |
| Single Female/Mother | 1,097 (15.1%) | 3.25 |
| Total Families | 7,274 (100.0%) | 3.13 |
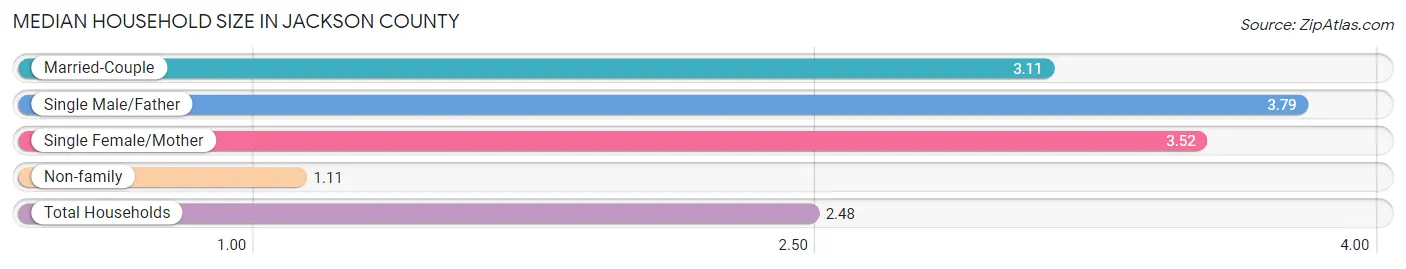
Median Household Size in Jackson County
The median household size in Jackson County is 2.48 persons per household, with single male/father households (463 | 4.2%) accounting for the largest median household size of 3.79 persons per household. non-family households (3,874 | 34.7%) represent the smallest median household size with 1.11 persons per household.
| Household Type | # Households | Household Size |
| Married-Couple | 5,714 (51.3%) | 3.11 |
| Single Male/Father | 463 (4.2%) | 3.79 |
| Single Female/Mother | 1,097 (9.8%) | 3.52 |
| Non-family | 3,874 (34.7%) | 1.11 |
| Total Households | 11,148 (100.0%) | 2.48 |
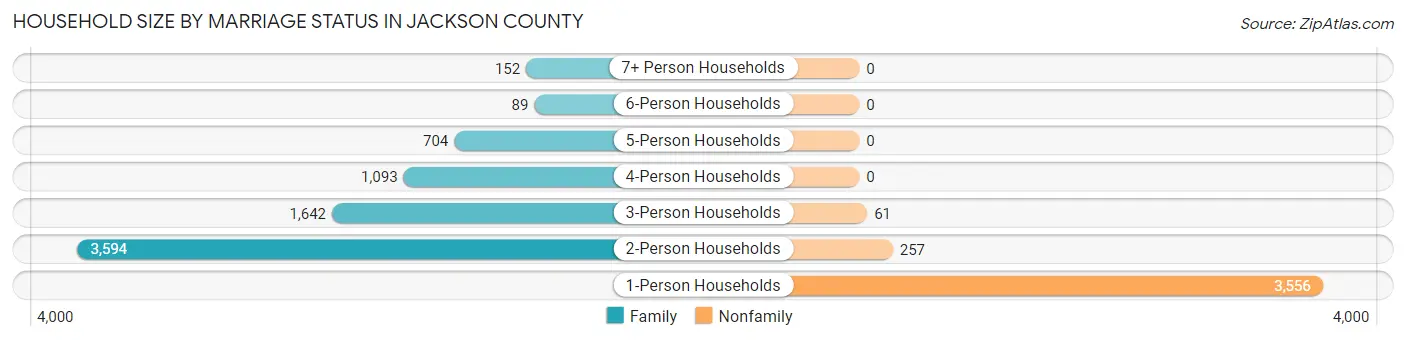
Household Size by Marriage Status in Jackson County
Out of a total of 11,148 households in Jackson County, 7,274 (65.2%) are family households, while 3,874 (34.7%) are nonfamily households. The most numerous type of family households are 2-person households, comprising 3,594, and the most common type of nonfamily households are 1-person households, comprising 3,556.
| Household Size | Family Households | Nonfamily Households |
| 1-Person Households | - | 3,556 (31.9%) |
| 2-Person Households | 3,594 (32.2%) | 257 (2.3%) |
| 3-Person Households | 1,642 (14.7%) | 61 (0.5%) |
| 4-Person Households | 1,093 (9.8%) | 0 (0.0%) |
| 5-Person Households | 704 (6.3%) | 0 (0.0%) |
| 6-Person Households | 89 (0.8%) | 0 (0.0%) |
| 7+ Person Households | 152 (1.4%) | 0 (0.0%) |
| Total | 7,274 (65.2%) | 3,874 (34.7%) |
Female Fertility in Jackson County
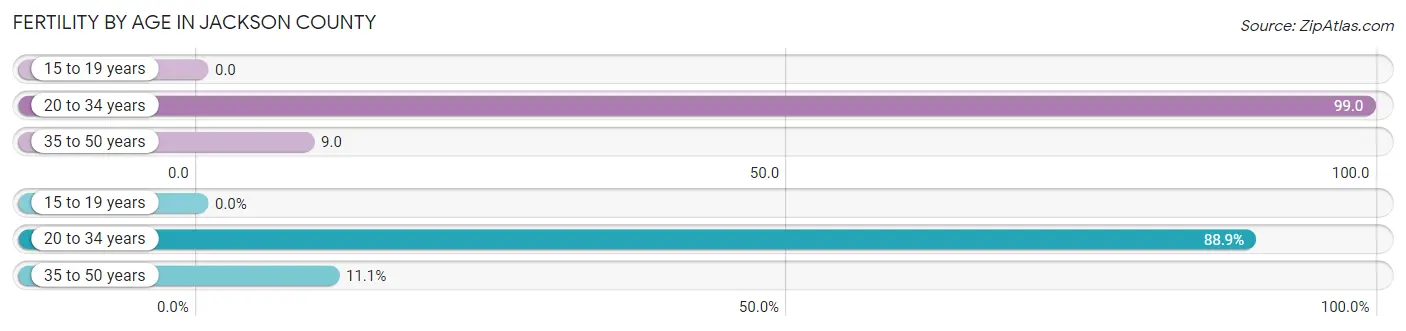
Fertility by Age in Jackson County
Average fertility rate in Jackson County is 42.0 births per 1,000 women. Women in the age bracket of 20 to 34 years have the highest fertility rate with 99.0 births per 1,000 women. Women in the age bracket of 20 to 34 years acount for 88.9% of all women with births.
| Age Bracket | Women with Births | Births / 1,000 Women |
| 15 to 19 years | 0 (0.0%) | 0.0 |
| 20 to 34 years | 208 (88.9%) | 99.0 |
| 35 to 50 years | 26 (11.1%) | 9.0 |
| Total | 234 (100.0%) | 42.0 |
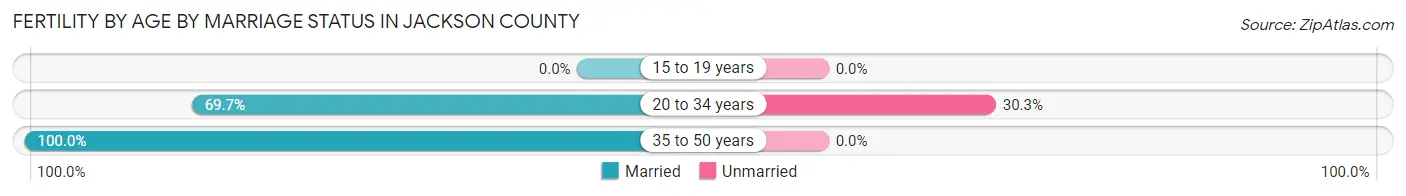
Fertility by Age by Marriage Status in Jackson County
73.1% of women with births (234) in Jackson County are married. The highest percentage of unmarried women with births falls into 20 to 34 years age bracket with 30.3% of them unmarried at the time of birth, while the lowest percentage of unmarried women with births belong to 35 to 50 years age bracket with 0.0% of them unmarried.
| Age Bracket | Married | Unmarried |
| 15 to 19 years | 0 (0.0%) | 0 (0.0%) |
| 20 to 34 years | 145 (69.7%) | 63 (30.3%) |
| 35 to 50 years | 26 (100.0%) | 0 (0.0%) |
| Total | 171 (73.1%) | 63 (26.9%) |
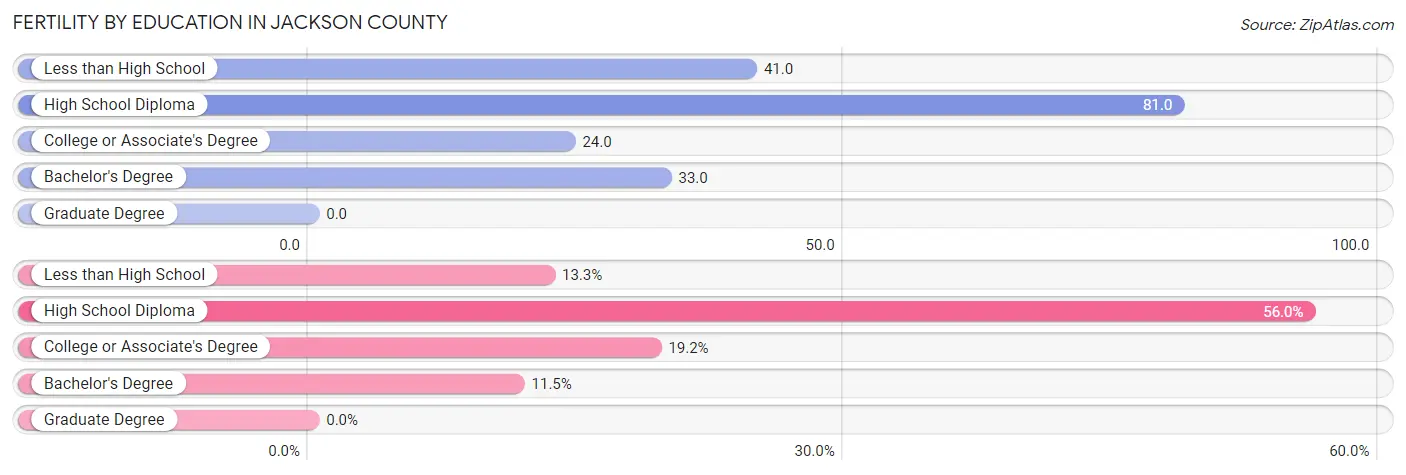
Fertility by Education in Jackson County
| Educational Attainment | Women with Births | Births / 1,000 Women |
| Less than High School | 31 (13.3%) | 41.0 |
| High School Diploma | 131 (56.0%) | 81.0 |
| College or Associate's Degree | 45 (19.2%) | 24.0 |
| Bachelor's Degree | 27 (11.5%) | 33.0 |
| Graduate Degree | 0 (0.0%) | 0.0 |
| Total | 234 (100.0%) | 42.0 |
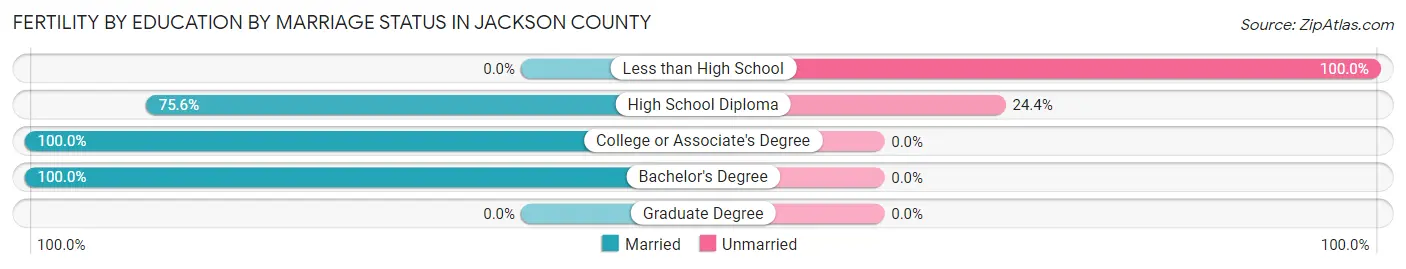
Fertility by Education by Marriage Status in Jackson County
26.9% of women with births in Jackson County are unmarried. Women with the educational attainment of college or associate's degree are most likely to be married with 100.0% of them married at childbirth, while women with the educational attainment of less than high school are least likely to be married with 100.0% of them unmarried at childbirth.
| Educational Attainment | Married | Unmarried |
| Less than High School | 0 (0.0%) | 31 (100.0%) |
| High School Diploma | 99 (75.6%) | 32 (24.4%) |
| College or Associate's Degree | 45 (100.0%) | 0 (0.0%) |
| Bachelor's Degree | 27 (100.0%) | 0 (0.0%) |
| Graduate Degree | 0 (0.0%) | 0 (0.0%) |
| Total | 171 (73.1%) | 63 (26.9%) |
Income in Jackson County
Income Overview in Jackson County
Per Capita Income in Jackson County is $34,014, while median incomes of families and households are $72,829 and $55,173 respectively.
| Characteristic | Number | Measure |
| Per Capita Income | 27,868 | $34,014 |
| Median Family Income | 7,274 | $72,829 |
| Mean Family Income | 7,274 | $93,638 |
| Median Household Income | 11,148 | $55,173 |
| Mean Household Income | 11,148 | $80,874 |
| Income Deficit | 7,274 | $8,980 |
| Wage / Income Gap (%) | 27,868 | 29.38% |
| Wage / Income Gap ($) | 27,868 | 70.62¢ per $1 |
| Gini / Inequality Index | 27,868 | 0.50 |
Earnings by Sex in Jackson County
Average Earnings in Jackson County are $44,452, $53,476 for men and $37,765 for women, a difference of 29.4%.
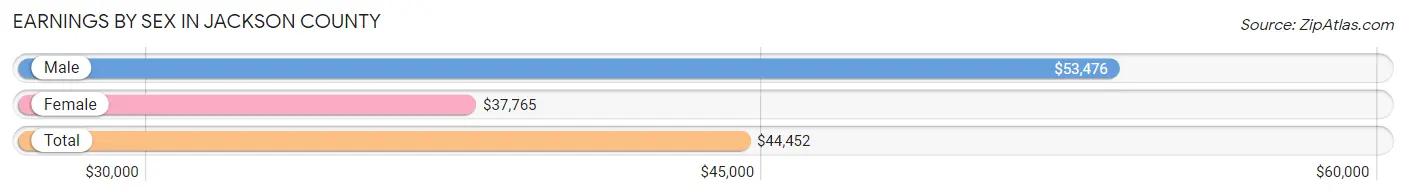
| Sex | Number | Average Earnings |
| Male | 6,012 (55.3%) | $53,476 |
| Female | 4,854 (44.7%) | $37,765 |
| Total | 10,866 (100.0%) | $44,452 |
Earnings by Sex by Income Bracket in Jackson County
The most common earnings brackets in Jackson County are $100,000+ for men (944 | 15.7%) and $55,000 to $64,999 for women (511 | 10.5%).
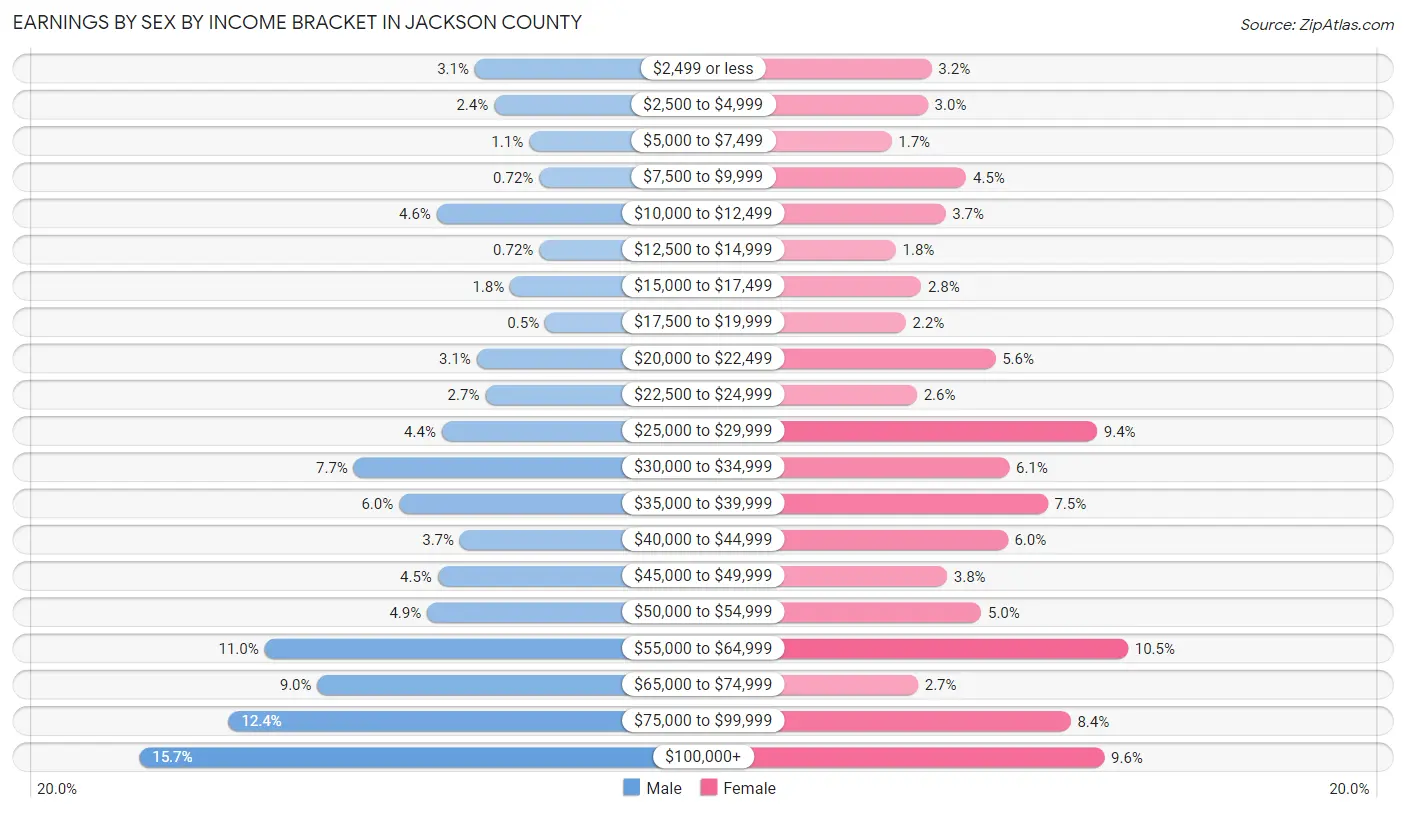
| Income | Male | Female |
| $2,499 or less | 188 (3.1%) | 154 (3.2%) |
| $2,500 to $4,999 | 145 (2.4%) | 147 (3.0%) |
| $5,000 to $7,499 | 66 (1.1%) | 81 (1.7%) |
| $7,500 to $9,999 | 43 (0.7%) | 217 (4.5%) |
| $10,000 to $12,499 | 274 (4.6%) | 179 (3.7%) |
| $12,500 to $14,999 | 43 (0.7%) | 89 (1.8%) |
| $15,000 to $17,499 | 109 (1.8%) | 135 (2.8%) |
| $17,500 to $19,999 | 30 (0.5%) | 107 (2.2%) |
| $20,000 to $22,499 | 184 (3.1%) | 270 (5.6%) |
| $22,500 to $24,999 | 165 (2.7%) | 127 (2.6%) |
| $25,000 to $29,999 | 263 (4.4%) | 455 (9.4%) |
| $30,000 to $34,999 | 461 (7.7%) | 295 (6.1%) |
| $35,000 to $39,999 | 359 (6.0%) | 365 (7.5%) |
| $40,000 to $44,999 | 222 (3.7%) | 292 (6.0%) |
| $45,000 to $49,999 | 272 (4.5%) | 182 (3.7%) |
| $50,000 to $54,999 | 296 (4.9%) | 244 (5.0%) |
| $55,000 to $64,999 | 662 (11.0%) | 511 (10.5%) |
| $65,000 to $74,999 | 543 (9.0%) | 129 (2.7%) |
| $75,000 to $99,999 | 743 (12.4%) | 407 (8.4%) |
| $100,000+ | 944 (15.7%) | 468 (9.6%) |
| Total | 6,012 (100.0%) | 4,854 (100.0%) |
Earnings by Sex by Educational Attainment in Jackson County
Average earnings in Jackson County are $58,202 for men and $39,447 for women, a difference of 32.2%. Men with an educational attainment of graduate degree enjoy the highest average annual earnings of $107,188, while those with less than high school education earn the least with $36,180. Women with an educational attainment of graduate degree earn the most with the average annual earnings of $78,438, while those with high school diploma education have the smallest earnings of $26,963.
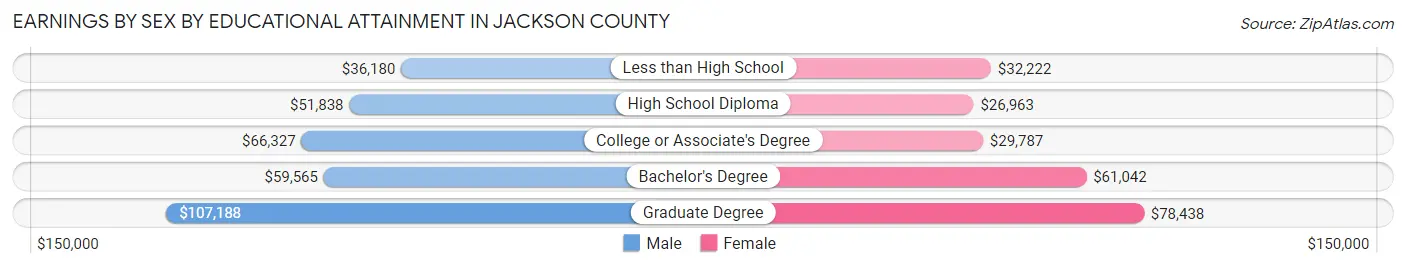
| Educational Attainment | Male Income | Female Income |
| Less than High School | $36,180 | $32,222 |
| High School Diploma | $51,838 | $26,963 |
| College or Associate's Degree | $66,327 | $29,787 |
| Bachelor's Degree | $59,565 | $61,042 |
| Graduate Degree | $107,188 | $78,438 |
| Total | $58,202 | $39,447 |
Family Income in Jackson County
Family Income Brackets in Jackson County
According to the Jackson County family income data, there are 1,411 families falling into the $100,000 to $149,999 income range, which is the most common income bracket and makes up 19.4% of all families. Conversely, the $10,000 to $14,999 income bracket is the least frequent group with only 131 families (1.8%) belonging to this category.
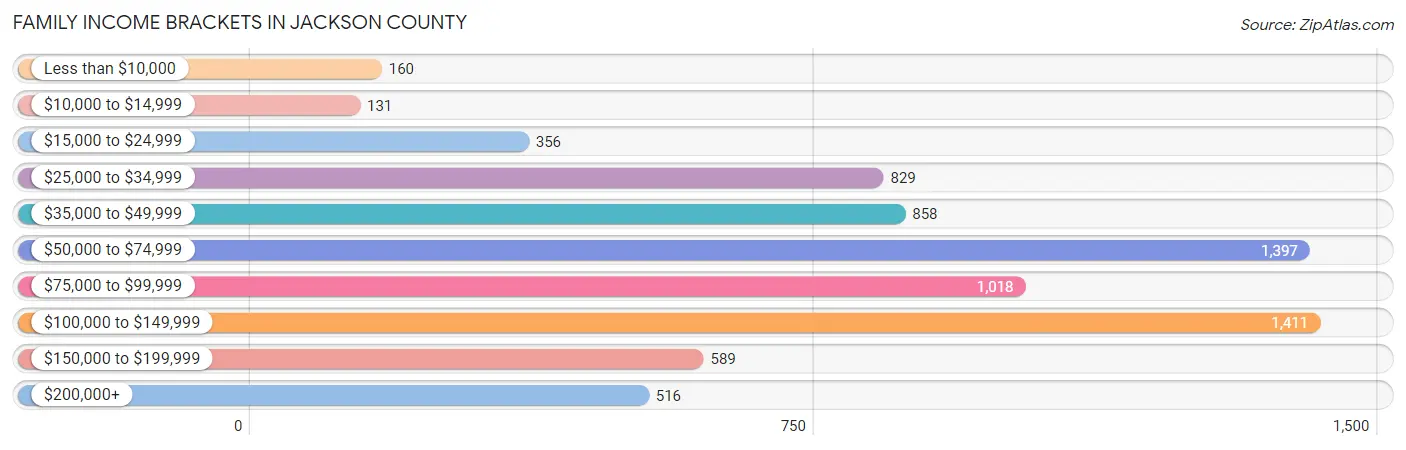
| Income Bracket | # Families | % Families |
| Less than $10,000 | 160 | 2.2% |
| $10,000 to $14,999 | 131 | 1.8% |
| $15,000 to $24,999 | 356 | 4.9% |
| $25,000 to $34,999 | 829 | 11.4% |
| $35,000 to $49,999 | 858 | 11.8% |
| $50,000 to $74,999 | 1,397 | 19.2% |
| $75,000 to $99,999 | 1,018 | 14.0% |
| $100,000 to $149,999 | 1,411 | 19.4% |
| $150,000 to $199,999 | 589 | 8.1% |
| $200,000+ | 516 | 7.1% |
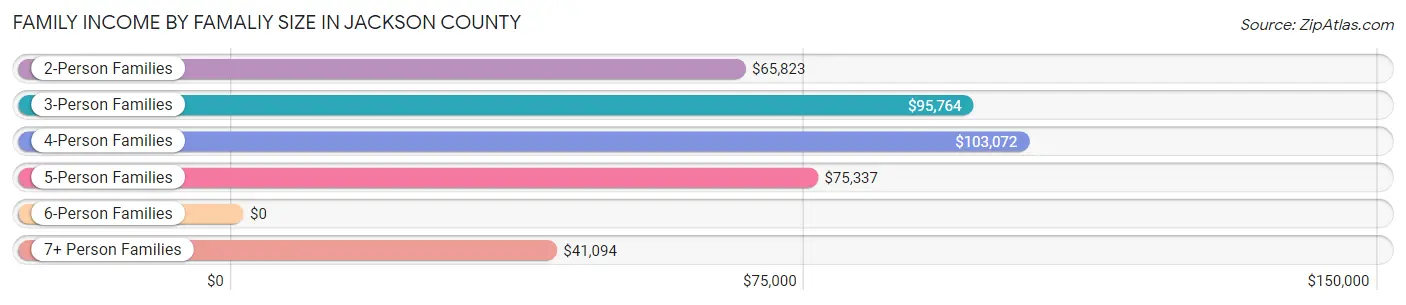
Family Income by Famaliy Size in Jackson County
4-person families (1,123 | 15.4%) account for the highest median family income in Jackson County with $103,072 per family, while 2-person families (3,822 | 52.5%) have the highest median income of $32,912 per family member.
| Income Bracket | # Families | Median Income |
| 2-Person Families | 3,822 (52.5%) | $65,823 |
| 3-Person Families | 1,512 (20.8%) | $95,764 |
| 4-Person Families | 1,123 (15.4%) | $103,072 |
| 5-Person Families | 633 (8.7%) | $75,337 |
| 6-Person Families | 50 (0.7%) | $0 |
| 7+ Person Families | 134 (1.8%) | $41,094 |
| Total | 7,274 (100.0%) | $72,829 |
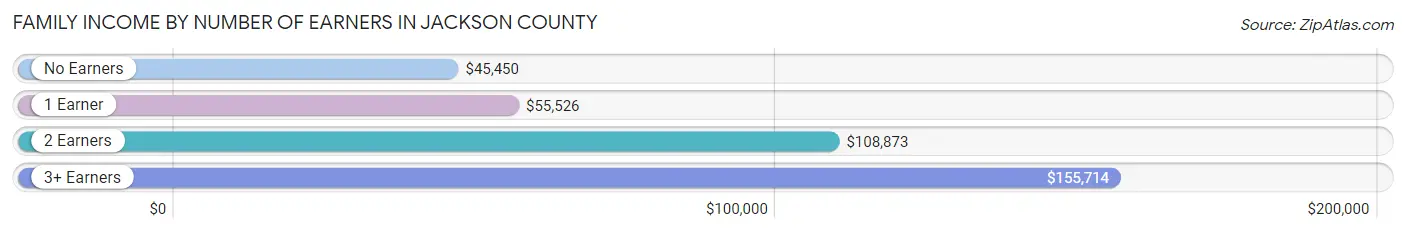
Family Income by Number of Earners in Jackson County
The median family income in Jackson County is $72,829, with families comprising 3+ earners (420) having the highest median family income of $155,714, while families with no earners (2,091) have the lowest median family income of $45,450, accounting for 5.8% and 28.7% of families, respectively.
| Number of Earners | # Families | Median Income |
| No Earners | 2,091 (28.7%) | $45,450 |
| 1 Earner | 2,272 (31.2%) | $55,526 |
| 2 Earners | 2,491 (34.3%) | $108,873 |
| 3+ Earners | 420 (5.8%) | $155,714 |
| Total | 7,274 (100.0%) | $72,829 |
Household Income in Jackson County
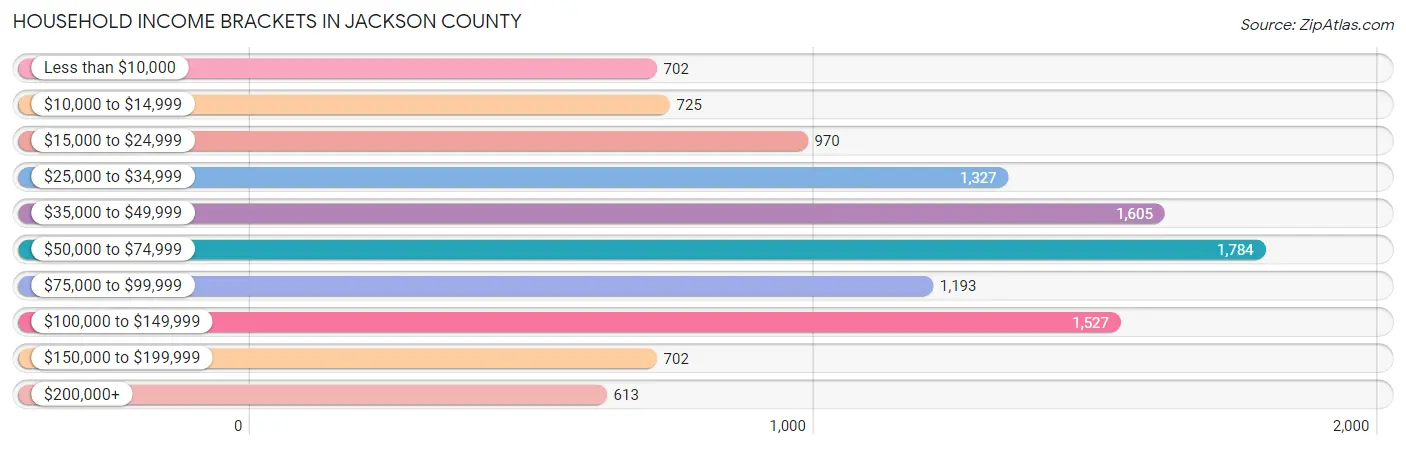
Household Income Brackets in Jackson County
With 1,784 households falling in the category, the $50,000 to $74,999 income range is the most frequent in Jackson County, accounting for 16.0% of all households. In contrast, only 613 households (5.5%) fall into the $200,000+ income bracket, making it the least populous group.
| Income Bracket | # Households | % Households |
| Less than $10,000 | 702 | 6.3% |
| $10,000 to $14,999 | 725 | 6.5% |
| $15,000 to $24,999 | 970 | 8.7% |
| $25,000 to $34,999 | 1,327 | 11.9% |
| $35,000 to $49,999 | 1,605 | 14.4% |
| $50,000 to $74,999 | 1,784 | 16.0% |
| $75,000 to $99,999 | 1,193 | 10.7% |
| $100,000 to $149,999 | 1,527 | 13.7% |
| $150,000 to $199,999 | 702 | 6.3% |
| $200,000+ | 613 | 5.5% |
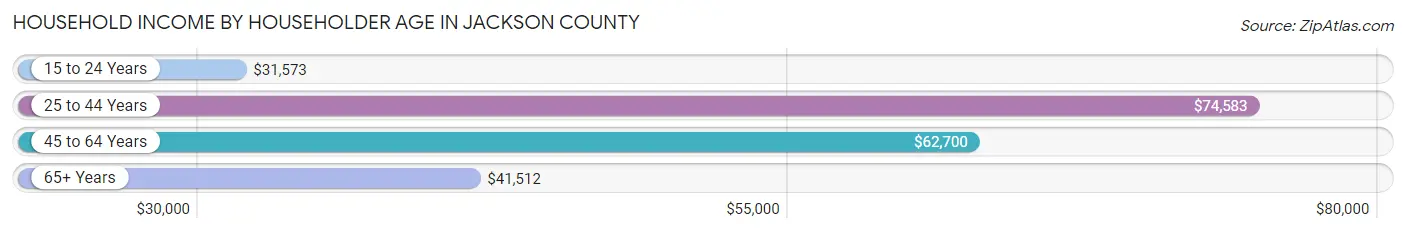
Household Income by Householder Age in Jackson County
The median household income in Jackson County is $55,173, with the highest median household income of $74,583 found in the 25 to 44 years age bracket for the primary householder. A total of 2,626 households (23.6%) fall into this category. Meanwhile, the 15 to 24 years age bracket for the primary householder has the lowest median household income of $31,573, with 188 households (1.7%) in this group.
| Income Bracket | # Households | Median Income |
| 15 to 24 Years | 188 (1.7%) | $31,573 |
| 25 to 44 Years | 2,626 (23.6%) | $74,583 |
| 45 to 64 Years | 4,610 (41.3%) | $62,700 |
| 65+ Years | 3,724 (33.4%) | $41,512 |
| Total | 11,148 (100.0%) | $55,173 |
Poverty in Jackson County
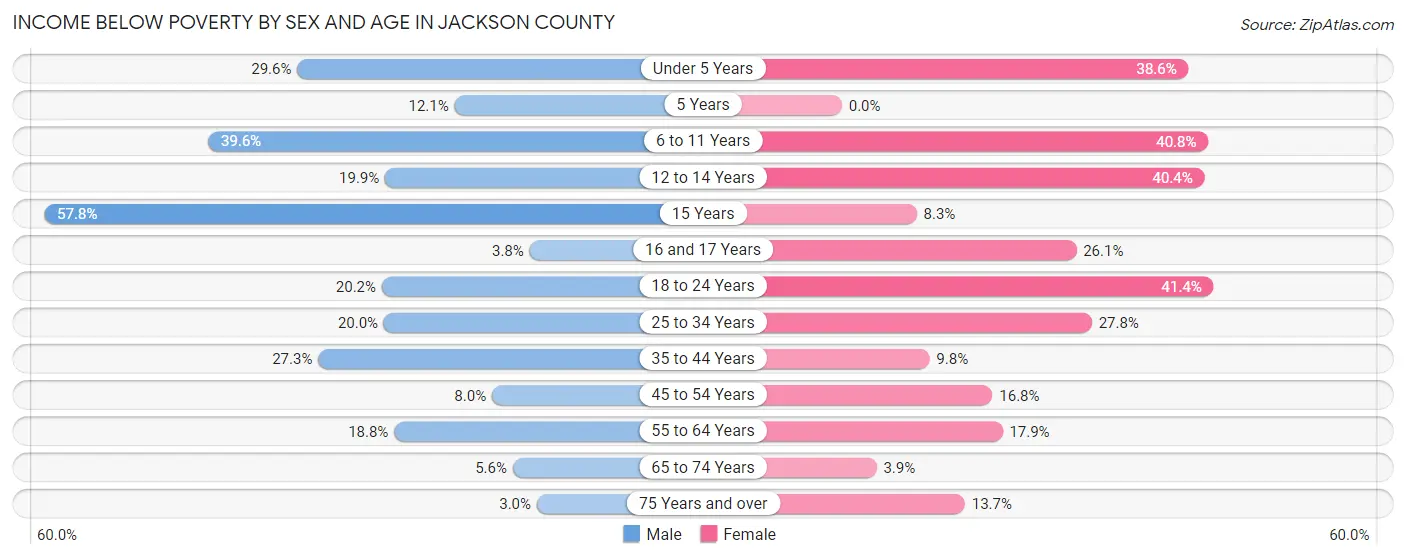
Income Below Poverty by Sex and Age in Jackson County
With 18.4% poverty level for males and 20.9% for females among the residents of Jackson County, 15 year old males and 18 to 24 year old females are the most vulnerable to poverty, with 96 males (57.8%) and 388 females (41.4%) in their respective age groups living below the poverty level.
| Age Bracket | Male | Female |
| Under 5 Years | 227 (29.6%) | 266 (38.6%) |
| 5 Years | 20 (12.1%) | 0 (0.0%) |
| 6 to 11 Years | 473 (39.6%) | 415 (40.8%) |
| 12 to 14 Years | 82 (19.9%) | 223 (40.4%) |
| 15 Years | 96 (57.8%) | 17 (8.3%) |
| 16 and 17 Years | 16 (3.8%) | 82 (26.1%) |
| 18 to 24 Years | 208 (20.2%) | 388 (41.4%) |
| 25 to 34 Years | 323 (20.0%) | 391 (27.8%) |
| 35 to 44 Years | 445 (27.3%) | 156 (9.8%) |
| 45 to 54 Years | 145 (8.0%) | 306 (16.8%) |
| 55 to 64 Years | 390 (18.8%) | 374 (17.9%) |
| 65 to 74 Years | 88 (5.6%) | 64 (3.9%) |
| 75 Years and over | 29 (2.9%) | 191 (13.7%) |
| Total | 2,542 (18.4%) | 2,873 (20.9%) |
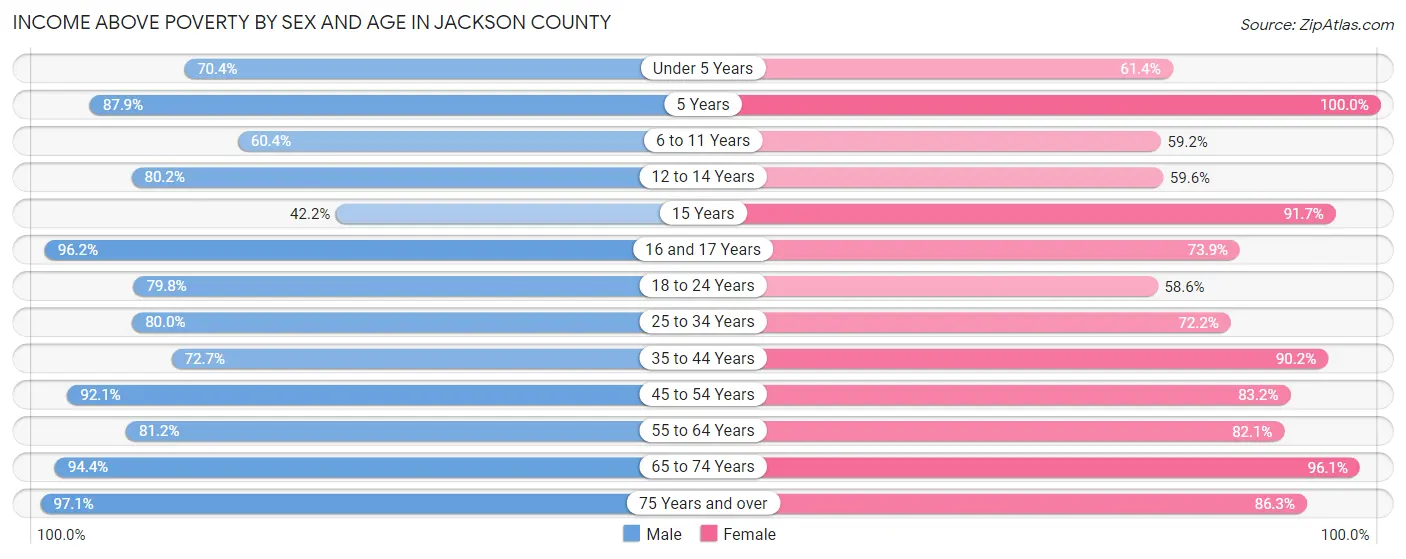
Income Above Poverty by Sex and Age in Jackson County
According to the poverty statistics in Jackson County, males aged 75 years and over and females aged 5 years are the age groups that are most secure financially, with 97.1% of males and 100.0% of females in these age groups living above the poverty line.
| Age Bracket | Male | Female |
| Under 5 Years | 539 (70.4%) | 423 (61.4%) |
| 5 Years | 145 (87.9%) | 88 (100.0%) |
| 6 to 11 Years | 722 (60.4%) | 602 (59.2%) |
| 12 to 14 Years | 331 (80.1%) | 329 (59.6%) |
| 15 Years | 70 (42.2%) | 187 (91.7%) |
| 16 and 17 Years | 410 (96.2%) | 232 (73.9%) |
| 18 to 24 Years | 821 (79.8%) | 549 (58.6%) |
| 25 to 34 Years | 1,294 (80.0%) | 1,014 (72.2%) |
| 35 to 44 Years | 1,185 (72.7%) | 1,443 (90.2%) |
| 45 to 54 Years | 1,679 (92.0%) | 1,519 (83.2%) |
| 55 to 64 Years | 1,680 (81.2%) | 1,716 (82.1%) |
| 65 to 74 Years | 1,475 (94.4%) | 1,595 (96.1%) |
| 75 Years and over | 954 (97.1%) | 1,203 (86.3%) |
| Total | 11,305 (81.6%) | 10,900 (79.1%) |
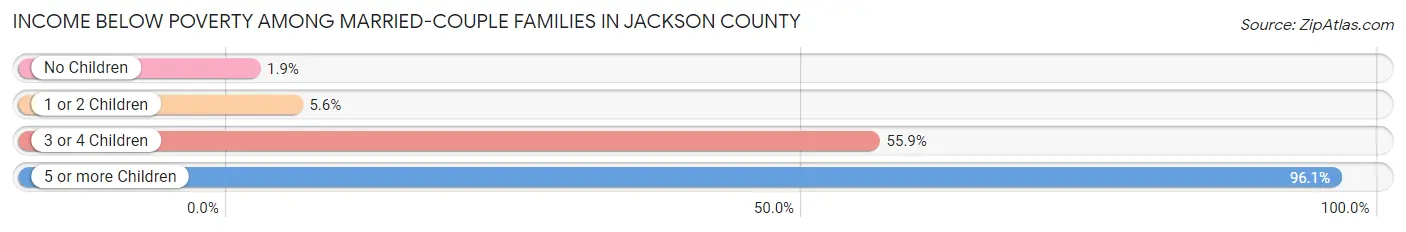
Income Below Poverty Among Married-Couple Families in Jackson County
The poverty statistics for married-couple families in Jackson County show that 8.8% or 504 of the total 5,714 families live below the poverty line. Families with 5 or more children have the highest poverty rate of 96.1%, comprising of 98 families. On the other hand, families with no children have the lowest poverty rate of 1.9%, which includes 71 families.
| Children | Above Poverty | Below Poverty |
| No Children | 3,626 (98.1%) | 71 (1.9%) |
| 1 or 2 Children | 1,380 (94.4%) | 82 (5.6%) |
| 3 or 4 Children | 200 (44.2%) | 253 (55.8%) |
| 5 or more Children | 4 (3.9%) | 98 (96.1%) |
| Total | 5,210 (91.2%) | 504 (8.8%) |
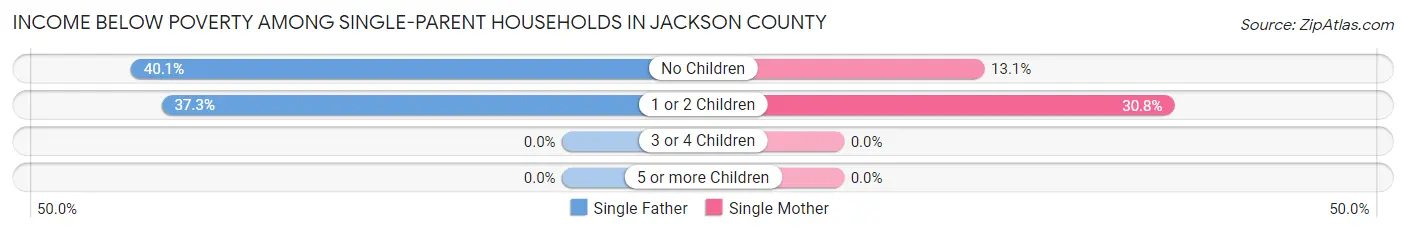
Income Below Poverty Among Single-Parent Households in Jackson County
According to the poverty data in Jackson County, 34.3% or 159 single-father households and 19.4% or 213 single-mother households are living below the poverty line. Among single-father households, those with no children have the highest poverty rate, with 83 households (40.1%) experiencing poverty. Likewise, among single-mother households, those with 1 or 2 children have the highest poverty rate, with 137 households (30.8%) falling below the poverty line.
| Children | Single Father | Single Mother |
| No Children | 83 (40.1%) | 76 (13.1%) |
| 1 or 2 Children | 76 (37.2%) | 137 (30.8%) |
| 3 or 4 Children | 0 (0.0%) | 0 (0.0%) |
| 5 or more Children | 0 (0.0%) | 0 (0.0%) |
| Total | 159 (34.3%) | 213 (19.4%) |
Income Below Poverty Among Married-Couple vs Single-Parent Households in Jackson County
The poverty data for Jackson County shows that 504 of the married-couple family households (8.8%) and 372 of the single-parent households (23.8%) are living below the poverty level. Within the married-couple family households, those with 5 or more children have the highest poverty rate, with 98 households (96.1%) falling below the poverty line. Among the single-parent households, those with 1 or 2 children have the highest poverty rate, with 213 household (32.8%) living below poverty.
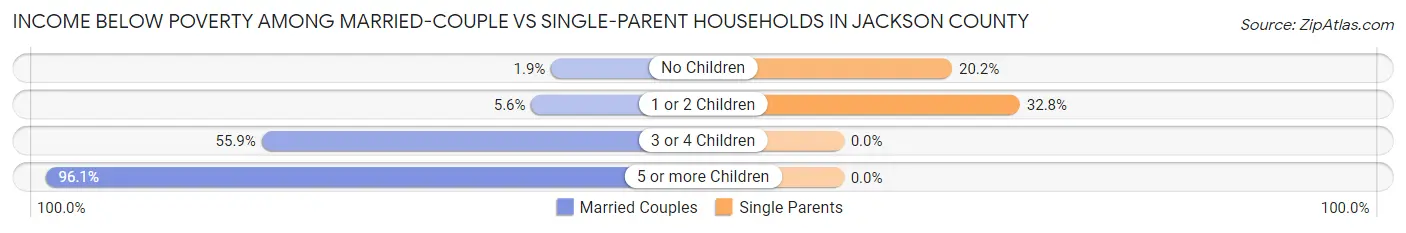
| Children | Married-Couple Families | Single-Parent Households |
| No Children | 71 (1.9%) | 159 (20.2%) |
| 1 or 2 Children | 82 (5.6%) | 213 (32.8%) |
| 3 or 4 Children | 253 (55.8%) | 0 (0.0%) |
| 5 or more Children | 98 (96.1%) | 0 (0.0%) |
| Total | 504 (8.8%) | 372 (23.8%) |
Employment Characteristics in Jackson County
Employment by Class of Employer in Jackson County
Among the 10,149 employed individuals in Jackson County, private company employees (7,237 | 71.3%), not-for-profit organizations (723 | 7.1%), and local government employees (693 | 6.8%) make up the most common classes of employment.
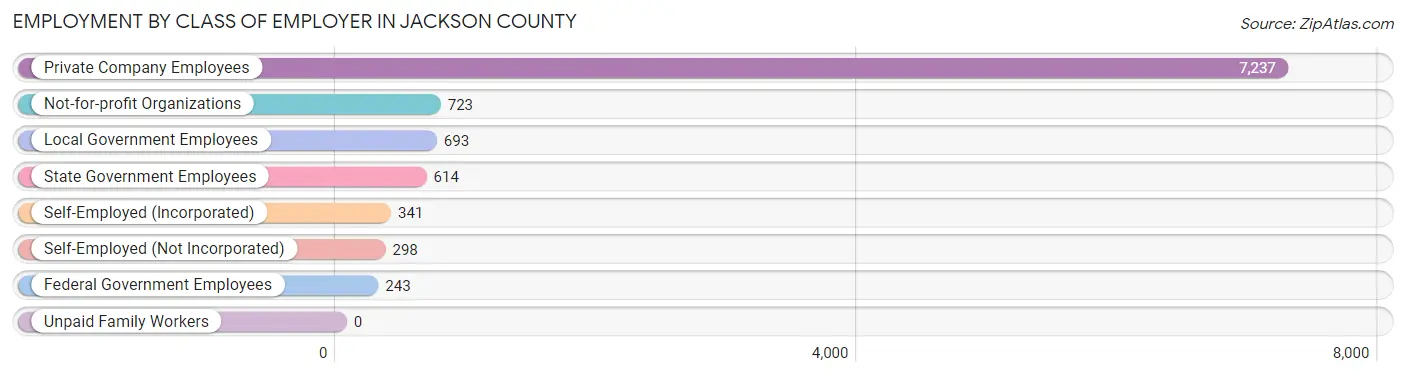
| Employer Class | # Employees | % Employees |
| Private Company Employees | 7,237 | 71.3% |
| Self-Employed (Incorporated) | 341 | 3.4% |
| Self-Employed (Not Incorporated) | 298 | 2.9% |
| Not-for-profit Organizations | 723 | 7.1% |
| Local Government Employees | 693 | 6.8% |
| State Government Employees | 614 | 6.0% |
| Federal Government Employees | 243 | 2.4% |
| Unpaid Family Workers | 0 | 0.0% |
| Total | 10,149 | 100.0% |
Employment Status by Age in Jackson County
According to the labor force statistics for Jackson County, out of the total population over 16 years of age (22,546), 46.8% or 10,552 individuals are in the labor force, with 3.6% or 380 of them unemployed. The age group with the highest labor force participation rate is 25 to 29 years, with 74.8% or 1,118 individuals in the labor force. Within the labor force, the 16 to 19 years age range has the highest percentage of unemployed individuals, with 22.2% or 37 of them being unemployed.
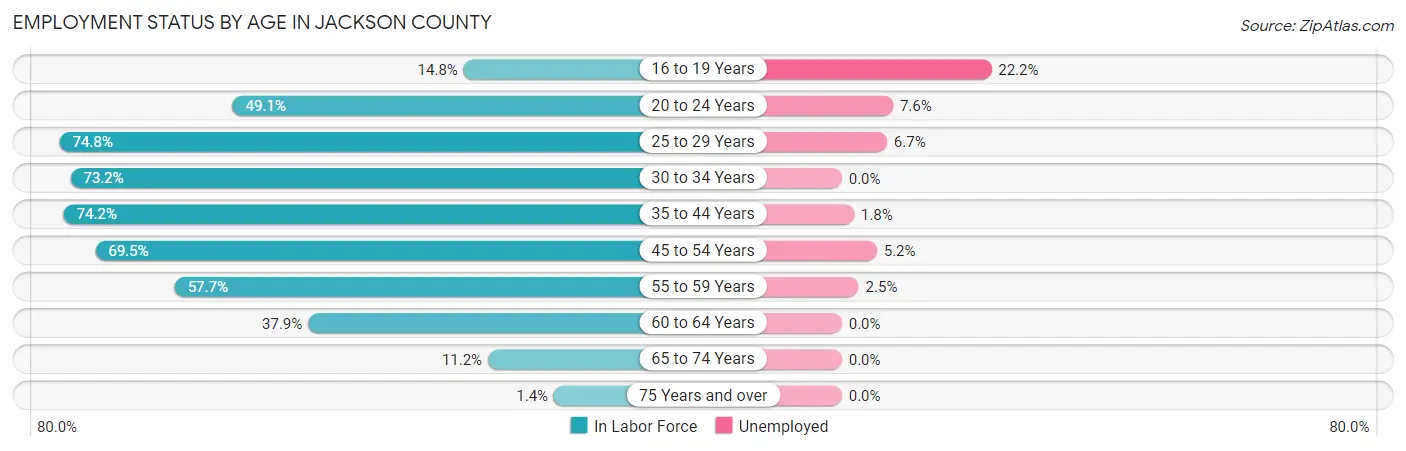
| Age Bracket | In Labor Force | Unemployed |
| 16 to 19 Years | 167 (14.8%) | 37 (22.2%) |
| 20 to 24 Years | 773 (49.1%) | 59 (7.6%) |
| 25 to 29 Years | 1,118 (74.8%) | 75 (6.7%) |
| 30 to 34 Years | 1,118 (73.2%) | 0 (0.0%) |
| 35 to 44 Years | 2,396 (74.2%) | 43 (1.8%) |
| 45 to 54 Years | 2,549 (69.5%) | 133 (5.2%) |
| 55 to 59 Years | 1,345 (57.7%) | 34 (2.5%) |
| 60 to 64 Years | 699 (37.9%) | 0 (0.0%) |
| 65 to 74 Years | 365 (11.2%) | 0 (0.0%) |
| 75 Years and over | 35 (1.4%) | 0 (0.0%) |
| Total | 10,552 (46.8%) | 380 (3.6%) |
Employment Status by Educational Attainment in Jackson County
According to labor force statistics for Jackson County, 65.4% of individuals (9,217) out of the total population between 25 and 64 years of age (14,093) are in the labor force, with 3.1% or 286 of them being unemployed. The group with the highest labor force participation rate are those with the educational attainment of bachelor's degree or higher, with 86.5% or 2,575 individuals in the labor force. Within the labor force, individuals with less than high school education have the highest percentage of unemployment, with 5.6% or 16 of them being unemployed.
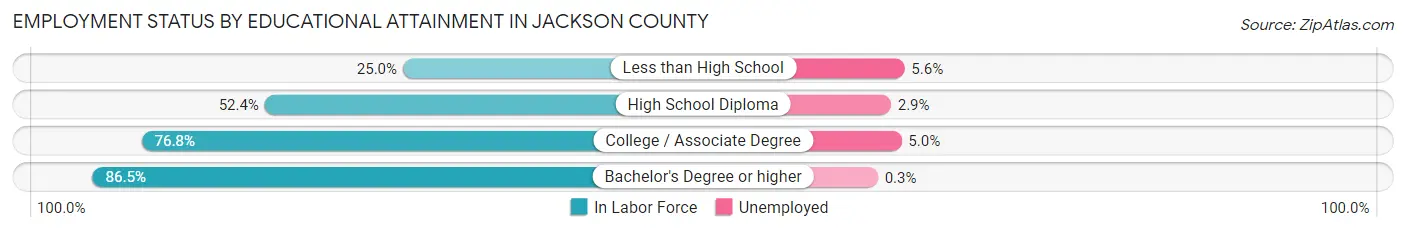
| Educational Attainment | In Labor Force | Unemployed |
| Less than High School | 288 (25.0%) | 65 (5.6%) |
| High School Diploma | 2,766 (52.4%) | 153 (2.9%) |
| College / Associate Degree | 3,597 (76.8%) | 234 (5.0%) |
| Bachelor's Degree or higher | 2,575 (86.5%) | 9 (0.3%) |
| Total | 9,217 (65.4%) | 437 (3.1%) |
Employment Occupations by Sex in Jackson County
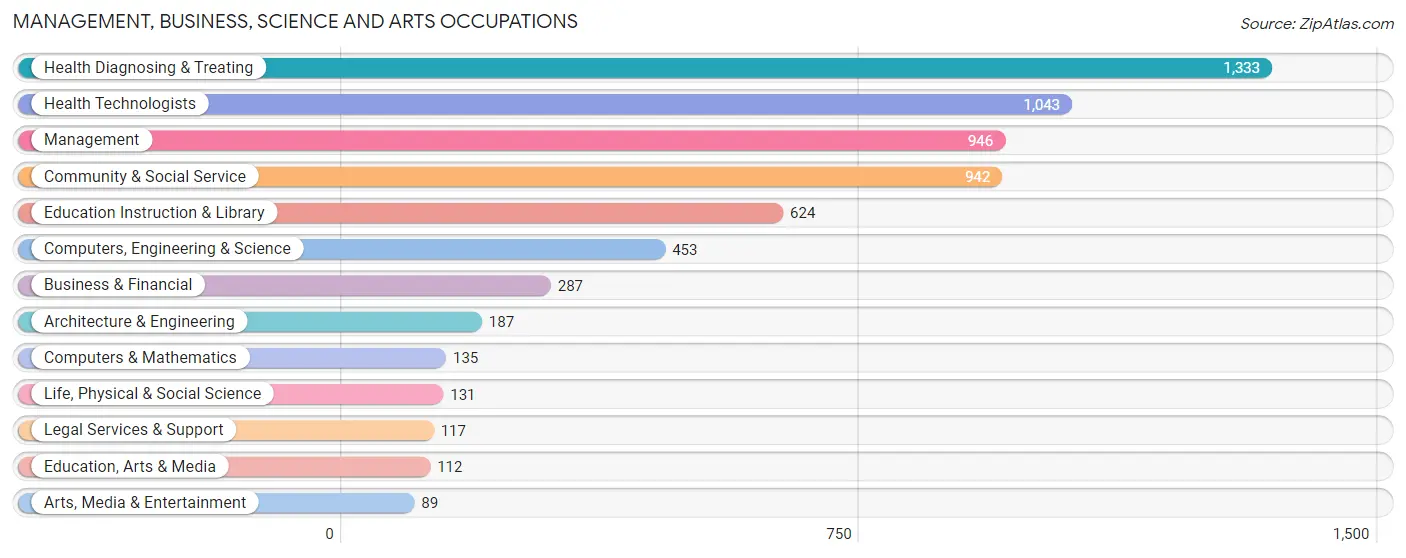
Management, Business, Science and Arts Occupations
The most common Management, Business, Science and Arts occupations in Jackson County are Health Diagnosing & Treating (1,333 | 13.1%), Health Technologists (1,043 | 10.3%), Management (946 | 9.3%), Community & Social Service (942 | 9.3%), and Education Instruction & Library (624 | 6.1%).
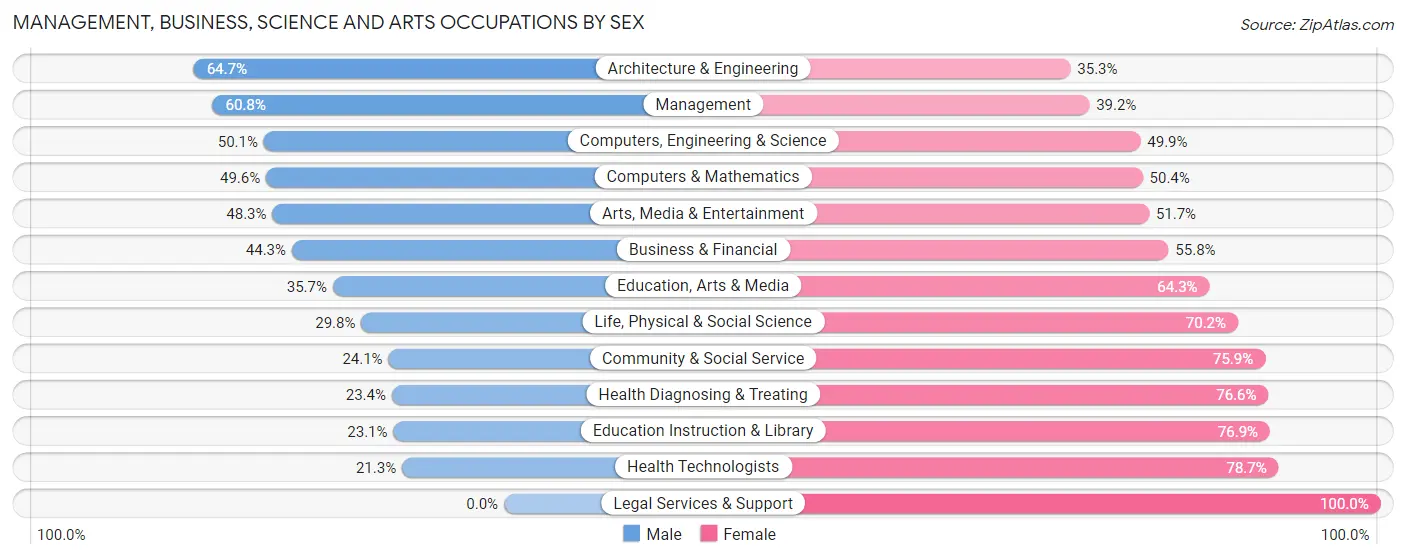
Management, Business, Science and Arts Occupations by Sex
Within the Management, Business, Science and Arts occupations in Jackson County, the most male-oriented occupations are Architecture & Engineering (64.7%), Management (60.8%), and Computers, Engineering & Science (50.1%), while the most female-oriented occupations are Legal Services & Support (100.0%), Health Technologists (78.7%), and Education Instruction & Library (76.9%).
| Occupation | Male | Female |
| Management | 575 (60.8%) | 371 (39.2%) |
| Business & Financial | 127 (44.3%) | 160 (55.7%) |
| Computers, Engineering & Science | 227 (50.1%) | 226 (49.9%) |
| Computers & Mathematics | 67 (49.6%) | 68 (50.4%) |
| Architecture & Engineering | 121 (64.7%) | 66 (35.3%) |
| Life, Physical & Social Science | 39 (29.8%) | 92 (70.2%) |
| Community & Social Service | 227 (24.1%) | 715 (75.9%) |
| Education, Arts & Media | 40 (35.7%) | 72 (64.3%) |
| Legal Services & Support | 0 (0.0%) | 117 (100.0%) |
| Education Instruction & Library | 144 (23.1%) | 480 (76.9%) |
| Arts, Media & Entertainment | 43 (48.3%) | 46 (51.7%) |
| Health Diagnosing & Treating | 312 (23.4%) | 1,021 (76.6%) |
| Health Technologists | 222 (21.3%) | 821 (78.7%) |
| Total (Category) | 1,468 (37.1%) | 2,493 (62.9%) |
| Total (Overall) | 5,576 (54.9%) | 4,588 (45.1%) |
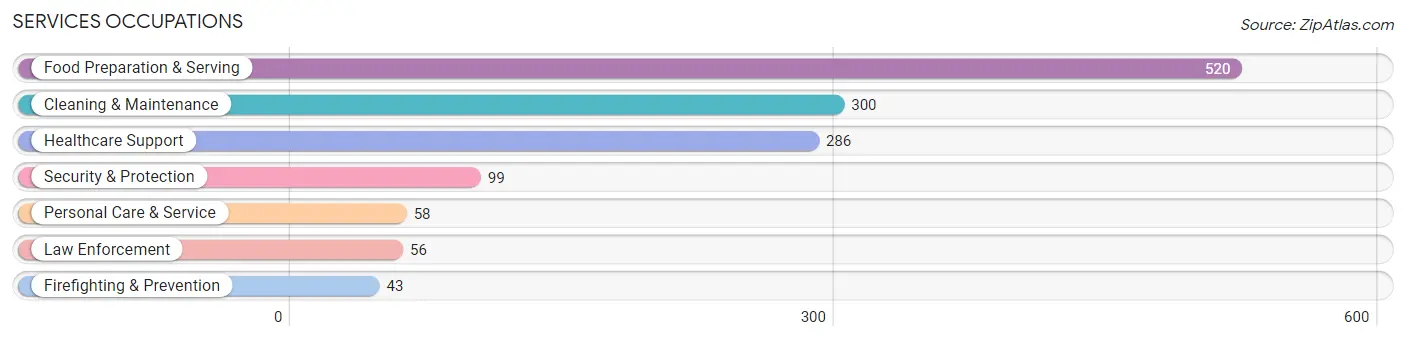
Services Occupations
The most common Services occupations in Jackson County are Food Preparation & Serving (520 | 5.1%), Cleaning & Maintenance (300 | 2.9%), Healthcare Support (286 | 2.8%), Security & Protection (99 | 1.0%), and Personal Care & Service (58 | 0.6%).
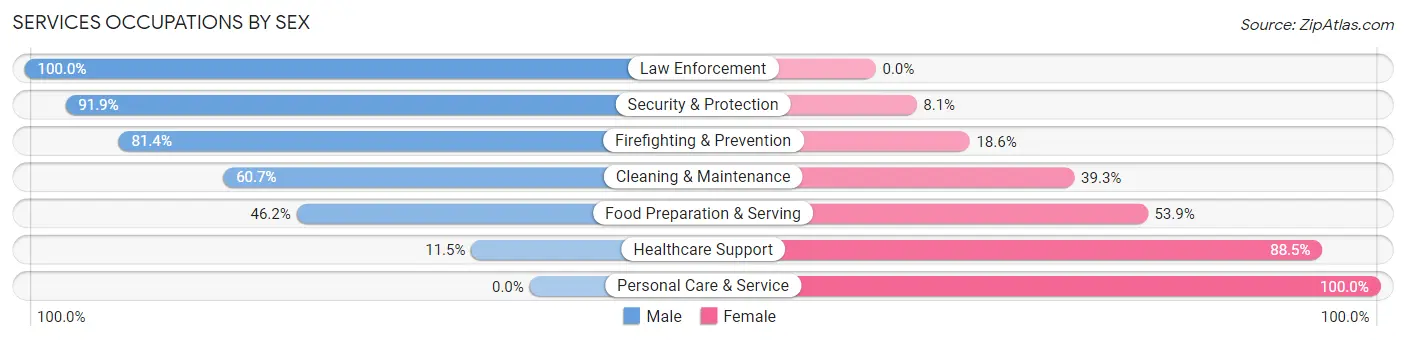
Services Occupations by Sex
Within the Services occupations in Jackson County, the most male-oriented occupations are Law Enforcement (100.0%), Security & Protection (91.9%), and Firefighting & Prevention (81.4%), while the most female-oriented occupations are Personal Care & Service (100.0%), Healthcare Support (88.5%), and Food Preparation & Serving (53.8%).
| Occupation | Male | Female |
| Healthcare Support | 33 (11.5%) | 253 (88.5%) |
| Security & Protection | 91 (91.9%) | 8 (8.1%) |
| Firefighting & Prevention | 35 (81.4%) | 8 (18.6%) |
| Law Enforcement | 56 (100.0%) | 0 (0.0%) |
| Food Preparation & Serving | 240 (46.2%) | 280 (53.8%) |
| Cleaning & Maintenance | 182 (60.7%) | 118 (39.3%) |
| Personal Care & Service | 0 (0.0%) | 58 (100.0%) |
| Total (Category) | 546 (43.2%) | 717 (56.8%) |
| Total (Overall) | 5,576 (54.9%) | 4,588 (45.1%) |
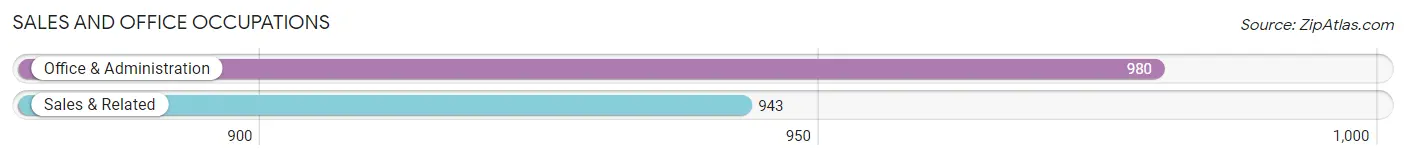
Sales and Office Occupations
The most common Sales and Office occupations in Jackson County are Office & Administration (980 | 9.6%), and Sales & Related (943 | 9.3%).
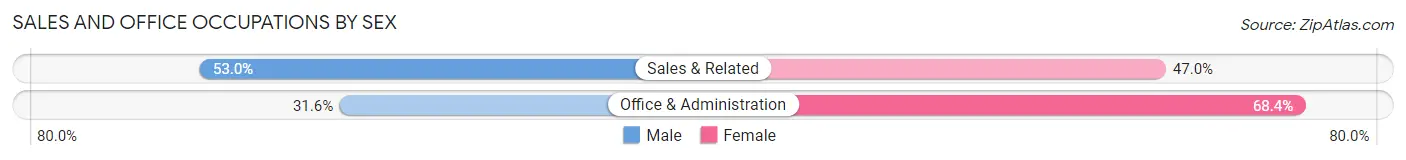
Sales and Office Occupations by Sex
| Occupation | Male | Female |
| Sales & Related | 500 (53.0%) | 443 (47.0%) |
| Office & Administration | 310 (31.6%) | 670 (68.4%) |
| Total (Category) | 810 (42.1%) | 1,113 (57.9%) |
| Total (Overall) | 5,576 (54.9%) | 4,588 (45.1%) |
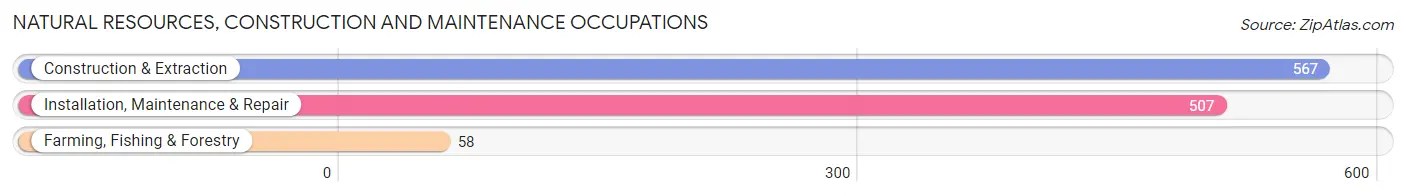
Natural Resources, Construction and Maintenance Occupations
The most common Natural Resources, Construction and Maintenance occupations in Jackson County are Construction & Extraction (567 | 5.6%), Installation, Maintenance & Repair (507 | 5.0%), and Farming, Fishing & Forestry (58 | 0.6%).
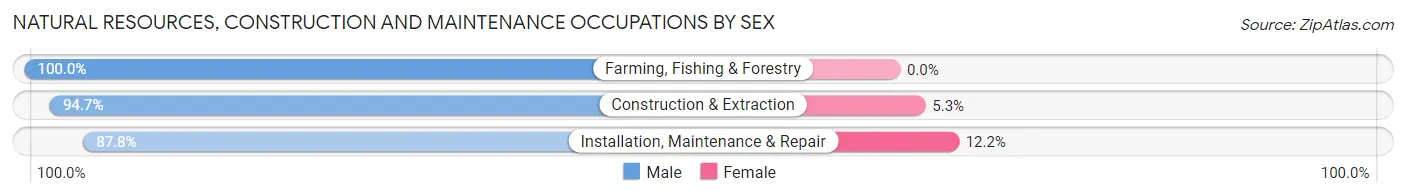
Natural Resources, Construction and Maintenance Occupations by Sex
| Occupation | Male | Female |
| Farming, Fishing & Forestry | 58 (100.0%) | 0 (0.0%) |
| Construction & Extraction | 537 (94.7%) | 30 (5.3%) |
| Installation, Maintenance & Repair | 445 (87.8%) | 62 (12.2%) |
| Total (Category) | 1,040 (91.9%) | 92 (8.1%) |
| Total (Overall) | 5,576 (54.9%) | 4,588 (45.1%) |
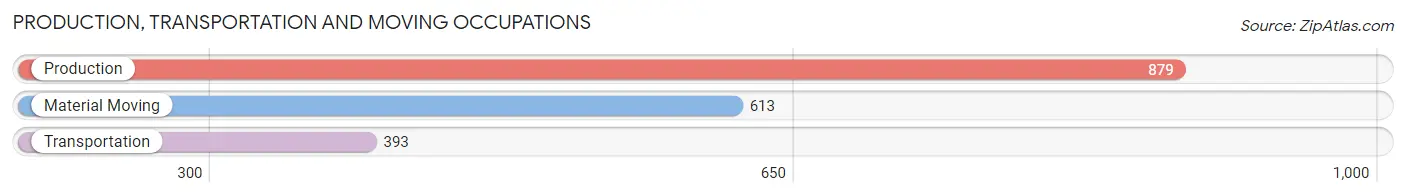
Production, Transportation and Moving Occupations
The most common Production, Transportation and Moving occupations in Jackson County are Production (879 | 8.6%), Material Moving (613 | 6.0%), and Transportation (393 | 3.9%).
Production, Transportation and Moving Occupations by Sex
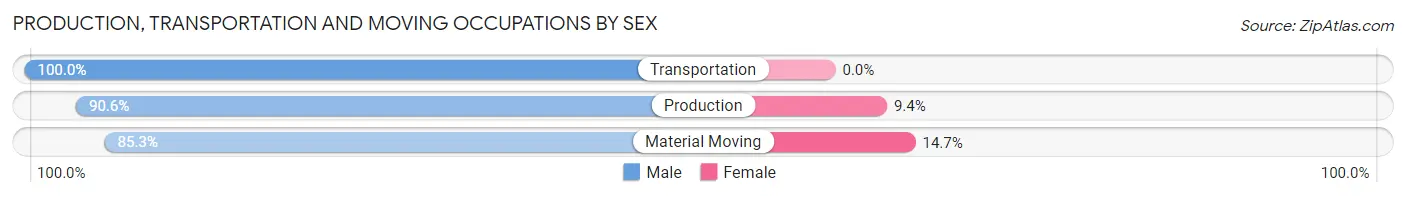
| Occupation | Male | Female |
| Production | 796 (90.6%) | 83 (9.4%) |
| Transportation | 393 (100.0%) | 0 (0.0%) |
| Material Moving | 523 (85.3%) | 90 (14.7%) |
| Total (Category) | 1,712 (90.8%) | 173 (9.2%) |
| Total (Overall) | 5,576 (54.9%) | 4,588 (45.1%) |
Employment Industries by Sex in Jackson County
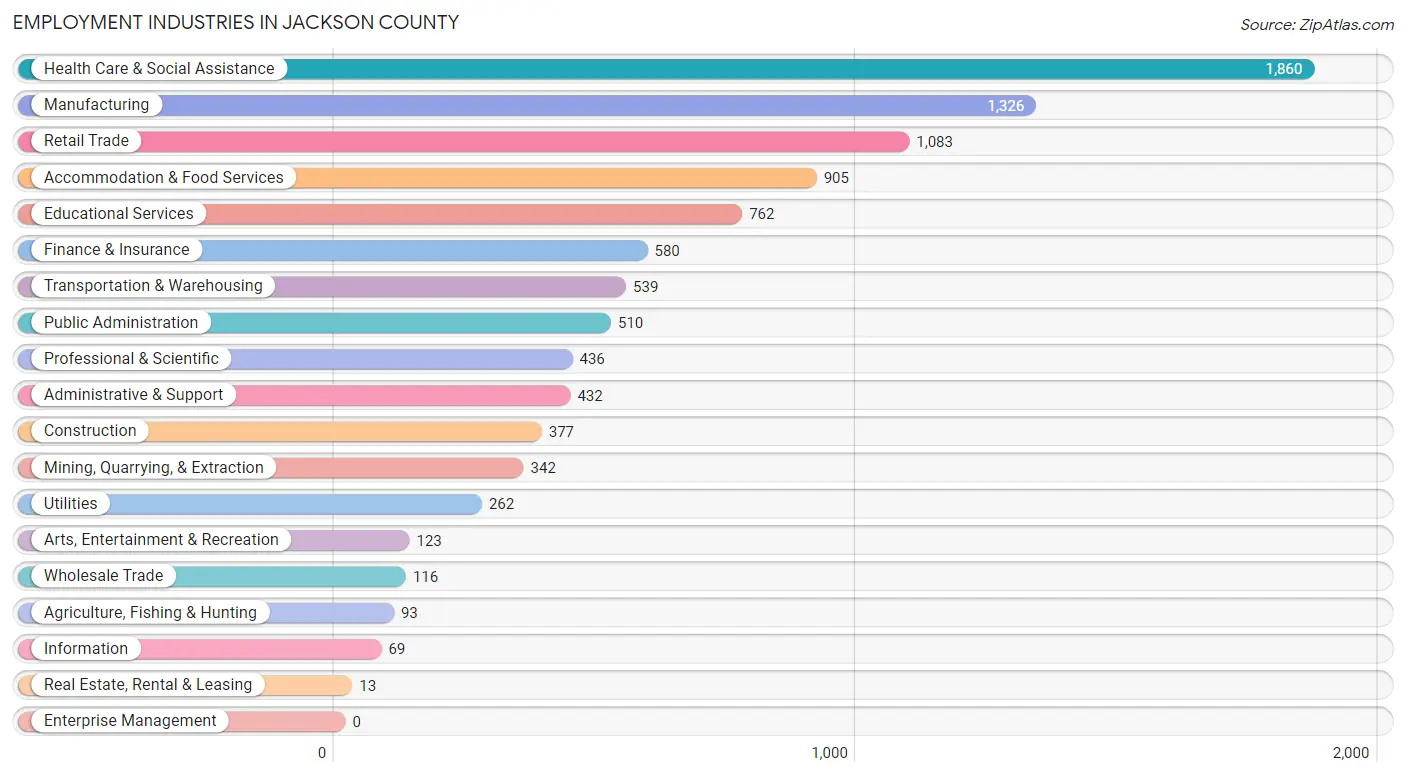
Employment Industries in Jackson County
The major employment industries in Jackson County include Health Care & Social Assistance (1,860 | 18.3%), Manufacturing (1,326 | 13.1%), Retail Trade (1,083 | 10.7%), Accommodation & Food Services (905 | 8.9%), and Educational Services (762 | 7.5%).
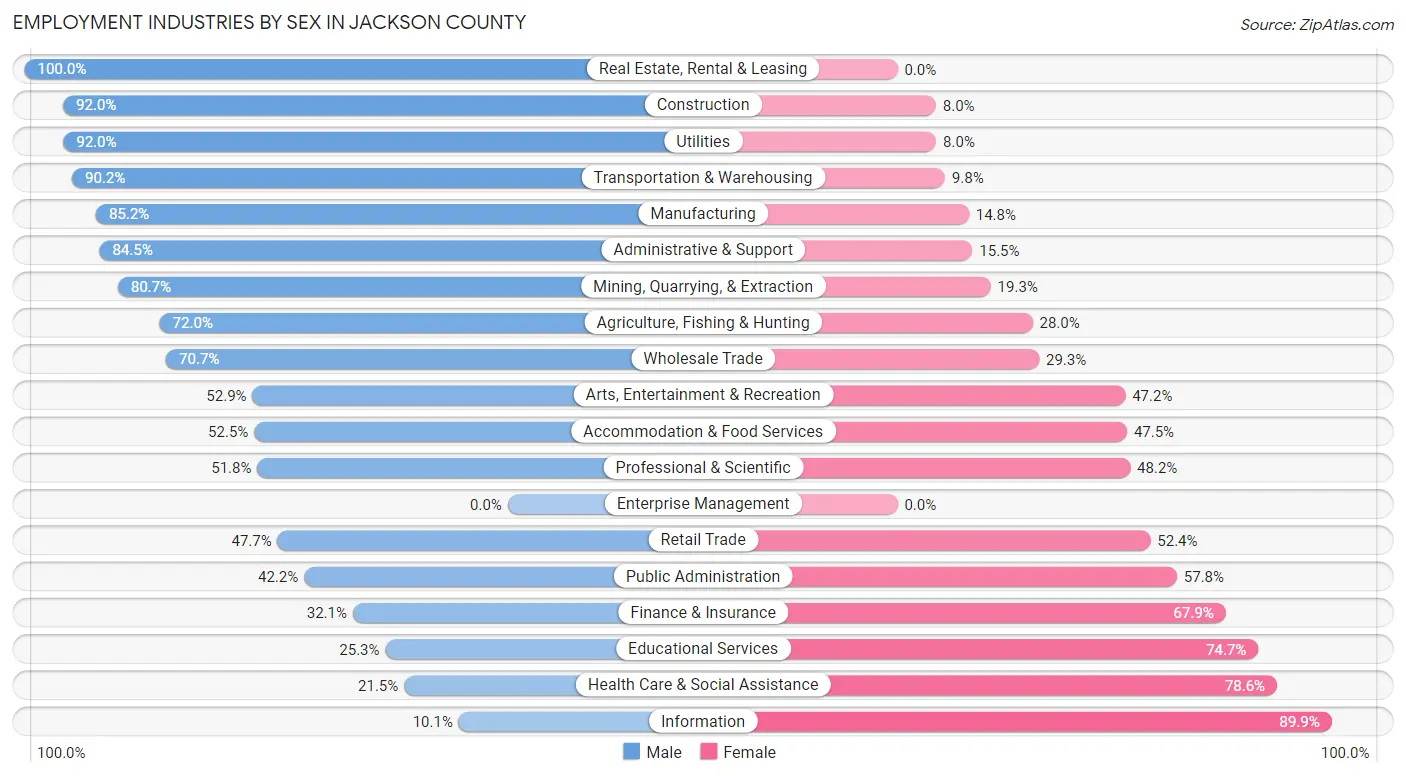
Employment Industries by Sex in Jackson County
The Jackson County industries that see more men than women are Real Estate, Rental & Leasing (100.0%), Construction (92.0%), and Utilities (92.0%), whereas the industries that tend to have a higher number of women are Information (89.9%), Health Care & Social Assistance (78.5%), and Educational Services (74.7%).
| Industry | Male | Female |
| Agriculture, Fishing & Hunting | 67 (72.0%) | 26 (28.0%) |
| Mining, Quarrying, & Extraction | 276 (80.7%) | 66 (19.3%) |
| Construction | 347 (92.0%) | 30 (8.0%) |
| Manufacturing | 1,130 (85.2%) | 196 (14.8%) |
| Wholesale Trade | 82 (70.7%) | 34 (29.3%) |
| Retail Trade | 516 (47.6%) | 567 (52.3%) |
| Transportation & Warehousing | 486 (90.2%) | 53 (9.8%) |
| Utilities | 241 (92.0%) | 21 (8.0%) |
| Information | 7 (10.1%) | 62 (89.9%) |
| Finance & Insurance | 186 (32.1%) | 394 (67.9%) |
| Real Estate, Rental & Leasing | 13 (100.0%) | 0 (0.0%) |
| Professional & Scientific | 226 (51.8%) | 210 (48.2%) |
| Enterprise Management | 0 (0.0%) | 0 (0.0%) |
| Administrative & Support | 365 (84.5%) | 67 (15.5%) |
| Educational Services | 193 (25.3%) | 569 (74.7%) |
| Health Care & Social Assistance | 399 (21.4%) | 1,461 (78.5%) |
| Arts, Entertainment & Recreation | 65 (52.8%) | 58 (47.1%) |
| Accommodation & Food Services | 475 (52.5%) | 430 (47.5%) |
| Public Administration | 215 (42.2%) | 295 (57.8%) |
| Total | 5,576 (54.9%) | 4,588 (45.1%) |
Education in Jackson County
School Enrollment in Jackson County
The most common levels of schooling among the 5,472 students in Jackson County are middle school (1,540 | 28.1%), elementary school (1,347 | 24.6%), and high school (1,197 | 21.9%).
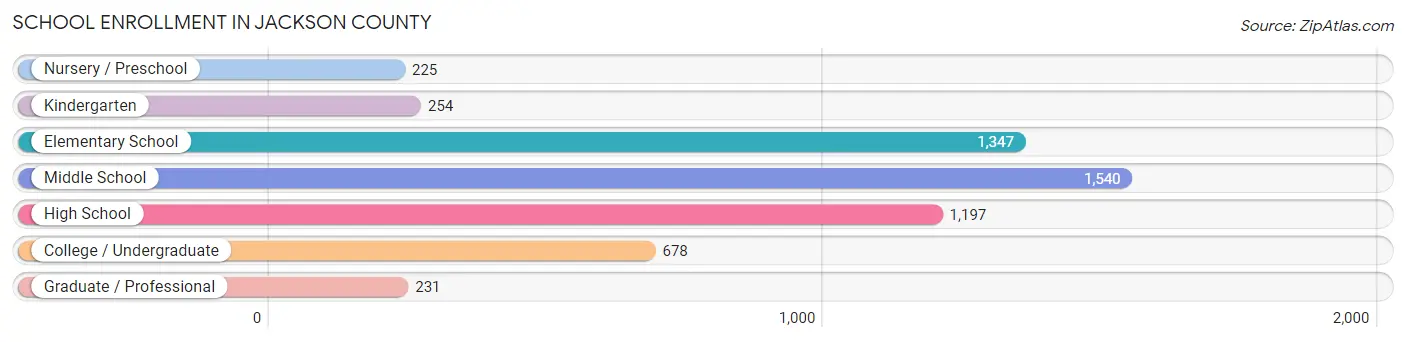
| School Level | # Students | % Students |
| Nursery / Preschool | 225 | 4.1% |
| Kindergarten | 254 | 4.6% |
| Elementary School | 1,347 | 24.6% |
| Middle School | 1,540 | 28.1% |
| High School | 1,197 | 21.9% |
| College / Undergraduate | 678 | 12.4% |
| Graduate / Professional | 231 | 4.2% |
| Total | 5,472 | 100.0% |
School Enrollment by Age by Funding Source in Jackson County
Out of a total of 5,472 students who are enrolled in schools in Jackson County, 651 (11.9%) attend a private institution, while the remaining 4,821 (88.1%) are enrolled in public schools. The age group of 35 years and over has the highest likelihood of being enrolled in private schools, with 24 (24.0% in the age bracket) enrolled. Conversely, the age group of 5 to 9 year old has the lowest likelihood of being enrolled in a private school, with 1,505 (92.5% in the age bracket) attending a public institution.
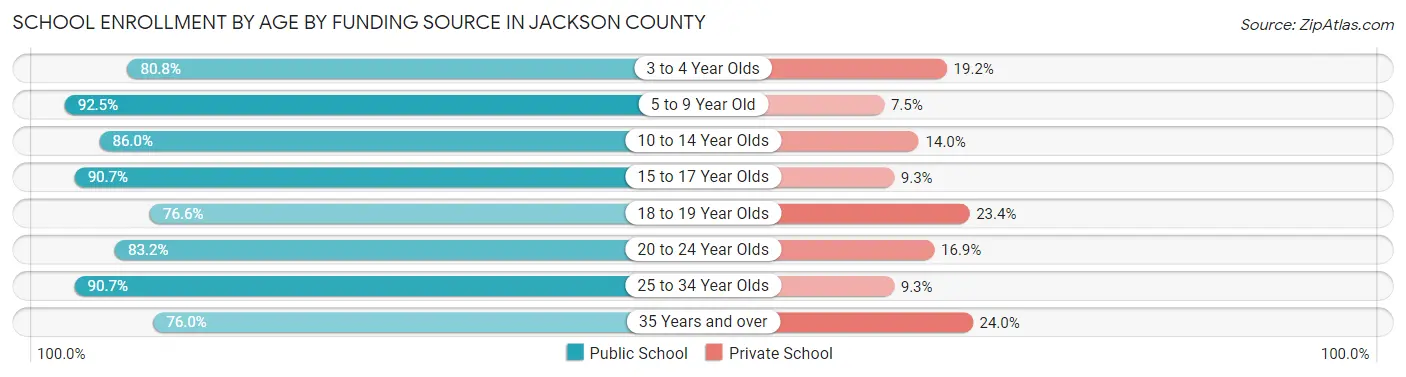
| Age Bracket | Public School | Private School |
| 3 to 4 Year Olds | 59 (80.8%) | 14 (19.2%) |
| 5 to 9 Year Old | 1,505 (92.5%) | 122 (7.5%) |
| 10 to 14 Year Olds | 1,479 (86.0%) | 240 (14.0%) |
| 15 to 17 Year Olds | 971 (90.7%) | 100 (9.3%) |
| 18 to 19 Year Olds | 226 (76.6%) | 69 (23.4%) |
| 20 to 24 Year Olds | 301 (83.2%) | 61 (16.9%) |
| 25 to 34 Year Olds | 204 (90.7%) | 21 (9.3%) |
| 35 Years and over | 76 (76.0%) | 24 (24.0%) |
| Total | 4,821 (88.1%) | 651 (11.9%) |
Educational Attainment by Field of Study in Jackson County
Education (1,067 | 27.1%), science & technology (792 | 20.1%), business (657 | 16.7%), bio, nature & agricultural (380 | 9.6%), and engineering (216 | 5.5%) are the most common fields of study among 3,942 individuals in Jackson County who have obtained a bachelor's degree or higher.
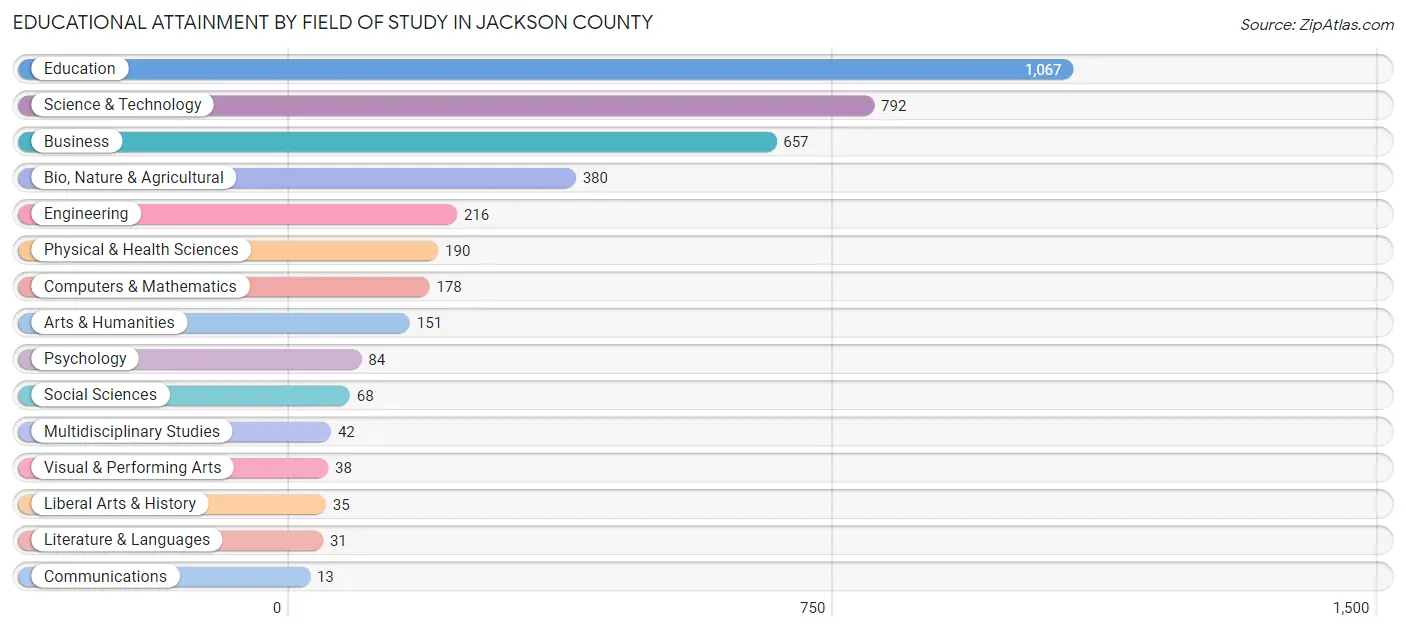
| Field of Study | # Graduates | % Graduates |
| Computers & Mathematics | 178 | 4.5% |
| Bio, Nature & Agricultural | 380 | 9.6% |
| Physical & Health Sciences | 190 | 4.8% |
| Psychology | 84 | 2.1% |
| Social Sciences | 68 | 1.7% |
| Engineering | 216 | 5.5% |
| Multidisciplinary Studies | 42 | 1.1% |
| Science & Technology | 792 | 20.1% |
| Business | 657 | 16.7% |
| Education | 1,067 | 27.1% |
| Literature & Languages | 31 | 0.8% |
| Liberal Arts & History | 35 | 0.9% |
| Visual & Performing Arts | 38 | 1.0% |
| Communications | 13 | 0.3% |
| Arts & Humanities | 151 | 3.8% |
| Total | 3,942 | 100.0% |
Transportation & Commute in Jackson County
Vehicle Availability by Sex in Jackson County
The most prevalent vehicle ownership categories in Jackson County are males with 2 vehicles (2,223, accounting for 39.9%) and females with 2 vehicles (1,807, making up 48.6%).
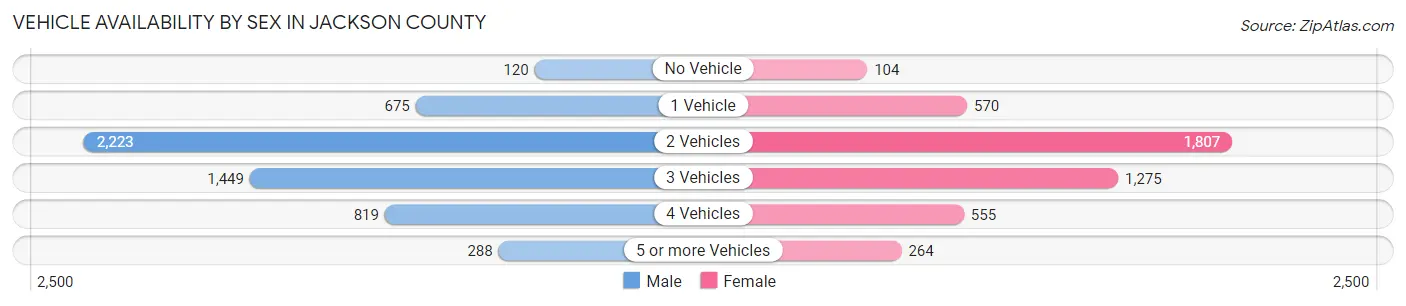
| Vehicles Available | Male | Female |
| No Vehicle | 120 (2.1%) | 104 (2.3%) |
| 1 Vehicle | 675 (12.1%) | 570 (12.5%) |
| 2 Vehicles | 2,223 (39.9%) | 1,807 (39.5%) |
| 3 Vehicles | 1,449 (26.0%) | 1,275 (27.9%) |
| 4 Vehicles | 819 (14.7%) | 555 (12.1%) |
| 5 or more Vehicles | 288 (5.2%) | 264 (5.8%) |
| Total | 5,574 (100.0%) | 4,575 (100.0%) |
Commute Time in Jackson County
The most frequently occuring commute durations in Jackson County are 10 to 14 minutes (1,482 commuters, 15.8%), 45 to 59 minutes (1,449 commuters, 15.4%), and 20 to 24 minutes (1,387 commuters, 14.8%).
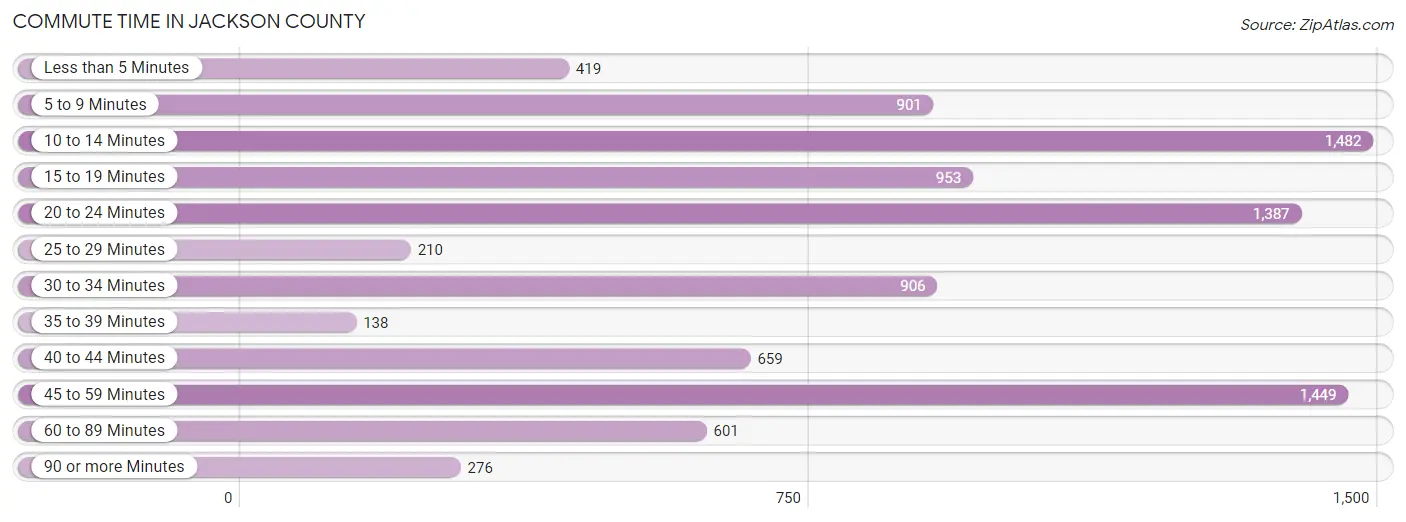
| Commute Time | # Commuters | % Commuters |
| Less than 5 Minutes | 419 | 4.5% |
| 5 to 9 Minutes | 901 | 9.6% |
| 10 to 14 Minutes | 1,482 | 15.8% |
| 15 to 19 Minutes | 953 | 10.2% |
| 20 to 24 Minutes | 1,387 | 14.8% |
| 25 to 29 Minutes | 210 | 2.2% |
| 30 to 34 Minutes | 906 | 9.7% |
| 35 to 39 Minutes | 138 | 1.5% |
| 40 to 44 Minutes | 659 | 7.0% |
| 45 to 59 Minutes | 1,449 | 15.4% |
| 60 to 89 Minutes | 601 | 6.4% |
| 90 or more Minutes | 276 | 2.9% |
Commute Time by Sex in Jackson County
The most common commute times in Jackson County are 10 to 14 minutes (1,085 commuters, 20.5%) for males and 45 to 59 minutes (578 commuters, 14.2%) for females.
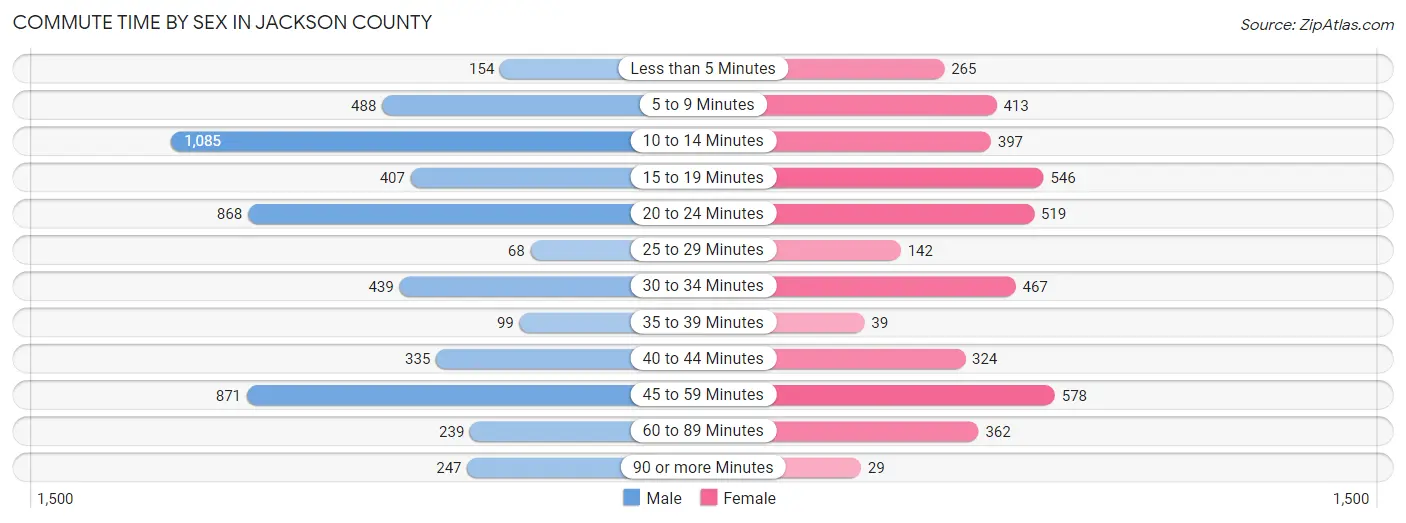
| Commute Time | Male | Female |
| Less than 5 Minutes | 154 (2.9%) | 265 (6.5%) |
| 5 to 9 Minutes | 488 (9.2%) | 413 (10.1%) |
| 10 to 14 Minutes | 1,085 (20.5%) | 397 (9.7%) |
| 15 to 19 Minutes | 407 (7.7%) | 546 (13.4%) |
| 20 to 24 Minutes | 868 (16.4%) | 519 (12.7%) |
| 25 to 29 Minutes | 68 (1.3%) | 142 (3.5%) |
| 30 to 34 Minutes | 439 (8.3%) | 467 (11.4%) |
| 35 to 39 Minutes | 99 (1.9%) | 39 (1.0%) |
| 40 to 44 Minutes | 335 (6.3%) | 324 (7.9%) |
| 45 to 59 Minutes | 871 (16.4%) | 578 (14.2%) |
| 60 to 89 Minutes | 239 (4.5%) | 362 (8.9%) |
| 90 or more Minutes | 247 (4.7%) | 29 (0.7%) |
Time of Departure to Work by Sex in Jackson County
The most frequent times of departure to work in Jackson County are 7:00 AM to 7:29 AM (842, 15.9%) for males and 7:30 AM to 7:59 AM (798, 19.6%) for females.
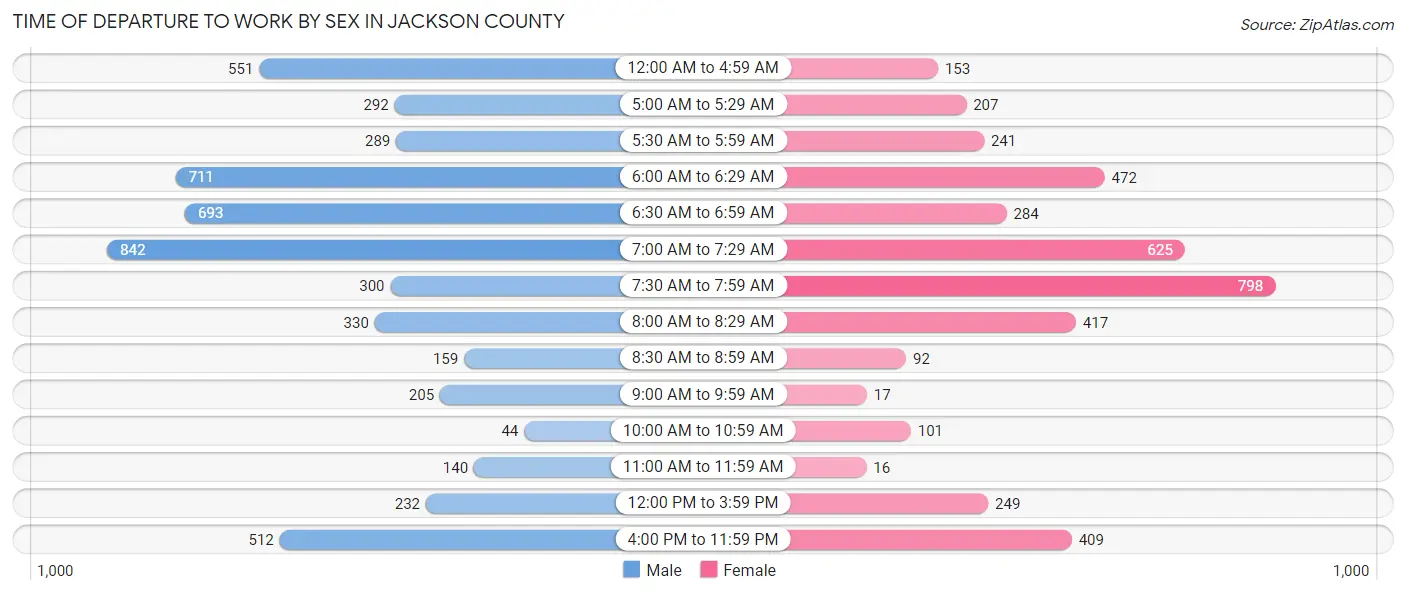
| Time of Departure | Male | Female |
| 12:00 AM to 4:59 AM | 551 (10.4%) | 153 (3.7%) |
| 5:00 AM to 5:29 AM | 292 (5.5%) | 207 (5.1%) |
| 5:30 AM to 5:59 AM | 289 (5.4%) | 241 (5.9%) |
| 6:00 AM to 6:29 AM | 711 (13.4%) | 472 (11.6%) |
| 6:30 AM to 6:59 AM | 693 (13.1%) | 284 (7.0%) |
| 7:00 AM to 7:29 AM | 842 (15.9%) | 625 (15.3%) |
| 7:30 AM to 7:59 AM | 300 (5.7%) | 798 (19.6%) |
| 8:00 AM to 8:29 AM | 330 (6.2%) | 417 (10.2%) |
| 8:30 AM to 8:59 AM | 159 (3.0%) | 92 (2.2%) |
| 9:00 AM to 9:59 AM | 205 (3.9%) | 17 (0.4%) |
| 10:00 AM to 10:59 AM | 44 (0.8%) | 101 (2.5%) |
| 11:00 AM to 11:59 AM | 140 (2.6%) | 16 (0.4%) |
| 12:00 PM to 3:59 PM | 232 (4.4%) | 249 (6.1%) |
| 4:00 PM to 11:59 PM | 512 (9.7%) | 409 (10.0%) |
| Total | 5,300 (100.0%) | 4,081 (100.0%) |
Housing Occupancy in Jackson County
Occupancy by Ownership in Jackson County
Of the total 11,148 dwellings in Jackson County, owner-occupied units account for 8,549 (76.7%), while renter-occupied units make up 2,599 (23.3%).
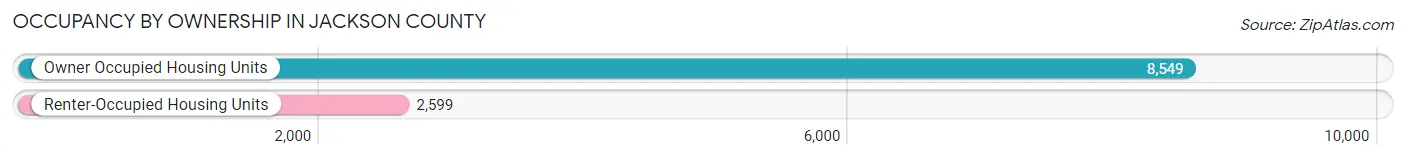
| Occupancy | # Housing Units | % Housing Units |
| Owner Occupied Housing Units | 8,549 | 76.7% |
| Renter-Occupied Housing Units | 2,599 | 23.3% |
| Total Occupied Housing Units | 11,148 | 100.0% |
Occupancy by Household Size in Jackson County
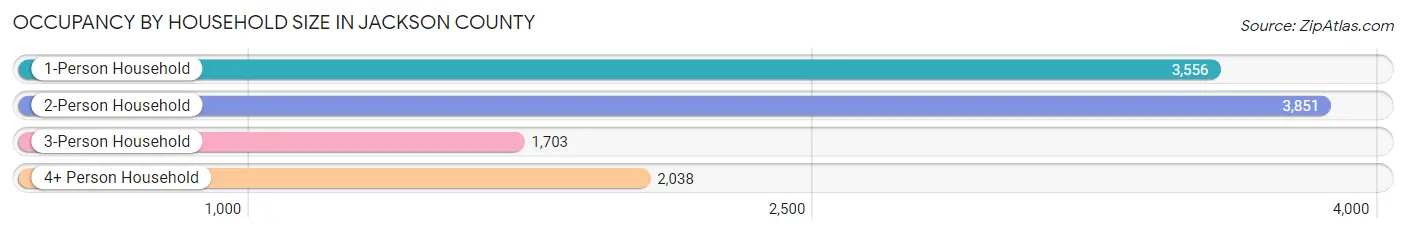
| Household Size | # Housing Units | % Housing Units |
| 1-Person Household | 3,556 | 31.9% |
| 2-Person Household | 3,851 | 34.5% |
| 3-Person Household | 1,703 | 15.3% |
| 4+ Person Household | 2,038 | 18.3% |
| Total Housing Units | 11,148 | 100.0% |
Occupancy by Ownership by Household Size in Jackson County
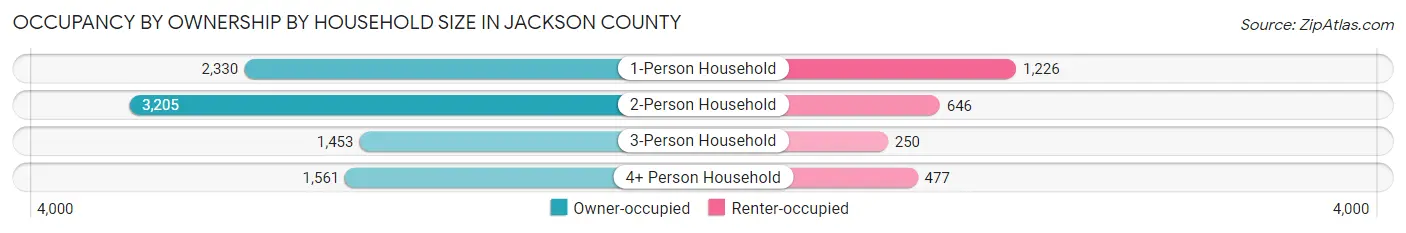
| Household Size | Owner-occupied | Renter-occupied |
| 1-Person Household | 2,330 (65.5%) | 1,226 (34.5%) |
| 2-Person Household | 3,205 (83.2%) | 646 (16.8%) |
| 3-Person Household | 1,453 (85.3%) | 250 (14.7%) |
| 4+ Person Household | 1,561 (76.6%) | 477 (23.4%) |
| Total Housing Units | 8,549 (76.7%) | 2,599 (23.3%) |
Occupancy by Educational Attainment in Jackson County
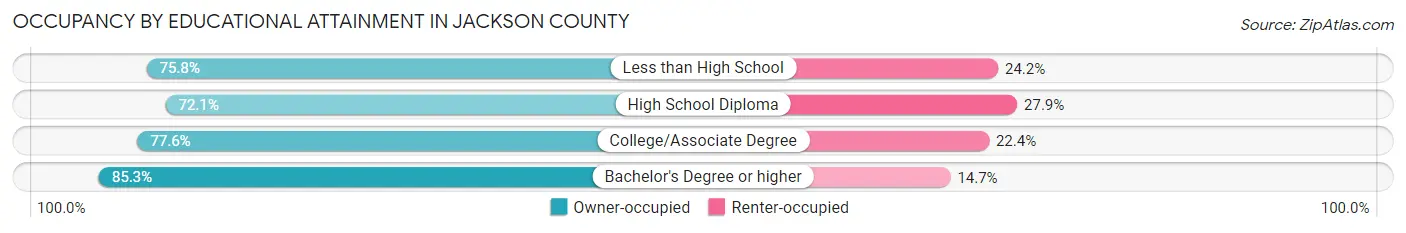
| Household Size | Owner-occupied | Renter-occupied |
| Less than High School | 731 (75.8%) | 233 (24.2%) |
| High School Diploma | 3,204 (72.1%) | 1,242 (27.9%) |
| College/Associate Degree | 2,831 (77.6%) | 816 (22.4%) |
| Bachelor's Degree or higher | 1,783 (85.3%) | 308 (14.7%) |
Occupancy by Age of Householder in Jackson County
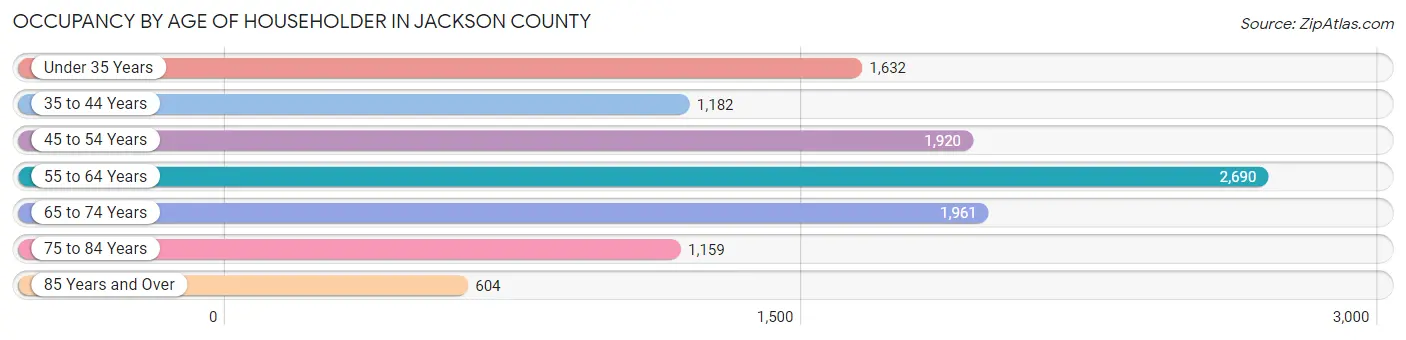
| Age Bracket | # Households | % Households |
| Under 35 Years | 1,632 | 14.6% |
| 35 to 44 Years | 1,182 | 10.6% |
| 45 to 54 Years | 1,920 | 17.2% |
| 55 to 64 Years | 2,690 | 24.1% |
| 65 to 74 Years | 1,961 | 17.6% |
| 75 to 84 Years | 1,159 | 10.4% |
| 85 Years and Over | 604 | 5.4% |
| Total | 11,148 | 100.0% |
Housing Finances in Jackson County
Median Income by Occupancy in Jackson County
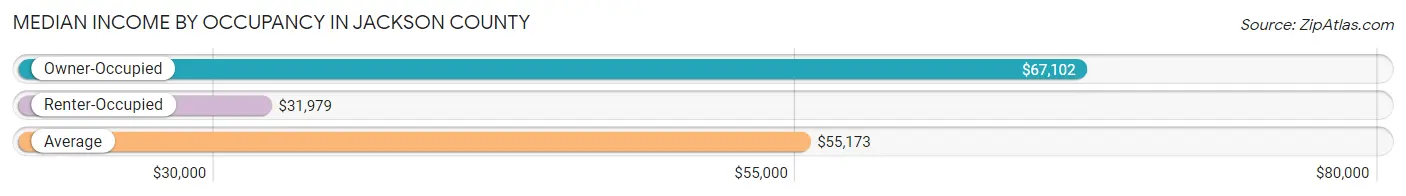
| Occupancy Type | # Households | Median Income |
| Owner-Occupied | 8,549 (76.7%) | $67,102 |
| Renter-Occupied | 2,599 (23.3%) | $31,979 |
| Average | 11,148 (100.0%) | $55,173 |
Occupancy by Householder Income Bracket in Jackson County
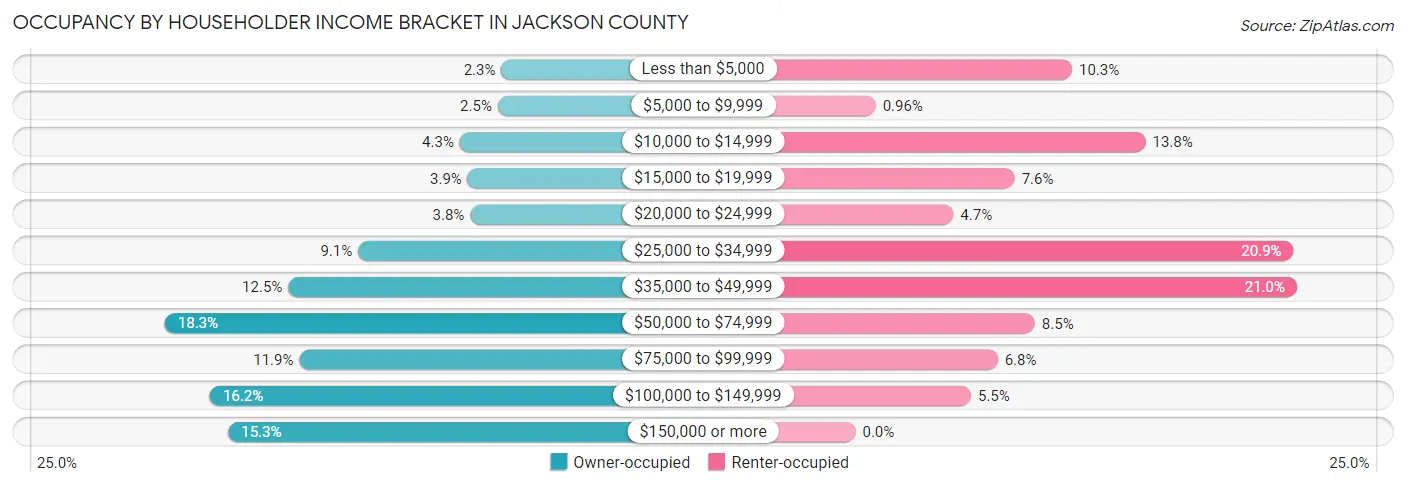
| Income Bracket | Owner-occupied | Renter-occupied |
| Less than $5,000 | 197 (2.3%) | 268 (10.3%) |
| $5,000 to $9,999 | 211 (2.5%) | 25 (1.0%) |
| $10,000 to $14,999 | 366 (4.3%) | 359 (13.8%) |
| $15,000 to $19,999 | 333 (3.9%) | 197 (7.6%) |
| $20,000 to $24,999 | 323 (3.8%) | 121 (4.7%) |
| $25,000 to $34,999 | 780 (9.1%) | 542 (20.8%) |
| $35,000 to $49,999 | 1,064 (12.4%) | 546 (21.0%) |
| $50,000 to $74,999 | 1,566 (18.3%) | 222 (8.5%) |
| $75,000 to $99,999 | 1,019 (11.9%) | 176 (6.8%) |
| $100,000 to $149,999 | 1,382 (16.2%) | 143 (5.5%) |
| $150,000 or more | 1,308 (15.3%) | 0 (0.0%) |
| Total | 8,549 (100.0%) | 2,599 (100.0%) |
Monthly Housing Cost Tiers in Jackson County
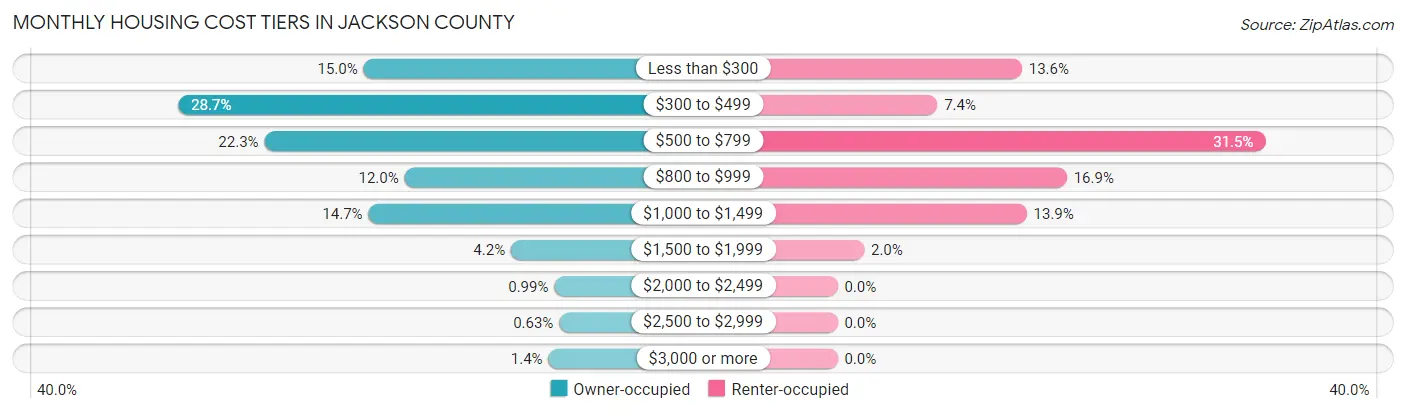
| Monthly Cost | Owner-occupied | Renter-occupied |
| Less than $300 | 1,286 (15.0%) | 353 (13.6%) |
| $300 to $499 | 2,453 (28.7%) | 191 (7.3%) |
| $500 to $799 | 1,910 (22.3%) | 819 (31.5%) |
| $800 to $999 | 1,028 (12.0%) | 439 (16.9%) |
| $1,000 to $1,499 | 1,255 (14.7%) | 362 (13.9%) |
| $1,500 to $1,999 | 357 (4.2%) | 51 (2.0%) |
| $2,000 to $2,499 | 85 (1.0%) | 0 (0.0%) |
| $2,500 to $2,999 | 54 (0.6%) | 0 (0.0%) |
| $3,000 or more | 121 (1.4%) | 0 (0.0%) |
| Total | 8,549 (100.0%) | 2,599 (100.0%) |
Physical Housing Characteristics in Jackson County
Housing Structures in Jackson County
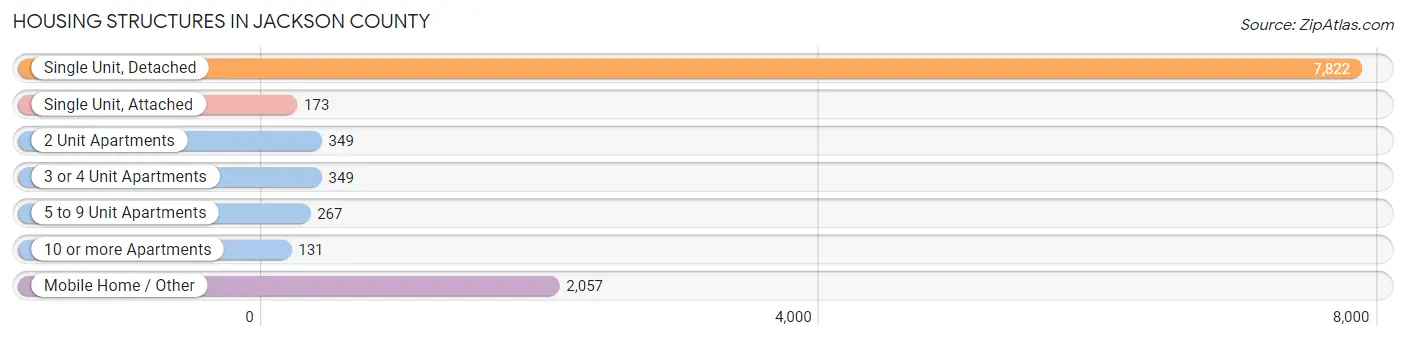
| Structure Type | # Housing Units | % Housing Units |
| Single Unit, Detached | 7,822 | 70.2% |
| Single Unit, Attached | 173 | 1.5% |
| 2 Unit Apartments | 349 | 3.1% |
| 3 or 4 Unit Apartments | 349 | 3.1% |
| 5 to 9 Unit Apartments | 267 | 2.4% |
| 10 or more Apartments | 131 | 1.2% |
| Mobile Home / Other | 2,057 | 18.4% |
| Total | 11,148 | 100.0% |
Housing Structures by Occupancy in Jackson County
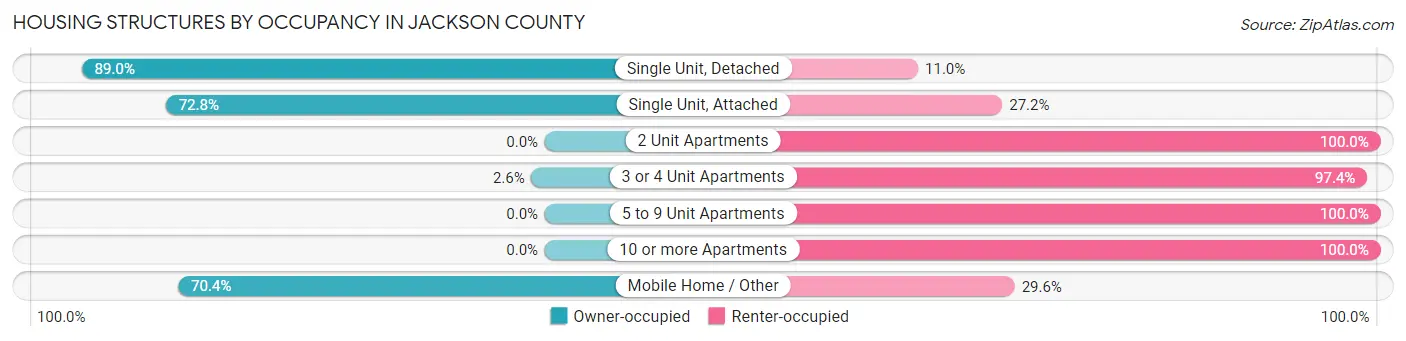
| Structure Type | Owner-occupied | Renter-occupied |
| Single Unit, Detached | 6,965 (89.0%) | 857 (11.0%) |
| Single Unit, Attached | 126 (72.8%) | 47 (27.2%) |
| 2 Unit Apartments | 0 (0.0%) | 349 (100.0%) |
| 3 or 4 Unit Apartments | 9 (2.6%) | 340 (97.4%) |
| 5 to 9 Unit Apartments | 0 (0.0%) | 267 (100.0%) |
| 10 or more Apartments | 0 (0.0%) | 131 (100.0%) |
| Mobile Home / Other | 1,449 (70.4%) | 608 (29.6%) |
| Total | 8,549 (76.7%) | 2,599 (23.3%) |
Housing Structures by Number of Rooms in Jackson County
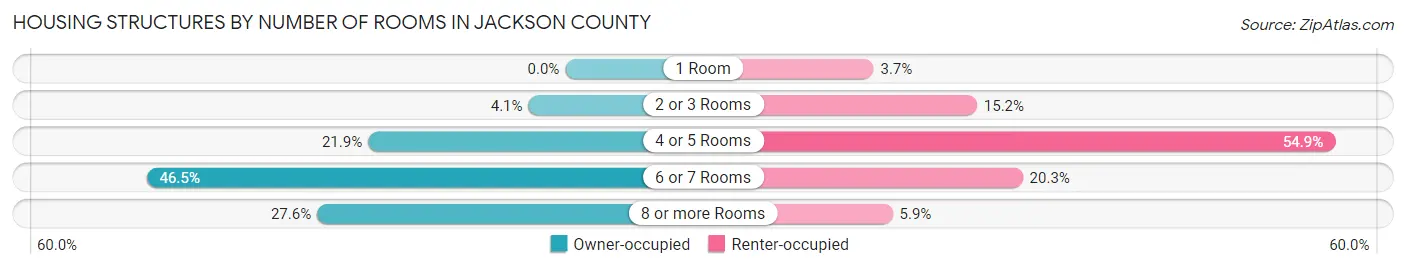
| Number of Rooms | Owner-occupied | Renter-occupied |
| 1 Room | 0 (0.0%) | 97 (3.7%) |
| 2 or 3 Rooms | 350 (4.1%) | 395 (15.2%) |
| 4 or 5 Rooms | 1,871 (21.9%) | 1,428 (54.9%) |
| 6 or 7 Rooms | 3,973 (46.5%) | 527 (20.3%) |
| 8 or more Rooms | 2,355 (27.6%) | 152 (5.9%) |
| Total | 8,549 (100.0%) | 2,599 (100.0%) |
Housing Structure by Heating Type in Jackson County

| Heating Type | Owner-occupied | Renter-occupied |
| Utility Gas | 3,146 (36.8%) | 509 (19.6%) |
| Bottled, Tank, or LP Gas | 428 (5.0%) | 101 (3.9%) |
| Electricity | 4,464 (52.2%) | 1,919 (73.8%) |
| Fuel Oil or Kerosene | 0 (0.0%) | 0 (0.0%) |
| Coal or Coke | 0 (0.0%) | 0 (0.0%) |
| All other Fuels | 490 (5.7%) | 70 (2.7%) |
| No Fuel Used | 21 (0.3%) | 0 (0.0%) |
| Total | 8,549 (100.0%) | 2,599 (100.0%) |
Household Vehicle Usage in Jackson County
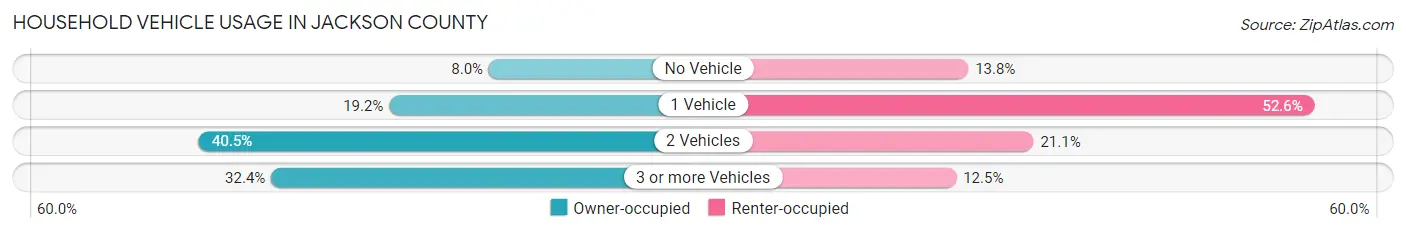
| Vehicles per Household | Owner-occupied | Renter-occupied |
| No Vehicle | 683 (8.0%) | 359 (13.8%) |
| 1 Vehicle | 1,638 (19.2%) | 1,367 (52.6%) |
| 2 Vehicles | 3,460 (40.5%) | 549 (21.1%) |
| 3 or more Vehicles | 2,768 (32.4%) | 324 (12.5%) |
| Total | 8,549 (100.0%) | 2,599 (100.0%) |
Real Estate & Mortgages in Jackson County
Real Estate and Mortgage Overview in Jackson County
| Characteristic | Without Mortgage | With Mortgage |
| Housing Units | 5,163 | 3,386 |
| Median Property Value | $152,100 | $143,200 |
| Median Household Income | $54,170 | $858 |
| Monthly Housing Costs | $384 | $97 |
| Real Estate Taxes | $872 | $72 |
Property Value by Mortgage Status in Jackson County
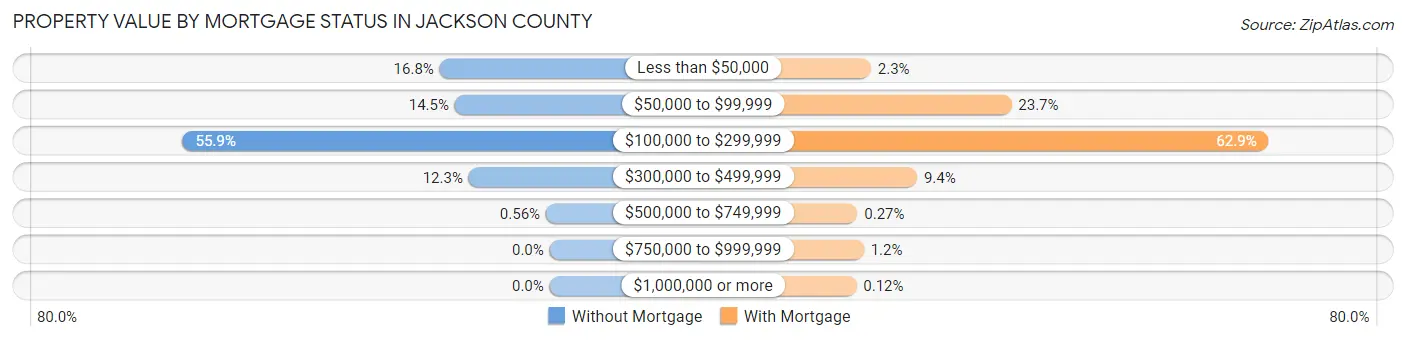
| Property Value | Without Mortgage | With Mortgage |
| Less than $50,000 | 865 (16.8%) | 79 (2.3%) |
| $50,000 to $99,999 | 746 (14.4%) | 804 (23.7%) |
| $100,000 to $299,999 | 2,887 (55.9%) | 2,131 (62.9%) |
| $300,000 to $499,999 | 636 (12.3%) | 317 (9.4%) |
| $500,000 to $749,999 | 29 (0.6%) | 9 (0.3%) |
| $750,000 to $999,999 | 0 (0.0%) | 42 (1.2%) |
| $1,000,000 or more | 0 (0.0%) | 4 (0.1%) |
| Total | 5,163 (100.0%) | 3,386 (100.0%) |
Household Income by Mortgage Status in Jackson County
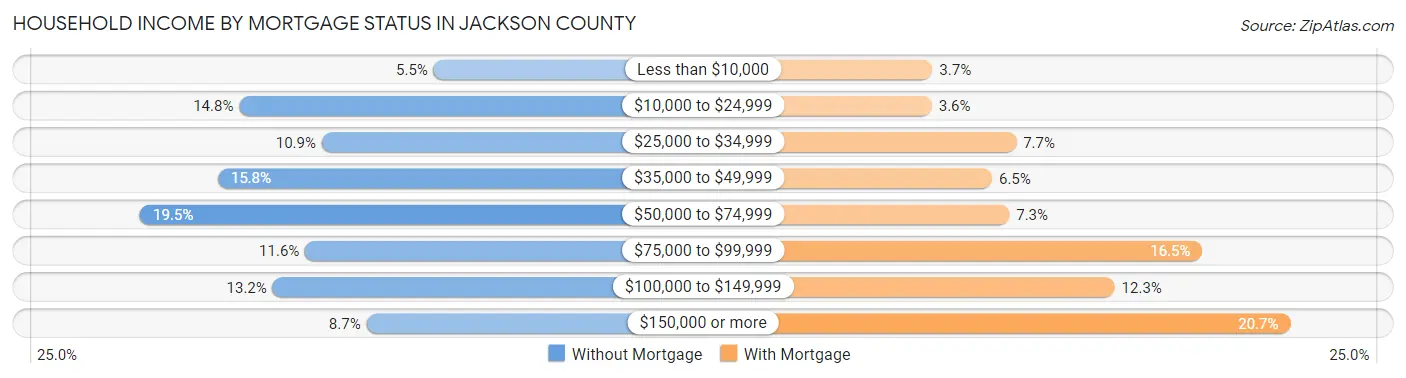
| Household Income | Without Mortgage | With Mortgage |
| Less than $10,000 | 285 (5.5%) | 124 (3.7%) |
| $10,000 to $24,999 | 763 (14.8%) | 123 (3.6%) |
| $25,000 to $34,999 | 560 (10.8%) | 259 (7.6%) |
| $35,000 to $49,999 | 816 (15.8%) | 220 (6.5%) |
| $50,000 to $74,999 | 1,007 (19.5%) | 248 (7.3%) |
| $75,000 to $99,999 | 601 (11.6%) | 559 (16.5%) |
| $100,000 to $149,999 | 681 (13.2%) | 418 (12.3%) |
| $150,000 or more | 450 (8.7%) | 701 (20.7%) |
| Total | 5,163 (100.0%) | 3,386 (100.0%) |
Property Value to Household Income Ratio in Jackson County
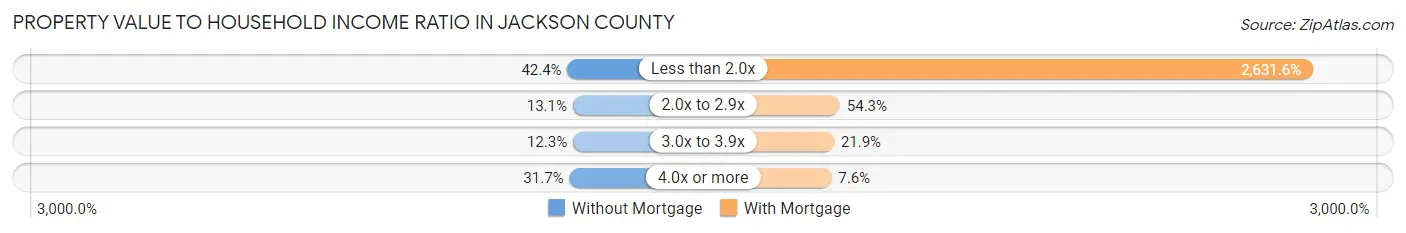
| Value-to-Income Ratio | Without Mortgage | With Mortgage |
| Less than 2.0x | 2,188 (42.4%) | 89,107 (2,631.6%) |
| 2.0x to 2.9x | 678 (13.1%) | 1,837 (54.2%) |
| 3.0x to 3.9x | 637 (12.3%) | 741 (21.9%) |
| 4.0x or more | 1,637 (31.7%) | 257 (7.6%) |
| Total | 5,163 (100.0%) | 3,386 (100.0%) |
Real Estate Taxes by Mortgage Status in Jackson County
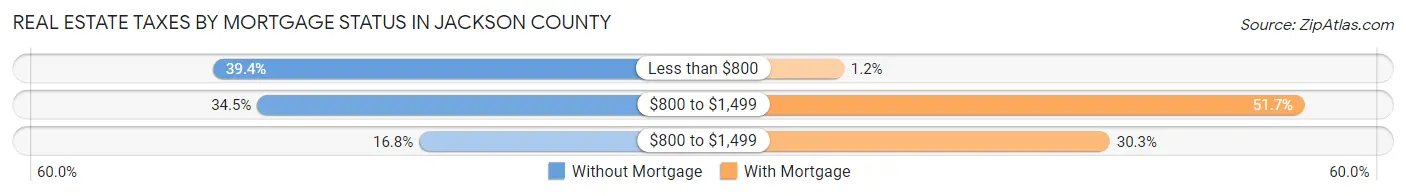
| Property Taxes | Without Mortgage | With Mortgage |
| Less than $800 | 2,032 (39.4%) | 40 (1.2%) |
| $800 to $1,499 | 1,782 (34.5%) | 1,751 (51.7%) |
| $800 to $1,499 | 866 (16.8%) | 1,027 (30.3%) |
| Total | 5,163 (100.0%) | 3,386 (100.0%) |
Health & Disability in Jackson County
Health Insurance Coverage by Age in Jackson County
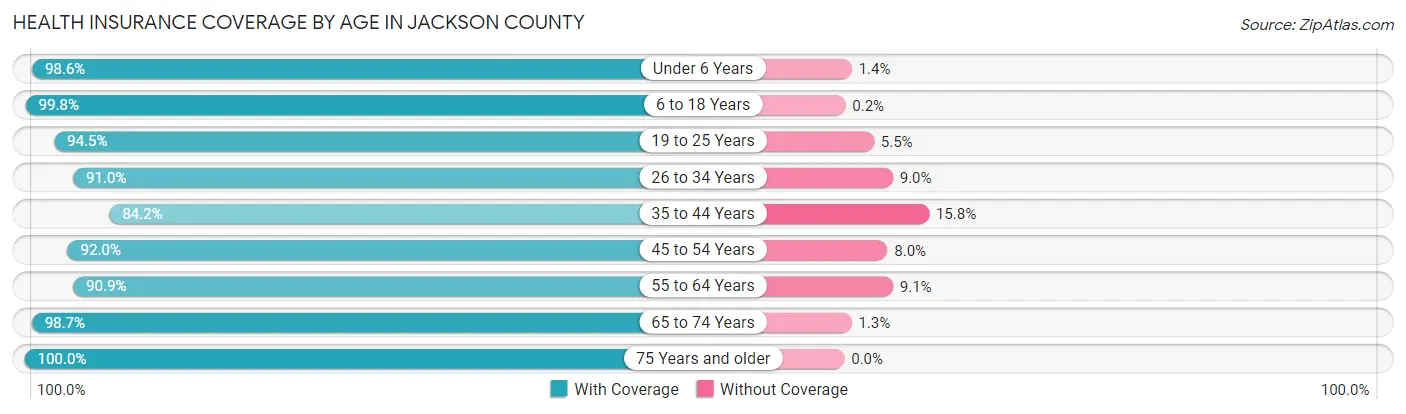
| Age Bracket | With Coverage | Without Coverage |
| Under 6 Years | 1,714 (98.6%) | 24 (1.4%) |
| 6 to 18 Years | 4,519 (99.8%) | 9 (0.2%) |
| 19 to 25 Years | 2,023 (94.5%) | 118 (5.5%) |
| 26 to 34 Years | 2,385 (91.0%) | 237 (9.0%) |
| 35 to 44 Years | 2,719 (84.2%) | 510 (15.8%) |
| 45 to 54 Years | 3,356 (92.0%) | 293 (8.0%) |
| 55 to 64 Years | 3,783 (90.9%) | 377 (9.1%) |
| 65 to 74 Years | 3,179 (98.7%) | 43 (1.3%) |
| 75 Years and older | 2,377 (100.0%) | 0 (0.0%) |
| Total | 26,055 (94.2%) | 1,611 (5.8%) |
Health Insurance Coverage by Citizenship Status in Jackson County
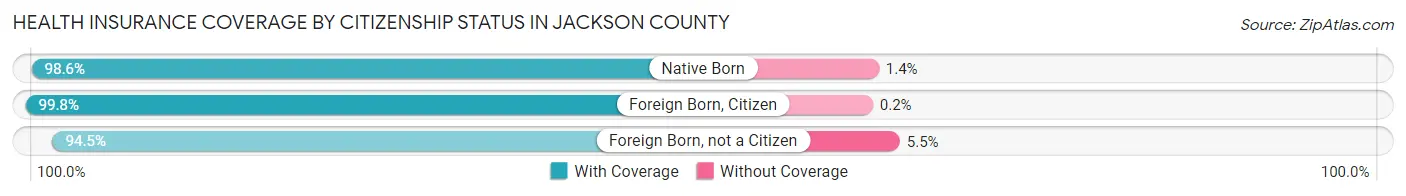
| Citizenship Status | With Coverage | Without Coverage |
| Native Born | 1,714 (98.6%) | 24 (1.4%) |
| Foreign Born, Citizen | 4,519 (99.8%) | 9 (0.2%) |
| Foreign Born, not a Citizen | 2,023 (94.5%) | 118 (5.5%) |
Health Insurance Coverage by Household Income in Jackson County
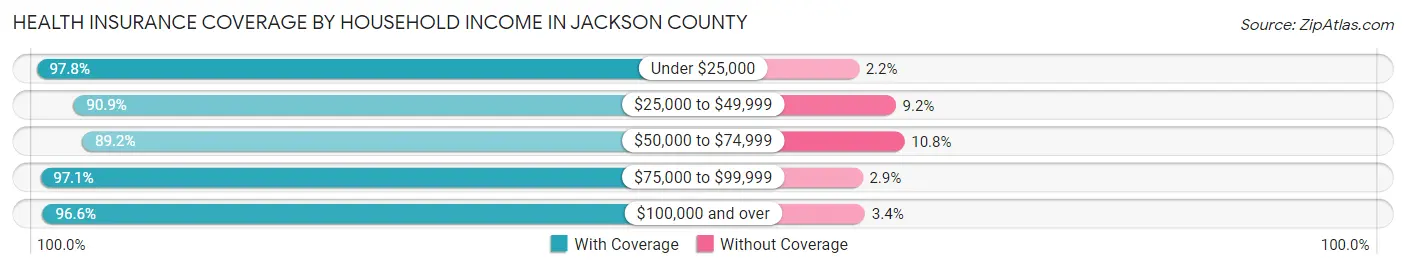
| Household Income | With Coverage | Without Coverage |
| Under $25,000 | 3,806 (97.8%) | 87 (2.2%) |
| $25,000 to $49,999 | 6,297 (90.8%) | 634 (9.1%) |
| $50,000 to $74,999 | 4,047 (89.2%) | 489 (10.8%) |
| $75,000 to $99,999 | 3,494 (97.1%) | 106 (2.9%) |
| $100,000 and over | 8,411 (96.6%) | 295 (3.4%) |
Public vs Private Health Insurance Coverage by Age in Jackson County
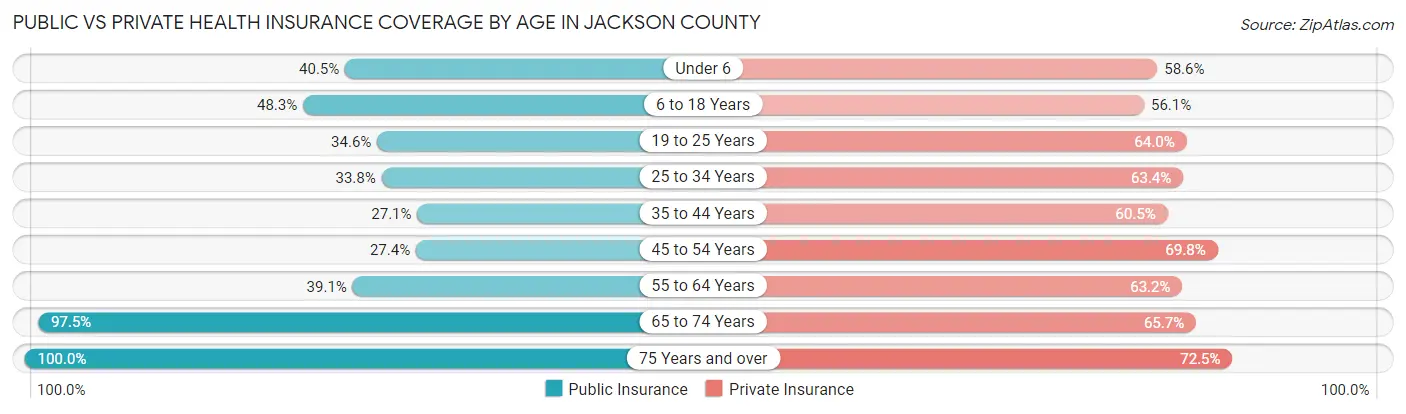
| Age Bracket | Public Insurance | Private Insurance |
| Under 6 | 704 (40.5%) | 1,018 (58.6%) |
| 6 to 18 Years | 2,188 (48.3%) | 2,540 (56.1%) |
| 19 to 25 Years | 740 (34.6%) | 1,370 (64.0%) |
| 25 to 34 Years | 885 (33.8%) | 1,661 (63.3%) |
| 35 to 44 Years | 875 (27.1%) | 1,953 (60.5%) |
| 45 to 54 Years | 998 (27.4%) | 2,545 (69.8%) |
| 55 to 64 Years | 1,627 (39.1%) | 2,629 (63.2%) |
| 65 to 74 Years | 3,142 (97.5%) | 2,118 (65.7%) |
| 75 Years and over | 2,377 (100.0%) | 1,723 (72.5%) |
| Total | 13,536 (48.9%) | 17,557 (63.5%) |
Disability Status by Sex by Age in Jackson County
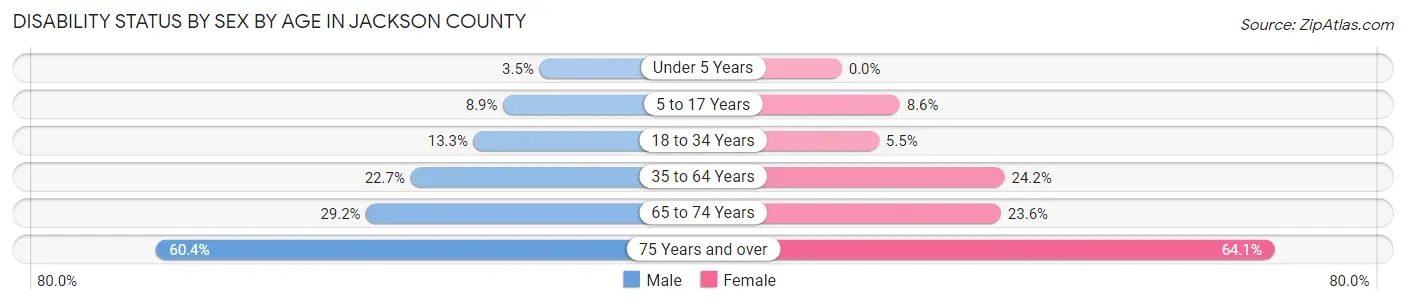
| Age Bracket | Male | Female |
| Under 5 Years | 27 (3.5%) | 0 (0.0%) |
| 5 to 17 Years | 211 (8.9%) | 190 (8.6%) |
| 18 to 34 Years | 349 (13.3%) | 129 (5.5%) |
| 35 to 64 Years | 1,252 (22.7%) | 1,333 (24.2%) |
| 65 to 74 Years | 457 (29.2%) | 392 (23.6%) |
| 75 Years and over | 594 (60.4%) | 894 (64.1%) |
Disability Class by Sex by Age in Jackson County
Disability Class: Hearing Difficulty
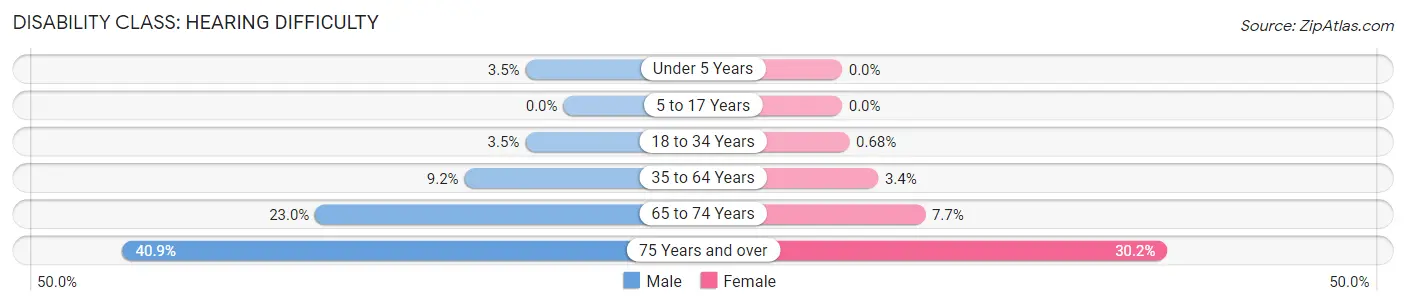
| Age Bracket | Male | Female |
| Under 5 Years | 27 (3.5%) | 0 (0.0%) |
| 5 to 17 Years | 0 (0.0%) | 0 (0.0%) |
| 18 to 34 Years | 93 (3.5%) | 16 (0.7%) |
| 35 to 64 Years | 507 (9.2%) | 185 (3.4%) |
| 65 to 74 Years | 360 (23.0%) | 128 (7.7%) |
| 75 Years and over | 402 (40.9%) | 421 (30.2%) |
Disability Class: Vision Difficulty
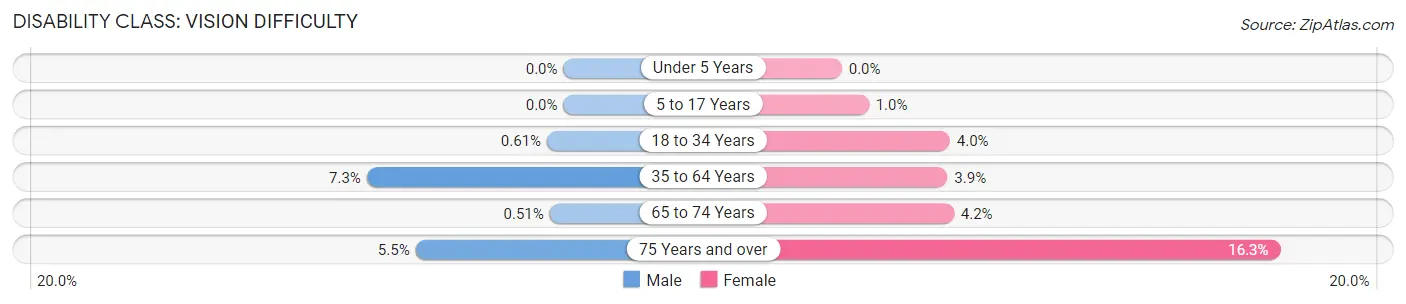
| Age Bracket | Male | Female |
| Under 5 Years | 0 (0.0%) | 0 (0.0%) |
| 5 to 17 Years | 0 (0.0%) | 22 (1.0%) |
| 18 to 34 Years | 16 (0.6%) | 94 (4.0%) |
| 35 to 64 Years | 403 (7.3%) | 216 (3.9%) |
| 65 to 74 Years | 8 (0.5%) | 69 (4.2%) |
| 75 Years and over | 54 (5.5%) | 227 (16.3%) |
Disability Class: Cognitive Difficulty
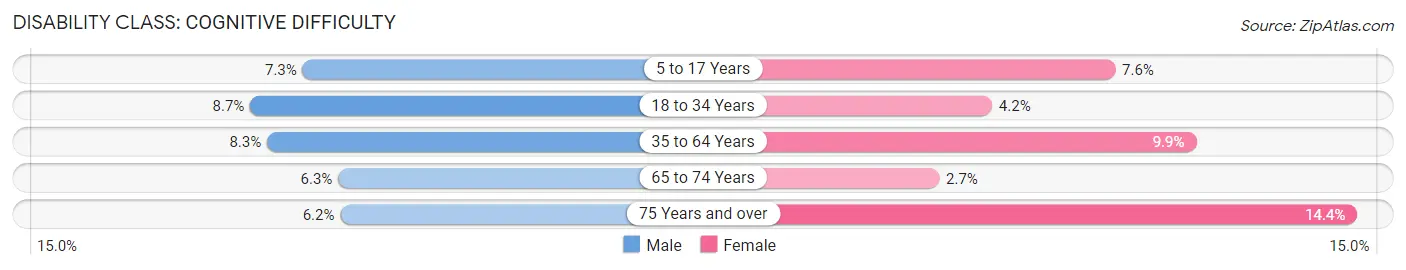
| Age Bracket | Male | Female |
| 5 to 17 Years | 172 (7.3%) | 168 (7.6%) |
| 18 to 34 Years | 229 (8.7%) | 98 (4.2%) |
| 35 to 64 Years | 456 (8.3%) | 544 (9.9%) |
| 65 to 74 Years | 98 (6.3%) | 45 (2.7%) |
| 75 Years and over | 61 (6.2%) | 200 (14.3%) |
Disability Class: Ambulatory Difficulty
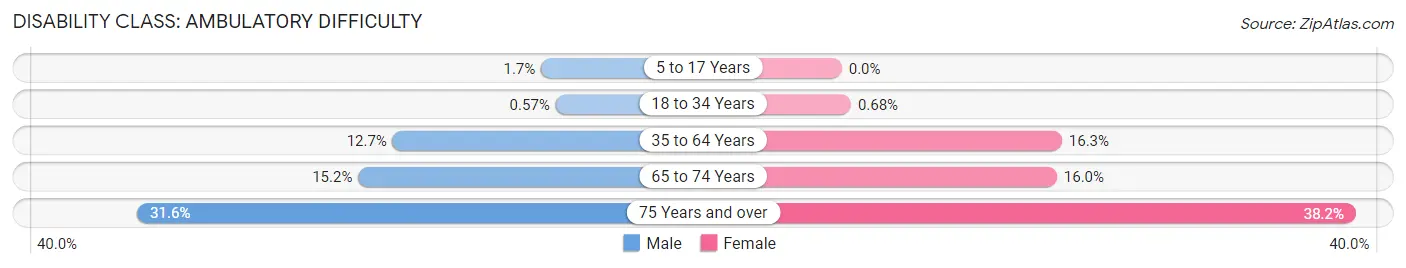
| Age Bracket | Male | Female |
| 5 to 17 Years | 39 (1.7%) | 0 (0.0%) |
| 18 to 34 Years | 15 (0.6%) | 16 (0.7%) |
| 35 to 64 Years | 700 (12.7%) | 901 (16.3%) |
| 65 to 74 Years | 238 (15.2%) | 265 (16.0%) |
| 75 Years and over | 311 (31.6%) | 532 (38.2%) |
Disability Class: Self-Care Difficulty
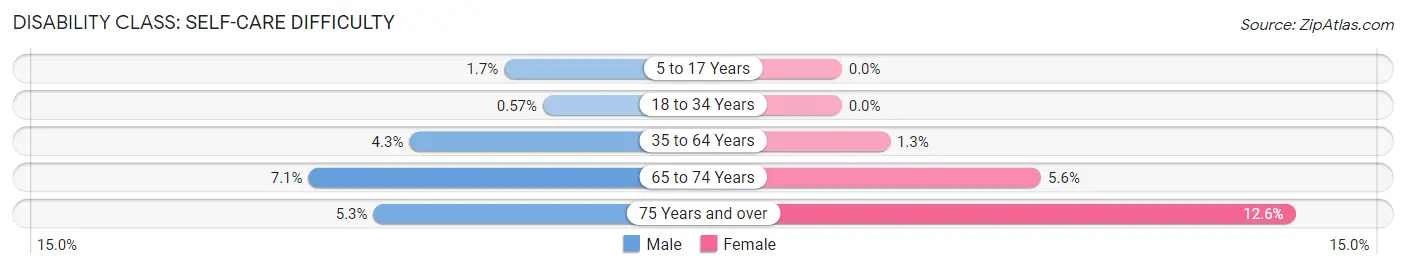
| Age Bracket | Male | Female |
| 5 to 17 Years | 39 (1.7%) | 0 (0.0%) |
| 18 to 34 Years | 15 (0.6%) | 0 (0.0%) |
| 35 to 64 Years | 237 (4.3%) | 74 (1.3%) |
| 65 to 74 Years | 111 (7.1%) | 92 (5.6%) |
| 75 Years and over | 52 (5.3%) | 176 (12.6%) |
Technology Access in Jackson County
Computing Device Access in Jackson County
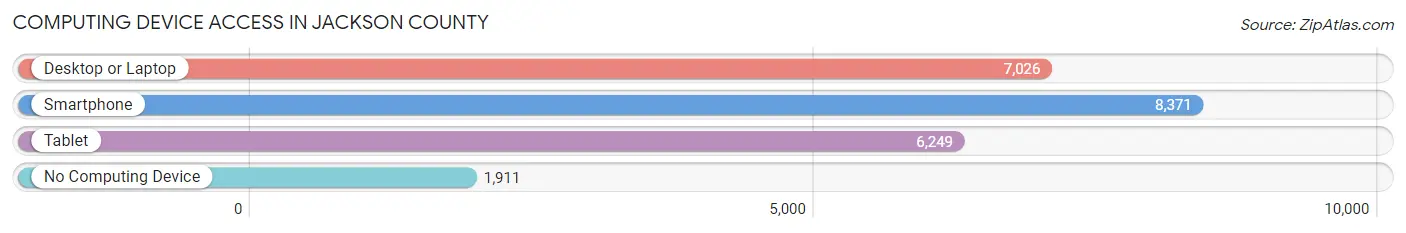
| Device Type | # Households | % Households |
| Desktop or Laptop | 7,026 | 63.0% |
| Smartphone | 8,371 | 75.1% |
| Tablet | 6,249 | 56.0% |
| No Computing Device | 1,911 | 17.1% |
| Total | 11,148 | 100.0% |
Internet Access in Jackson County
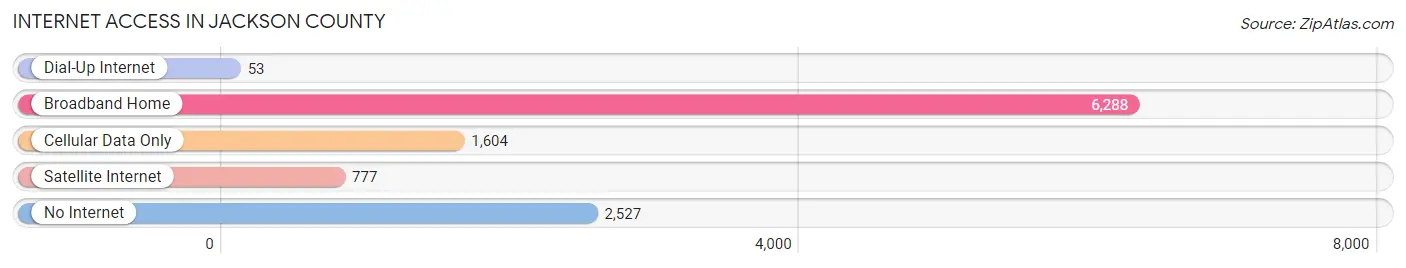
| Internet Type | # Households | % Households |
| Dial-Up Internet | 53 | 0.5% |
| Broadband Home | 6,288 | 56.4% |
| Cellular Data Only | 1,604 | 14.4% |
| Satellite Internet | 777 | 7.0% |
| No Internet | 2,527 | 22.7% |
| Total | 11,148 | 100.0% |
Jackson County Summary
Jackson County, West Virginia is located in the Appalachian Mountains of the United States. It is bordered by Roane County to the north, Mason County to the east, Putnam County to the south, and Kanawha County to the west. The county seat is Ripley, and the largest city is Ravenswood. The county was created in 1831 from parts of Kanawha, Mason, and Wood counties.
Geography
Jackson County is located in the Appalachian Mountains of West Virginia. It is bordered by Roane County to the north, Mason County to the east, Putnam County to the south, and Kanawha County to the west. The county has a total area of 441 square miles, of which 439 square miles is land and 2 square miles is water. The highest point in the county is Big Tyler Mountain, which has an elevation of 2,845 feet. The county is drained by the Ohio River and its tributaries, including the Little Kanawha River, Mill Creek, and Twelvepole Creek.
The county is mostly rural, with the majority of the population living in small towns and villages. The largest city is Ravenswood, with a population of 3,876 in 2010. Other towns and villages include Ripley, the county seat, with a population of 3,010; Cottageville, with a population of 1,072; and Evans, with a population of 845.
History
Jackson County was created in 1831 from parts of Kanawha, Mason, and Wood counties. It was named for Andrew Jackson, the seventh President of the United States. The county was largely rural and agricultural until the late 19th century, when the coal and oil industries began to develop. The county was also home to several glass factories, which produced bottles and other glass products.
The county was the site of several Civil War battles, including the Battle of Scary Creek in 1861 and the Battle of Ravenswood in 1863. The county was also the site of the first oil well in West Virginia, which was drilled in 1859.
Economy
The economy of Jackson County is largely based on agriculture and natural resources. The county is home to several large farms, which produce corn, soybeans, hay, and other crops. The county is also home to several coal mines, which produce coal for the energy industry. The county is also home to several oil and gas wells, which produce oil and natural gas for the energy industry.
The county is also home to several manufacturing companies, which produce glass, furniture, and other products. The county is also home to several tourism-related businesses, including hotels, restaurants, and recreational activities.
Demographics
As of the 2010 census, the population of Jackson County was 29,211. The racial makeup of the county was 95.3% White, 2.3% African American, 0.3% Native American, 0.3% Asian, 0.2% from other races, and 1.5% from two or more races. Hispanic or Latino of any race were 0.7% of the population.
The median income for a household in the county was $35,945, and the median income for a family was $41,945. The per capita income for the county was $17,845. About 15.2% of the population was below the poverty line.
Jackson County is served by the Jackson County School System, which includes seven elementary schools, two middle schools, and two high schools. The county is also home to several private schools, including Ravenswood Christian Academy and Jackson County Christian School. The county is also home to several higher education institutions, including West Virginia University at Parkersburg and West Virginia State University.
Common Questions
What is the Total Population of Jackson County?
Total Population of Jackson County is 27,868.
What is the Total Male Population of Jackson County?
Total Male Population of Jackson County is 13,896.
What is the Total Female Population of Jackson County?
Total Female Population of Jackson County is 13,972.
What is the Ratio of Males per 100 Females in Jackson County?
There are 99.46 Males per 100 Females in Jackson County.
What is the Ratio of Females per 100 Males in Jackson County?
There are 100.55 Females per 100 Males in Jackson County.
What is the Median Population Age in Jackson County?
Median Population Age in Jackson County is 43.3 Years.
What is the Average Family Size in Jackson County
Average Family Size in Jackson County is 3.1 People.
What is the Average Household Size in Jackson County
Average Household Size in Jackson County is 2.5 People.
What is Per Capita Income in Jackson County?
Per Capita income in Jackson County is $34,014.
What is the Median Family Income in Jackson County?
Median Family Income in Jackson County is $72,829.
What is the Median Household income in Jackson County?
Median Household Income in Jackson County is $55,173.
What is Income or Wage Gap in Jackson County?
Income or Wage Gap in Jackson County is 29.4%.
Women in Jackson County earn 70.6 cents for every dollar earned by a man.
What is Family Income Deficit in Jackson County?
Family Income Deficit in Jackson County is $8,980.
Families that are below poverty line in Jackson County earn $8,980 less on average than the poverty threshold level.
What is Inequality or Gini Index in Jackson County?
Inequality or Gini Index in Jackson County is 0.50.
How Large is the Labor Force in Jackson County?
There are 10,552 People in the Labor Forcein in Jackson County.
What is the Percentage of People in the Labor Force in Jackson County?
46.8% of People are in the Labor Force in Jackson County.
What is the Unemployment Rate in Jackson County?
Unemployment Rate in Jackson County is 3.6%.