Hampshire County, WV
Hampshire County Map
Hampshire County Overview
23,275
TOTAL POPULATION
11,985
MALE POPULATION
11,290
FEMALE POPULATION
106.16
MALES / 100 FEMALES
94.20
FEMALES / 100 MALES
47.7
MEDIAN AGE
3.6
AVG FAMILY SIZE
2.8
AVG HOUSEHOLD SIZE
$28,713
PER CAPITA INCOME
$68,312
AVG FAMILY INCOME
$55,222
AVG HOUSEHOLD INCOME
34.3%
WAGE / INCOME GAP [ % ]
65.7¢/ $1
WAGE / INCOME GAP [ $ ]
$7,612
FAMILY INCOME DEFICIT
0.43
INEQUALITY / GINI INDEX
9,554
LABOR FORCE [ PEOPLE ]
49.1%
PERCENT IN LABOR FORCE
8.5%
UNEMPLOYMENT RATE
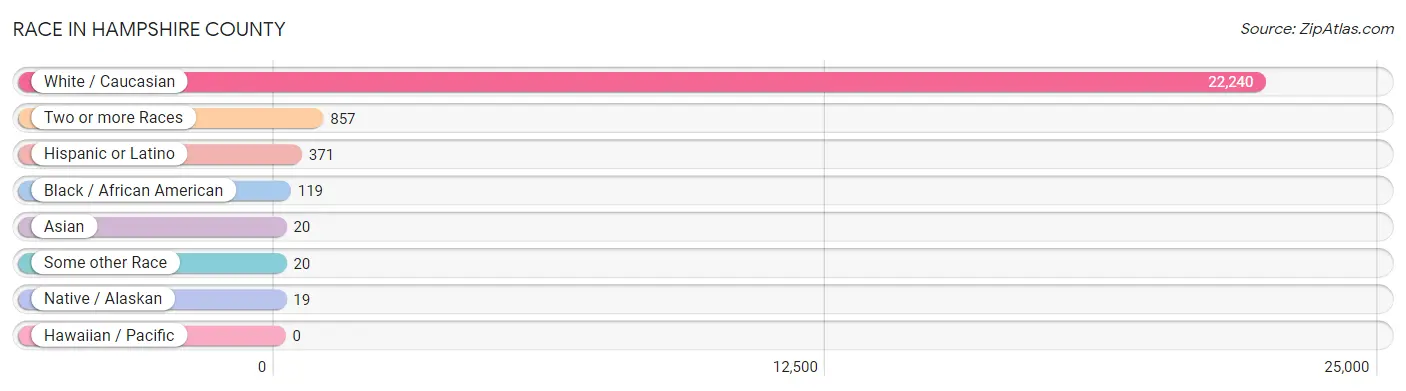
Race in Hampshire County
The most populous races in Hampshire County are White / Caucasian (22,240 | 95.6%), Two or more Races (857 | 3.7%), and Hispanic or Latino (371 | 1.6%).
| Race | # Population | % Population |
| Asian | 20 | 0.1% |
| Black / African American | 119 | 0.5% |
| Hawaiian / Pacific | 0 | 0.0% |
| Hispanic or Latino | 371 | 1.6% |
| Native / Alaskan | 19 | 0.1% |
| White / Caucasian | 22,240 | 95.6% |
| Two or more Races | 857 | 3.7% |
| Some other Race | 20 | 0.1% |
| Total | 23,275 | 100.0% |
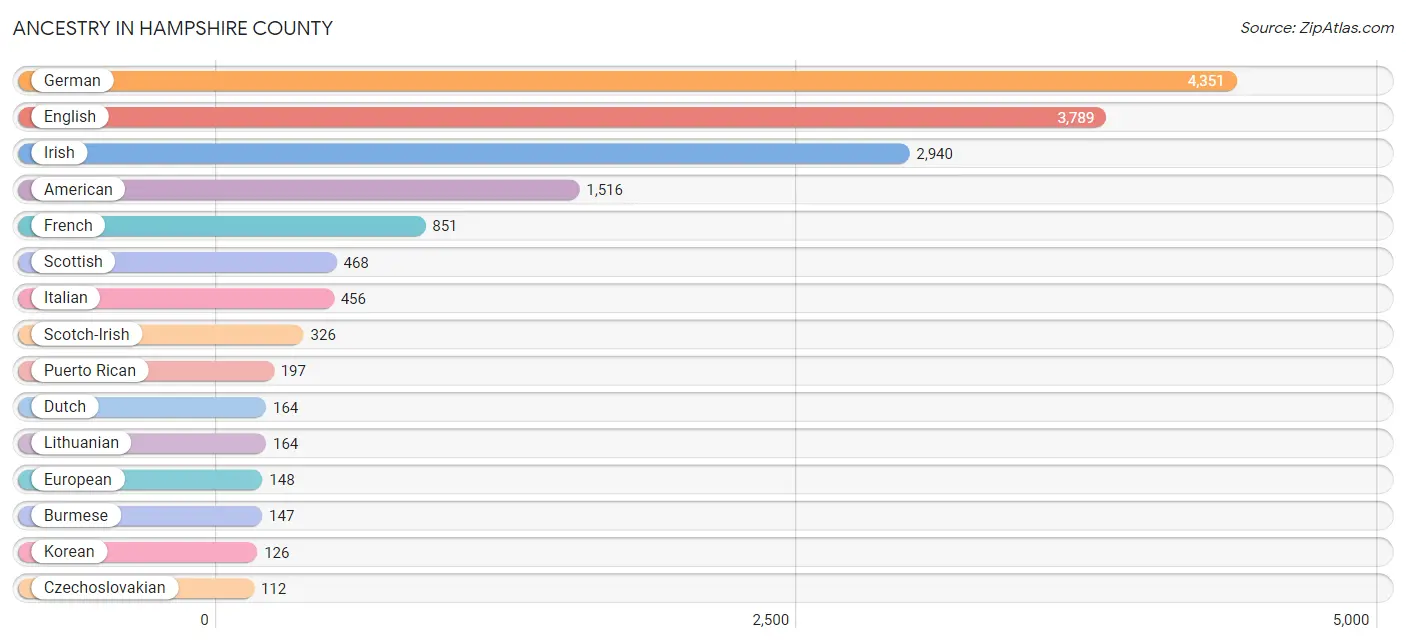
Ancestry in Hampshire County
The most populous ancestries reported in Hampshire County are German (4,351 | 18.7%), English (3,789 | 16.3%), Irish (2,940 | 12.6%), American (1,516 | 6.5%), and French (851 | 3.7%), together accounting for 57.8% of all Hampshire County residents.
| Ancestry | # Population | % Population |
| African | 38 | 0.2% |
| American | 1,516 | 6.5% |
| Apache | 5 | 0.0% |
| Arab | 1 | 0.0% |
| British | 36 | 0.2% |
| Burmese | 147 | 0.6% |
| Cajun | 64 | 0.3% |
| Canadian | 6 | 0.0% |
| Celtic | 3 | 0.0% |
| Central American | 75 | 0.3% |
| Cherokee | 18 | 0.1% |
| Choctaw | 2 | 0.0% |
| Croatian | 8 | 0.0% |
| Cuban | 12 | 0.1% |
| Czechoslovakian | 112 | 0.5% |
| Danish | 1 | 0.0% |
| Dominican | 14 | 0.1% |
| Dutch | 164 | 0.7% |
| Eastern European | 108 | 0.5% |
| English | 3,789 | 16.3% |
| European | 148 | 0.6% |
| Finnish | 11 | 0.1% |
| French | 851 | 3.7% |
| French Canadian | 93 | 0.4% |
| German | 4,351 | 18.7% |
| Honduran | 74 | 0.3% |
| Hungarian | 51 | 0.2% |
| Iranian | 9 | 0.0% |
| Irish | 2,940 | 12.6% |
| Italian | 456 | 2.0% |
| Korean | 126 | 0.5% |
| Lebanese | 1 | 0.0% |
| Lithuanian | 164 | 0.7% |
| Mexican | 43 | 0.2% |
| Norwegian | 72 | 0.3% |
| Panamanian | 1 | 0.0% |
| Polish | 109 | 0.5% |
| Portuguese | 7 | 0.0% |
| Puerto Rican | 197 | 0.9% |
| Russian | 20 | 0.1% |
| Scotch-Irish | 326 | 1.4% |
| Scottish | 468 | 2.0% |
| Slovene | 37 | 0.2% |
| Subsaharan African | 38 | 0.2% |
| Swedish | 112 | 0.5% |
| Syrian | 1 | 0.0% |
| Thai | 89 | 0.4% |
| Ukrainian | 5 | 0.0% |
| Welsh | 99 | 0.4% | View All 49 Rows |
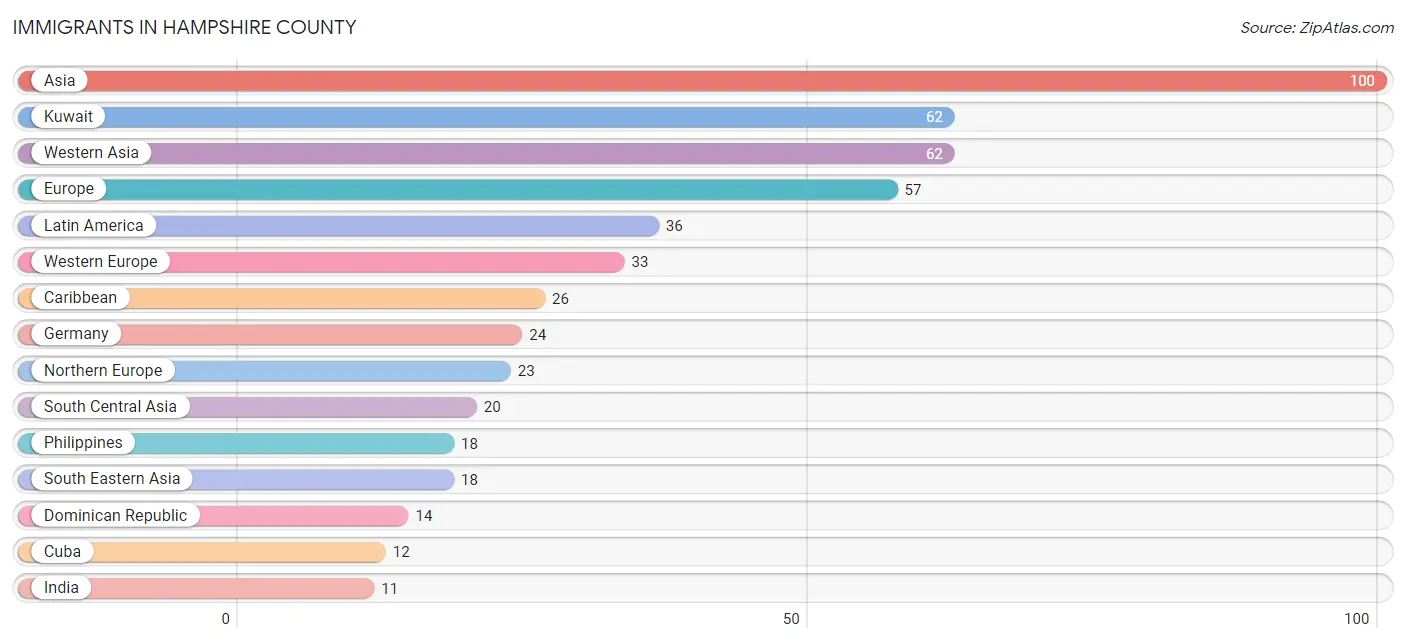
Immigrants in Hampshire County
The most numerous immigrant groups reported in Hampshire County came from Asia (100 | 0.4%), Kuwait (62 | 0.3%), Western Asia (62 | 0.3%), Europe (57 | 0.2%), and Latin America (36 | 0.2%), together accounting for 1.4% of all Hampshire County residents.
| Immigration Origin | # Population | % Population |
| Asia | 100 | 0.4% |
| Canada | 6 | 0.0% |
| Caribbean | 26 | 0.1% |
| Central America | 10 | 0.0% |
| Cuba | 12 | 0.1% |
| Dominican Republic | 14 | 0.1% |
| Eastern Europe | 1 | 0.0% |
| England | 6 | 0.0% |
| Europe | 57 | 0.2% |
| France | 9 | 0.0% |
| Germany | 24 | 0.1% |
| Honduras | 10 | 0.0% |
| India | 11 | 0.1% |
| Iran | 9 | 0.0% |
| Kuwait | 62 | 0.3% |
| Latin America | 36 | 0.2% |
| Northern Europe | 23 | 0.1% |
| Philippines | 18 | 0.1% |
| Russia | 1 | 0.0% |
| Scotland | 9 | 0.0% |
| South Central Asia | 20 | 0.1% |
| South Eastern Asia | 18 | 0.1% |
| Western Asia | 62 | 0.3% |
| Western Europe | 33 | 0.1% | View All 24 Rows |
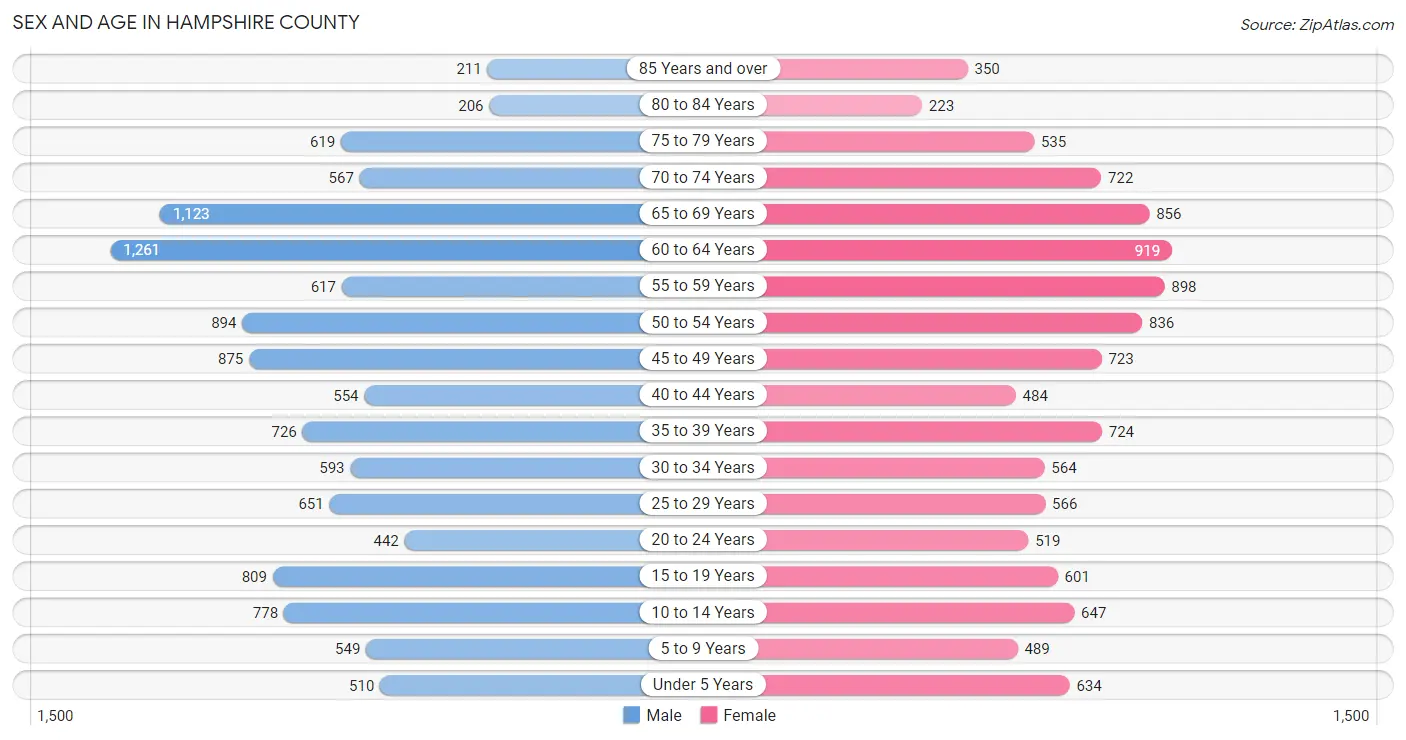
Sex and Age in Hampshire County
Sex and Age in Hampshire County
The most populous age groups in Hampshire County are 60 to 64 Years (1,261 | 10.5%) for men and 60 to 64 Years (919 | 8.1%) for women.
| Age Bracket | Male | Female |
| Under 5 Years | 510 (4.3%) | 634 (5.6%) |
| 5 to 9 Years | 549 (4.6%) | 489 (4.3%) |
| 10 to 14 Years | 778 (6.5%) | 647 (5.7%) |
| 15 to 19 Years | 809 (6.8%) | 601 (5.3%) |
| 20 to 24 Years | 442 (3.7%) | 519 (4.6%) |
| 25 to 29 Years | 651 (5.4%) | 566 (5.0%) |
| 30 to 34 Years | 593 (5.0%) | 564 (5.0%) |
| 35 to 39 Years | 726 (6.1%) | 724 (6.4%) |
| 40 to 44 Years | 554 (4.6%) | 484 (4.3%) |
| 45 to 49 Years | 875 (7.3%) | 723 (6.4%) |
| 50 to 54 Years | 894 (7.5%) | 836 (7.4%) |
| 55 to 59 Years | 617 (5.1%) | 898 (8.0%) |
| 60 to 64 Years | 1,261 (10.5%) | 919 (8.1%) |
| 65 to 69 Years | 1,123 (9.4%) | 856 (7.6%) |
| 70 to 74 Years | 567 (4.7%) | 722 (6.4%) |
| 75 to 79 Years | 619 (5.2%) | 535 (4.7%) |
| 80 to 84 Years | 206 (1.7%) | 223 (2.0%) |
| 85 Years and over | 211 (1.8%) | 350 (3.1%) |
| Total | 11,985 (100.0%) | 11,290 (100.0%) |
Families and Households in Hampshire County
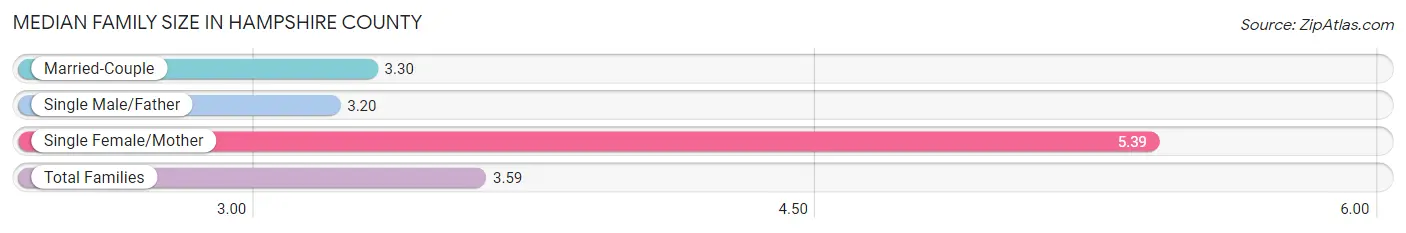
Median Family Size in Hampshire County
The median family size in Hampshire County is 3.59 persons per family, with single female/mother families (732 | 14.4%) accounting for the largest median family size of 5.39 persons per family. On the other hand, single male/father families (391 | 7.7%) represent the smallest median family size with 3.20 persons per family.
| Family Type | # Families | Family Size |
| Married-Couple | 3,961 (77.9%) | 3.30 |
| Single Male/Father | 391 (7.7%) | 3.20 |
| Single Female/Mother | 732 (14.4%) | 5.39 |
| Total Families | 5,084 (100.0%) | 3.59 |
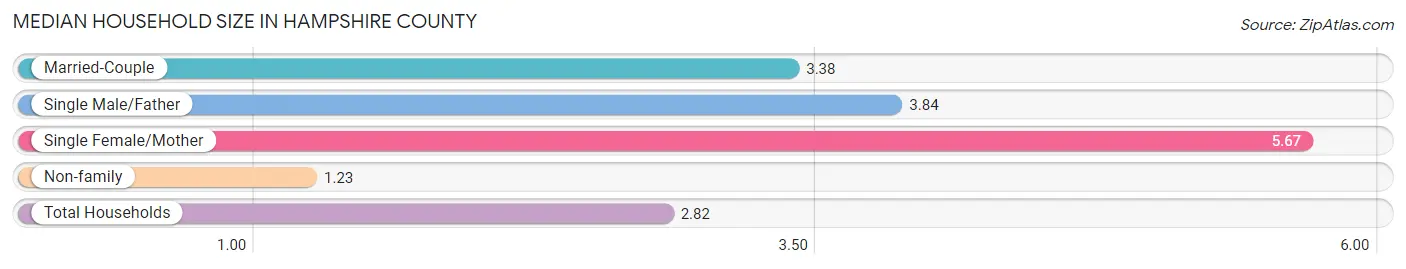
Median Household Size in Hampshire County
The median household size in Hampshire County is 2.82 persons per household, with single female/mother households (732 | 9.1%) accounting for the largest median household size of 5.67 persons per household. non-family households (2,982 | 37.0%) represent the smallest median household size with 1.23 persons per household.
| Household Type | # Households | Household Size |
| Married-Couple | 3,961 (49.1%) | 3.38 |
| Single Male/Father | 391 (4.9%) | 3.84 |
| Single Female/Mother | 732 (9.1%) | 5.67 |
| Non-family | 2,982 (37.0%) | 1.23 |
| Total Households | 8,066 (100.0%) | 2.82 |
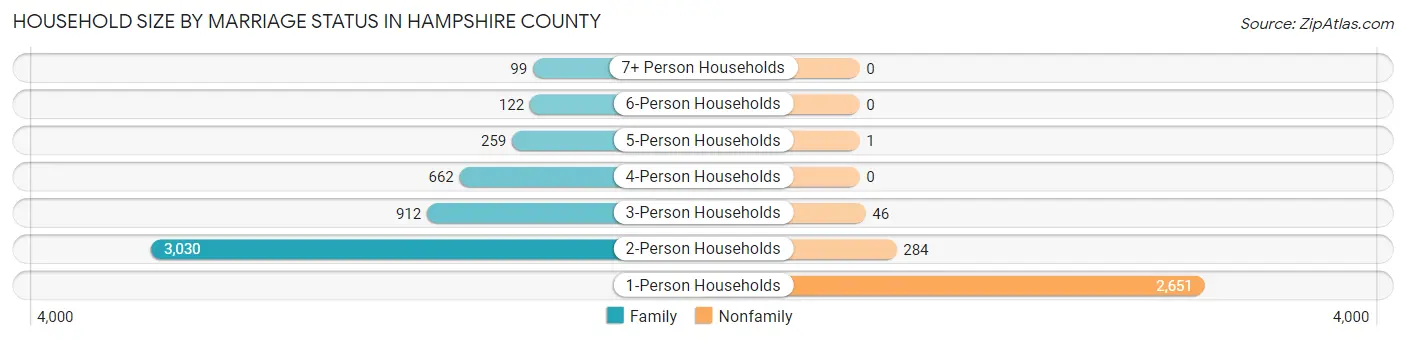
Household Size by Marriage Status in Hampshire County
Out of a total of 8,066 households in Hampshire County, 5,084 (63.0%) are family households, while 2,982 (37.0%) are nonfamily households. The most numerous type of family households are 2-person households, comprising 3,030, and the most common type of nonfamily households are 1-person households, comprising 2,651.
| Household Size | Family Households | Nonfamily Households |
| 1-Person Households | - | 2,651 (32.9%) |
| 2-Person Households | 3,030 (37.6%) | 284 (3.5%) |
| 3-Person Households | 912 (11.3%) | 46 (0.6%) |
| 4-Person Households | 662 (8.2%) | 0 (0.0%) |
| 5-Person Households | 259 (3.2%) | 1 (0.0%) |
| 6-Person Households | 122 (1.5%) | 0 (0.0%) |
| 7+ Person Households | 99 (1.2%) | 0 (0.0%) |
| Total | 5,084 (63.0%) | 2,982 (37.0%) |
Female Fertility in Hampshire County
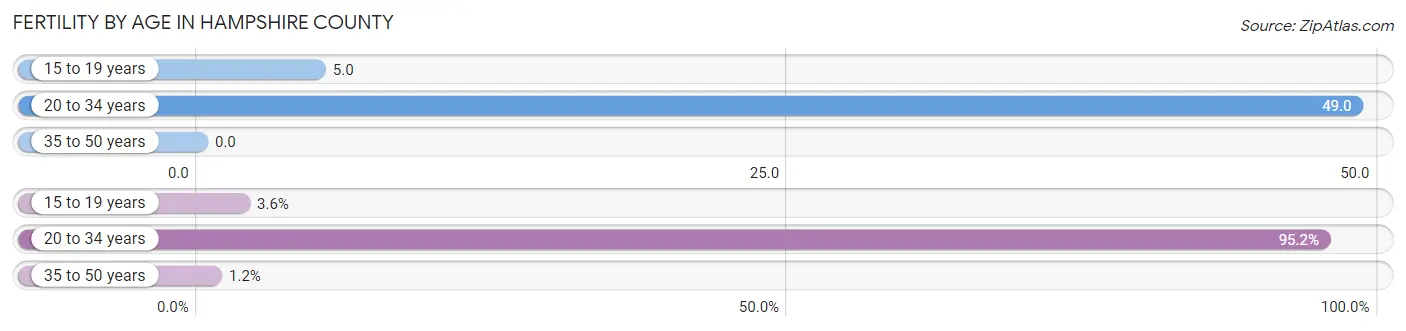
Fertility by Age in Hampshire County
Average fertility rate in Hampshire County is 19.0 births per 1,000 women. Women in the age bracket of 20 to 34 years have the highest fertility rate with 49.0 births per 1,000 women. Women in the age bracket of 20 to 34 years acount for 95.2% of all women with births.
| Age Bracket | Women with Births | Births / 1,000 Women |
| 15 to 19 years | 3 (3.6%) | 5.0 |
| 20 to 34 years | 80 (95.2%) | 49.0 |
| 35 to 50 years | 1 (1.2%) | 0.0 |
| Total | 84 (100.0%) | 19.0 |
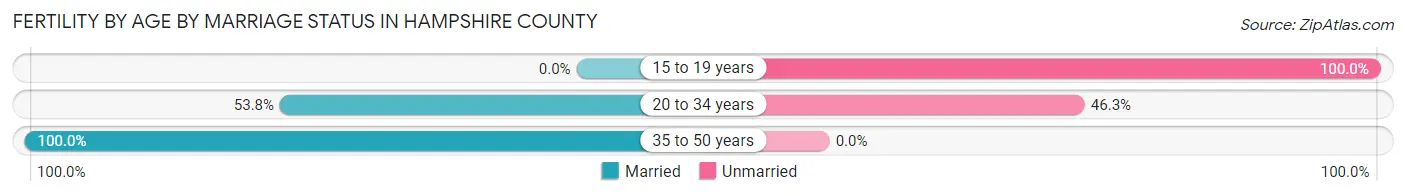
Fertility by Age by Marriage Status in Hampshire County
52.4% of women with births (84) in Hampshire County are married. The highest percentage of unmarried women with births falls into 15 to 19 years age bracket with 100.0% of them unmarried at the time of birth, while the lowest percentage of unmarried women with births belong to 35 to 50 years age bracket with 0.0% of them unmarried.
| Age Bracket | Married | Unmarried |
| 15 to 19 years | 0 (0.0%) | 3 (100.0%) |
| 20 to 34 years | 43 (53.7%) | 37 (46.3%) |
| 35 to 50 years | 1 (100.0%) | 0 (0.0%) |
| Total | 44 (52.4%) | 40 (47.6%) |
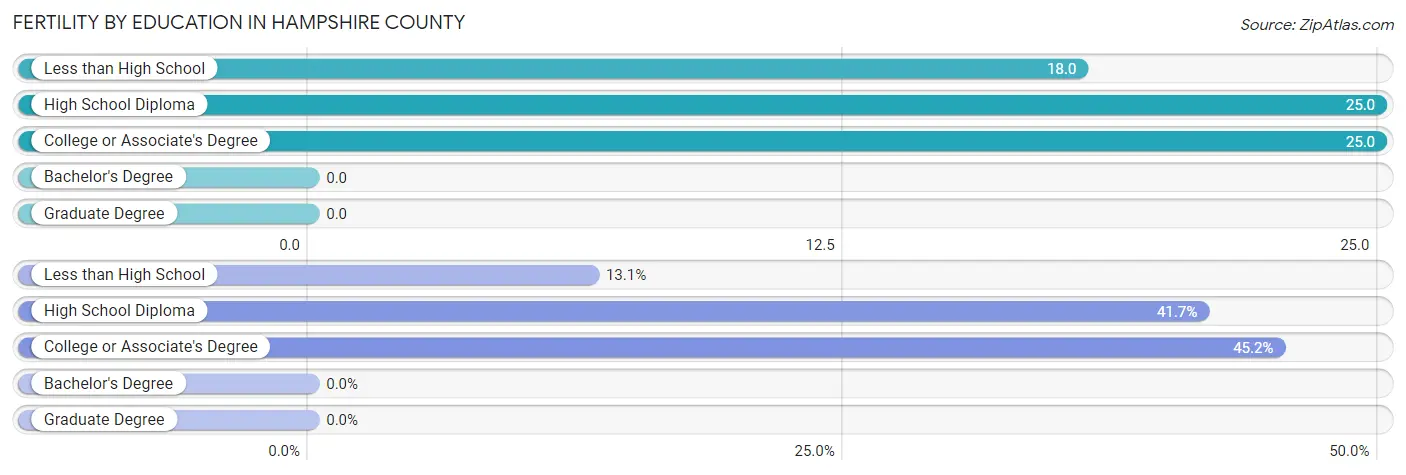
Fertility by Education in Hampshire County
| Educational Attainment | Women with Births | Births / 1,000 Women |
| Less than High School | 11 (13.1%) | 18.0 |
| High School Diploma | 35 (41.7%) | 25.0 |
| College or Associate's Degree | 38 (45.2%) | 25.0 |
| Bachelor's Degree | 0 (0.0%) | 0.0 |
| Graduate Degree | 0 (0.0%) | 0.0 |
| Total | 84 (100.0%) | 19.0 |
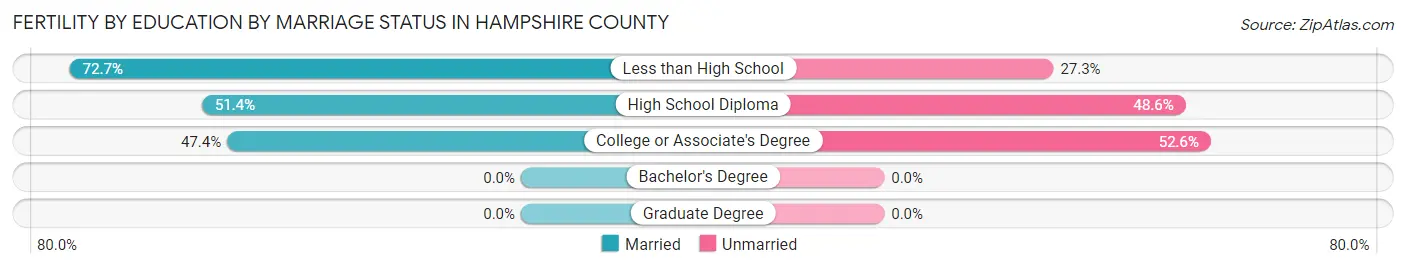
Fertility by Education by Marriage Status in Hampshire County
47.6% of women with births in Hampshire County are unmarried. Women with the educational attainment of less than high school are most likely to be married with 72.7% of them married at childbirth, while women with the educational attainment of college or associate's degree are least likely to be married with 52.6% of them unmarried at childbirth.
| Educational Attainment | Married | Unmarried |
| Less than High School | 8 (72.7%) | 3 (27.3%) |
| High School Diploma | 18 (51.4%) | 17 (48.6%) |
| College or Associate's Degree | 18 (47.4%) | 20 (52.6%) |
| Bachelor's Degree | 0 (0.0%) | 0 (0.0%) |
| Graduate Degree | 0 (0.0%) | 0 (0.0%) |
| Total | 44 (52.4%) | 40 (47.6%) |
Income in Hampshire County
Income Overview in Hampshire County
Per Capita Income in Hampshire County is $28,713, while median incomes of families and households are $68,312 and $55,222 respectively.
| Characteristic | Number | Measure |
| Per Capita Income | 23,275 | $28,713 |
| Median Family Income | 5,084 | $68,312 |
| Mean Family Income | 5,084 | $83,507 |
| Median Household Income | 8,066 | $55,222 |
| Mean Household Income | 8,066 | $69,037 |
| Income Deficit | 5,084 | $7,612 |
| Wage / Income Gap (%) | 23,275 | 34.34% |
| Wage / Income Gap ($) | 23,275 | 65.66¢ per $1 |
| Gini / Inequality Index | 23,275 | 0.43 |
Earnings by Sex in Hampshire County
Average Earnings in Hampshire County are $35,228, $45,502 for men and $29,878 for women, a difference of 34.3%.
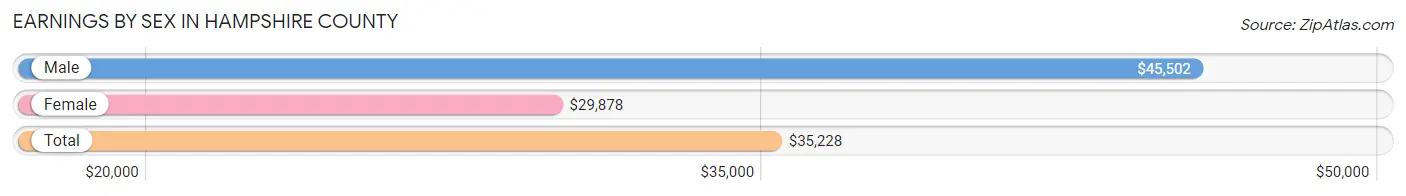
| Sex | Number | Average Earnings |
| Male | 5,621 (56.2%) | $45,502 |
| Female | 4,380 (43.8%) | $29,878 |
| Total | 10,001 (100.0%) | $35,228 |
Earnings by Sex by Income Bracket in Hampshire County
The most common earnings brackets in Hampshire County are $45,000 to $49,999 for men (667 | 11.9%) and $25,000 to $29,999 for women (643 | 14.7%).
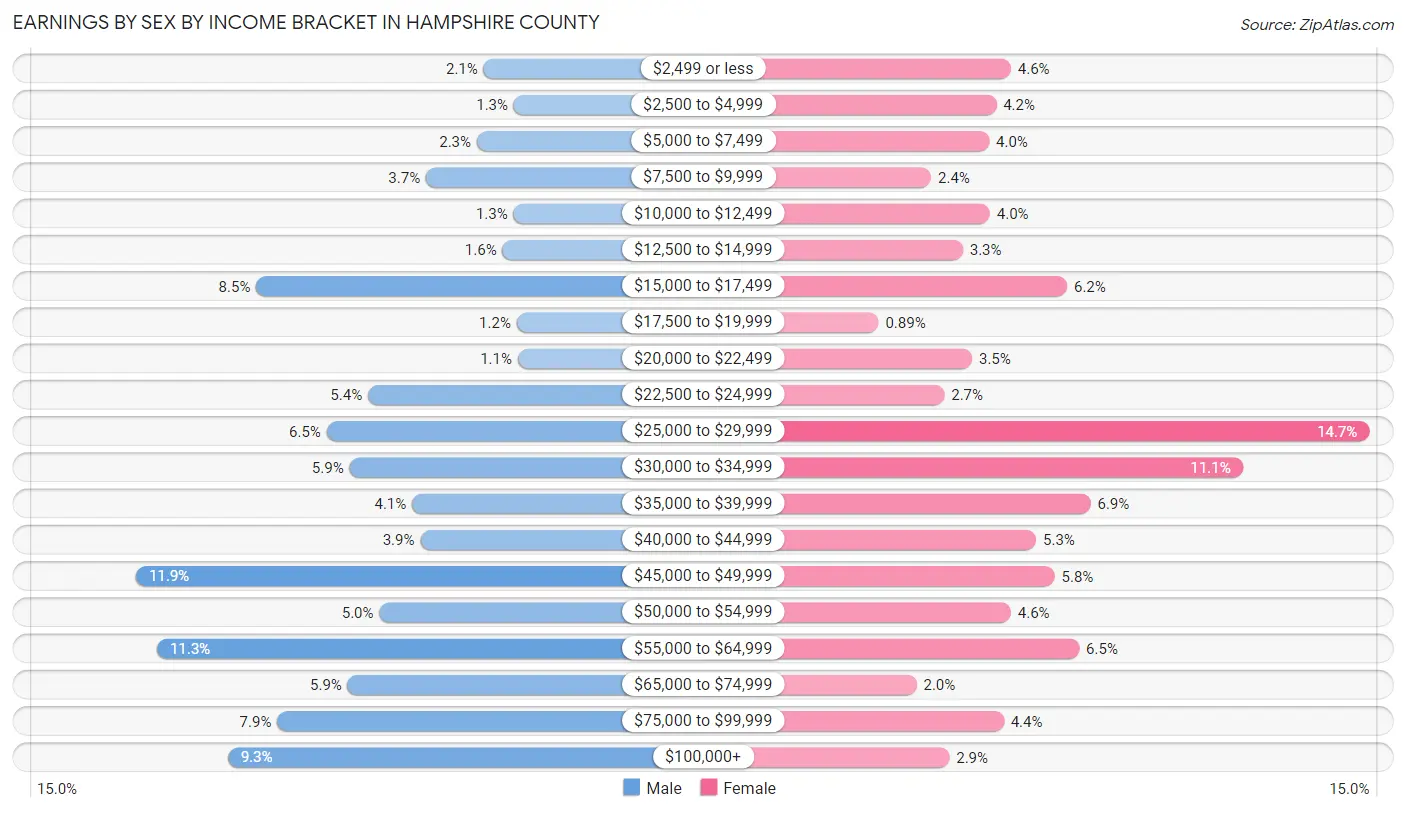
| Income | Male | Female |
| $2,499 or less | 118 (2.1%) | 202 (4.6%) |
| $2,500 to $4,999 | 70 (1.3%) | 184 (4.2%) |
| $5,000 to $7,499 | 129 (2.3%) | 175 (4.0%) |
| $7,500 to $9,999 | 209 (3.7%) | 104 (2.4%) |
| $10,000 to $12,499 | 71 (1.3%) | 176 (4.0%) |
| $12,500 to $14,999 | 88 (1.6%) | 143 (3.3%) |
| $15,000 to $17,499 | 477 (8.5%) | 271 (6.2%) |
| $17,500 to $19,999 | 66 (1.2%) | 39 (0.9%) |
| $20,000 to $22,499 | 64 (1.1%) | 154 (3.5%) |
| $22,500 to $24,999 | 301 (5.3%) | 120 (2.7%) |
| $25,000 to $29,999 | 366 (6.5%) | 643 (14.7%) |
| $30,000 to $34,999 | 330 (5.9%) | 487 (11.1%) |
| $35,000 to $39,999 | 231 (4.1%) | 300 (6.9%) |
| $40,000 to $44,999 | 218 (3.9%) | 233 (5.3%) |
| $45,000 to $49,999 | 667 (11.9%) | 256 (5.8%) |
| $50,000 to $54,999 | 283 (5.0%) | 202 (4.6%) |
| $55,000 to $64,999 | 634 (11.3%) | 286 (6.5%) |
| $65,000 to $74,999 | 333 (5.9%) | 86 (2.0%) |
| $75,000 to $99,999 | 444 (7.9%) | 193 (4.4%) |
| $100,000+ | 522 (9.3%) | 126 (2.9%) |
| Total | 5,621 (100.0%) | 4,380 (100.0%) |
Earnings by Sex by Educational Attainment in Hampshire County
Average earnings in Hampshire County are $47,221 for men and $31,783 for women, a difference of 32.7%. Men with an educational attainment of graduate degree enjoy the highest average annual earnings of $101,200, while those with college or associate's degree education earn the least with $42,470. Women with an educational attainment of graduate degree earn the most with the average annual earnings of $55,217, while those with high school diploma education have the smallest earnings of $30,477.
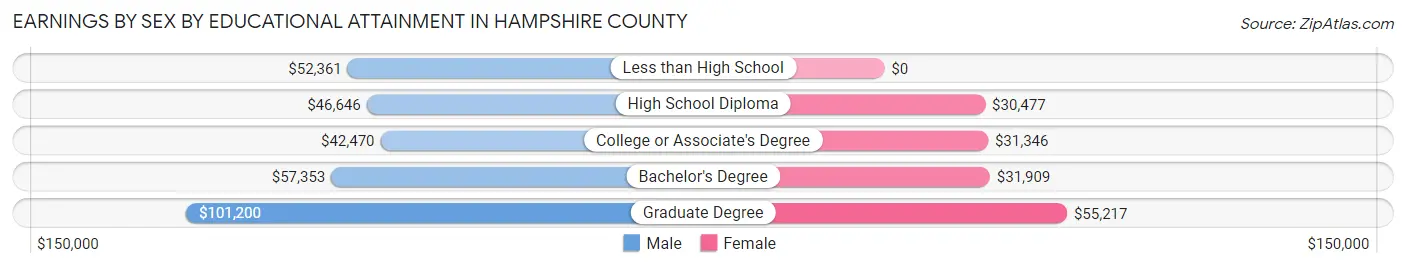
| Educational Attainment | Male Income | Female Income |
| Less than High School | $52,361 | $0 |
| High School Diploma | $46,646 | $30,477 |
| College or Associate's Degree | $42,470 | $31,346 |
| Bachelor's Degree | $57,353 | $31,909 |
| Graduate Degree | $101,200 | $55,217 |
| Total | $47,221 | $31,783 |
Family Income in Hampshire County
Family Income Brackets in Hampshire County
According to the Hampshire County family income data, there are 1,154 families falling into the $50,000 to $74,999 income range, which is the most common income bracket and makes up 22.7% of all families. Conversely, the less than $10,000 income bracket is the least frequent group with only 81 families (1.6%) belonging to this category.
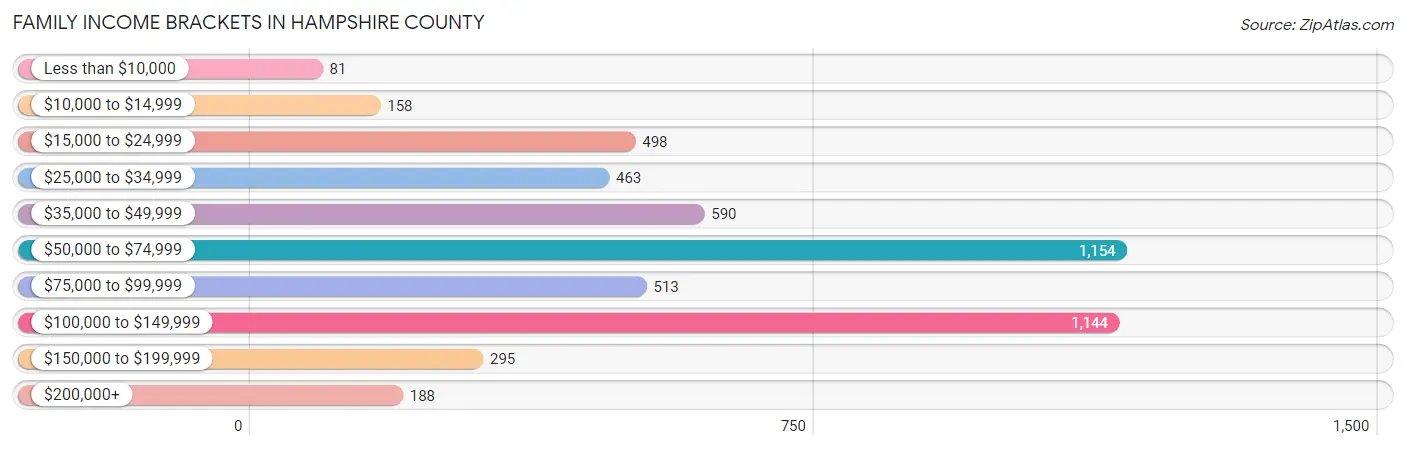
| Income Bracket | # Families | % Families |
| Less than $10,000 | 81 | 1.6% |
| $10,000 to $14,999 | 158 | 3.1% |
| $15,000 to $24,999 | 498 | 9.8% |
| $25,000 to $34,999 | 463 | 9.1% |
| $35,000 to $49,999 | 590 | 11.6% |
| $50,000 to $74,999 | 1,154 | 22.7% |
| $75,000 to $99,999 | 513 | 10.1% |
| $100,000 to $149,999 | 1,144 | 22.5% |
| $150,000 to $199,999 | 295 | 5.8% |
| $200,000+ | 188 | 3.7% |
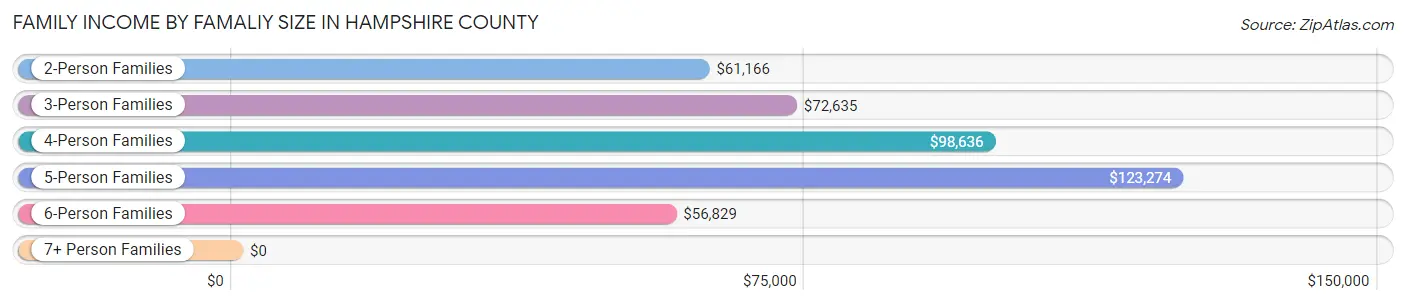
Family Income by Famaliy Size in Hampshire County
5-person families (229 | 4.5%) account for the highest median family income in Hampshire County with $123,274 per family, while 2-person families (3,197 | 62.9%) have the highest median income of $30,583 per family member.
| Income Bracket | # Families | Median Income |
| 2-Person Families | 3,197 (62.9%) | $61,166 |
| 3-Person Families | 852 (16.8%) | $72,635 |
| 4-Person Families | 618 (12.2%) | $98,636 |
| 5-Person Families | 229 (4.5%) | $123,274 |
| 6-Person Families | 122 (2.4%) | $56,829 |
| 7+ Person Families | 66 (1.3%) | $0 |
| Total | 5,084 (100.0%) | $68,312 |
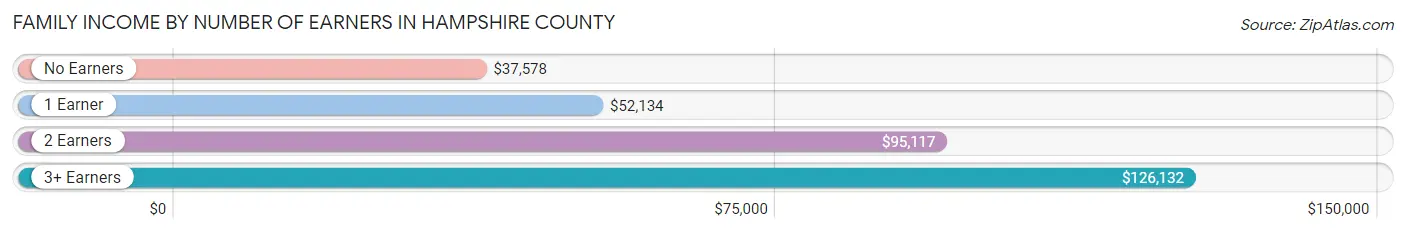
Family Income by Number of Earners in Hampshire County
The median family income in Hampshire County is $68,312, with families comprising 3+ earners (431) having the highest median family income of $126,132, while families with no earners (1,471) have the lowest median family income of $37,578, accounting for 8.5% and 28.9% of families, respectively.
| Number of Earners | # Families | Median Income |
| No Earners | 1,471 (28.9%) | $37,578 |
| 1 Earner | 1,603 (31.5%) | $52,134 |
| 2 Earners | 1,579 (31.1%) | $95,117 |
| 3+ Earners | 431 (8.5%) | $126,132 |
| Total | 5,084 (100.0%) | $68,312 |
Household Income in Hampshire County
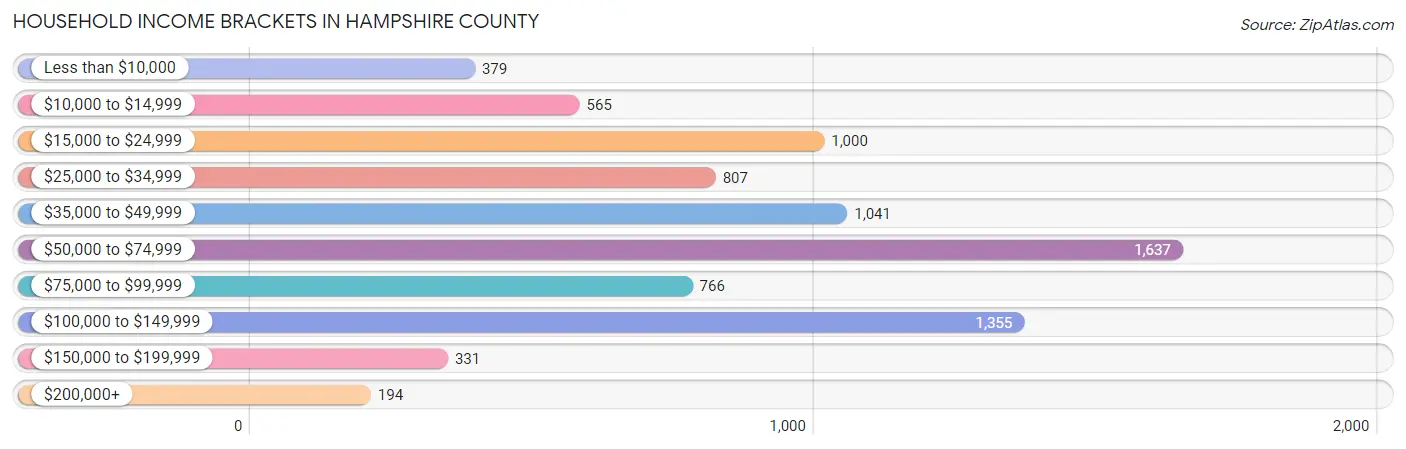
Household Income Brackets in Hampshire County
With 1,637 households falling in the category, the $50,000 to $74,999 income range is the most frequent in Hampshire County, accounting for 20.3% of all households. In contrast, only 194 households (2.4%) fall into the $200,000+ income bracket, making it the least populous group.
| Income Bracket | # Households | % Households |
| Less than $10,000 | 379 | 4.7% |
| $10,000 to $14,999 | 565 | 7.0% |
| $15,000 to $24,999 | 1,000 | 12.4% |
| $25,000 to $34,999 | 807 | 10.0% |
| $35,000 to $49,999 | 1,041 | 12.9% |
| $50,000 to $74,999 | 1,637 | 20.3% |
| $75,000 to $99,999 | 766 | 9.5% |
| $100,000 to $149,999 | 1,355 | 16.8% |
| $150,000 to $199,999 | 331 | 4.1% |
| $200,000+ | 194 | 2.4% |
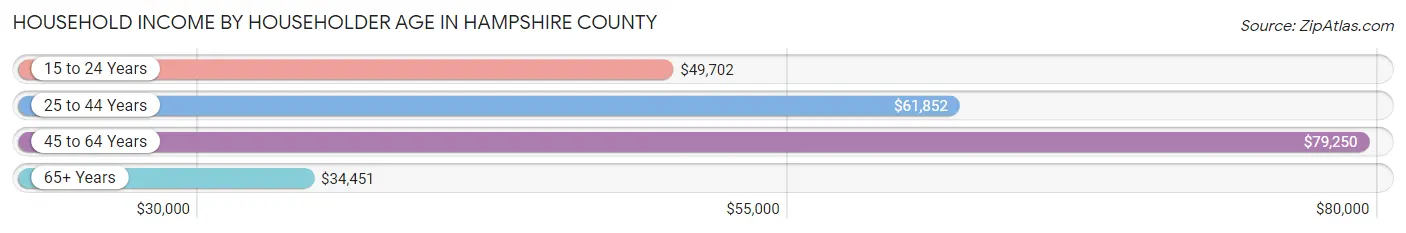
Household Income by Householder Age in Hampshire County
The median household income in Hampshire County is $55,222, with the highest median household income of $79,250 found in the 45 to 64 years age bracket for the primary householder. A total of 2,888 households (35.8%) fall into this category. Meanwhile, the 65+ years age bracket for the primary householder has the lowest median household income of $34,451, with 3,488 households (43.2%) in this group.
| Income Bracket | # Households | Median Income |
| 15 to 24 Years | 178 (2.2%) | $49,702 |
| 25 to 44 Years | 1,512 (18.8%) | $61,852 |
| 45 to 64 Years | 2,888 (35.8%) | $79,250 |
| 65+ Years | 3,488 (43.2%) | $34,451 |
| Total | 8,066 (100.0%) | $55,222 |
Poverty in Hampshire County
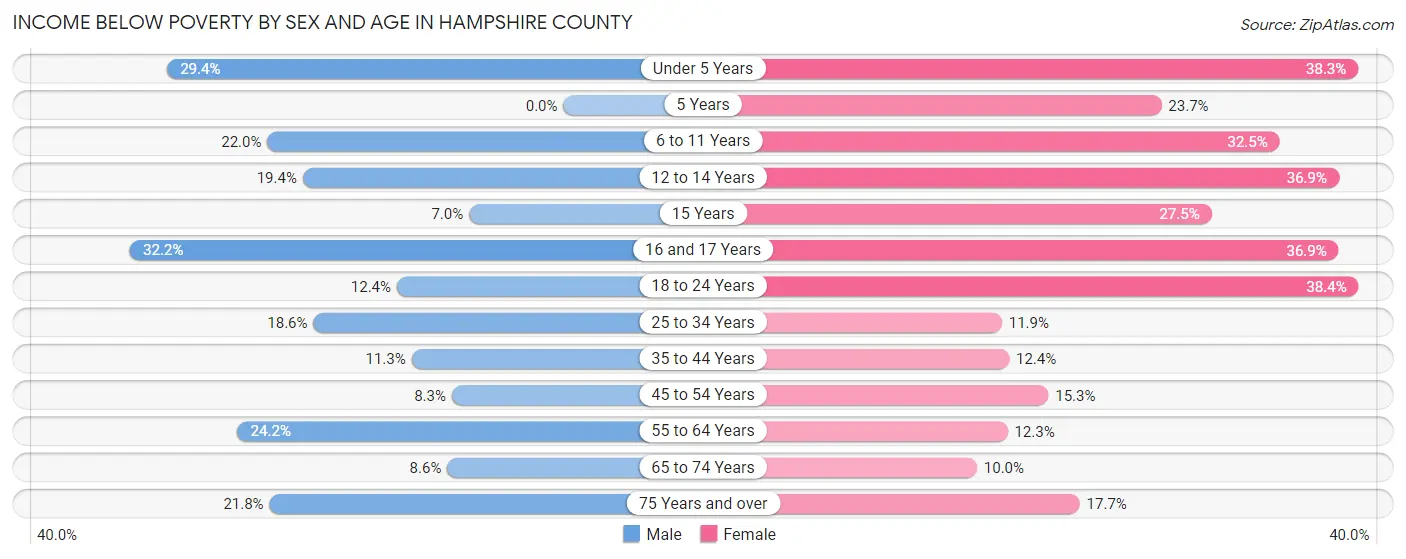
Income Below Poverty by Sex and Age in Hampshire County
With 16.5% poverty level for males and 18.5% for females among the residents of Hampshire County, 16 and 17 year old males and 18 to 24 year old females are the most vulnerable to poverty, with 83 males (32.2%) and 262 females (38.4%) in their respective age groups living below the poverty level.
| Age Bracket | Male | Female |
| Under 5 Years | 150 (29.4%) | 184 (38.3%) |
| 5 Years | 0 (0.0%) | 28 (23.7%) |
| 6 to 11 Years | 164 (22.0%) | 209 (32.5%) |
| 12 to 14 Years | 95 (19.4%) | 124 (36.9%) |
| 15 Years | 7 (7.0%) | 28 (27.5%) |
| 16 and 17 Years | 83 (32.2%) | 111 (36.9%) |
| 18 to 24 Years | 97 (12.4%) | 262 (38.4%) |
| 25 to 34 Years | 214 (18.6%) | 132 (11.9%) |
| 35 to 44 Years | 134 (11.3%) | 150 (12.4%) |
| 45 to 54 Years | 144 (8.3%) | 239 (15.3%) |
| 55 to 64 Years | 452 (24.2%) | 222 (12.3%) |
| 65 to 74 Years | 145 (8.6%) | 155 (10.0%) |
| 75 Years and over | 223 (21.8%) | 189 (17.7%) |
| Total | 1,908 (16.5%) | 2,033 (18.5%) |
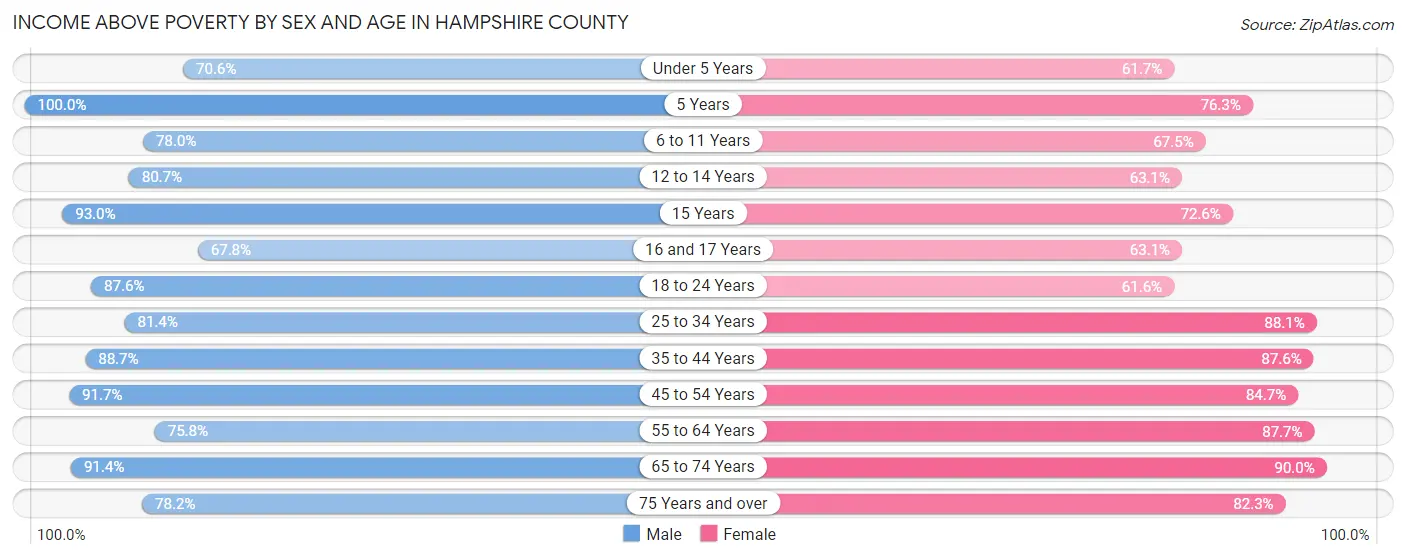
Income Above Poverty by Sex and Age in Hampshire County
According to the poverty statistics in Hampshire County, males aged 5 years and females aged 65 to 74 years are the age groups that are most secure financially, with 100.0% of males and 90.0% of females in these age groups living above the poverty line.
| Age Bracket | Male | Female |
| Under 5 Years | 360 (70.6%) | 296 (61.7%) |
| 5 Years | 56 (100.0%) | 90 (76.3%) |
| 6 to 11 Years | 582 (78.0%) | 434 (67.5%) |
| 12 to 14 Years | 396 (80.6%) | 212 (63.1%) |
| 15 Years | 93 (93.0%) | 74 (72.6%) |
| 16 and 17 Years | 175 (67.8%) | 190 (63.1%) |
| 18 to 24 Years | 688 (87.6%) | 421 (61.6%) |
| 25 to 34 Years | 939 (81.4%) | 979 (88.1%) |
| 35 to 44 Years | 1,055 (88.7%) | 1,058 (87.6%) |
| 45 to 54 Years | 1,595 (91.7%) | 1,320 (84.7%) |
| 55 to 64 Years | 1,417 (75.8%) | 1,583 (87.7%) |
| 65 to 74 Years | 1,538 (91.4%) | 1,391 (90.0%) |
| 75 Years and over | 799 (78.2%) | 881 (82.3%) |
| Total | 9,693 (83.6%) | 8,929 (81.5%) |
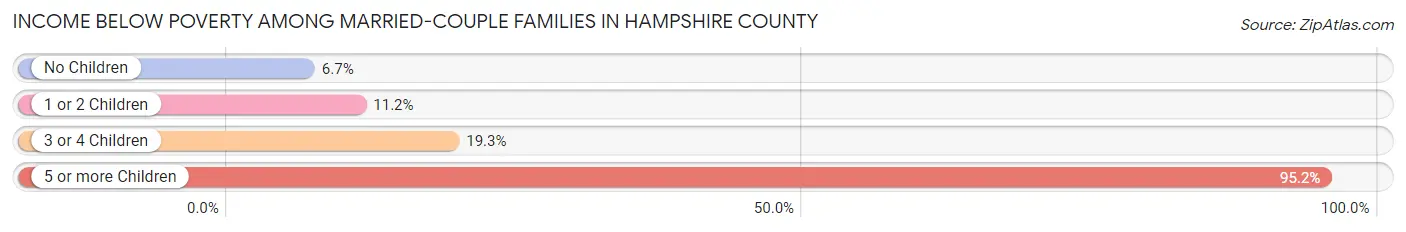
Income Below Poverty Among Married-Couple Families in Hampshire County
The poverty statistics for married-couple families in Hampshire County show that 8.6% or 340 of the total 3,961 families live below the poverty line. Families with 5 or more children have the highest poverty rate of 95.2%, comprising of 20 families. On the other hand, families with no children have the lowest poverty rate of 6.7%, which includes 196 families.
| Children | Above Poverty | Below Poverty |
| No Children | 2,732 (93.3%) | 196 (6.7%) |
| 1 or 2 Children | 779 (88.8%) | 98 (11.2%) |
| 3 or 4 Children | 109 (80.7%) | 26 (19.3%) |
| 5 or more Children | 1 (4.8%) | 20 (95.2%) |
| Total | 3,621 (91.4%) | 340 (8.6%) |
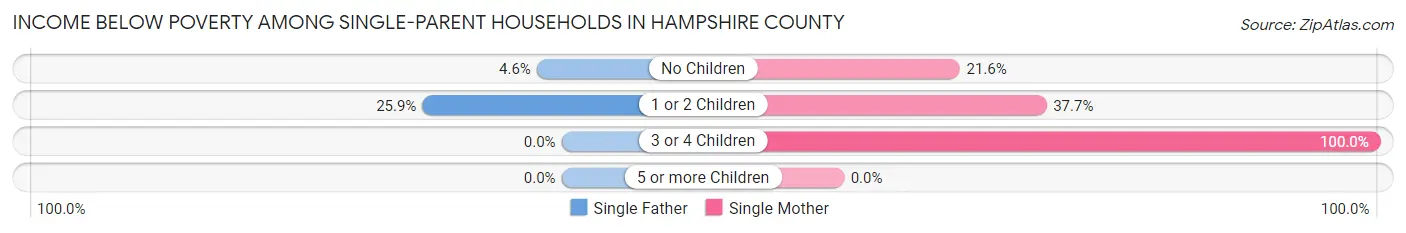
Income Below Poverty Among Single-Parent Households in Hampshire County
According to the poverty data in Hampshire County, 16.1% or 63 single-father households and 30.5% or 223 single-mother households are living below the poverty line. Among single-father households, those with 1 or 2 children have the highest poverty rate, with 55 households (25.9%) experiencing poverty. Likewise, among single-mother households, those with 3 or 4 children have the highest poverty rate, with 38 households (100.0%) falling below the poverty line.
| Children | Single Father | Single Mother |
| No Children | 8 (4.6%) | 82 (21.6%) |
| 1 or 2 Children | 55 (25.9%) | 103 (37.7%) |
| 3 or 4 Children | 0 (0.0%) | 38 (100.0%) |
| 5 or more Children | 0 (0.0%) | 0 (0.0%) |
| Total | 63 (16.1%) | 223 (30.5%) |
Income Below Poverty Among Married-Couple vs Single-Parent Households in Hampshire County
The poverty data for Hampshire County shows that 340 of the married-couple family households (8.6%) and 286 of the single-parent households (25.5%) are living below the poverty level. Within the married-couple family households, those with 5 or more children have the highest poverty rate, with 20 households (95.2%) falling below the poverty line. Among the single-parent households, those with 3 or 4 children have the highest poverty rate, with 38 household (86.4%) living below poverty.
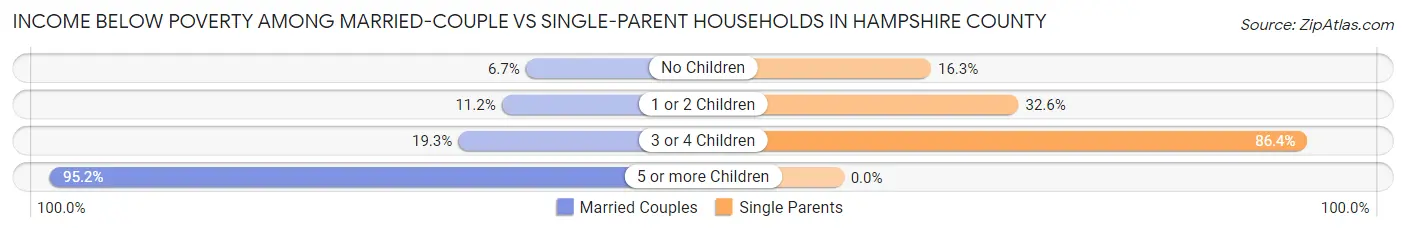
| Children | Married-Couple Families | Single-Parent Households |
| No Children | 196 (6.7%) | 90 (16.3%) |
| 1 or 2 Children | 98 (11.2%) | 158 (32.6%) |
| 3 or 4 Children | 26 (19.3%) | 38 (86.4%) |
| 5 or more Children | 20 (95.2%) | 0 (0.0%) |
| Total | 340 (8.6%) | 286 (25.5%) |
Employment Characteristics in Hampshire County
Employment by Class of Employer in Hampshire County
Among the 8,516 employed individuals in Hampshire County, private company employees (5,230 | 61.4%), state government employees (757 | 8.9%), and not-for-profit organizations (683 | 8.0%) make up the most common classes of employment.
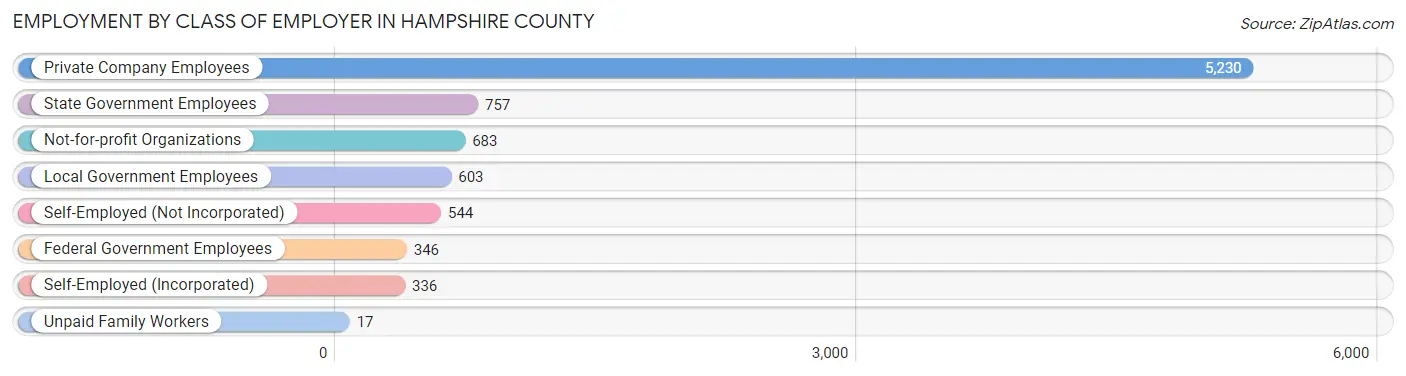
| Employer Class | # Employees | % Employees |
| Private Company Employees | 5,230 | 61.4% |
| Self-Employed (Incorporated) | 336 | 4.0% |
| Self-Employed (Not Incorporated) | 544 | 6.4% |
| Not-for-profit Organizations | 683 | 8.0% |
| Local Government Employees | 603 | 7.1% |
| State Government Employees | 757 | 8.9% |
| Federal Government Employees | 346 | 4.1% |
| Unpaid Family Workers | 17 | 0.2% |
| Total | 8,516 | 100.0% |
Employment Status by Age in Hampshire County
According to the labor force statistics for Hampshire County, out of the total population over 16 years of age (19,459), 49.1% or 9,554 individuals are in the labor force, with 8.5% or 812 of them unemployed. The age group with the highest labor force participation rate is 25 to 29 years, with 87.3% or 1,062 individuals in the labor force. Within the labor force, the 25 to 29 years age range has the highest percentage of unemployed individuals, with 32.1% or 341 of them being unemployed.
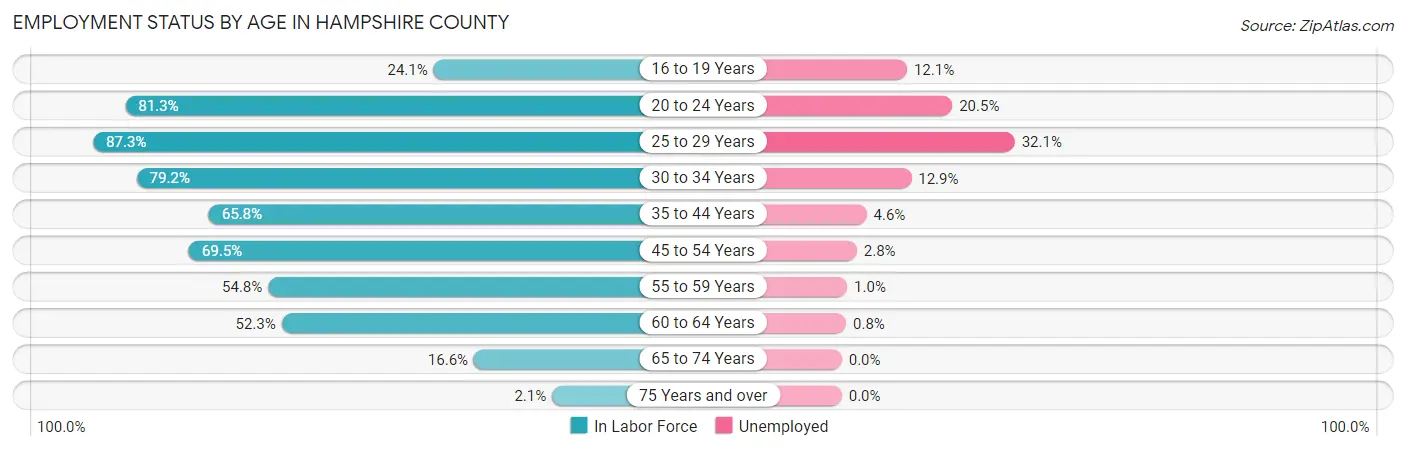
| Age Bracket | In Labor Force | Unemployed |
| 16 to 19 Years | 289 (24.1%) | 35 (12.1%) |
| 20 to 24 Years | 781 (81.3%) | 160 (20.5%) |
| 25 to 29 Years | 1,062 (87.3%) | 341 (32.1%) |
| 30 to 34 Years | 916 (79.2%) | 118 (12.9%) |
| 35 to 44 Years | 1,637 (65.8%) | 75 (4.6%) |
| 45 to 54 Years | 2,313 (69.5%) | 65 (2.8%) |
| 55 to 59 Years | 830 (54.8%) | 8 (1.0%) |
| 60 to 64 Years | 1,140 (52.3%) | 9 (0.8%) |
| 65 to 74 Years | 542 (16.6%) | 0 (0.0%) |
| 75 Years and over | 45 (2.1%) | 0 (0.0%) |
| Total | 9,554 (49.1%) | 812 (8.5%) |
Employment Status by Educational Attainment in Hampshire County
According to labor force statistics for Hampshire County, 66.5% of individuals (7,904) out of the total population between 25 and 64 years of age (11,885) are in the labor force, with 7.8% or 617 of them being unemployed. The group with the highest labor force participation rate are those with the educational attainment of bachelor's degree or higher, with 79.0% or 1,435 individuals in the labor force. Within the labor force, individuals with high school diploma education have the highest percentage of unemployment, with 13.4% or 528 of them being unemployed.
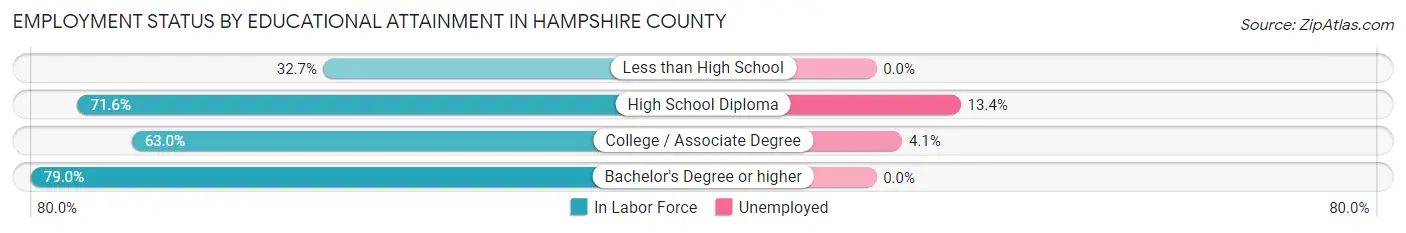
| Educational Attainment | In Labor Force | Unemployed |
| Less than High School | 380 (32.7%) | 0 (0.0%) |
| High School Diploma | 3,938 (71.6%) | 737 (13.4%) |
| College / Associate Degree | 2,146 (63.0%) | 140 (4.1%) |
| Bachelor's Degree or higher | 1,435 (79.0%) | 0 (0.0%) |
| Total | 7,904 (66.5%) | 927 (7.8%) |
Employment Occupations by Sex in Hampshire County
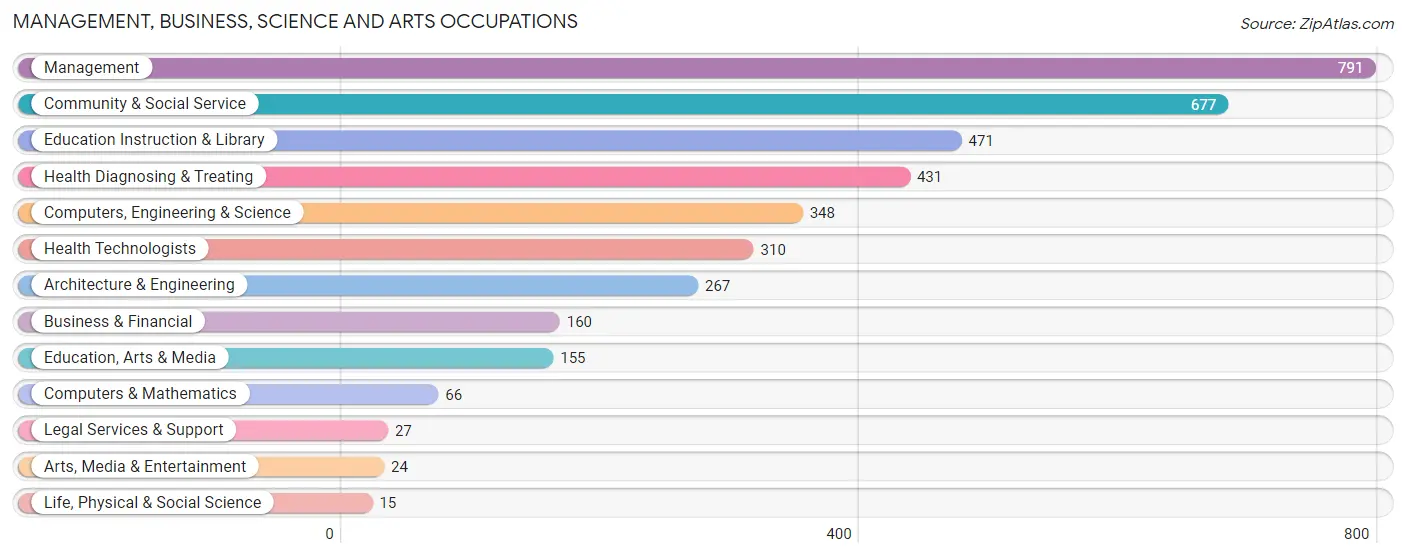
Management, Business, Science and Arts Occupations
The most common Management, Business, Science and Arts occupations in Hampshire County are Management (791 | 9.0%), Community & Social Service (677 | 7.7%), Education Instruction & Library (471 | 5.4%), Health Diagnosing & Treating (431 | 4.9%), and Computers, Engineering & Science (348 | 4.0%).
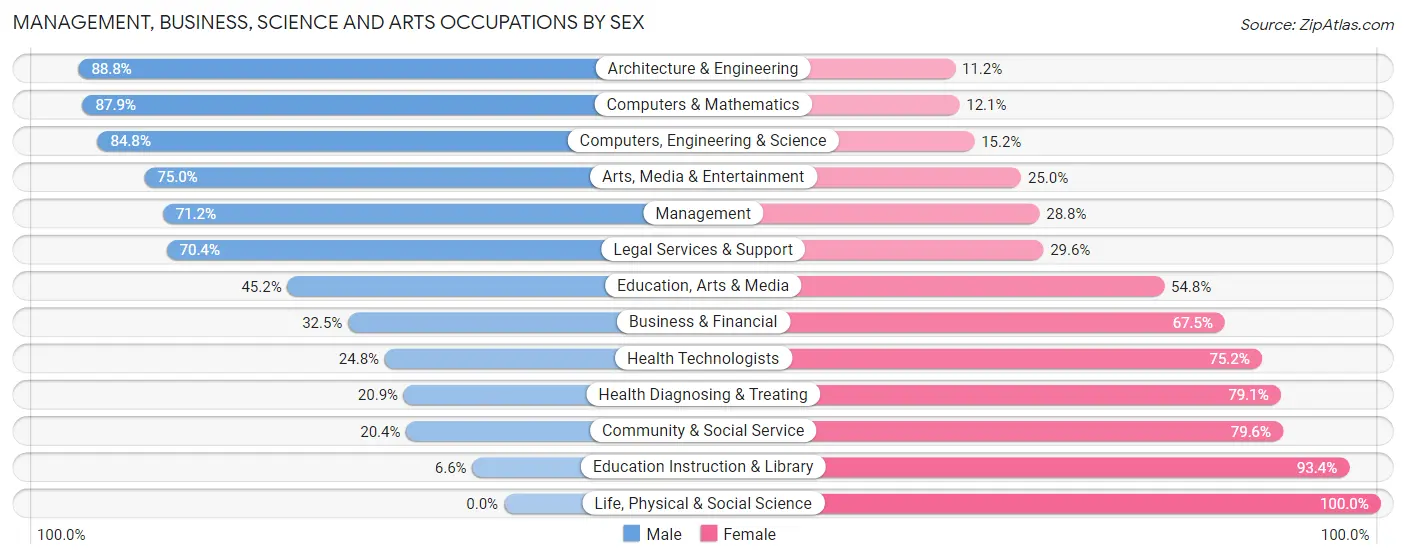
Management, Business, Science and Arts Occupations by Sex
Within the Management, Business, Science and Arts occupations in Hampshire County, the most male-oriented occupations are Architecture & Engineering (88.8%), Computers & Mathematics (87.9%), and Computers, Engineering & Science (84.8%), while the most female-oriented occupations are Life, Physical & Social Science (100.0%), Education Instruction & Library (93.4%), and Community & Social Service (79.6%).
| Occupation | Male | Female |
| Management | 563 (71.2%) | 228 (28.8%) |
| Business & Financial | 52 (32.5%) | 108 (67.5%) |
| Computers, Engineering & Science | 295 (84.8%) | 53 (15.2%) |
| Computers & Mathematics | 58 (87.9%) | 8 (12.1%) |
| Architecture & Engineering | 237 (88.8%) | 30 (11.2%) |
| Life, Physical & Social Science | 0 (0.0%) | 15 (100.0%) |
| Community & Social Service | 138 (20.4%) | 539 (79.6%) |
| Education, Arts & Media | 70 (45.2%) | 85 (54.8%) |
| Legal Services & Support | 19 (70.4%) | 8 (29.6%) |
| Education Instruction & Library | 31 (6.6%) | 440 (93.4%) |
| Arts, Media & Entertainment | 18 (75.0%) | 6 (25.0%) |
| Health Diagnosing & Treating | 90 (20.9%) | 341 (79.1%) |
| Health Technologists | 77 (24.8%) | 233 (75.2%) |
| Total (Category) | 1,138 (47.3%) | 1,269 (52.7%) |
| Total (Overall) | 4,861 (55.6%) | 3,878 (44.4%) |
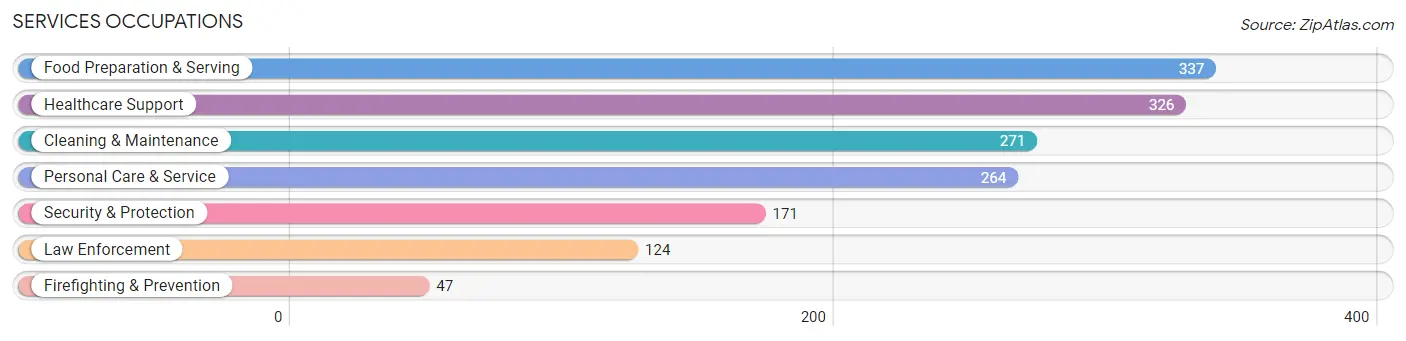
Services Occupations
The most common Services occupations in Hampshire County are Food Preparation & Serving (337 | 3.9%), Healthcare Support (326 | 3.7%), Cleaning & Maintenance (271 | 3.1%), Personal Care & Service (264 | 3.0%), and Security & Protection (171 | 2.0%).
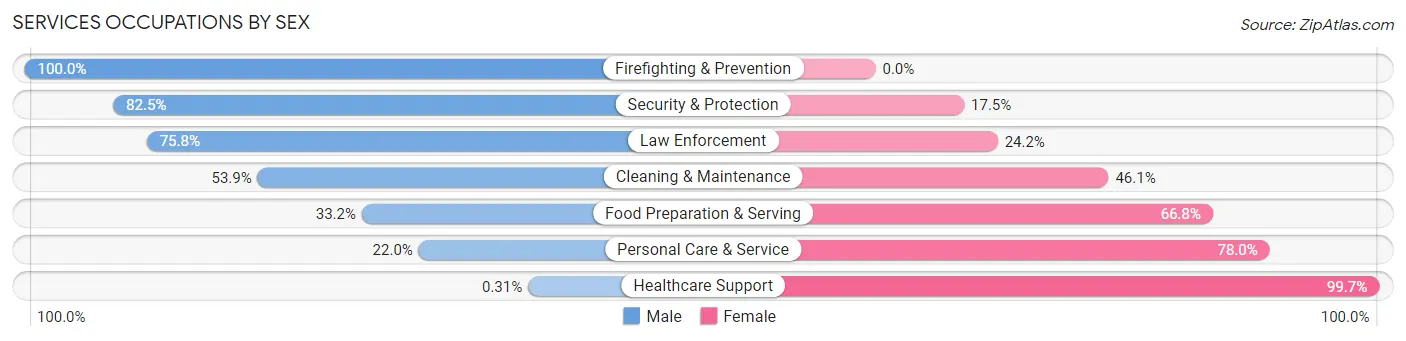
Services Occupations by Sex
Within the Services occupations in Hampshire County, the most male-oriented occupations are Firefighting & Prevention (100.0%), Security & Protection (82.5%), and Law Enforcement (75.8%), while the most female-oriented occupations are Healthcare Support (99.7%), Personal Care & Service (78.0%), and Food Preparation & Serving (66.8%).
| Occupation | Male | Female |
| Healthcare Support | 1 (0.3%) | 325 (99.7%) |
| Security & Protection | 141 (82.5%) | 30 (17.5%) |
| Firefighting & Prevention | 47 (100.0%) | 0 (0.0%) |
| Law Enforcement | 94 (75.8%) | 30 (24.2%) |
| Food Preparation & Serving | 112 (33.2%) | 225 (66.8%) |
| Cleaning & Maintenance | 146 (53.9%) | 125 (46.1%) |
| Personal Care & Service | 58 (22.0%) | 206 (78.0%) |
| Total (Category) | 458 (33.5%) | 911 (66.5%) |
| Total (Overall) | 4,861 (55.6%) | 3,878 (44.4%) |
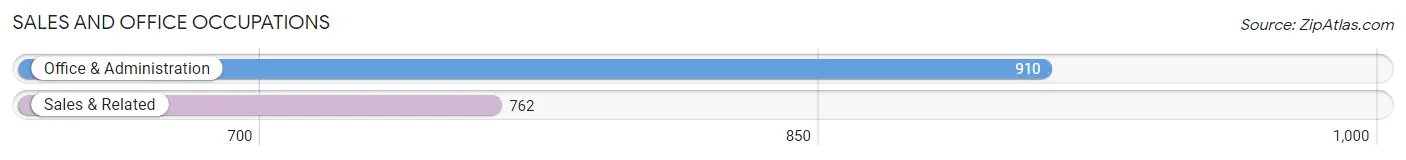
Sales and Office Occupations
The most common Sales and Office occupations in Hampshire County are Office & Administration (910 | 10.4%), and Sales & Related (762 | 8.7%).
Sales and Office Occupations by Sex
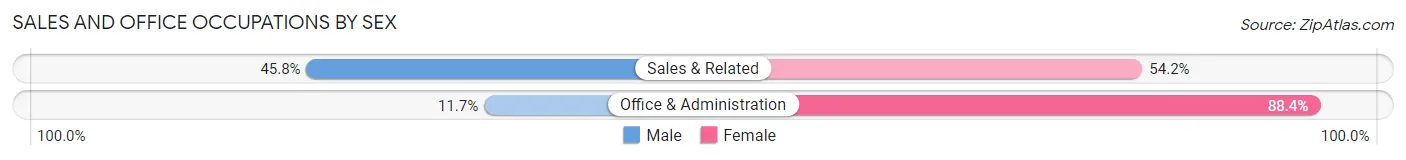
| Occupation | Male | Female |
| Sales & Related | 349 (45.8%) | 413 (54.2%) |
| Office & Administration | 106 (11.7%) | 804 (88.3%) |
| Total (Category) | 455 (27.2%) | 1,217 (72.8%) |
| Total (Overall) | 4,861 (55.6%) | 3,878 (44.4%) |
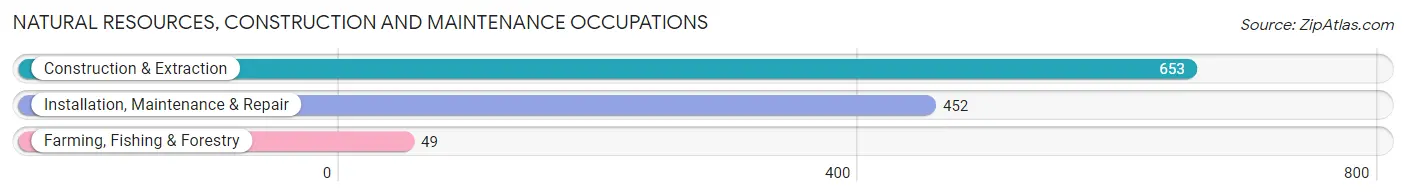
Natural Resources, Construction and Maintenance Occupations
The most common Natural Resources, Construction and Maintenance occupations in Hampshire County are Construction & Extraction (653 | 7.5%), Installation, Maintenance & Repair (452 | 5.2%), and Farming, Fishing & Forestry (49 | 0.6%).
Natural Resources, Construction and Maintenance Occupations by Sex
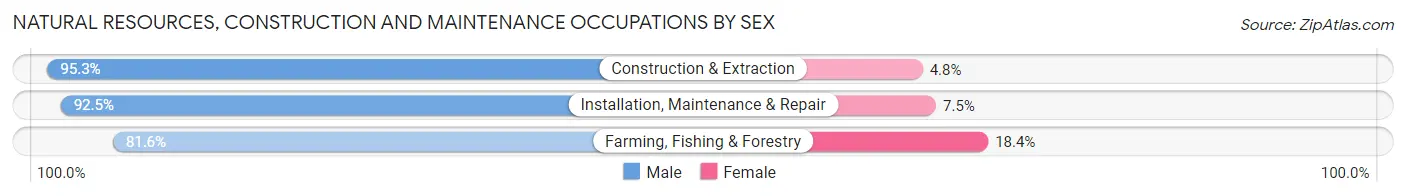
| Occupation | Male | Female |
| Farming, Fishing & Forestry | 40 (81.6%) | 9 (18.4%) |
| Construction & Extraction | 622 (95.3%) | 31 (4.8%) |
| Installation, Maintenance & Repair | 418 (92.5%) | 34 (7.5%) |
| Total (Category) | 1,080 (93.6%) | 74 (6.4%) |
| Total (Overall) | 4,861 (55.6%) | 3,878 (44.4%) |
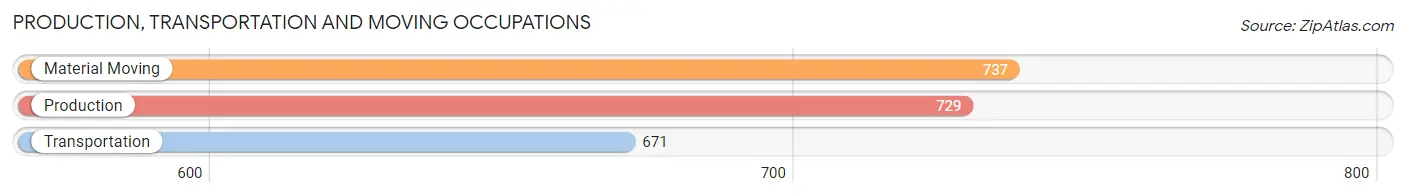
Production, Transportation and Moving Occupations
The most common Production, Transportation and Moving occupations in Hampshire County are Material Moving (737 | 8.4%), Production (729 | 8.3%), and Transportation (671 | 7.7%).
Production, Transportation and Moving Occupations by Sex
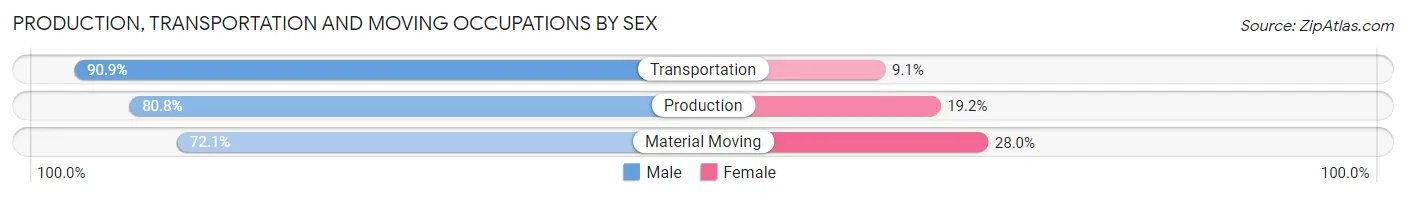
| Occupation | Male | Female |
| Production | 589 (80.8%) | 140 (19.2%) |
| Transportation | 610 (90.9%) | 61 (9.1%) |
| Material Moving | 531 (72.1%) | 206 (28.0%) |
| Total (Category) | 1,730 (80.9%) | 407 (19.1%) |
| Total (Overall) | 4,861 (55.6%) | 3,878 (44.4%) |
Employment Industries by Sex in Hampshire County
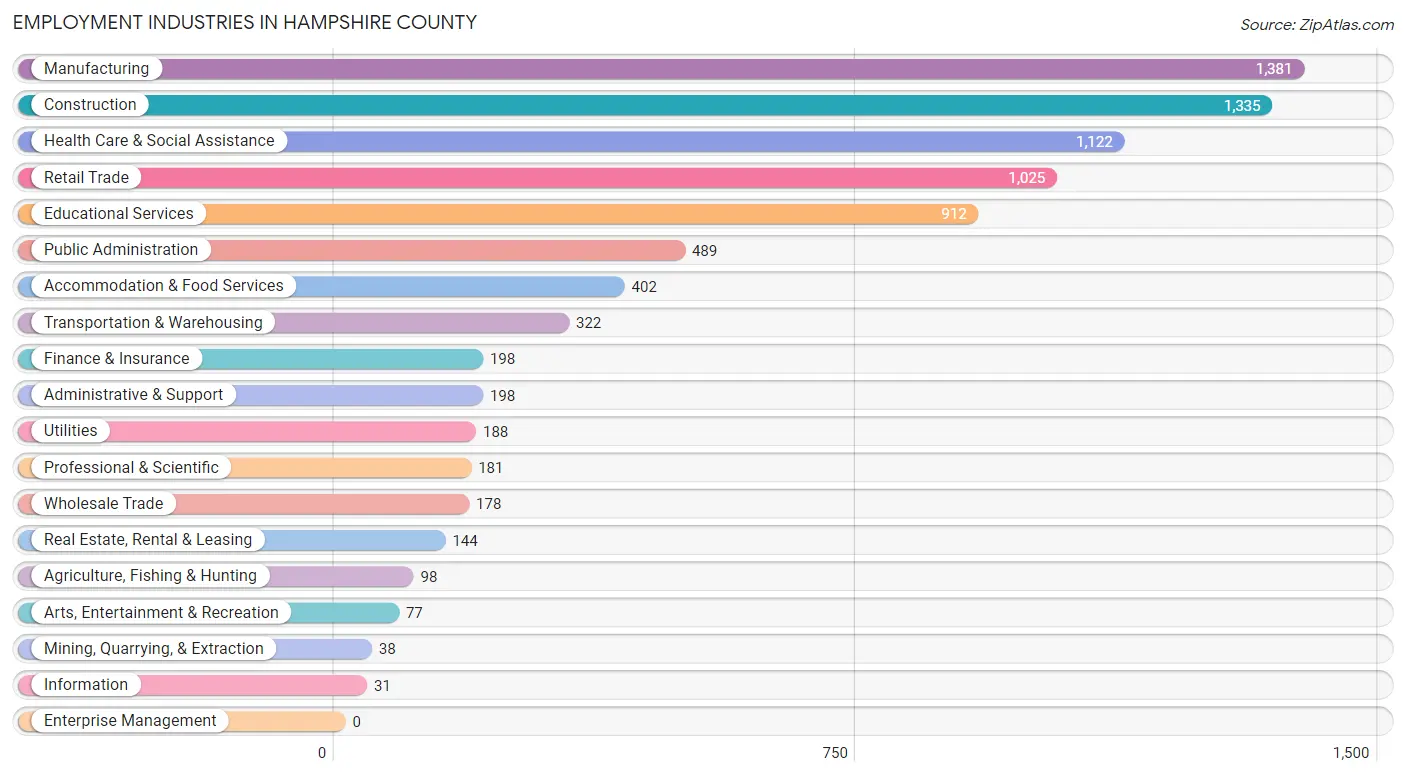
Employment Industries in Hampshire County
The major employment industries in Hampshire County include Manufacturing (1,381 | 15.8%), Construction (1,335 | 15.3%), Health Care & Social Assistance (1,122 | 12.8%), Retail Trade (1,025 | 11.7%), and Educational Services (912 | 10.4%).
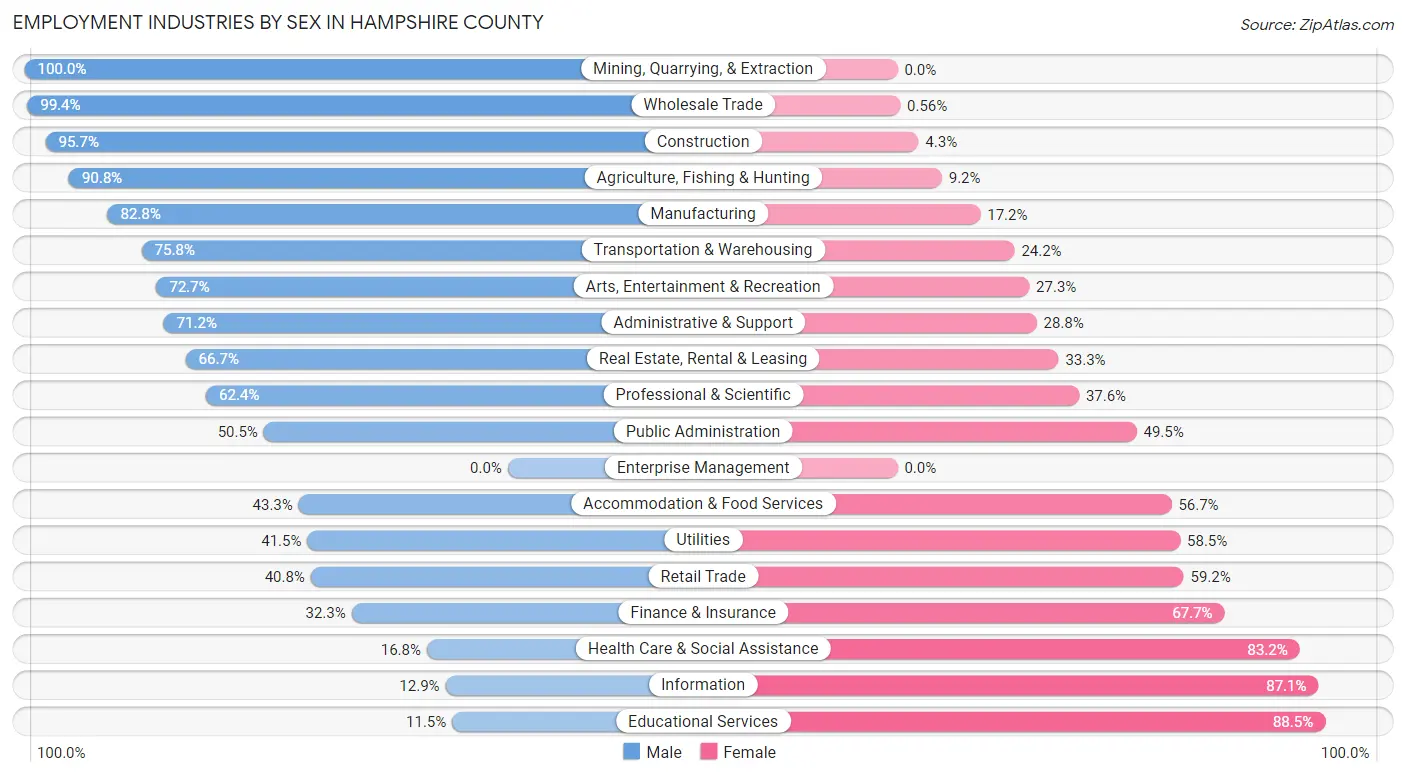
Employment Industries by Sex in Hampshire County
The Hampshire County industries that see more men than women are Mining, Quarrying, & Extraction (100.0%), Wholesale Trade (99.4%), and Construction (95.7%), whereas the industries that tend to have a higher number of women are Educational Services (88.5%), Information (87.1%), and Health Care & Social Assistance (83.2%).
| Industry | Male | Female |
| Agriculture, Fishing & Hunting | 89 (90.8%) | 9 (9.2%) |
| Mining, Quarrying, & Extraction | 38 (100.0%) | 0 (0.0%) |
| Construction | 1,277 (95.7%) | 58 (4.3%) |
| Manufacturing | 1,144 (82.8%) | 237 (17.2%) |
| Wholesale Trade | 177 (99.4%) | 1 (0.6%) |
| Retail Trade | 418 (40.8%) | 607 (59.2%) |
| Transportation & Warehousing | 244 (75.8%) | 78 (24.2%) |
| Utilities | 78 (41.5%) | 110 (58.5%) |
| Information | 4 (12.9%) | 27 (87.1%) |
| Finance & Insurance | 64 (32.3%) | 134 (67.7%) |
| Real Estate, Rental & Leasing | 96 (66.7%) | 48 (33.3%) |
| Professional & Scientific | 113 (62.4%) | 68 (37.6%) |
| Enterprise Management | 0 (0.0%) | 0 (0.0%) |
| Administrative & Support | 141 (71.2%) | 57 (28.8%) |
| Educational Services | 105 (11.5%) | 807 (88.5%) |
| Health Care & Social Assistance | 188 (16.8%) | 934 (83.2%) |
| Arts, Entertainment & Recreation | 56 (72.7%) | 21 (27.3%) |
| Accommodation & Food Services | 174 (43.3%) | 228 (56.7%) |
| Public Administration | 247 (50.5%) | 242 (49.5%) |
| Total | 4,861 (55.6%) | 3,878 (44.4%) |
Education in Hampshire County
School Enrollment in Hampshire County
The most common levels of schooling among the 4,586 students in Hampshire County are middle school (1,246 | 27.2%), high school (1,205 | 26.3%), and elementary school (862 | 18.8%).
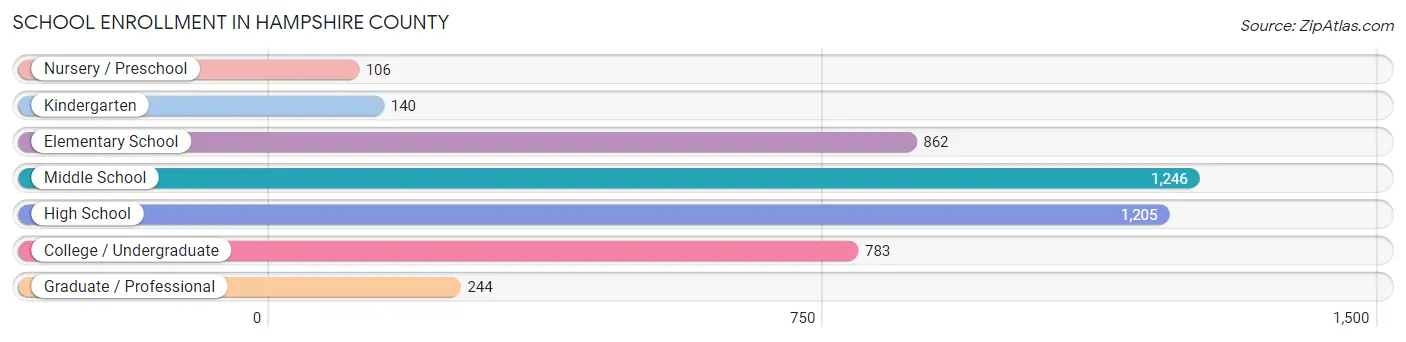
| School Level | # Students | % Students |
| Nursery / Preschool | 106 | 2.3% |
| Kindergarten | 140 | 3.0% |
| Elementary School | 862 | 18.8% |
| Middle School | 1,246 | 27.2% |
| High School | 1,205 | 26.3% |
| College / Undergraduate | 783 | 17.1% |
| Graduate / Professional | 244 | 5.3% |
| Total | 4,586 | 100.0% |
School Enrollment by Age by Funding Source in Hampshire County
Out of a total of 4,586 students who are enrolled in schools in Hampshire County, 624 (13.6%) attend a private institution, while the remaining 3,962 (86.4%) are enrolled in public schools. The age group of 3 to 4 year olds has the highest likelihood of being enrolled in private schools, with 54 (87.1% in the age bracket) enrolled. Conversely, the age group of 25 to 34 year olds has the lowest likelihood of being enrolled in a private school, with 286 (98.0% in the age bracket) attending a public institution.
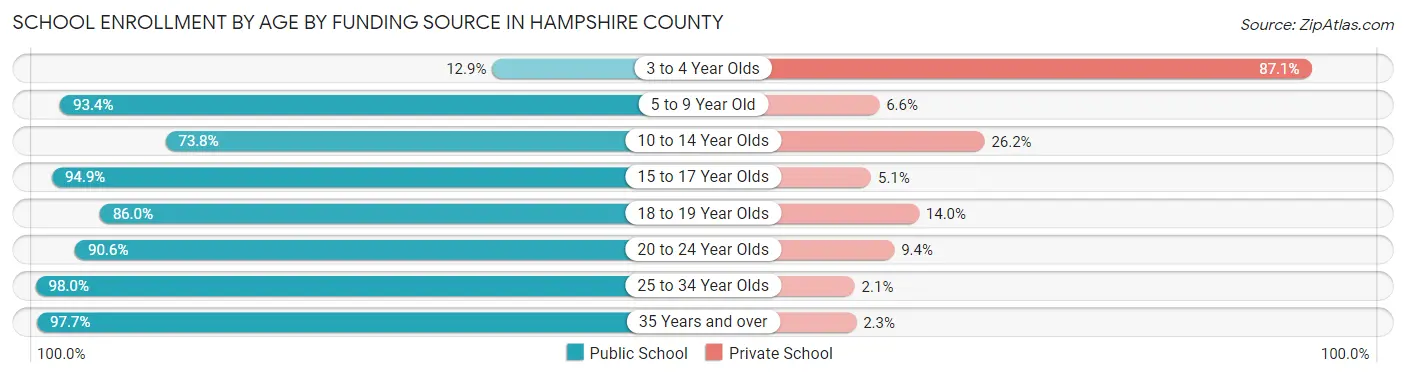
| Age Bracket | Public School | Private School |
| 3 to 4 Year Olds | 8 (12.9%) | 54 (87.1%) |
| 5 to 9 Year Old | 846 (93.4%) | 60 (6.6%) |
| 10 to 14 Year Olds | 1,010 (73.8%) | 359 (26.2%) |
| 15 to 17 Year Olds | 782 (94.9%) | 42 (5.1%) |
| 18 to 19 Year Olds | 424 (86.0%) | 69 (14.0%) |
| 20 to 24 Year Olds | 231 (90.6%) | 24 (9.4%) |
| 25 to 34 Year Olds | 286 (98.0%) | 6 (2.1%) |
| 35 Years and over | 376 (97.7%) | 9 (2.3%) |
| Total | 3,962 (86.4%) | 624 (13.6%) |
Educational Attainment by Field of Study in Hampshire County
Education (610 | 23.2%), business (376 | 14.3%), science & technology (258 | 9.8%), literature & languages (226 | 8.6%), and bio, nature & agricultural (218 | 8.3%) are the most common fields of study among 2,630 individuals in Hampshire County who have obtained a bachelor's degree or higher.
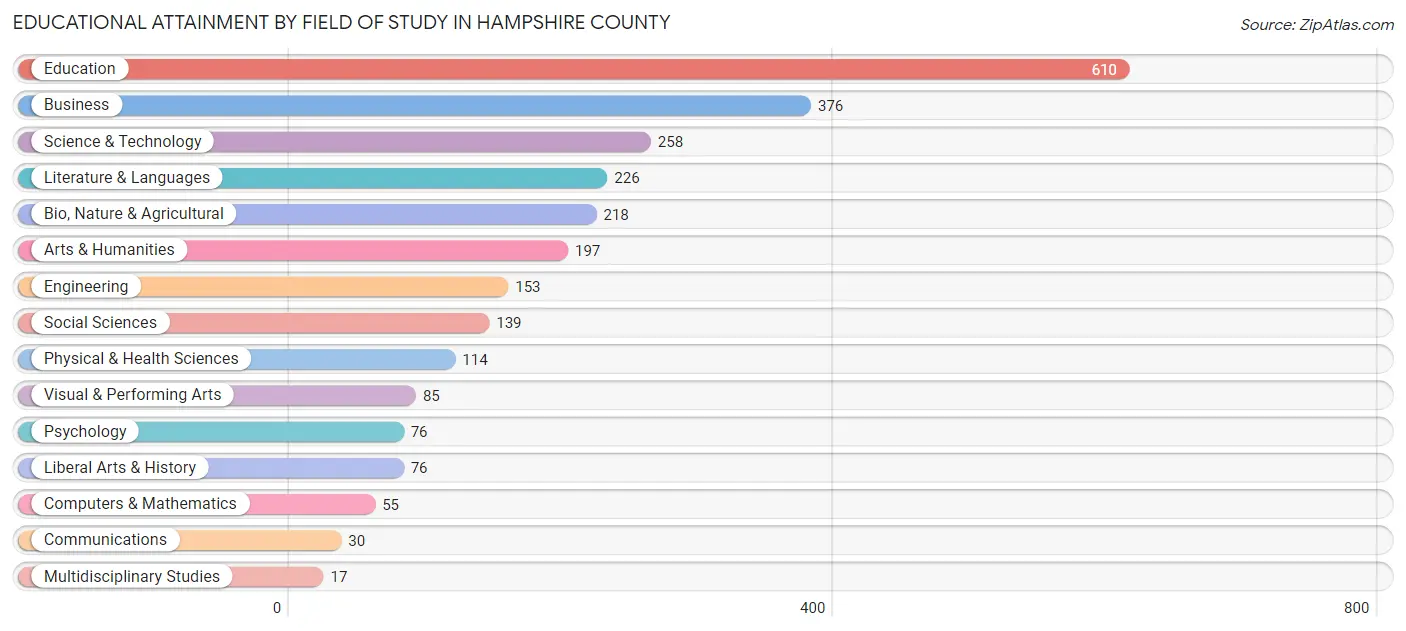
| Field of Study | # Graduates | % Graduates |
| Computers & Mathematics | 55 | 2.1% |
| Bio, Nature & Agricultural | 218 | 8.3% |
| Physical & Health Sciences | 114 | 4.3% |
| Psychology | 76 | 2.9% |
| Social Sciences | 139 | 5.3% |
| Engineering | 153 | 5.8% |
| Multidisciplinary Studies | 17 | 0.6% |
| Science & Technology | 258 | 9.8% |
| Business | 376 | 14.3% |
| Education | 610 | 23.2% |
| Literature & Languages | 226 | 8.6% |
| Liberal Arts & History | 76 | 2.9% |
| Visual & Performing Arts | 85 | 3.2% |
| Communications | 30 | 1.1% |
| Arts & Humanities | 197 | 7.5% |
| Total | 2,630 | 100.0% |
Transportation & Commute in Hampshire County
Vehicle Availability by Sex in Hampshire County
The most prevalent vehicle ownership categories in Hampshire County are males with 2 vehicles (1,890, accounting for 39.4%) and females with 2 vehicles (1,290, making up 50.8%).
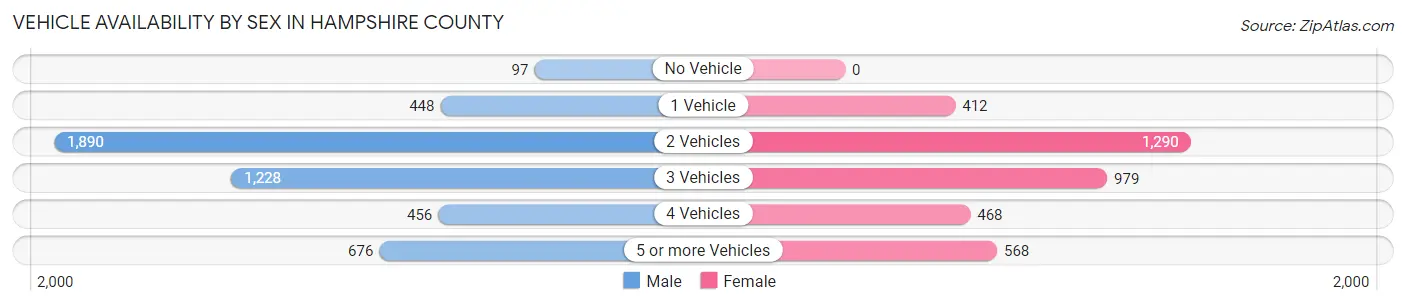
| Vehicles Available | Male | Female |
| No Vehicle | 97 (2.0%) | 0 (0.0%) |
| 1 Vehicle | 448 (9.3%) | 412 (11.1%) |
| 2 Vehicles | 1,890 (39.4%) | 1,290 (34.7%) |
| 3 Vehicles | 1,228 (25.6%) | 979 (26.3%) |
| 4 Vehicles | 456 (9.5%) | 468 (12.6%) |
| 5 or more Vehicles | 676 (14.1%) | 568 (15.3%) |
| Total | 4,795 (100.0%) | 3,717 (100.0%) |
Commute Time in Hampshire County
The most frequently occuring commute durations in Hampshire County are 30 to 34 minutes (1,347 commuters, 16.8%), 45 to 59 minutes (1,291 commuters, 16.1%), and 60 to 89 minutes (804 commuters, 10.0%).
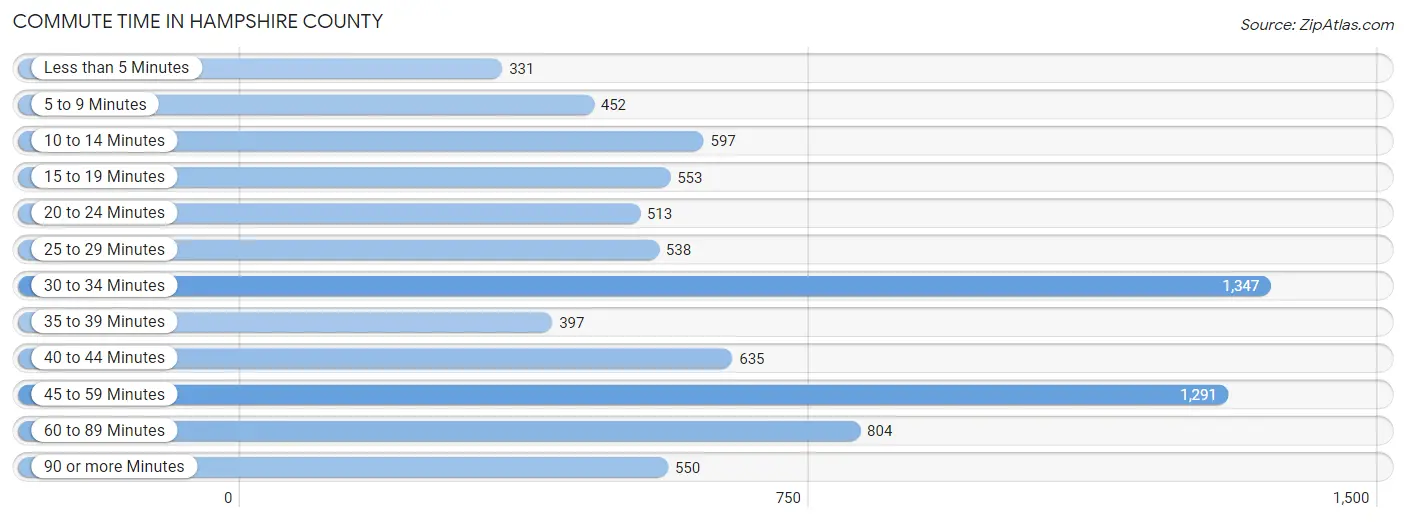
| Commute Time | # Commuters | % Commuters |
| Less than 5 Minutes | 331 | 4.1% |
| 5 to 9 Minutes | 452 | 5.6% |
| 10 to 14 Minutes | 597 | 7.5% |
| 15 to 19 Minutes | 553 | 6.9% |
| 20 to 24 Minutes | 513 | 6.4% |
| 25 to 29 Minutes | 538 | 6.7% |
| 30 to 34 Minutes | 1,347 | 16.8% |
| 35 to 39 Minutes | 397 | 5.0% |
| 40 to 44 Minutes | 635 | 7.9% |
| 45 to 59 Minutes | 1,291 | 16.1% |
| 60 to 89 Minutes | 804 | 10.0% |
| 90 or more Minutes | 550 | 6.9% |
Commute Time by Sex in Hampshire County
The most common commute times in Hampshire County are 30 to 34 minutes (901 commuters, 19.5%) for males and 45 to 59 minutes (637 commuters, 18.8%) for females.
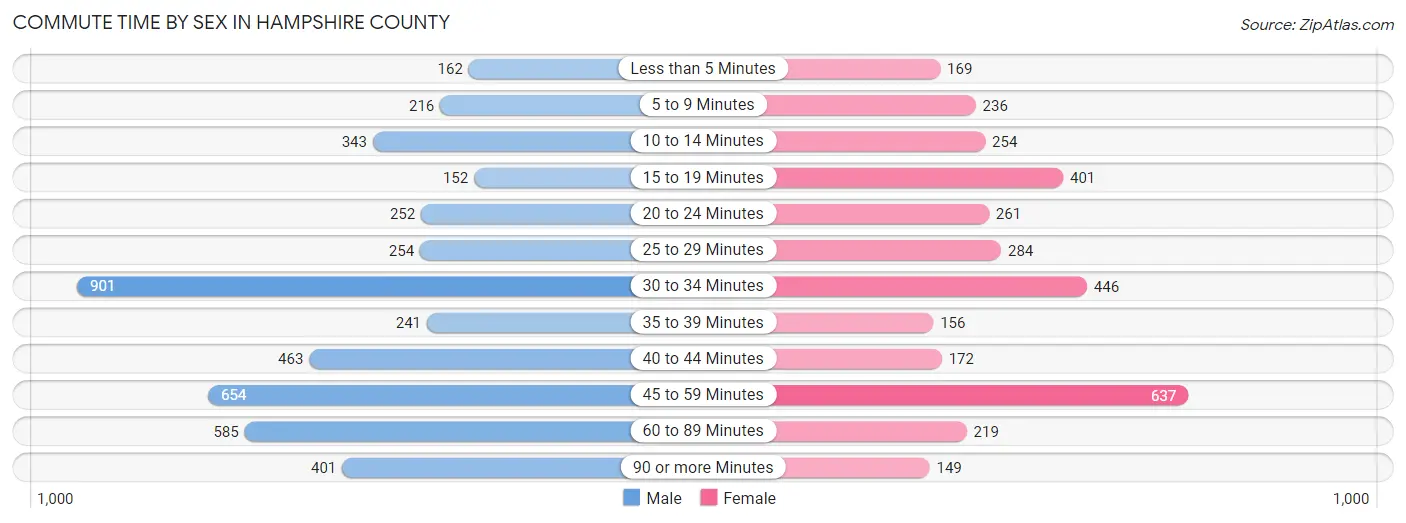
| Commute Time | Male | Female |
| Less than 5 Minutes | 162 (3.5%) | 169 (5.0%) |
| 5 to 9 Minutes | 216 (4.7%) | 236 (7.0%) |
| 10 to 14 Minutes | 343 (7.4%) | 254 (7.5%) |
| 15 to 19 Minutes | 152 (3.3%) | 401 (11.8%) |
| 20 to 24 Minutes | 252 (5.4%) | 261 (7.7%) |
| 25 to 29 Minutes | 254 (5.5%) | 284 (8.4%) |
| 30 to 34 Minutes | 901 (19.5%) | 446 (13.2%) |
| 35 to 39 Minutes | 241 (5.2%) | 156 (4.6%) |
| 40 to 44 Minutes | 463 (10.0%) | 172 (5.1%) |
| 45 to 59 Minutes | 654 (14.1%) | 637 (18.8%) |
| 60 to 89 Minutes | 585 (12.7%) | 219 (6.5%) |
| 90 or more Minutes | 401 (8.7%) | 149 (4.4%) |
Time of Departure to Work by Sex in Hampshire County
The most frequent times of departure to work in Hampshire County are 7:00 AM to 7:29 AM (621, 13.4%) for males and 7:00 AM to 7:29 AM (609, 18.0%) for females.
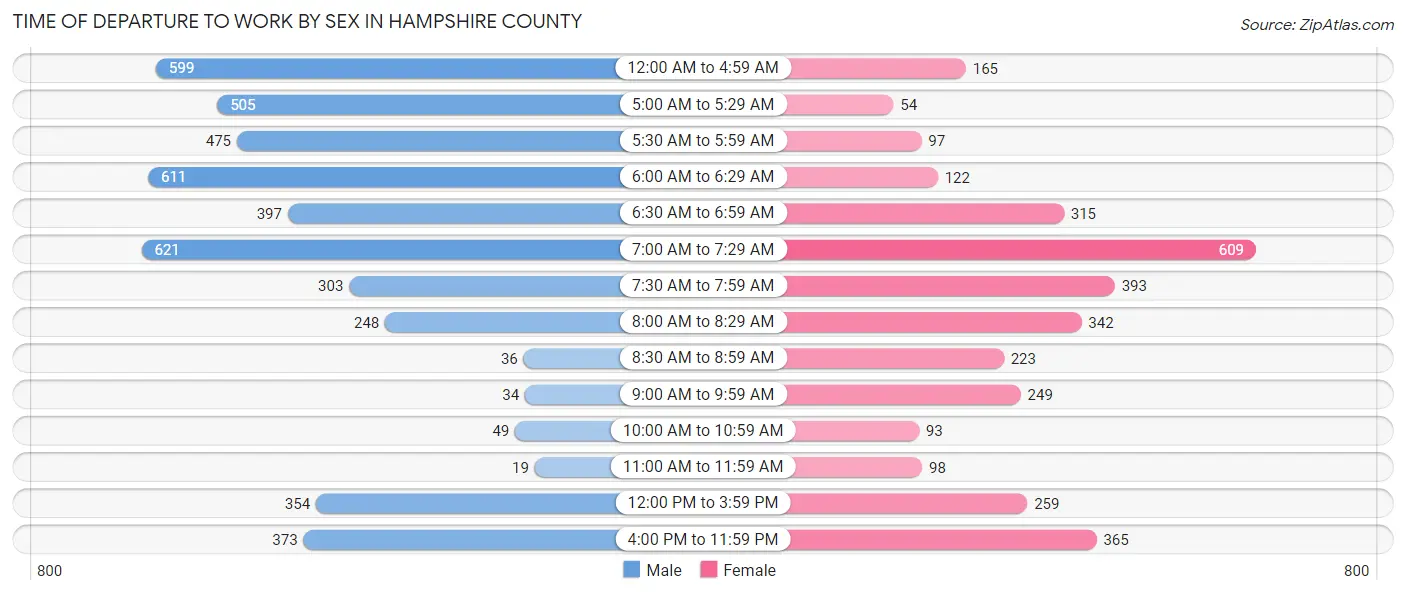
| Time of Departure | Male | Female |
| 12:00 AM to 4:59 AM | 599 (13.0%) | 165 (4.9%) |
| 5:00 AM to 5:29 AM | 505 (10.9%) | 54 (1.6%) |
| 5:30 AM to 5:59 AM | 475 (10.3%) | 97 (2.9%) |
| 6:00 AM to 6:29 AM | 611 (13.2%) | 122 (3.6%) |
| 6:30 AM to 6:59 AM | 397 (8.6%) | 315 (9.3%) |
| 7:00 AM to 7:29 AM | 621 (13.4%) | 609 (18.0%) |
| 7:30 AM to 7:59 AM | 303 (6.6%) | 393 (11.6%) |
| 8:00 AM to 8:29 AM | 248 (5.4%) | 342 (10.1%) |
| 8:30 AM to 8:59 AM | 36 (0.8%) | 223 (6.6%) |
| 9:00 AM to 9:59 AM | 34 (0.7%) | 249 (7.4%) |
| 10:00 AM to 10:59 AM | 49 (1.1%) | 93 (2.8%) |
| 11:00 AM to 11:59 AM | 19 (0.4%) | 98 (2.9%) |
| 12:00 PM to 3:59 PM | 354 (7.7%) | 259 (7.6%) |
| 4:00 PM to 11:59 PM | 373 (8.1%) | 365 (10.8%) |
| Total | 4,624 (100.0%) | 3,384 (100.0%) |
Housing Occupancy in Hampshire County
Occupancy by Ownership in Hampshire County
Of the total 8,066 dwellings in Hampshire County, owner-occupied units account for 6,558 (81.3%), while renter-occupied units make up 1,508 (18.7%).
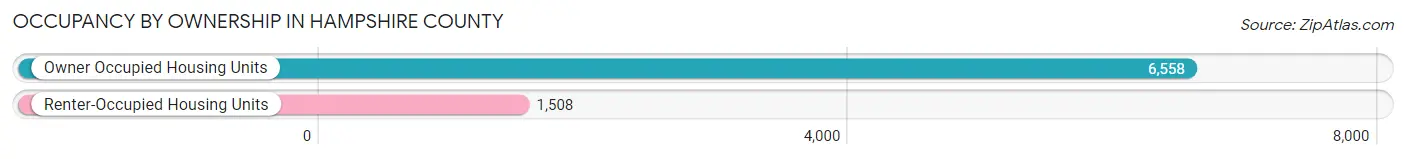
| Occupancy | # Housing Units | % Housing Units |
| Owner Occupied Housing Units | 6,558 | 81.3% |
| Renter-Occupied Housing Units | 1,508 | 18.7% |
| Total Occupied Housing Units | 8,066 | 100.0% |
Occupancy by Household Size in Hampshire County
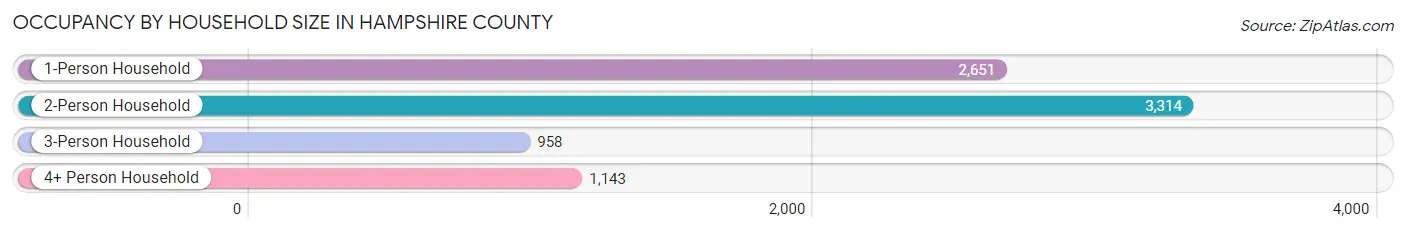
| Household Size | # Housing Units | % Housing Units |
| 1-Person Household | 2,651 | 32.9% |
| 2-Person Household | 3,314 | 41.1% |
| 3-Person Household | 958 | 11.9% |
| 4+ Person Household | 1,143 | 14.2% |
| Total Housing Units | 8,066 | 100.0% |
Occupancy by Ownership by Household Size in Hampshire County
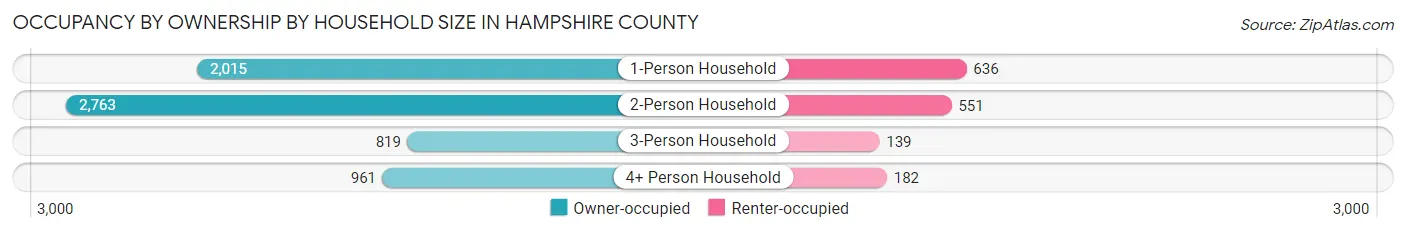
| Household Size | Owner-occupied | Renter-occupied |
| 1-Person Household | 2,015 (76.0%) | 636 (24.0%) |
| 2-Person Household | 2,763 (83.4%) | 551 (16.6%) |
| 3-Person Household | 819 (85.5%) | 139 (14.5%) |
| 4+ Person Household | 961 (84.1%) | 182 (15.9%) |
| Total Housing Units | 6,558 (81.3%) | 1,508 (18.7%) |
Occupancy by Educational Attainment in Hampshire County
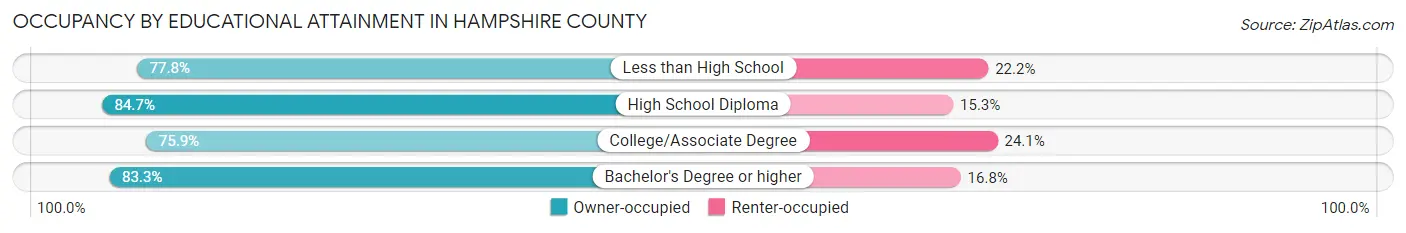
| Household Size | Owner-occupied | Renter-occupied |
| Less than High School | 644 (77.8%) | 184 (22.2%) |
| High School Diploma | 3,032 (84.7%) | 546 (15.3%) |
| College/Associate Degree | 1,714 (75.9%) | 543 (24.1%) |
| Bachelor's Degree or higher | 1,168 (83.3%) | 235 (16.8%) |
Occupancy by Age of Householder in Hampshire County
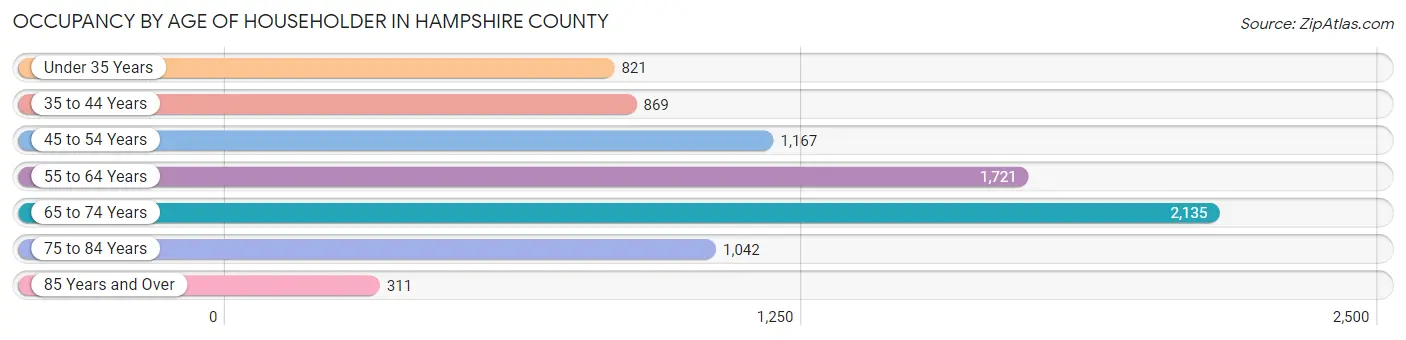
| Age Bracket | # Households | % Households |
| Under 35 Years | 821 | 10.2% |
| 35 to 44 Years | 869 | 10.8% |
| 45 to 54 Years | 1,167 | 14.5% |
| 55 to 64 Years | 1,721 | 21.3% |
| 65 to 74 Years | 2,135 | 26.5% |
| 75 to 84 Years | 1,042 | 12.9% |
| 85 Years and Over | 311 | 3.9% |
| Total | 8,066 | 100.0% |
Housing Finances in Hampshire County
Median Income by Occupancy in Hampshire County
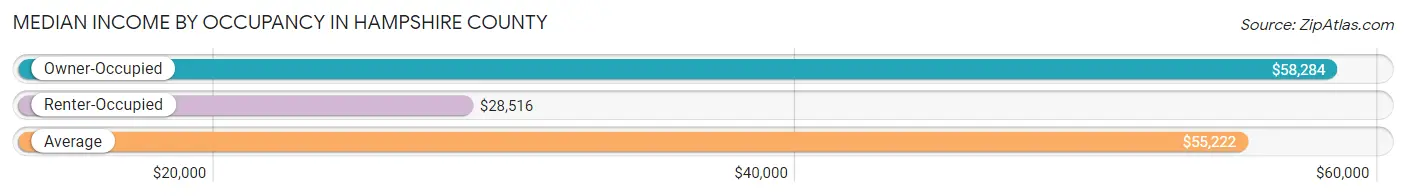
| Occupancy Type | # Households | Median Income |
| Owner-Occupied | 6,558 (81.3%) | $58,284 |
| Renter-Occupied | 1,508 (18.7%) | $28,516 |
| Average | 8,066 (100.0%) | $55,222 |
Occupancy by Householder Income Bracket in Hampshire County
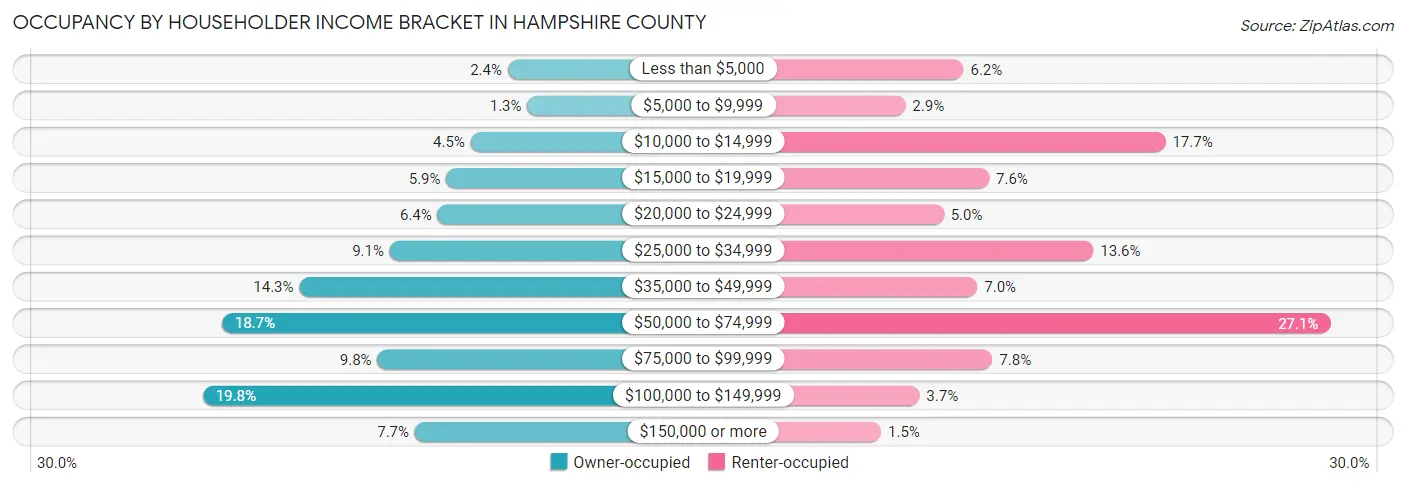
| Income Bracket | Owner-occupied | Renter-occupied |
| Less than $5,000 | 157 (2.4%) | 93 (6.2%) |
| $5,000 to $9,999 | 83 (1.3%) | 43 (2.9%) |
| $10,000 to $14,999 | 296 (4.5%) | 267 (17.7%) |
| $15,000 to $19,999 | 387 (5.9%) | 115 (7.6%) |
| $20,000 to $24,999 | 420 (6.4%) | 76 (5.0%) |
| $25,000 to $34,999 | 599 (9.1%) | 205 (13.6%) |
| $35,000 to $49,999 | 938 (14.3%) | 105 (7.0%) |
| $50,000 to $74,999 | 1,228 (18.7%) | 409 (27.1%) |
| $75,000 to $99,999 | 645 (9.8%) | 118 (7.8%) |
| $100,000 to $149,999 | 1,300 (19.8%) | 55 (3.6%) |
| $150,000 or more | 505 (7.7%) | 22 (1.5%) |
| Total | 6,558 (100.0%) | 1,508 (100.0%) |
Monthly Housing Cost Tiers in Hampshire County
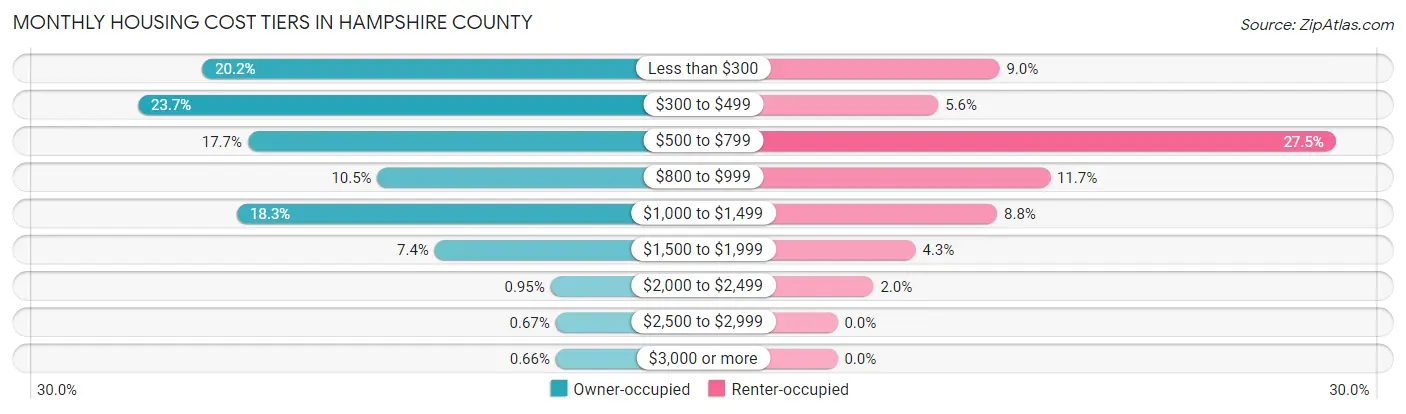
| Monthly Cost | Owner-occupied | Renter-occupied |
| Less than $300 | 1,324 (20.2%) | 135 (8.9%) |
| $300 to $499 | 1,557 (23.7%) | 84 (5.6%) |
| $500 to $799 | 1,159 (17.7%) | 415 (27.5%) |
| $800 to $999 | 689 (10.5%) | 177 (11.7%) |
| $1,000 to $1,499 | 1,198 (18.3%) | 133 (8.8%) |
| $1,500 to $1,999 | 482 (7.3%) | 65 (4.3%) |
| $2,000 to $2,499 | 62 (0.9%) | 30 (2.0%) |
| $2,500 to $2,999 | 44 (0.7%) | 0 (0.0%) |
| $3,000 or more | 43 (0.7%) | 0 (0.0%) |
| Total | 6,558 (100.0%) | 1,508 (100.0%) |
Physical Housing Characteristics in Hampshire County
Housing Structures in Hampshire County
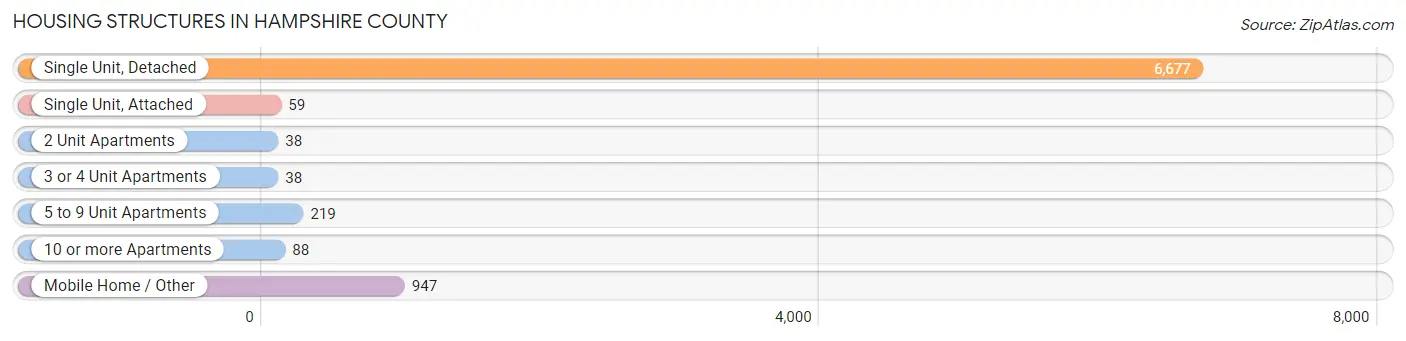
| Structure Type | # Housing Units | % Housing Units |
| Single Unit, Detached | 6,677 | 82.8% |
| Single Unit, Attached | 59 | 0.7% |
| 2 Unit Apartments | 38 | 0.5% |
| 3 or 4 Unit Apartments | 38 | 0.5% |
| 5 to 9 Unit Apartments | 219 | 2.7% |
| 10 or more Apartments | 88 | 1.1% |
| Mobile Home / Other | 947 | 11.7% |
| Total | 8,066 | 100.0% |
Housing Structures by Occupancy in Hampshire County
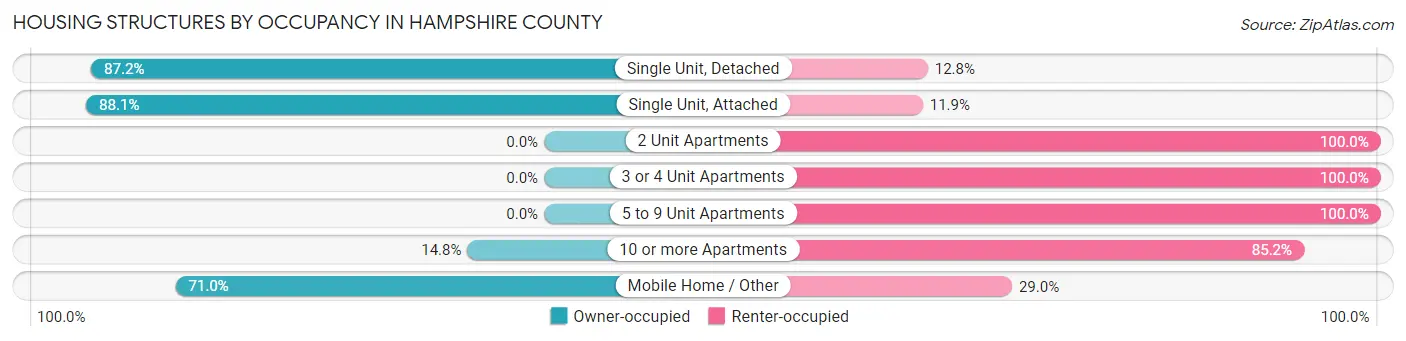
| Structure Type | Owner-occupied | Renter-occupied |
| Single Unit, Detached | 5,821 (87.2%) | 856 (12.8%) |
| Single Unit, Attached | 52 (88.1%) | 7 (11.9%) |
| 2 Unit Apartments | 0 (0.0%) | 38 (100.0%) |
| 3 or 4 Unit Apartments | 0 (0.0%) | 38 (100.0%) |
| 5 to 9 Unit Apartments | 0 (0.0%) | 219 (100.0%) |
| 10 or more Apartments | 13 (14.8%) | 75 (85.2%) |
| Mobile Home / Other | 672 (71.0%) | 275 (29.0%) |
| Total | 6,558 (81.3%) | 1,508 (18.7%) |
Housing Structures by Number of Rooms in Hampshire County
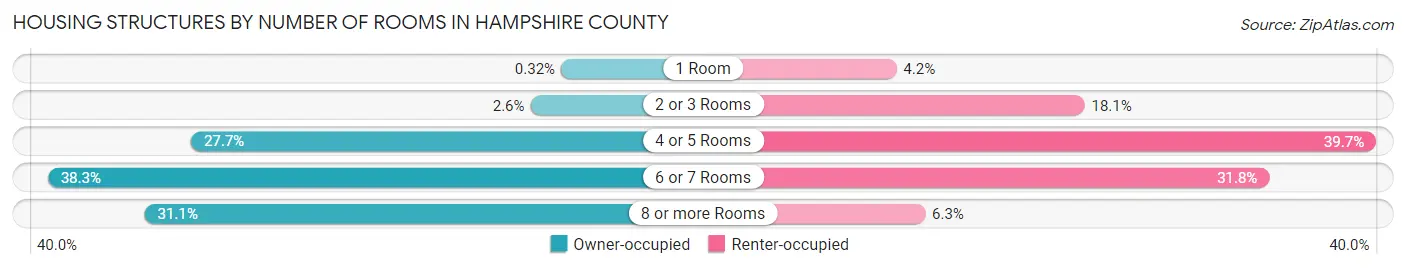
| Number of Rooms | Owner-occupied | Renter-occupied |
| 1 Room | 21 (0.3%) | 63 (4.2%) |
| 2 or 3 Rooms | 169 (2.6%) | 273 (18.1%) |
| 4 or 5 Rooms | 1,816 (27.7%) | 598 (39.7%) |
| 6 or 7 Rooms | 2,511 (38.3%) | 479 (31.8%) |
| 8 or more Rooms | 2,041 (31.1%) | 95 (6.3%) |
| Total | 6,558 (100.0%) | 1,508 (100.0%) |
Housing Structure by Heating Type in Hampshire County
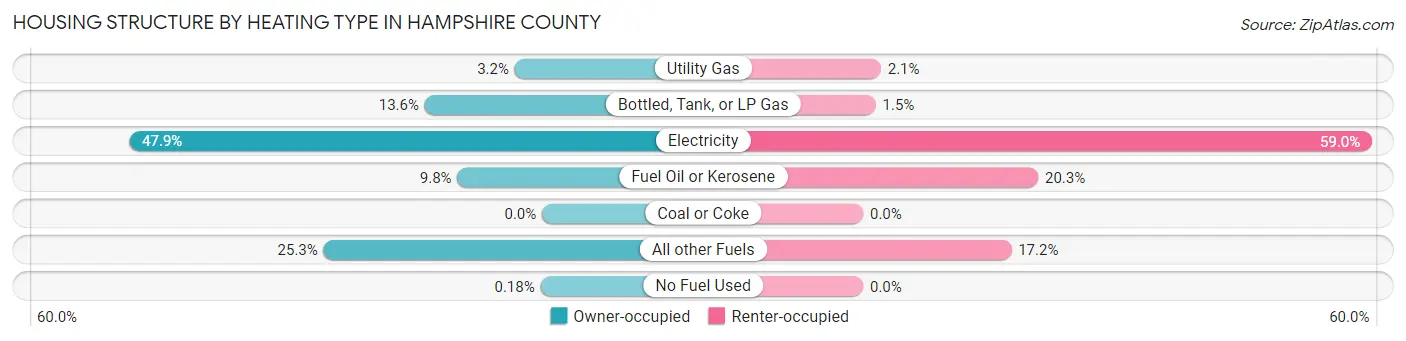
| Heating Type | Owner-occupied | Renter-occupied |
| Utility Gas | 208 (3.2%) | 31 (2.1%) |
| Bottled, Tank, or LP Gas | 892 (13.6%) | 22 (1.5%) |
| Electricity | 3,141 (47.9%) | 890 (59.0%) |
| Fuel Oil or Kerosene | 644 (9.8%) | 306 (20.3%) |
| Coal or Coke | 0 (0.0%) | 0 (0.0%) |
| All other Fuels | 1,661 (25.3%) | 259 (17.2%) |
| No Fuel Used | 12 (0.2%) | 0 (0.0%) |
| Total | 6,558 (100.0%) | 1,508 (100.0%) |
Household Vehicle Usage in Hampshire County
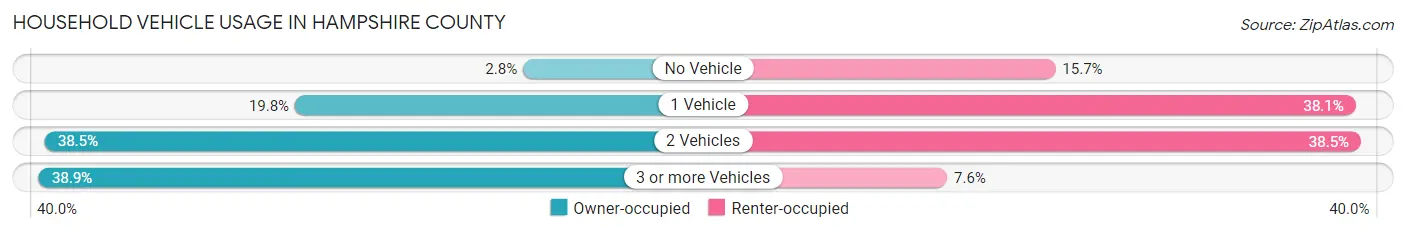
| Vehicles per Household | Owner-occupied | Renter-occupied |
| No Vehicle | 182 (2.8%) | 237 (15.7%) |
| 1 Vehicle | 1,299 (19.8%) | 575 (38.1%) |
| 2 Vehicles | 2,524 (38.5%) | 581 (38.5%) |
| 3 or more Vehicles | 2,553 (38.9%) | 115 (7.6%) |
| Total | 6,558 (100.0%) | 1,508 (100.0%) |
Real Estate & Mortgages in Hampshire County
Real Estate and Mortgage Overview in Hampshire County
| Characteristic | Without Mortgage | With Mortgage |
| Housing Units | 3,579 | 2,979 |
| Median Property Value | $186,700 | $183,800 |
| Median Household Income | $47,923 | $281 |
| Monthly Housing Costs | $347 | $41 |
| Real Estate Taxes | $707 | $103 |
Property Value by Mortgage Status in Hampshire County
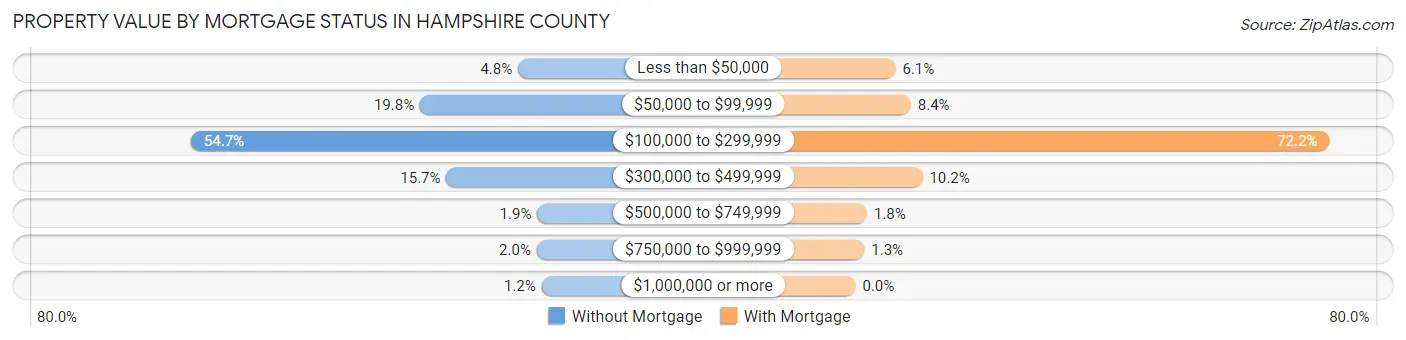
| Property Value | Without Mortgage | With Mortgage |
| Less than $50,000 | 172 (4.8%) | 181 (6.1%) |
| $50,000 to $99,999 | 707 (19.8%) | 251 (8.4%) |
| $100,000 to $299,999 | 1,956 (54.6%) | 2,151 (72.2%) |
| $300,000 to $499,999 | 563 (15.7%) | 304 (10.2%) |
| $500,000 to $749,999 | 67 (1.9%) | 52 (1.8%) |
| $750,000 to $999,999 | 70 (2.0%) | 40 (1.3%) |
| $1,000,000 or more | 44 (1.2%) | 0 (0.0%) |
| Total | 3,579 (100.0%) | 2,979 (100.0%) |
Household Income by Mortgage Status in Hampshire County
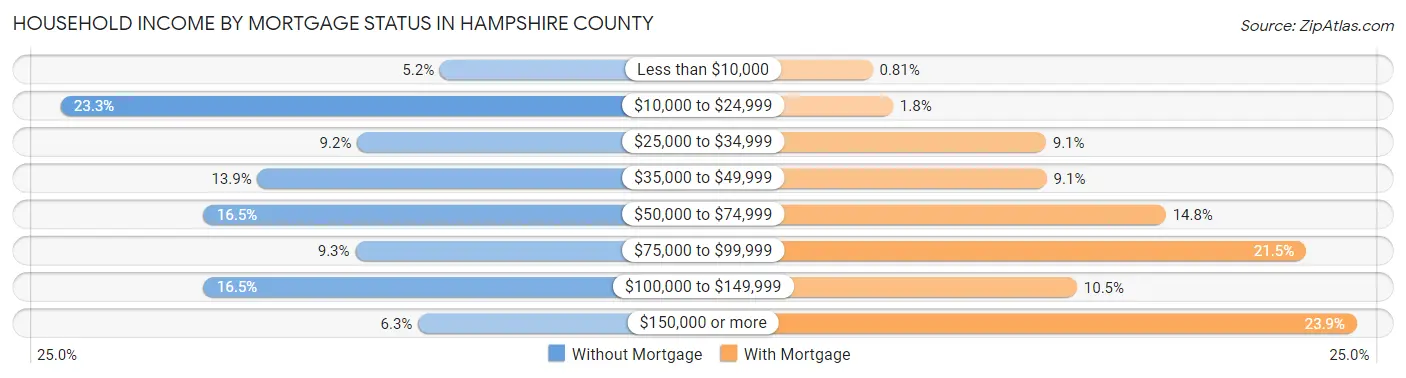
| Household Income | Without Mortgage | With Mortgage |
| Less than $10,000 | 187 (5.2%) | 24 (0.8%) |
| $10,000 to $24,999 | 833 (23.3%) | 53 (1.8%) |
| $25,000 to $34,999 | 328 (9.2%) | 270 (9.1%) |
| $35,000 to $49,999 | 498 (13.9%) | 271 (9.1%) |
| $50,000 to $74,999 | 589 (16.5%) | 440 (14.8%) |
| $75,000 to $99,999 | 331 (9.2%) | 639 (21.4%) |
| $100,000 to $149,999 | 589 (16.5%) | 314 (10.5%) |
| $150,000 or more | 224 (6.3%) | 711 (23.9%) |
| Total | 3,579 (100.0%) | 2,979 (100.0%) |
Property Value to Household Income Ratio in Hampshire County
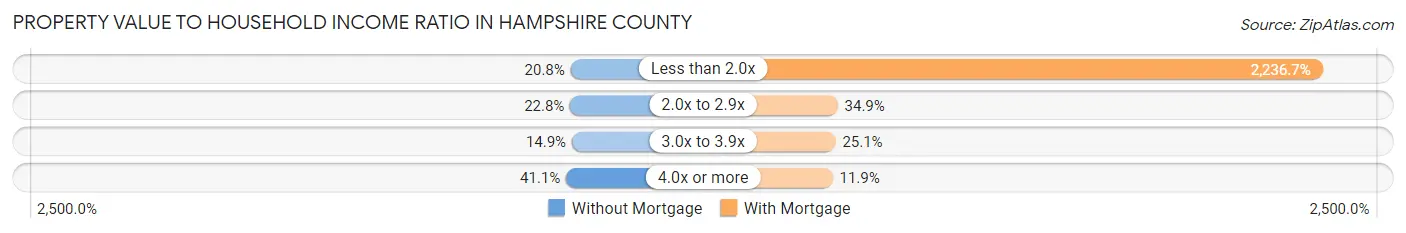
| Value-to-Income Ratio | Without Mortgage | With Mortgage |
| Less than 2.0x | 746 (20.8%) | 66,630 (2,236.7%) |
| 2.0x to 2.9x | 816 (22.8%) | 1,040 (34.9%) |
| 3.0x to 3.9x | 534 (14.9%) | 747 (25.1%) |
| 4.0x or more | 1,470 (41.1%) | 355 (11.9%) |
| Total | 3,579 (100.0%) | 2,979 (100.0%) |
Real Estate Taxes by Mortgage Status in Hampshire County
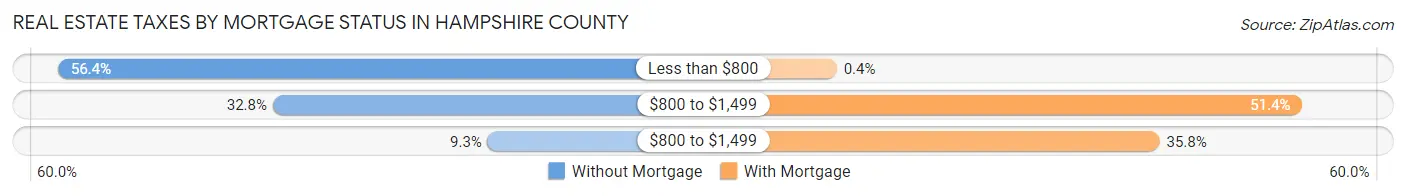
| Property Taxes | Without Mortgage | With Mortgage |
| Less than $800 | 2,017 (56.4%) | 12 (0.4%) |
| $800 to $1,499 | 1,174 (32.8%) | 1,532 (51.4%) |
| $800 to $1,499 | 331 (9.2%) | 1,066 (35.8%) |
| Total | 3,579 (100.0%) | 2,979 (100.0%) |
Health & Disability in Hampshire County
Health Insurance Coverage by Age in Hampshire County
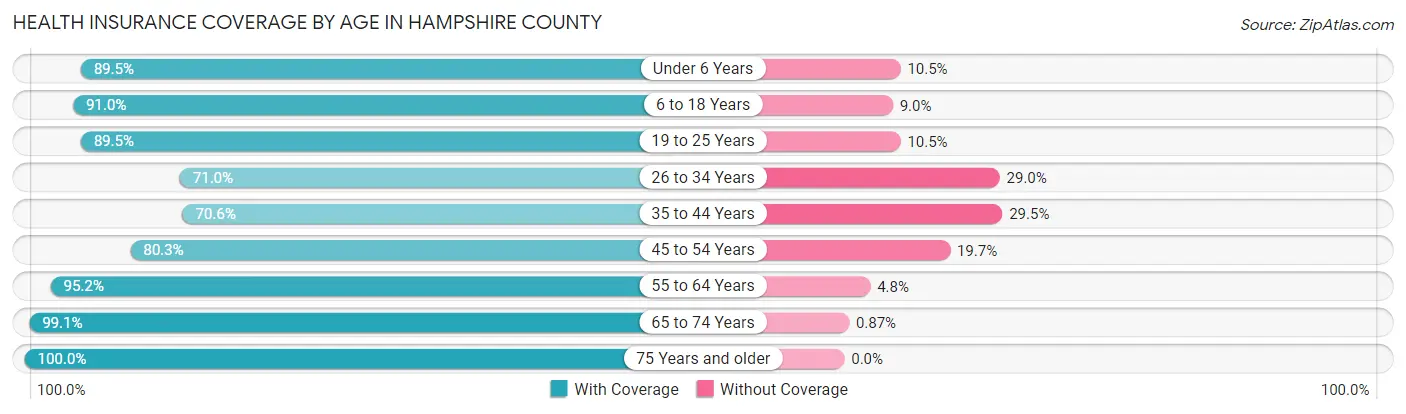
| Age Bracket | With Coverage | Without Coverage |
| Under 6 Years | 1,180 (89.5%) | 138 (10.5%) |
| 6 to 18 Years | 3,194 (91.0%) | 317 (9.0%) |
| 19 to 25 Years | 958 (89.5%) | 112 (10.5%) |
| 26 to 34 Years | 1,553 (71.0%) | 633 (29.0%) |
| 35 to 44 Years | 1,691 (70.6%) | 706 (29.4%) |
| 45 to 54 Years | 2,648 (80.3%) | 650 (19.7%) |
| 55 to 64 Years | 3,496 (95.2%) | 178 (4.8%) |
| 65 to 74 Years | 3,201 (99.1%) | 28 (0.9%) |
| 75 Years and older | 2,092 (100.0%) | 0 (0.0%) |
| Total | 20,013 (87.9%) | 2,762 (12.1%) |
Health Insurance Coverage by Citizenship Status in Hampshire County
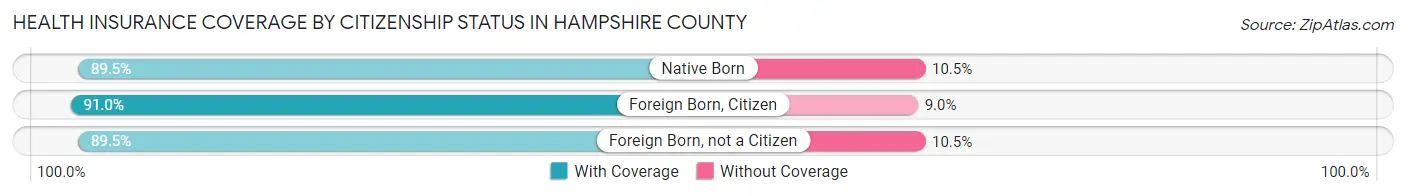
| Citizenship Status | With Coverage | Without Coverage |
| Native Born | 1,180 (89.5%) | 138 (10.5%) |
| Foreign Born, Citizen | 3,194 (91.0%) | 317 (9.0%) |
| Foreign Born, not a Citizen | 958 (89.5%) | 112 (10.5%) |
Health Insurance Coverage by Household Income in Hampshire County
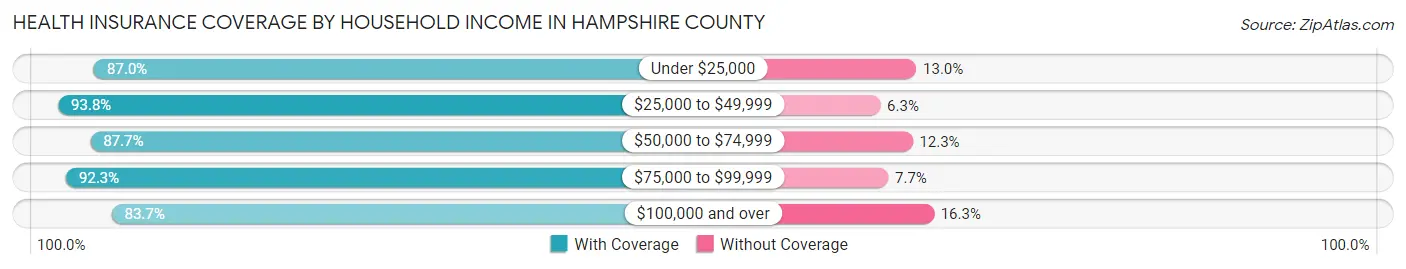
| Household Income | With Coverage | Without Coverage |
| Under $25,000 | 3,423 (87.0%) | 511 (13.0%) |
| $25,000 to $49,999 | 4,083 (93.8%) | 272 (6.2%) |
| $50,000 to $74,999 | 4,299 (87.7%) | 603 (12.3%) |
| $75,000 to $99,999 | 1,895 (92.3%) | 159 (7.7%) |
| $100,000 and over | 6,254 (83.7%) | 1,217 (16.3%) |
Public vs Private Health Insurance Coverage by Age in Hampshire County
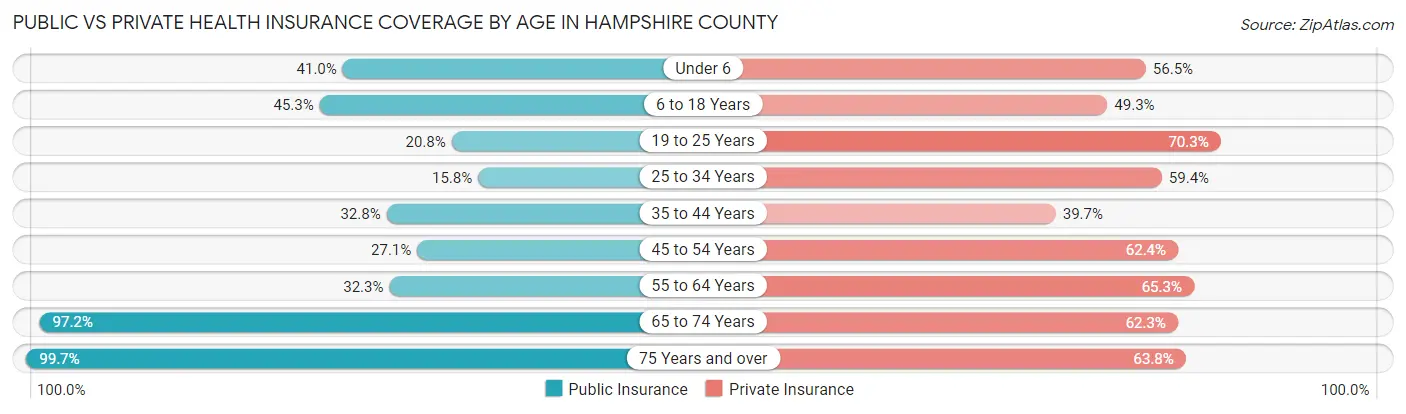
| Age Bracket | Public Insurance | Private Insurance |
| Under 6 | 540 (41.0%) | 744 (56.5%) |
| 6 to 18 Years | 1,589 (45.3%) | 1,731 (49.3%) |
| 19 to 25 Years | 222 (20.7%) | 752 (70.3%) |
| 25 to 34 Years | 346 (15.8%) | 1,299 (59.4%) |
| 35 to 44 Years | 787 (32.8%) | 952 (39.7%) |
| 45 to 54 Years | 895 (27.1%) | 2,057 (62.4%) |
| 55 to 64 Years | 1,187 (32.3%) | 2,400 (65.3%) |
| 65 to 74 Years | 3,139 (97.2%) | 2,013 (62.3%) |
| 75 Years and over | 2,085 (99.7%) | 1,335 (63.8%) |
| Total | 10,790 (47.4%) | 13,283 (58.3%) |
Disability Status by Sex by Age in Hampshire County
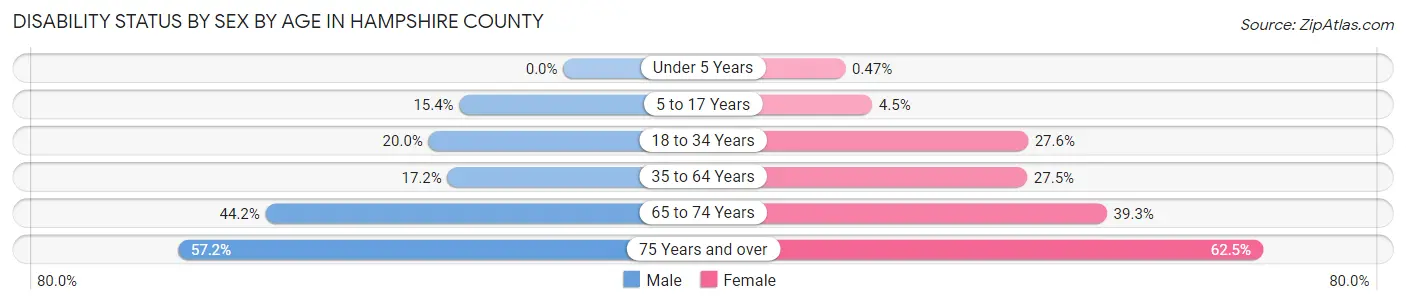
| Age Bracket | Male | Female |
| Under 5 Years | 0 (0.0%) | 3 (0.5%) |
| 5 to 17 Years | 260 (15.4%) | 68 (4.5%) |
| 18 to 34 Years | 386 (20.0%) | 498 (27.6%) |
| 35 to 64 Years | 825 (17.2%) | 1,257 (27.5%) |
| 65 to 74 Years | 744 (44.2%) | 608 (39.3%) |
| 75 Years and over | 585 (57.2%) | 669 (62.5%) |
Disability Class by Sex by Age in Hampshire County
Disability Class: Hearing Difficulty

| Age Bracket | Male | Female |
| Under 5 Years | 0 (0.0%) | 3 (0.5%) |
| 5 to 17 Years | 0 (0.0%) | 3 (0.2%) |
| 18 to 34 Years | 166 (8.6%) | 1 (0.1%) |
| 35 to 64 Years | 209 (4.4%) | 109 (2.4%) |
| 65 to 74 Years | 367 (21.8%) | 264 (17.1%) |
| 75 Years and over | 465 (45.5%) | 244 (22.8%) |
Disability Class: Vision Difficulty
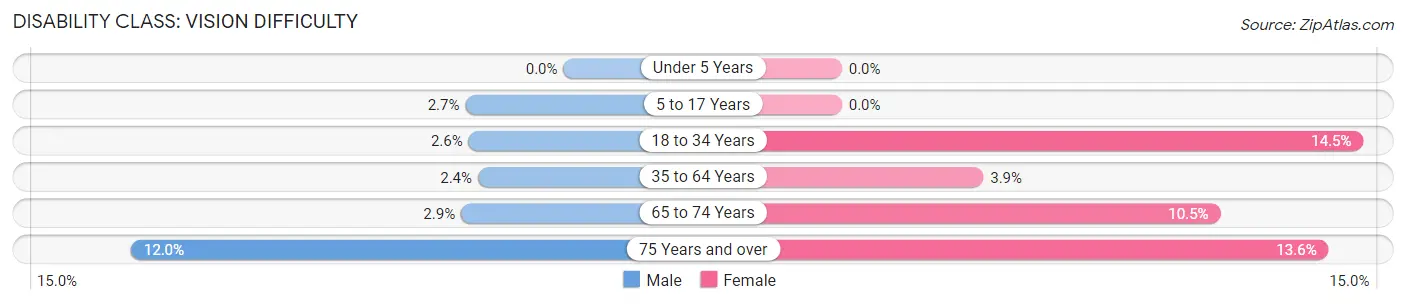
| Age Bracket | Male | Female |
| Under 5 Years | 0 (0.0%) | 0 (0.0%) |
| 5 to 17 Years | 46 (2.7%) | 0 (0.0%) |
| 18 to 34 Years | 51 (2.6%) | 262 (14.5%) |
| 35 to 64 Years | 114 (2.4%) | 180 (3.9%) |
| 65 to 74 Years | 48 (2.9%) | 163 (10.5%) |
| 75 Years and over | 123 (12.0%) | 145 (13.6%) |
Disability Class: Cognitive Difficulty
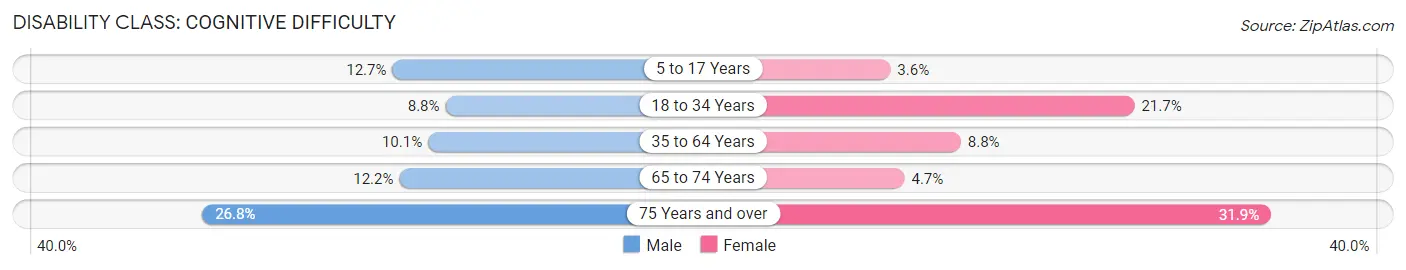
| Age Bracket | Male | Female |
| 5 to 17 Years | 214 (12.7%) | 55 (3.6%) |
| 18 to 34 Years | 169 (8.8%) | 392 (21.7%) |
| 35 to 64 Years | 482 (10.1%) | 404 (8.8%) |
| 65 to 74 Years | 205 (12.2%) | 72 (4.7%) |
| 75 Years and over | 274 (26.8%) | 341 (31.9%) |
Disability Class: Ambulatory Difficulty
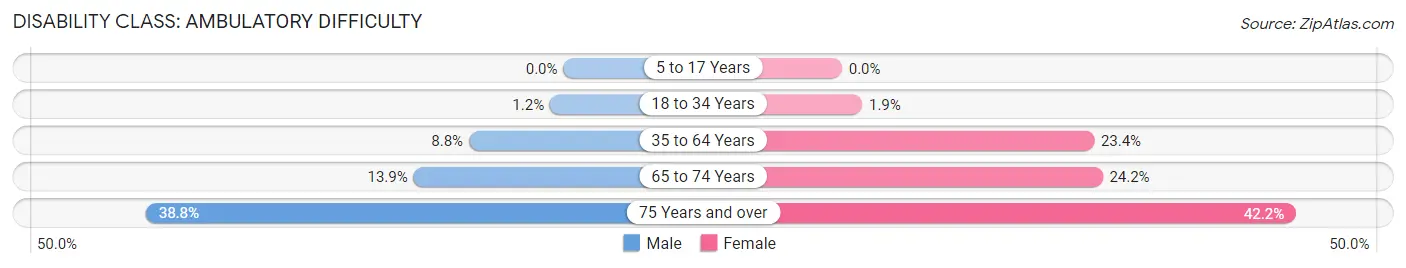
| Age Bracket | Male | Female |
| 5 to 17 Years | 0 (0.0%) | 0 (0.0%) |
| 18 to 34 Years | 24 (1.2%) | 34 (1.9%) |
| 35 to 64 Years | 420 (8.8%) | 1,070 (23.4%) |
| 65 to 74 Years | 234 (13.9%) | 374 (24.2%) |
| 75 Years and over | 396 (38.8%) | 451 (42.1%) |
Disability Class: Self-Care Difficulty
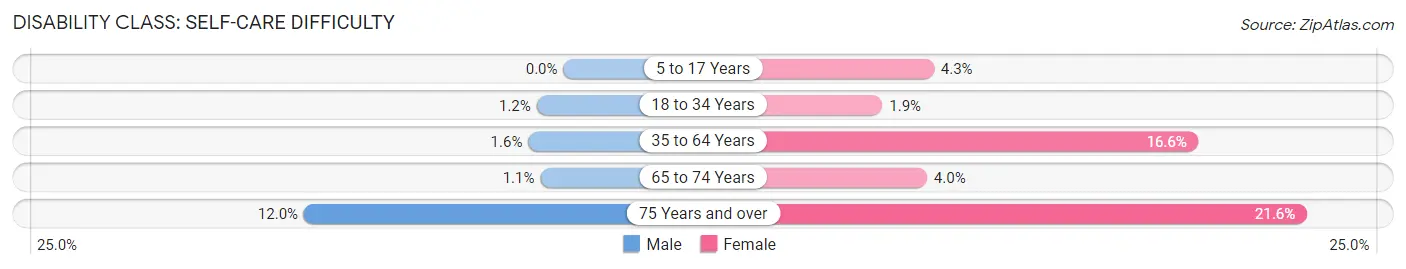
| Age Bracket | Male | Female |
| 5 to 17 Years | 0 (0.0%) | 65 (4.3%) |
| 18 to 34 Years | 24 (1.2%) | 34 (1.9%) |
| 35 to 64 Years | 78 (1.6%) | 757 (16.6%) |
| 65 to 74 Years | 18 (1.1%) | 61 (4.0%) |
| 75 Years and over | 123 (12.0%) | 231 (21.6%) |
Technology Access in Hampshire County
Computing Device Access in Hampshire County
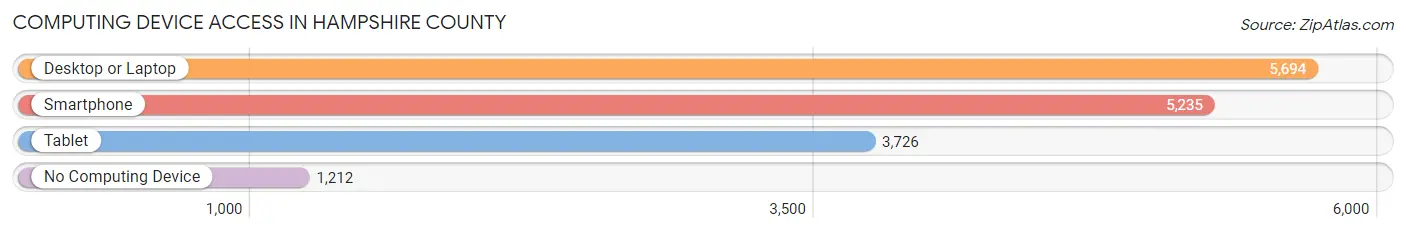
| Device Type | # Households | % Households |
| Desktop or Laptop | 5,694 | 70.6% |
| Smartphone | 5,235 | 64.9% |
| Tablet | 3,726 | 46.2% |
| No Computing Device | 1,212 | 15.0% |
| Total | 8,066 | 100.0% |
Internet Access in Hampshire County
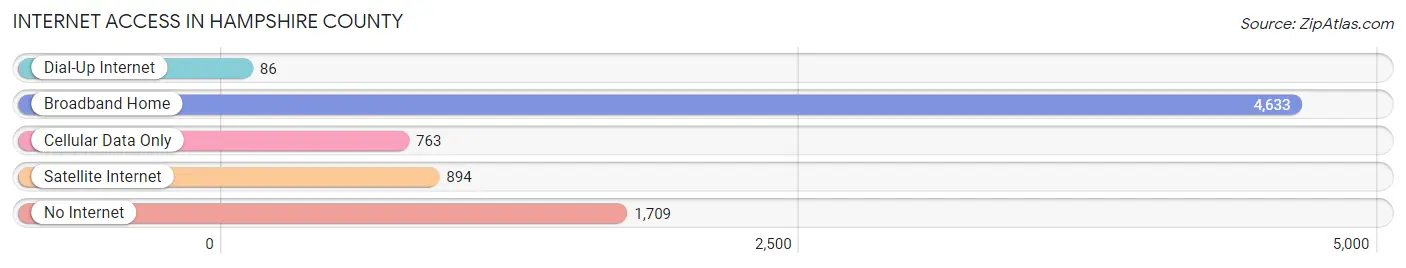
| Internet Type | # Households | % Households |
| Dial-Up Internet | 86 | 1.1% |
| Broadband Home | 4,633 | 57.4% |
| Cellular Data Only | 763 | 9.5% |
| Satellite Internet | 894 | 11.1% |
| No Internet | 1,709 | 21.2% |
| Total | 8,066 | 100.0% |
Hampshire County Summary
Hampshire County, West Virginia is located in the eastern panhandle of the state and is part of the Potomac Highlands region. It is bordered by Hardy County to the north, Mineral County to the east, Berkeley County to the south, and Morgan County to the west. The county seat is Romney, and the county was created in 1754 from parts of Frederick and Augusta counties in Virginia.
History
Hampshire County was established in 1754 from parts of Frederick and Augusta counties in Virginia. It was named for the English county of Hampshire, which was the birthplace of an early settler, Thomas Fairfax, 6th Lord Fairfax of Cameron. The county was part of the disputed territory between Virginia and Maryland, and the border was not settled until 1785.
During the American Civil War, Hampshire County was a major center of activity. It was the site of the Battle of Romney in 1861, and the county was occupied by Union forces for much of the war. After the war, the county was divided into two parts, with the northern part becoming Hardy County in 1866.
Geography
Hampshire County is located in the eastern panhandle of West Virginia, and is part of the Potomac Highlands region. It is bordered by Hardy County to the north, Mineral County to the east, Berkeley County to the south, and Morgan County to the west. The county has a total area of 517 square miles, of which 514 square miles is land and 3 square miles is water.
The county is mostly mountainous, with the highest point being North Mountain at 2,912 feet. The county is drained by the Cacapon and South Branch Potomac rivers. The county is home to several state parks, including Cacapon State Park, Lost River State Park, and South Branch State Park.
Economy
Hampshire County has a diverse economy, with the largest industries being manufacturing, health care, and retail trade. The county is home to several manufacturing companies, including a paper mill, a plastics plant, and a furniture factory. The county is also home to several health care facilities, including a hospital, a nursing home, and several medical clinics.
Retail trade is also an important part of the county’s economy, with several large stores located in the county seat of Romney. The county is also home to several small businesses, including restaurants, antique stores, and art galleries.
Demographics
As of the 2010 census, the population of Hampshire County was 23,964. The population density was 47 people per square mile. The racial makeup of the county was 95.3% White, 2.2% Black or African American, 0.3% Native American, 0.3% Asian, 0.1% Pacific Islander, 0.5% from other races, and 1.3% from two or more races.
The median income for a household in the county was $37,945, and the median income for a family was $45,945. The per capita income for the county was $19,845. About 11.3% of the population was below the poverty line.
Hampshire County is a rural county with a diverse economy and a rich history. It is home to several state parks, and is a popular destination for outdoor recreation. The county is also home to several small businesses, and is a great place to live and work.
Common Questions
What is the Total Population of Hampshire County?
Total Population of Hampshire County is 23,275.
What is the Total Male Population of Hampshire County?
Total Male Population of Hampshire County is 11,985.
What is the Total Female Population of Hampshire County?
Total Female Population of Hampshire County is 11,290.
What is the Ratio of Males per 100 Females in Hampshire County?
There are 106.16 Males per 100 Females in Hampshire County.
What is the Ratio of Females per 100 Males in Hampshire County?
There are 94.20 Females per 100 Males in Hampshire County.
What is the Median Population Age in Hampshire County?
Median Population Age in Hampshire County is 47.7 Years.
What is the Average Family Size in Hampshire County
Average Family Size in Hampshire County is 3.6 People.
What is the Average Household Size in Hampshire County
Average Household Size in Hampshire County is 2.8 People.
What is Per Capita Income in Hampshire County?
Per Capita income in Hampshire County is $28,713.
What is the Median Family Income in Hampshire County?
Median Family Income in Hampshire County is $68,312.
What is the Median Household income in Hampshire County?
Median Household Income in Hampshire County is $55,222.
What is Income or Wage Gap in Hampshire County?
Income or Wage Gap in Hampshire County is 34.3%.
Women in Hampshire County earn 65.7 cents for every dollar earned by a man.
What is Family Income Deficit in Hampshire County?
Family Income Deficit in Hampshire County is $7,612.
Families that are below poverty line in Hampshire County earn $7,612 less on average than the poverty threshold level.
What is Inequality or Gini Index in Hampshire County?
Inequality or Gini Index in Hampshire County is 0.43.
How Large is the Labor Force in Hampshire County?
There are 9,554 People in the Labor Forcein in Hampshire County.
What is the Percentage of People in the Labor Force in Hampshire County?
49.1% of People are in the Labor Force in Hampshire County.
What is the Unemployment Rate in Hampshire County?
Unemployment Rate in Hampshire County is 8.5%.