Greenbrier County, WV
Greenbrier County Map
Greenbrier County Overview
32,995
TOTAL POPULATION
16,010
MALE POPULATION
16,985
FEMALE POPULATION
94.26
MALES / 100 FEMALES
106.09
FEMALES / 100 MALES
46.6
MEDIAN AGE
2.8
AVG FAMILY SIZE
2.2
AVG HOUSEHOLD SIZE
$29,992
PER CAPITA INCOME
$61,170
AVG FAMILY INCOME
$45,519
AVG HOUSEHOLD INCOME
24.4%
WAGE / INCOME GAP [ % ]
75.6¢/ $1
WAGE / INCOME GAP [ $ ]
$9,319
FAMILY INCOME DEFICIT
0.49
INEQUALITY / GINI INDEX
14,027
LABOR FORCE [ PEOPLE ]
51.2%
PERCENT IN LABOR FORCE
4.3%
UNEMPLOYMENT RATE
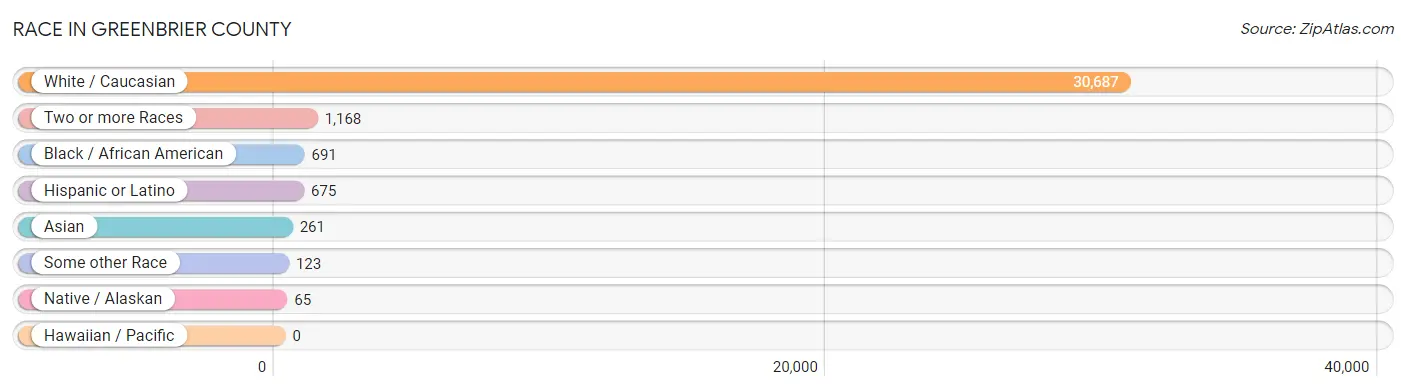
Race in Greenbrier County
The most populous races in Greenbrier County are White / Caucasian (30,687 | 93.0%), Two or more Races (1,168 | 3.5%), and Black / African American (691 | 2.1%).
| Race | # Population | % Population |
| Asian | 261 | 0.8% |
| Black / African American | 691 | 2.1% |
| Hawaiian / Pacific | 0 | 0.0% |
| Hispanic or Latino | 675 | 2.1% |
| Native / Alaskan | 65 | 0.2% |
| White / Caucasian | 30,687 | 93.0% |
| Two or more Races | 1,168 | 3.5% |
| Some other Race | 123 | 0.4% |
| Total | 32,995 | 100.0% |
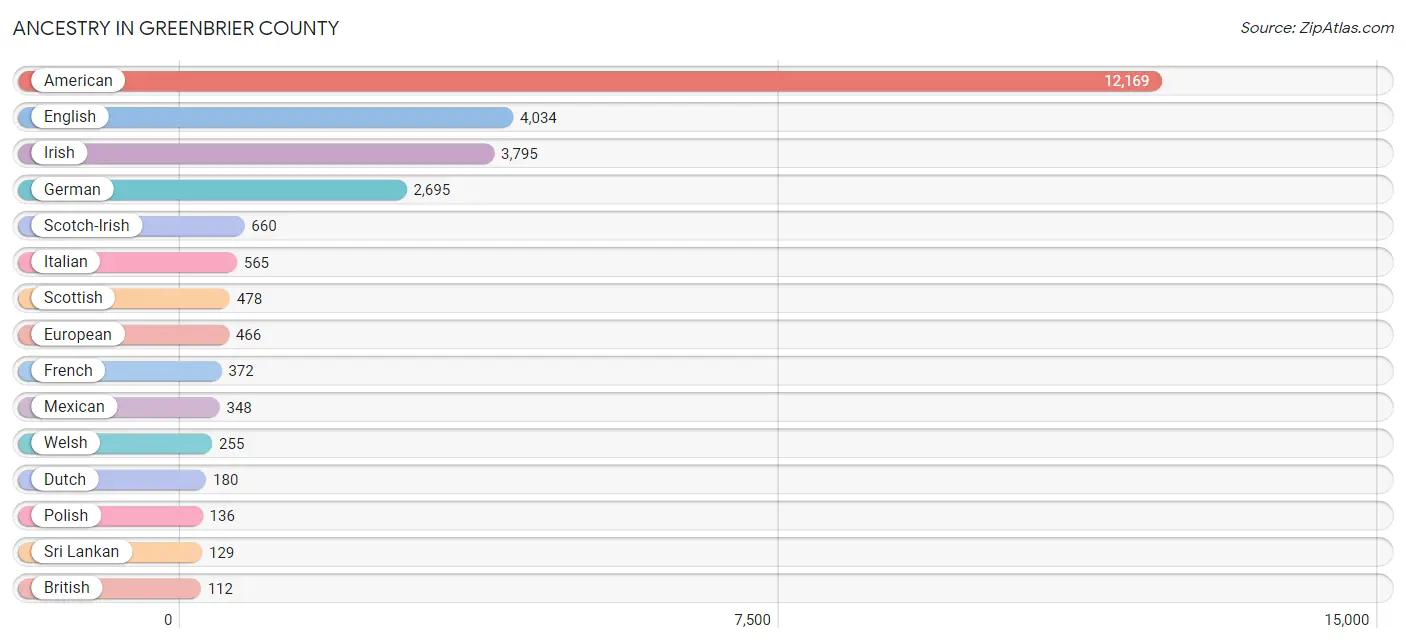
Ancestry in Greenbrier County
The most populous ancestries reported in Greenbrier County are American (12,169 | 36.9%), English (4,034 | 12.2%), Irish (3,795 | 11.5%), German (2,695 | 8.2%), and Scotch-Irish (660 | 2.0%), together accounting for 70.8% of all Greenbrier County residents.
| Ancestry | # Population | % Population |
| African | 79 | 0.2% |
| Albanian | 4 | 0.0% |
| American | 12,169 | 36.9% |
| Arab | 52 | 0.2% |
| Assyrian / Chaldean / Syriac | 18 | 0.1% |
| Bhutanese | 25 | 0.1% |
| Blackfeet | 27 | 0.1% |
| British | 112 | 0.3% |
| British West Indian | 6 | 0.0% |
| Burmese | 8 | 0.0% |
| Central American | 36 | 0.1% |
| Cherokee | 78 | 0.2% |
| Chilean | 106 | 0.3% |
| Croatian | 42 | 0.1% |
| Czech | 62 | 0.2% |
| Czechoslovakian | 18 | 0.1% |
| Danish | 5 | 0.0% |
| Dominican | 39 | 0.1% |
| Dutch | 180 | 0.5% |
| Eastern European | 9 | 0.0% |
| Egyptian | 37 | 0.1% |
| English | 4,034 | 12.2% |
| European | 466 | 1.4% |
| French | 372 | 1.1% |
| German | 2,695 | 8.2% |
| German Russian | 3 | 0.0% |
| Greek | 19 | 0.1% |
| Guamanian / Chamorro | 24 | 0.1% |
| Guatemalan | 17 | 0.1% |
| Hungarian | 68 | 0.2% |
| Indian (Asian) | 65 | 0.2% |
| Iranian | 17 | 0.1% |
| Irish | 3,795 | 11.5% |
| Italian | 565 | 1.7% |
| Jamaican | 3 | 0.0% |
| Korean | 102 | 0.3% |
| Lebanese | 15 | 0.1% |
| Lithuanian | 20 | 0.1% |
| Mexican | 348 | 1.1% |
| Northern European | 34 | 0.1% |
| Norwegian | 36 | 0.1% |
| Pakistani | 1 | 0.0% |
| Polish | 136 | 0.4% |
| Puerto Rican | 74 | 0.2% |
| Romanian | 27 | 0.1% |
| Russian | 34 | 0.1% |
| Salvadoran | 19 | 0.1% |
| Scandinavian | 12 | 0.0% |
| Scotch-Irish | 660 | 2.0% |
| Scottish | 478 | 1.5% |
| South American | 106 | 0.3% |
| Spaniard | 67 | 0.2% |
| Sri Lankan | 129 | 0.4% |
| Subsaharan African | 79 | 0.2% |
| Swedish | 92 | 0.3% |
| Swiss | 3 | 0.0% |
| Thai | 26 | 0.1% |
| Turkish | 5 | 0.0% |
| Ukrainian | 32 | 0.1% |
| Welsh | 255 | 0.8% | View All 60 Rows |
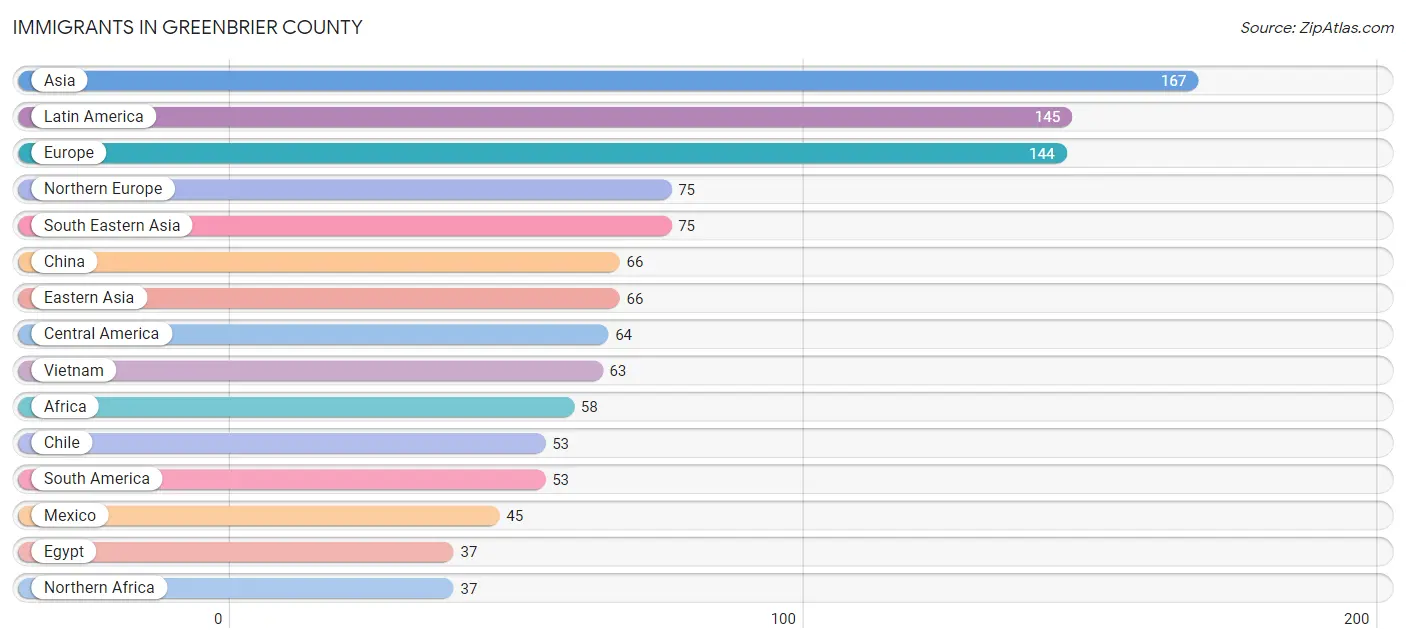
Immigrants in Greenbrier County
The most numerous immigrant groups reported in Greenbrier County came from Asia (167 | 0.5%), Latin America (145 | 0.4%), Europe (144 | 0.4%), Northern Europe (75 | 0.2%), and South Eastern Asia (75 | 0.2%), together accounting for 1.9% of all Greenbrier County residents.
| Immigration Origin | # Population | % Population |
| Africa | 58 | 0.2% |
| Asia | 167 | 0.5% |
| Austria | 16 | 0.1% |
| Canada | 10 | 0.0% |
| Caribbean | 28 | 0.1% |
| Central America | 64 | 0.2% |
| Chile | 53 | 0.2% |
| China | 66 | 0.2% |
| Dominican Republic | 18 | 0.1% |
| Eastern Asia | 66 | 0.2% |
| Eastern Europe | 25 | 0.1% |
| Egypt | 37 | 0.1% |
| El Salvador | 19 | 0.1% |
| England | 22 | 0.1% |
| Europe | 144 | 0.4% |
| Germany | 13 | 0.0% |
| India | 26 | 0.1% |
| Jamaica | 4 | 0.0% |
| Latin America | 145 | 0.4% |
| Mexico | 45 | 0.1% |
| Nigeria | 12 | 0.0% |
| Northern Africa | 37 | 0.1% |
| Northern Europe | 75 | 0.2% |
| Philippines | 12 | 0.0% |
| Russia | 25 | 0.1% |
| South America | 53 | 0.2% |
| South Central Asia | 26 | 0.1% |
| South Eastern Asia | 75 | 0.2% |
| Southern Europe | 15 | 0.1% |
| Spain | 15 | 0.1% |
| St. Vincent and the Grenadines | 6 | 0.0% |
| Taiwan | 1 | 0.0% |
| Vietnam | 63 | 0.2% |
| Western Africa | 12 | 0.0% |
| Western Europe | 29 | 0.1% | View All 35 Rows |
Sex and Age in Greenbrier County
Sex and Age in Greenbrier County
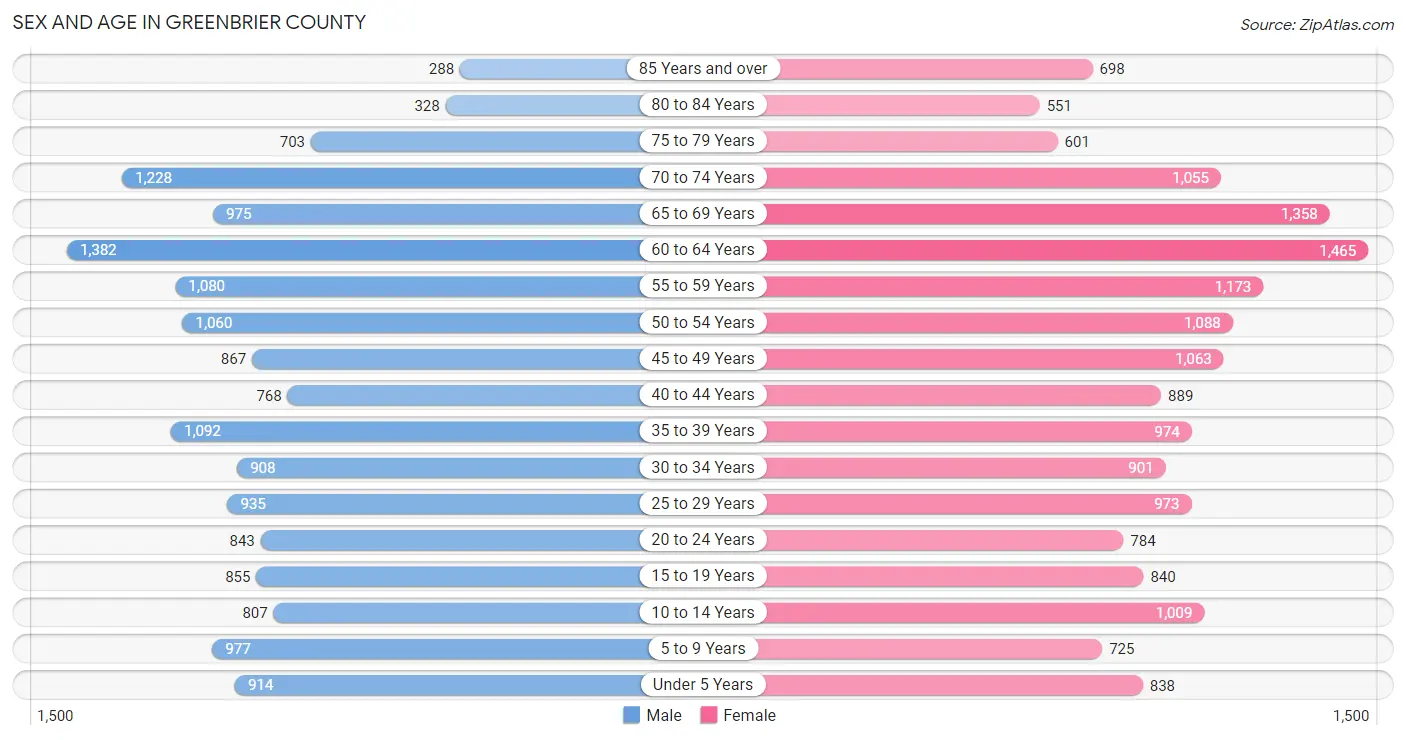
The most populous age groups in Greenbrier County are 60 to 64 Years (1,382 | 8.6%) for men and 60 to 64 Years (1,465 | 8.6%) for women.
| Age Bracket | Male | Female |
| Under 5 Years | 914 (5.7%) | 838 (4.9%) |
| 5 to 9 Years | 977 (6.1%) | 725 (4.3%) |
| 10 to 14 Years | 807 (5.0%) | 1,009 (5.9%) |
| 15 to 19 Years | 855 (5.3%) | 840 (5.0%) |
| 20 to 24 Years | 843 (5.3%) | 784 (4.6%) |
| 25 to 29 Years | 935 (5.8%) | 973 (5.7%) |
| 30 to 34 Years | 908 (5.7%) | 901 (5.3%) |
| 35 to 39 Years | 1,092 (6.8%) | 974 (5.7%) |
| 40 to 44 Years | 768 (4.8%) | 889 (5.2%) |
| 45 to 49 Years | 867 (5.4%) | 1,063 (6.3%) |
| 50 to 54 Years | 1,060 (6.6%) | 1,088 (6.4%) |
| 55 to 59 Years | 1,080 (6.8%) | 1,173 (6.9%) |
| 60 to 64 Years | 1,382 (8.6%) | 1,465 (8.6%) |
| 65 to 69 Years | 975 (6.1%) | 1,358 (8.0%) |
| 70 to 74 Years | 1,228 (7.7%) | 1,055 (6.2%) |
| 75 to 79 Years | 703 (4.4%) | 601 (3.5%) |
| 80 to 84 Years | 328 (2.1%) | 551 (3.2%) |
| 85 Years and over | 288 (1.8%) | 698 (4.1%) |
| Total | 16,010 (100.0%) | 16,985 (100.0%) |
Families and Households in Greenbrier County
Median Family Size in Greenbrier County
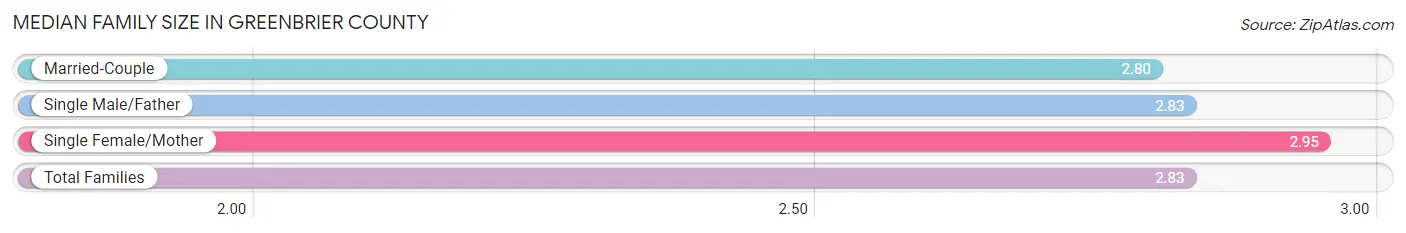
The median family size in Greenbrier County is 2.83 persons per family, with single female/mother families (1,574 | 18.6%) accounting for the largest median family size of 2.95 persons per family. On the other hand, married-couple families (6,276 | 74.1%) represent the smallest median family size with 2.80 persons per family.
| Family Type | # Families | Family Size |
| Married-Couple | 6,276 (74.1%) | 2.80 |
| Single Male/Father | 618 (7.3%) | 2.83 |
| Single Female/Mother | 1,574 (18.6%) | 2.95 |
| Total Families | 8,468 (100.0%) | 2.83 |
Median Household Size in Greenbrier County
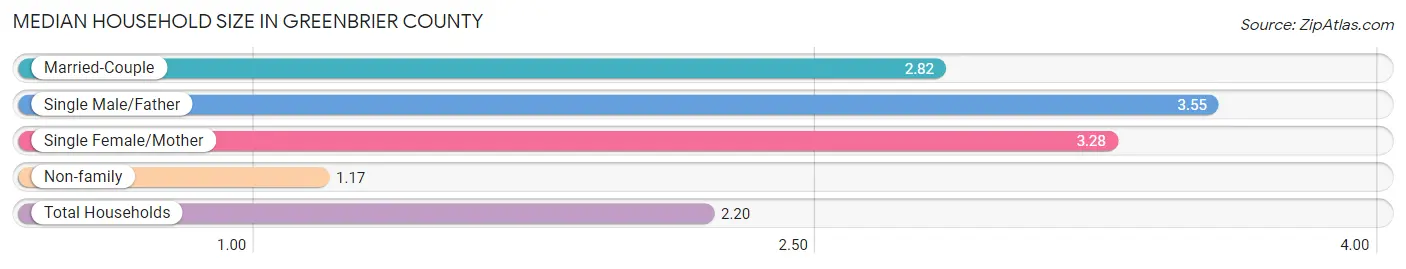
The median household size in Greenbrier County is 2.20 persons per household, with single male/father households (618 | 4.2%) accounting for the largest median household size of 3.55 persons per household. non-family households (6,256 | 42.5%) represent the smallest median household size with 1.17 persons per household.
| Household Type | # Households | Household Size |
| Married-Couple | 6,276 (42.6%) | 2.82 |
| Single Male/Father | 618 (4.2%) | 3.55 |
| Single Female/Mother | 1,574 (10.7%) | 3.28 |
| Non-family | 6,256 (42.5%) | 1.17 |
| Total Households | 14,724 (100.0%) | 2.20 |
Household Size by Marriage Status in Greenbrier County
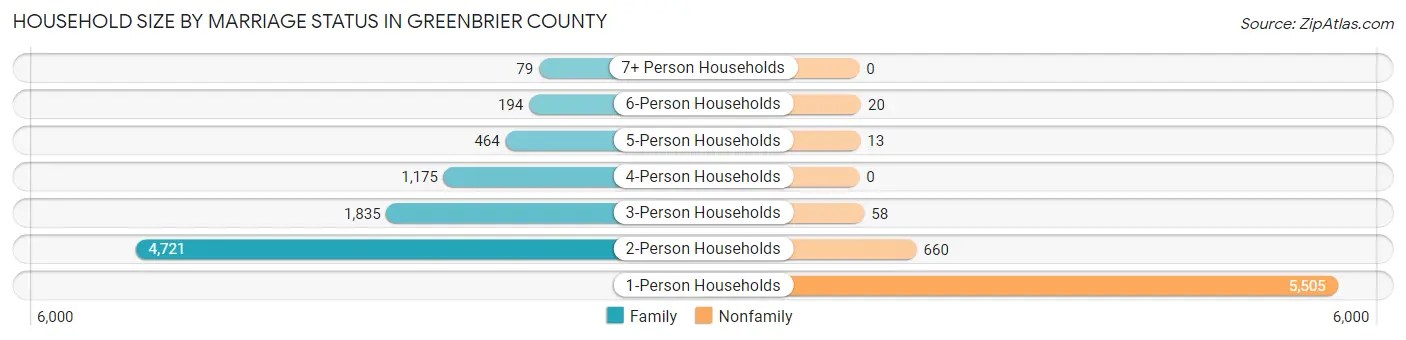
Out of a total of 14,724 households in Greenbrier County, 8,468 (57.5%) are family households, while 6,256 (42.5%) are nonfamily households. The most numerous type of family households are 2-person households, comprising 4,721, and the most common type of nonfamily households are 1-person households, comprising 5,505.
| Household Size | Family Households | Nonfamily Households |
| 1-Person Households | - | 5,505 (37.4%) |
| 2-Person Households | 4,721 (32.1%) | 660 (4.5%) |
| 3-Person Households | 1,835 (12.5%) | 58 (0.4%) |
| 4-Person Households | 1,175 (8.0%) | 0 (0.0%) |
| 5-Person Households | 464 (3.2%) | 13 (0.1%) |
| 6-Person Households | 194 (1.3%) | 20 (0.1%) |
| 7+ Person Households | 79 (0.5%) | 0 (0.0%) |
| Total | 8,468 (57.5%) | 6,256 (42.5%) |
Female Fertility in Greenbrier County
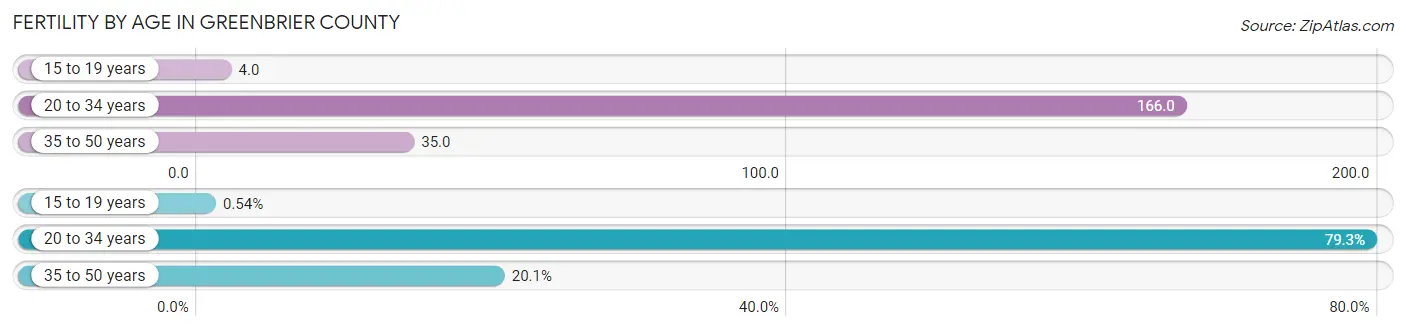
Fertility by Age in Greenbrier County
Average fertility rate in Greenbrier County is 83.0 births per 1,000 women. Women in the age bracket of 20 to 34 years have the highest fertility rate with 166.0 births per 1,000 women. Women in the age bracket of 20 to 34 years acount for 79.3% of all women with births.
| Age Bracket | Women with Births | Births / 1,000 Women |
| 15 to 19 years | 3 (0.5%) | 4.0 |
| 20 to 34 years | 441 (79.3%) | 166.0 |
| 35 to 50 years | 112 (20.1%) | 35.0 |
| Total | 556 (100.0%) | 83.0 |
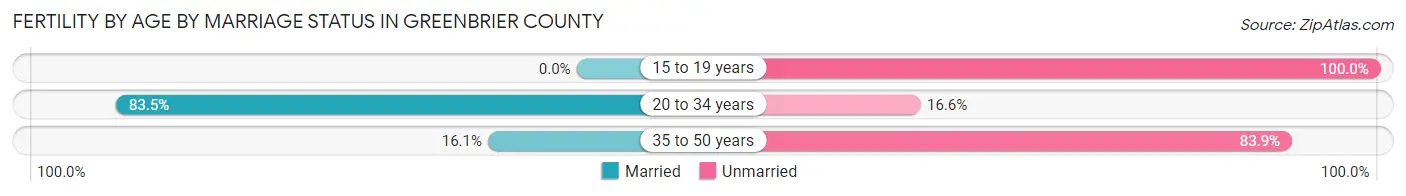
Fertility by Age by Marriage Status in Greenbrier County
69.4% of women with births (556) in Greenbrier County are married. The highest percentage of unmarried women with births falls into 15 to 19 years age bracket with 100.0% of them unmarried at the time of birth, while the lowest percentage of unmarried women with births belong to 20 to 34 years age bracket with 16.5% of them unmarried.
| Age Bracket | Married | Unmarried |
| 15 to 19 years | 0 (0.0%) | 3 (100.0%) |
| 20 to 34 years | 368 (83.5%) | 73 (16.6%) |
| 35 to 50 years | 18 (16.1%) | 94 (83.9%) |
| Total | 386 (69.4%) | 170 (30.6%) |
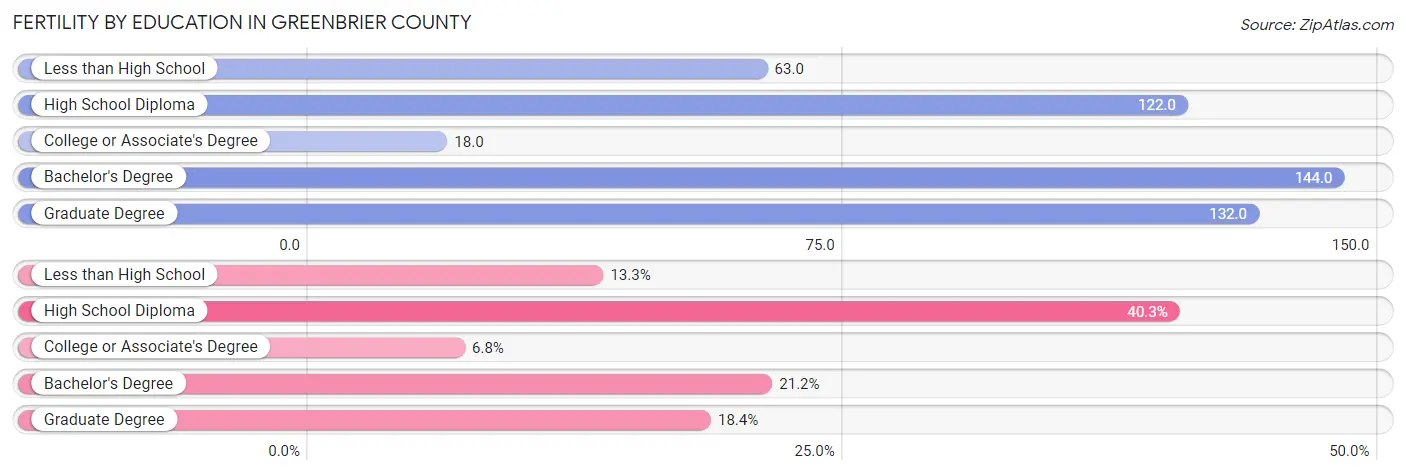
Fertility by Education in Greenbrier County
Average fertility rate in Greenbrier County is 83.0 births per 1,000 women. Women with the education attainment of bachelor's degree have the highest fertility rate of 144.0 births per 1,000 women, while women with the education attainment of college or associate's degree have the lowest fertility at 18.0 births per 1,000 women. Women with the education attainment of high school diploma represent 40.3% of all women with births.
| Educational Attainment | Women with Births | Births / 1,000 Women |
| Less than High School | 74 (13.3%) | 63.0 |
| High School Diploma | 224 (40.3%) | 122.0 |
| College or Associate's Degree | 38 (6.8%) | 18.0 |
| Bachelor's Degree | 118 (21.2%) | 144.0 |
| Graduate Degree | 102 (18.3%) | 132.0 |
| Total | 556 (100.0%) | 83.0 |
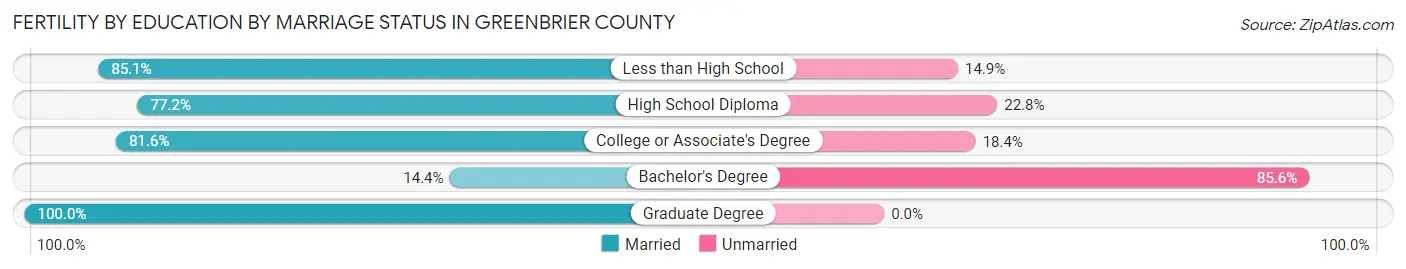
Fertility by Education by Marriage Status in Greenbrier County
30.6% of women with births in Greenbrier County are unmarried. Women with the educational attainment of graduate degree are most likely to be married with 100.0% of them married at childbirth, while women with the educational attainment of bachelor's degree are least likely to be married with 85.6% of them unmarried at childbirth.
| Educational Attainment | Married | Unmarried |
| Less than High School | 63 (85.1%) | 11 (14.9%) |
| High School Diploma | 173 (77.2%) | 51 (22.8%) |
| College or Associate's Degree | 31 (81.6%) | 7 (18.4%) |
| Bachelor's Degree | 17 (14.4%) | 101 (85.6%) |
| Graduate Degree | 102 (100.0%) | 0 (0.0%) |
| Total | 386 (69.4%) | 170 (30.6%) |
Income in Greenbrier County
Income Overview in Greenbrier County
Per Capita Income in Greenbrier County is $29,992, while median incomes of families and households are $61,170 and $45,519 respectively.
| Characteristic | Number | Measure |
| Per Capita Income | 32,995 | $29,992 |
| Median Family Income | 8,468 | $61,170 |
| Mean Family Income | 8,468 | $79,439 |
| Median Household Income | 14,724 | $45,519 |
| Mean Household Income | 14,724 | $66,046 |
| Income Deficit | 8,468 | $9,319 |
| Wage / Income Gap (%) | 32,995 | 24.39% |
| Wage / Income Gap ($) | 32,995 | 75.61¢ per $1 |
| Gini / Inequality Index | 32,995 | 0.49 |
Earnings by Sex in Greenbrier County
Average Earnings in Greenbrier County are $31,646, $36,321 for men and $27,461 for women, a difference of 24.4%.
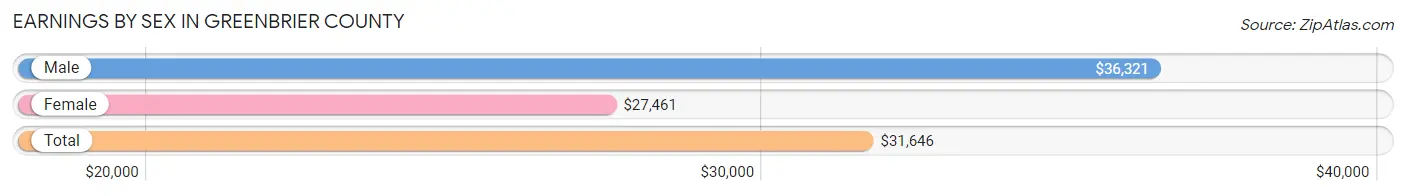
| Sex | Number | Average Earnings |
| Male | 7,698 (52.2%) | $36,321 |
| Female | 7,055 (47.8%) | $27,461 |
| Total | 14,753 (100.0%) | $31,646 |
Earnings by Sex by Income Bracket in Greenbrier County
The most common earnings brackets in Greenbrier County are $35,000 to $39,999 for men (692 | 9.0%) and $25,000 to $29,999 for women (697 | 9.9%).
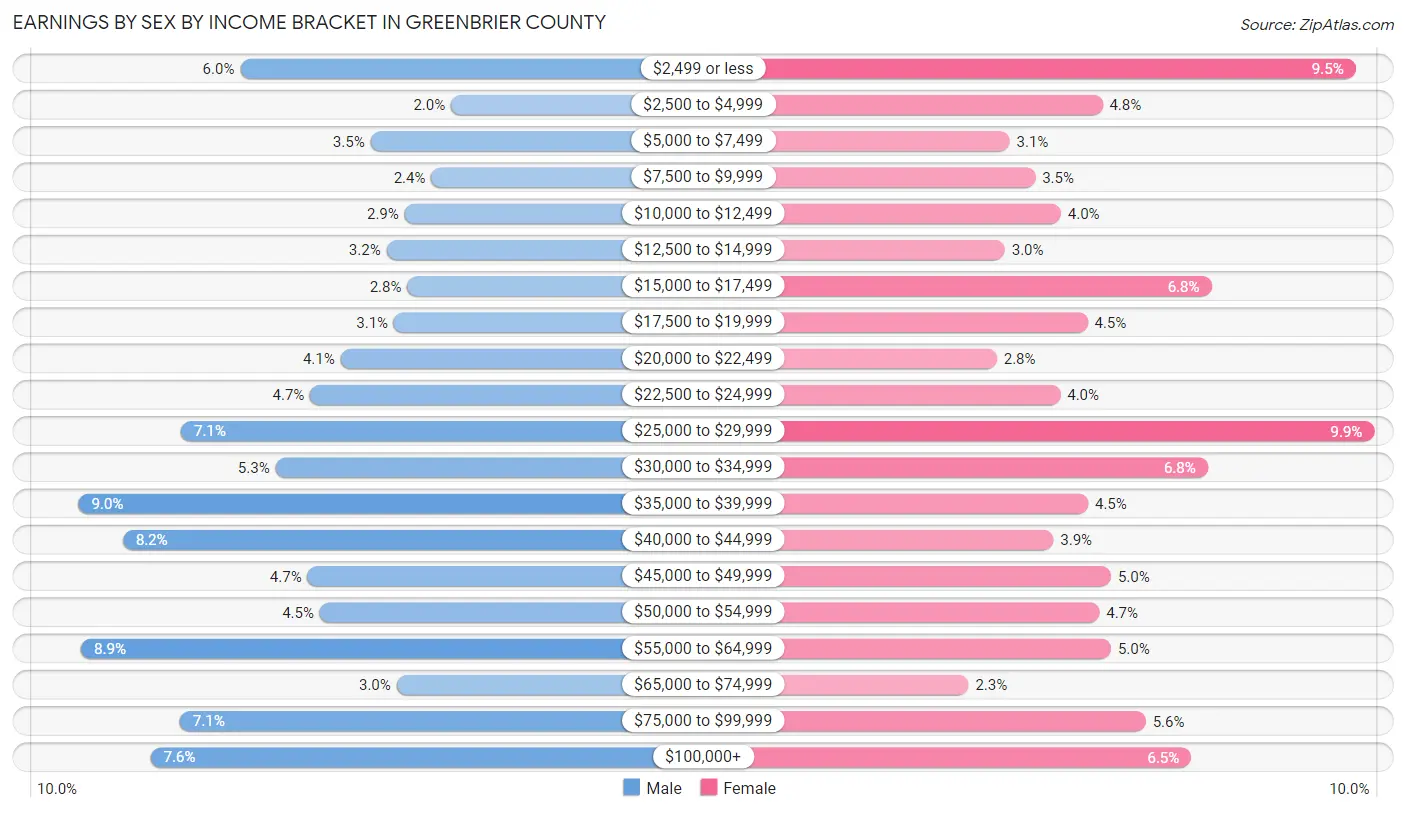
| Income | Male | Female |
| $2,499 or less | 459 (6.0%) | 672 (9.5%) |
| $2,500 to $4,999 | 155 (2.0%) | 338 (4.8%) |
| $5,000 to $7,499 | 271 (3.5%) | 215 (3.0%) |
| $7,500 to $9,999 | 183 (2.4%) | 249 (3.5%) |
| $10,000 to $12,499 | 222 (2.9%) | 283 (4.0%) |
| $12,500 to $14,999 | 248 (3.2%) | 209 (3.0%) |
| $15,000 to $17,499 | 218 (2.8%) | 482 (6.8%) |
| $17,500 to $19,999 | 237 (3.1%) | 318 (4.5%) |
| $20,000 to $22,499 | 314 (4.1%) | 198 (2.8%) |
| $22,500 to $24,999 | 358 (4.6%) | 282 (4.0%) |
| $25,000 to $29,999 | 544 (7.1%) | 697 (9.9%) |
| $30,000 to $34,999 | 408 (5.3%) | 477 (6.8%) |
| $35,000 to $39,999 | 692 (9.0%) | 319 (4.5%) |
| $40,000 to $44,999 | 628 (8.2%) | 273 (3.9%) |
| $45,000 to $49,999 | 362 (4.7%) | 349 (5.0%) |
| $50,000 to $54,999 | 344 (4.5%) | 334 (4.7%) |
| $55,000 to $64,999 | 688 (8.9%) | 349 (5.0%) |
| $65,000 to $74,999 | 233 (3.0%) | 161 (2.3%) |
| $75,000 to $99,999 | 546 (7.1%) | 395 (5.6%) |
| $100,000+ | 588 (7.6%) | 455 (6.5%) |
| Total | 7,698 (100.0%) | 7,055 (100.0%) |
Earnings by Sex by Educational Attainment in Greenbrier County
Average earnings in Greenbrier County are $38,864 for men and $29,678 for women, a difference of 23.6%. Men with an educational attainment of graduate degree enjoy the highest average annual earnings of $106,146, while those with less than high school education earn the least with $19,447. Women with an educational attainment of graduate degree earn the most with the average annual earnings of $66,724, while those with high school diploma education have the smallest earnings of $23,611.
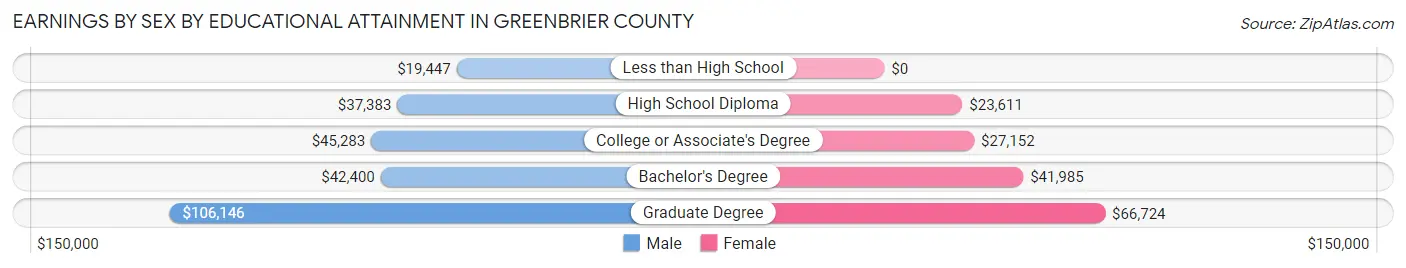
| Educational Attainment | Male Income | Female Income |
| Less than High School | $19,447 | $0 |
| High School Diploma | $37,383 | $23,611 |
| College or Associate's Degree | $45,283 | $27,152 |
| Bachelor's Degree | $42,400 | $41,985 |
| Graduate Degree | $106,146 | $66,724 |
| Total | $38,864 | $29,678 |
Family Income in Greenbrier County
Family Income Brackets in Greenbrier County
According to the Greenbrier County family income data, there are 1,643 families falling into the $50,000 to $74,999 income range, which is the most common income bracket and makes up 19.4% of all families. Conversely, the less than $10,000 income bracket is the least frequent group with only 271 families (3.2%) belonging to this category.
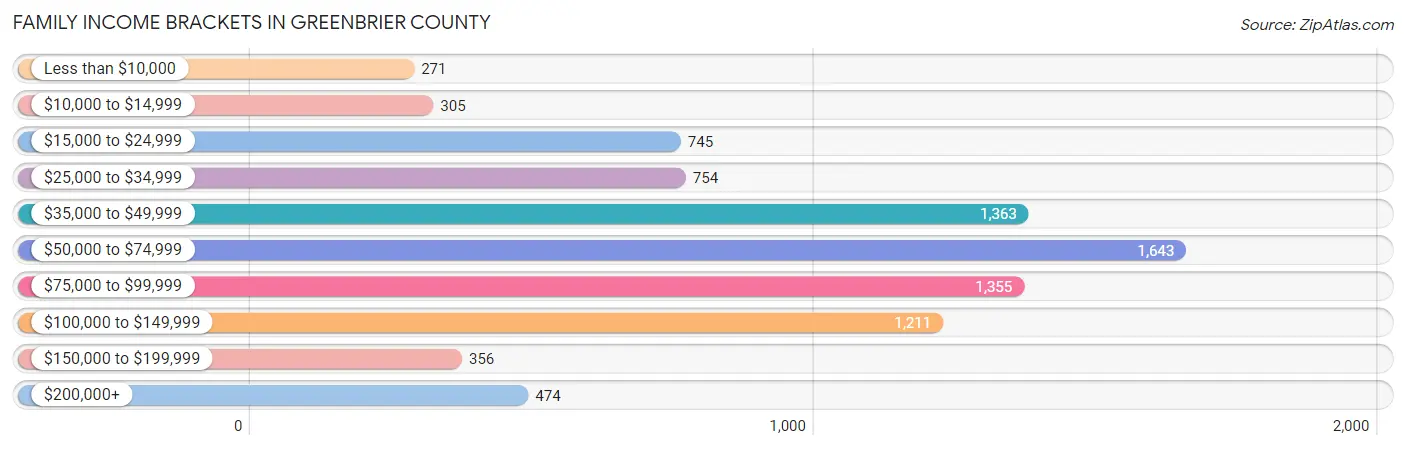
| Income Bracket | # Families | % Families |
| Less than $10,000 | 271 | 3.2% |
| $10,000 to $14,999 | 305 | 3.6% |
| $15,000 to $24,999 | 745 | 8.8% |
| $25,000 to $34,999 | 754 | 8.9% |
| $35,000 to $49,999 | 1,363 | 16.1% |
| $50,000 to $74,999 | 1,643 | 19.4% |
| $75,000 to $99,999 | 1,355 | 16.0% |
| $100,000 to $149,999 | 1,211 | 14.3% |
| $150,000 to $199,999 | 356 | 4.2% |
| $200,000+ | 474 | 5.6% |
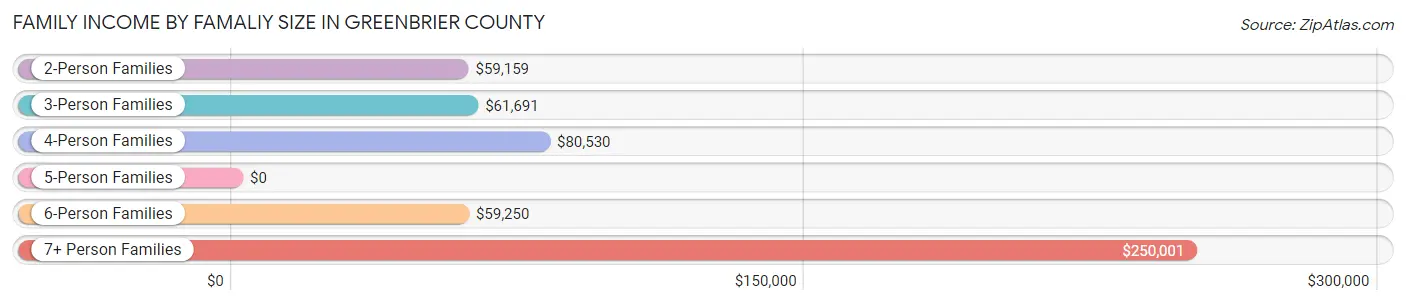
Family Income by Famaliy Size in Greenbrier County
7+ person families (40 | 0.5%) account for the highest median family income in Greenbrier County with $250,001 per family, while 7+ person families (40 | 0.5%) have the highest median income of $35,714 per family member.
| Income Bracket | # Families | Median Income |
| 2-Person Families | 4,982 (58.8%) | $59,159 |
| 3-Person Families | 1,803 (21.3%) | $61,691 |
| 4-Person Families | 1,209 (14.3%) | $80,530 |
| 5-Person Families | 277 (3.3%) | $0 |
| 6-Person Families | 157 (1.8%) | $59,250 |
| 7+ Person Families | 40 (0.5%) | $250,001 |
| Total | 8,468 (100.0%) | $61,170 |
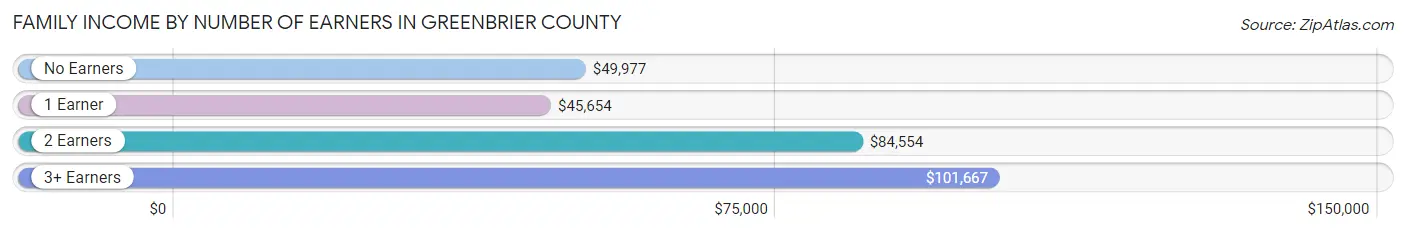
Family Income by Number of Earners in Greenbrier County
The median family income in Greenbrier County is $61,170, with families comprising 3+ earners (374) having the highest median family income of $101,667, while families with 1 earner (2,821) have the lowest median family income of $45,654, accounting for 4.4% and 33.3% of families, respectively.
| Number of Earners | # Families | Median Income |
| No Earners | 1,895 (22.4%) | $49,977 |
| 1 Earner | 2,821 (33.3%) | $45,654 |
| 2 Earners | 3,378 (39.9%) | $84,554 |
| 3+ Earners | 374 (4.4%) | $101,667 |
| Total | 8,468 (100.0%) | $61,170 |
Household Income in Greenbrier County
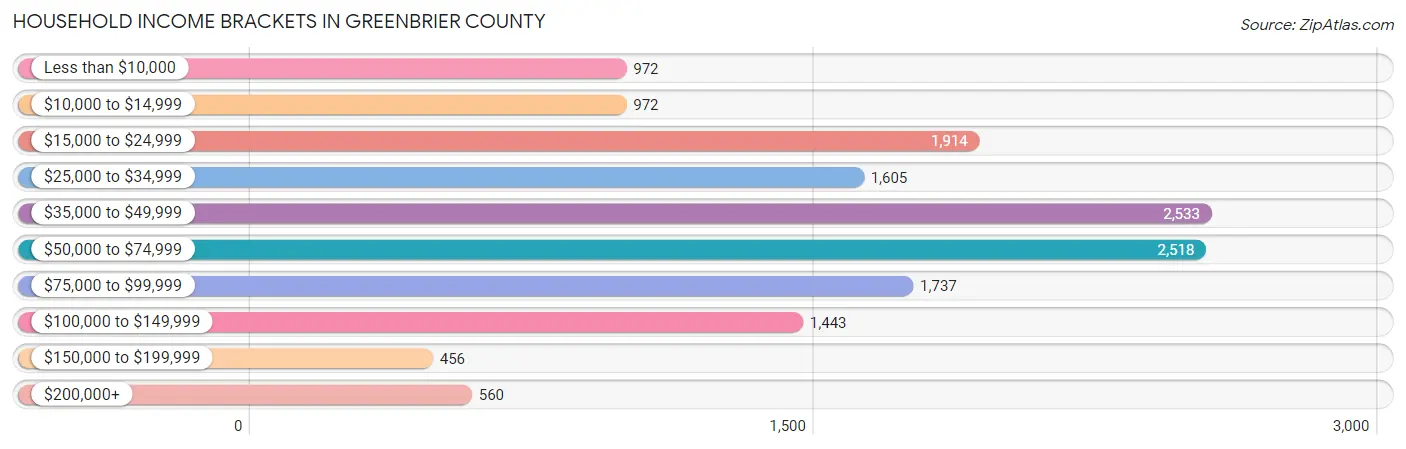
Household Income Brackets in Greenbrier County
With 2,533 households falling in the category, the $35,000 to $49,999 income range is the most frequent in Greenbrier County, accounting for 17.2% of all households. In contrast, only 456 households (3.1%) fall into the $150,000 to $199,999 income bracket, making it the least populous group.
| Income Bracket | # Households | % Households |
| Less than $10,000 | 972 | 6.6% |
| $10,000 to $14,999 | 972 | 6.6% |
| $15,000 to $24,999 | 1,914 | 13.0% |
| $25,000 to $34,999 | 1,605 | 10.9% |
| $35,000 to $49,999 | 2,533 | 17.2% |
| $50,000 to $74,999 | 2,518 | 17.1% |
| $75,000 to $99,999 | 1,737 | 11.8% |
| $100,000 to $149,999 | 1,443 | 9.8% |
| $150,000 to $199,999 | 456 | 3.1% |
| $200,000+ | 560 | 3.8% |
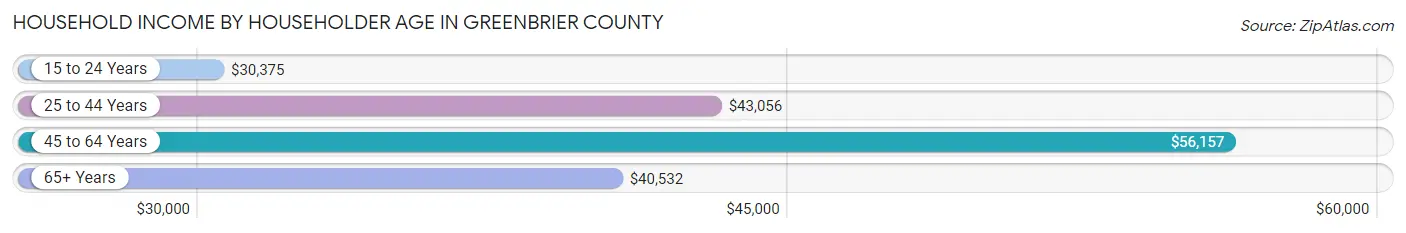
Household Income by Householder Age in Greenbrier County
The median household income in Greenbrier County is $45,519, with the highest median household income of $56,157 found in the 45 to 64 years age bracket for the primary householder. A total of 5,149 households (35.0%) fall into this category. Meanwhile, the 15 to 24 years age bracket for the primary householder has the lowest median household income of $30,375, with 572 households (3.9%) in this group.
| Income Bracket | # Households | Median Income |
| 15 to 24 Years | 572 (3.9%) | $30,375 |
| 25 to 44 Years | 3,494 (23.7%) | $43,056 |
| 45 to 64 Years | 5,149 (35.0%) | $56,157 |
| 65+ Years | 5,509 (37.4%) | $40,532 |
| Total | 14,724 (100.0%) | $45,519 |
Poverty in Greenbrier County
Income Below Poverty by Sex and Age in Greenbrier County
With 17.5% poverty level for males and 22.4% for females among the residents of Greenbrier County, 12 to 14 year old males and 18 to 24 year old females are the most vulnerable to poverty, with 171 males (42.9%) and 657 females (62.9%) in their respective age groups living below the poverty level.
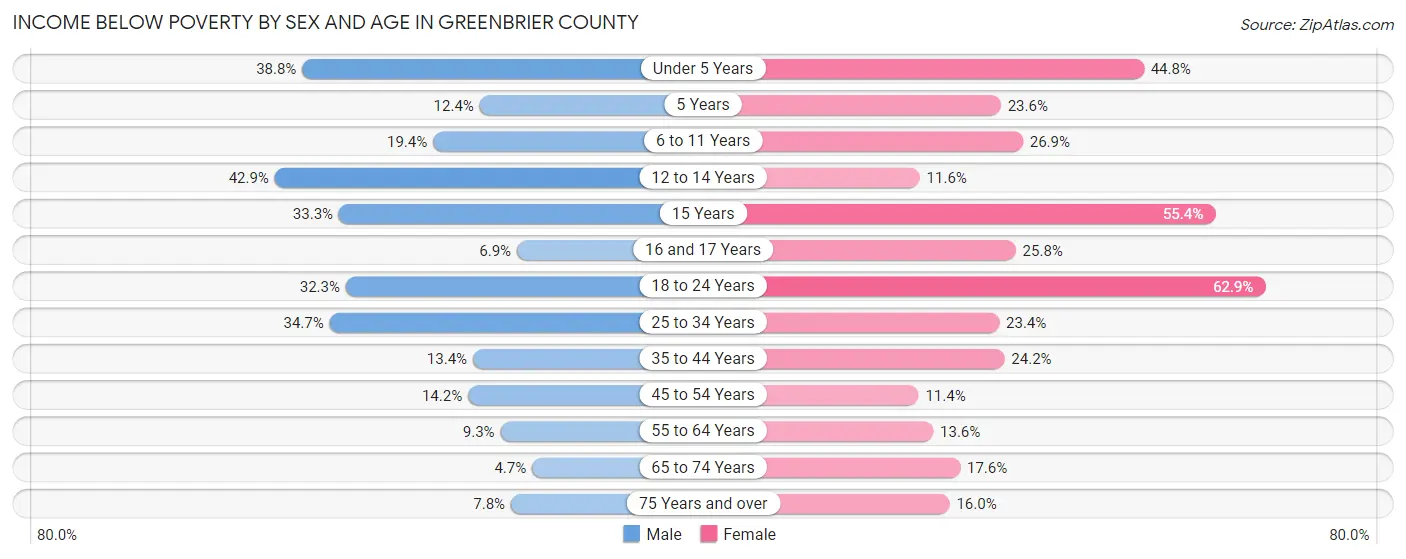
| Age Bracket | Male | Female |
| Under 5 Years | 337 (38.8%) | 325 (44.8%) |
| 5 Years | 22 (12.4%) | 42 (23.6%) |
| 6 to 11 Years | 219 (19.4%) | 222 (26.9%) |
| 12 to 14 Years | 171 (42.9%) | 80 (11.6%) |
| 15 Years | 29 (33.3%) | 128 (55.4%) |
| 16 and 17 Years | 29 (6.9%) | 87 (25.8%) |
| 18 to 24 Years | 365 (32.3%) | 657 (62.9%) |
| 25 to 34 Years | 616 (34.7%) | 434 (23.4%) |
| 35 to 44 Years | 238 (13.4%) | 450 (24.1%) |
| 45 to 54 Years | 267 (14.2%) | 245 (11.4%) |
| 55 to 64 Years | 229 (9.3%) | 348 (13.6%) |
| 65 to 74 Years | 101 (4.6%) | 414 (17.6%) |
| 75 Years and over | 101 (7.8%) | 278 (16.0%) |
| Total | 2,724 (17.5%) | 3,710 (22.4%) |
Income Above Poverty by Sex and Age in Greenbrier County
According to the poverty statistics in Greenbrier County, males aged 65 to 74 years and females aged 45 to 54 years are the age groups that are most secure financially, with 95.4% of males and 88.6% of females in these age groups living above the poverty line.
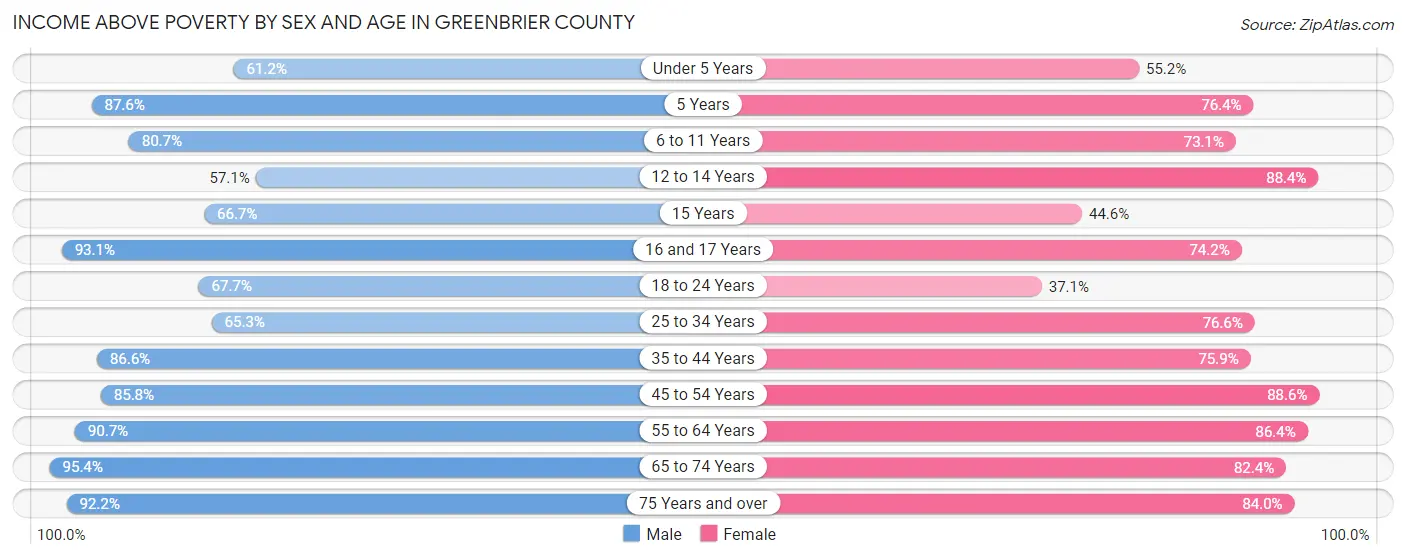
| Age Bracket | Male | Female |
| Under 5 Years | 532 (61.2%) | 400 (55.2%) |
| 5 Years | 155 (87.6%) | 136 (76.4%) |
| 6 to 11 Years | 913 (80.6%) | 604 (73.1%) |
| 12 to 14 Years | 228 (57.1%) | 612 (88.4%) |
| 15 Years | 58 (66.7%) | 103 (44.6%) |
| 16 and 17 Years | 392 (93.1%) | 250 (74.2%) |
| 18 to 24 Years | 765 (67.7%) | 388 (37.1%) |
| 25 to 34 Years | 1,158 (65.3%) | 1,424 (76.6%) |
| 35 to 44 Years | 1,534 (86.6%) | 1,413 (75.8%) |
| 45 to 54 Years | 1,619 (85.8%) | 1,906 (88.6%) |
| 55 to 64 Years | 2,224 (90.7%) | 2,219 (86.4%) |
| 65 to 74 Years | 2,071 (95.4%) | 1,944 (82.4%) |
| 75 Years and over | 1,197 (92.2%) | 1,461 (84.0%) |
| Total | 12,846 (82.5%) | 12,860 (77.6%) |
Income Below Poverty Among Married-Couple Families in Greenbrier County
The poverty statistics for married-couple families in Greenbrier County show that 9.3% or 582 of the total 6,276 families live below the poverty line. Families with 3 or 4 children have the highest poverty rate of 33.8%, comprising of 118 families. On the other hand, families with 5 or more children have the lowest poverty rate of 0.0%, which includes 0 families.
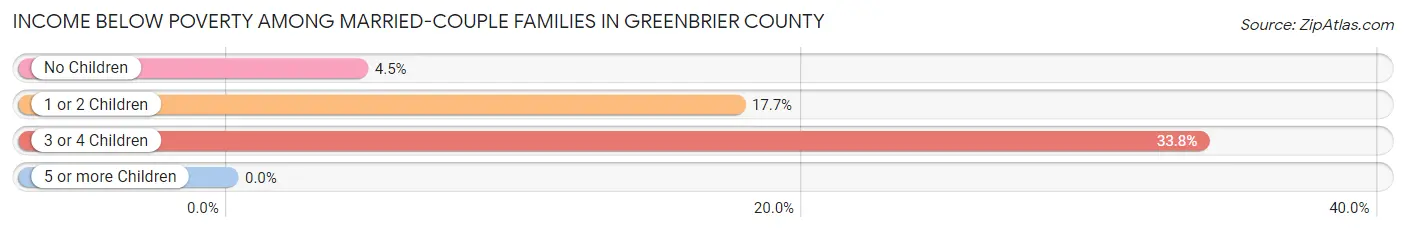
| Children | Above Poverty | Below Poverty |
| No Children | 4,225 (95.5%) | 200 (4.5%) |
| 1 or 2 Children | 1,232 (82.4%) | 264 (17.6%) |
| 3 or 4 Children | 231 (66.2%) | 118 (33.8%) |
| 5 or more Children | 6 (100.0%) | 0 (0.0%) |
| Total | 5,694 (90.7%) | 582 (9.3%) |
Income Below Poverty Among Single-Parent Households in Greenbrier County
According to the poverty data in Greenbrier County, 15.7% or 97 single-father households and 30.7% or 484 single-mother households are living below the poverty line. Among single-father households, those with 3 or 4 children have the highest poverty rate, with 19 households (33.3%) experiencing poverty. Likewise, among single-mother households, those with 3 or 4 children have the highest poverty rate, with 88 households (87.1%) falling below the poverty line.
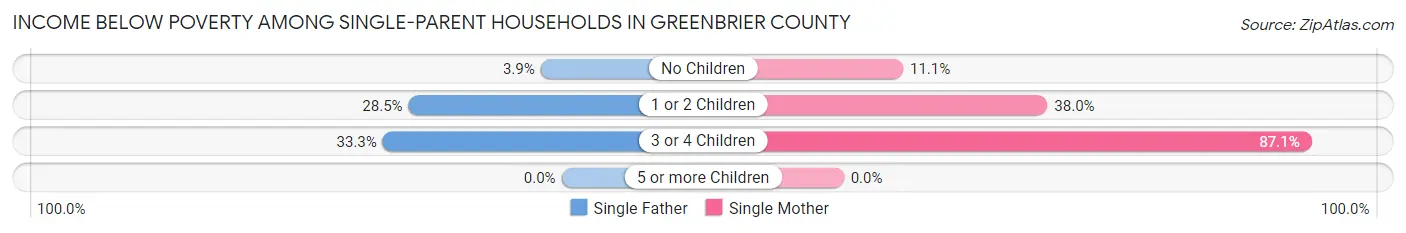
| Children | Single Father | Single Mother |
| No Children | 13 (3.9%) | 67 (11.1%) |
| 1 or 2 Children | 65 (28.5%) | 329 (38.0%) |
| 3 or 4 Children | 19 (33.3%) | 88 (87.1%) |
| 5 or more Children | 0 (0.0%) | 0 (0.0%) |
| Total | 97 (15.7%) | 484 (30.7%) |
Income Below Poverty Among Married-Couple vs Single-Parent Households in Greenbrier County
The poverty data for Greenbrier County shows that 582 of the married-couple family households (9.3%) and 581 of the single-parent households (26.5%) are living below the poverty level. Within the married-couple family households, those with 3 or 4 children have the highest poverty rate, with 118 households (33.8%) falling below the poverty line. Among the single-parent households, those with 3 or 4 children have the highest poverty rate, with 107 household (67.7%) living below poverty.
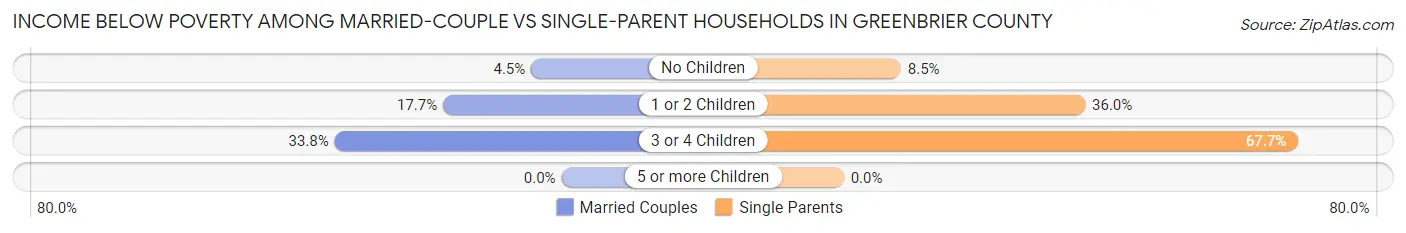
| Children | Married-Couple Families | Single-Parent Households |
| No Children | 200 (4.5%) | 80 (8.5%) |
| 1 or 2 Children | 264 (17.6%) | 394 (36.0%) |
| 3 or 4 Children | 118 (33.8%) | 107 (67.7%) |
| 5 or more Children | 0 (0.0%) | 0 (0.0%) |
| Total | 582 (9.3%) | 581 (26.5%) |
Employment Characteristics in Greenbrier County
Employment by Class of Employer in Greenbrier County
Among the 13,148 employed individuals in Greenbrier County, private company employees (9,060 | 68.9%), state government employees (1,210 | 9.2%), and not-for-profit organizations (849 | 6.5%) make up the most common classes of employment.
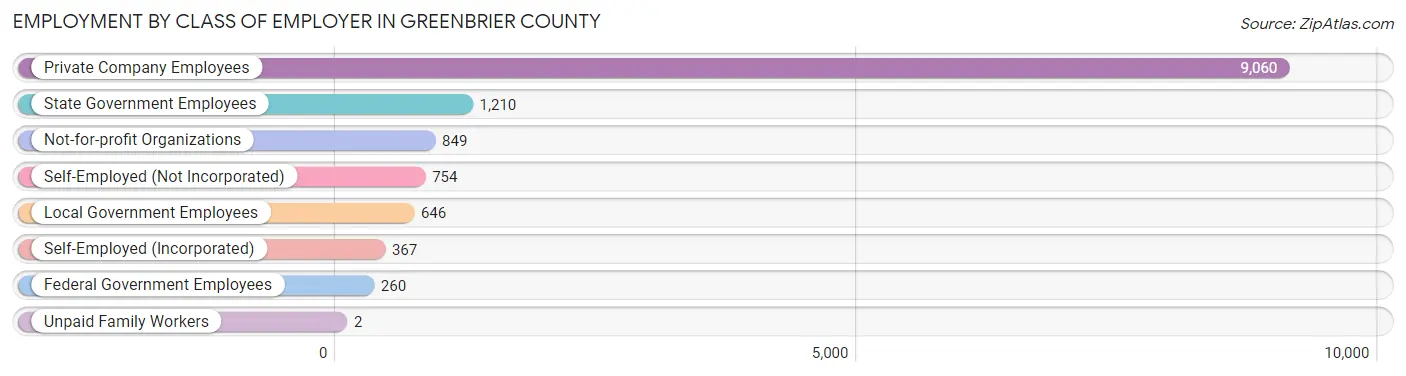
| Employer Class | # Employees | % Employees |
| Private Company Employees | 9,060 | 68.9% |
| Self-Employed (Incorporated) | 367 | 2.8% |
| Self-Employed (Not Incorporated) | 754 | 5.7% |
| Not-for-profit Organizations | 849 | 6.5% |
| Local Government Employees | 646 | 4.9% |
| State Government Employees | 1,210 | 9.2% |
| Federal Government Employees | 260 | 2.0% |
| Unpaid Family Workers | 2 | 0.0% |
| Total | 13,148 | 100.0% |
Employment Status by Age in Greenbrier County
According to the labor force statistics for Greenbrier County, out of the total population over 16 years of age (27,397), 51.2% or 14,027 individuals are in the labor force, with 4.3% or 603 of them unemployed. The age group with the highest labor force participation rate is 35 to 44 years, with 78.5% or 2,923 individuals in the labor force. Within the labor force, the 16 to 19 years age range has the highest percentage of unemployed individuals, with 12.6% or 58 of them being unemployed.

| Age Bracket | In Labor Force | Unemployed |
| 16 to 19 Years | 462 (33.8%) | 58 (12.6%) |
| 20 to 24 Years | 1,202 (73.9%) | 126 (10.5%) |
| 25 to 29 Years | 1,339 (70.2%) | 121 (9.0%) |
| 30 to 34 Years | 1,378 (76.2%) | 54 (3.9%) |
| 35 to 44 Years | 2,923 (78.5%) | 175 (6.0%) |
| 45 to 54 Years | 3,022 (74.1%) | 36 (1.2%) |
| 55 to 59 Years | 1,444 (64.1%) | 14 (1.0%) |
| 60 to 64 Years | 1,267 (44.5%) | 19 (1.5%) |
| 65 to 74 Years | 914 (19.8%) | 0 (0.0%) |
| 75 Years and over | 73 (2.3%) | 0 (0.0%) |
| Total | 14,027 (51.2%) | 603 (4.3%) |
Employment Status by Educational Attainment in Greenbrier County
According to labor force statistics for Greenbrier County, 68.4% of individuals (11,367) out of the total population between 25 and 64 years of age (16,618) are in the labor force, with 3.7% or 421 of them being unemployed. The group with the highest labor force participation rate are those with the educational attainment of college / associate degree, with 78.0% or 3,664 individuals in the labor force. Within the labor force, individuals with less than high school education have the highest percentage of unemployment, with 20.2% or 143 of them being unemployed.
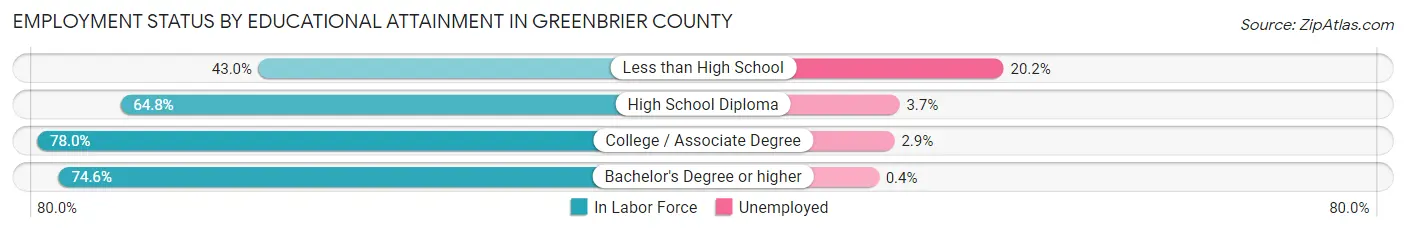
| Educational Attainment | In Labor Force | Unemployed |
| Less than High School | 708 (43.0%) | 332 (20.2%) |
| High School Diploma | 4,344 (64.8%) | 248 (3.7%) |
| College / Associate Degree | 3,664 (78.0%) | 136 (2.9%) |
| Bachelor's Degree or higher | 2,663 (74.6%) | 14 (0.4%) |
| Total | 11,367 (68.4%) | 615 (3.7%) |
Employment Occupations by Sex in Greenbrier County
Management, Business, Science and Arts Occupations
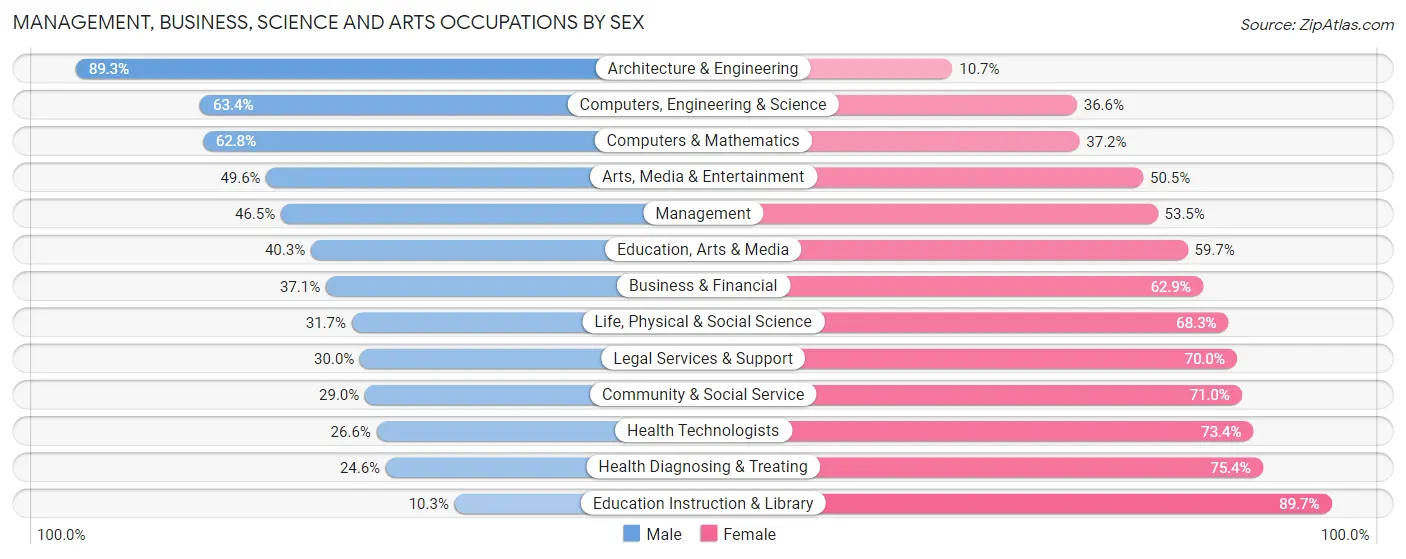
The most common Management, Business, Science and Arts occupations in Greenbrier County are Community & Social Service (1,239 | 9.2%), Management (1,045 | 7.8%), Health Diagnosing & Treating (995 | 7.4%), Health Technologists (674 | 5.0%), and Business & Financial (582 | 4.3%).
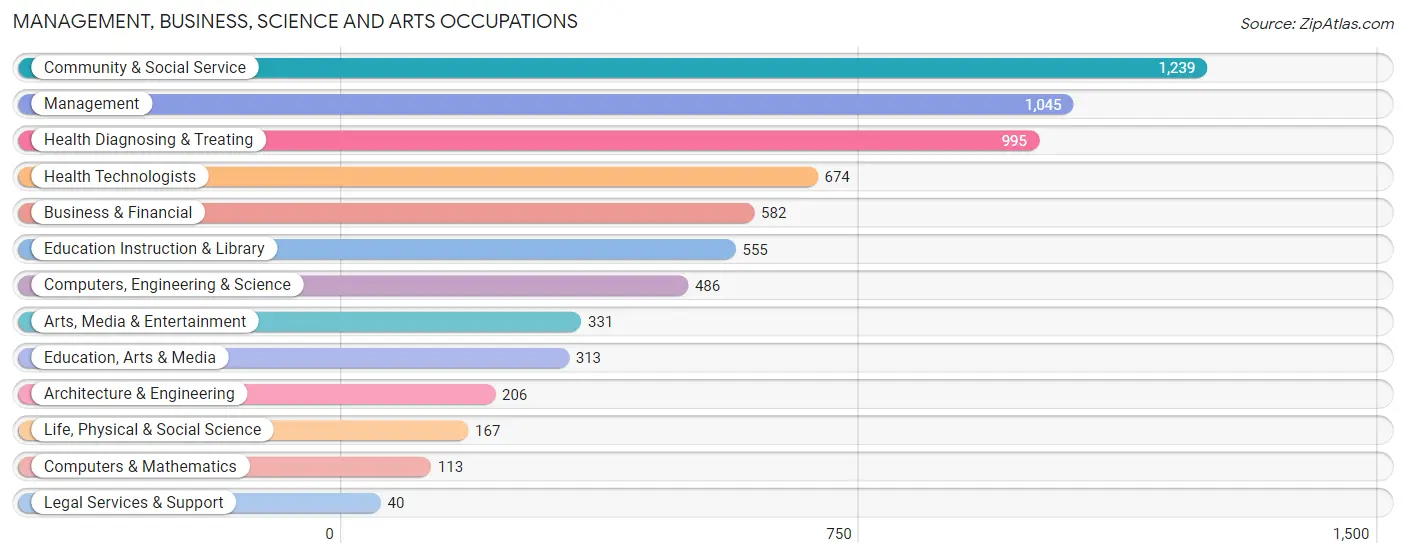
Management, Business, Science and Arts Occupations by Sex
Within the Management, Business, Science and Arts occupations in Greenbrier County, the most male-oriented occupations are Architecture & Engineering (89.3%), Computers, Engineering & Science (63.4%), and Computers & Mathematics (62.8%), while the most female-oriented occupations are Education Instruction & Library (89.7%), Health Diagnosing & Treating (75.4%), and Health Technologists (73.4%).
| Occupation | Male | Female |
| Management | 486 (46.5%) | 559 (53.5%) |
| Business & Financial | 216 (37.1%) | 366 (62.9%) |
| Computers, Engineering & Science | 308 (63.4%) | 178 (36.6%) |
| Computers & Mathematics | 71 (62.8%) | 42 (37.2%) |
| Architecture & Engineering | 184 (89.3%) | 22 (10.7%) |
| Life, Physical & Social Science | 53 (31.7%) | 114 (68.3%) |
| Community & Social Service | 359 (29.0%) | 880 (71.0%) |
| Education, Arts & Media | 126 (40.3%) | 187 (59.7%) |
| Legal Services & Support | 12 (30.0%) | 28 (70.0%) |
| Education Instruction & Library | 57 (10.3%) | 498 (89.7%) |
| Arts, Media & Entertainment | 164 (49.5%) | 167 (50.4%) |
| Health Diagnosing & Treating | 245 (24.6%) | 750 (75.4%) |
| Health Technologists | 179 (26.6%) | 495 (73.4%) |
| Total (Category) | 1,614 (37.1%) | 2,733 (62.9%) |
| Total (Overall) | 6,817 (50.8%) | 6,605 (49.2%) |
Services Occupations
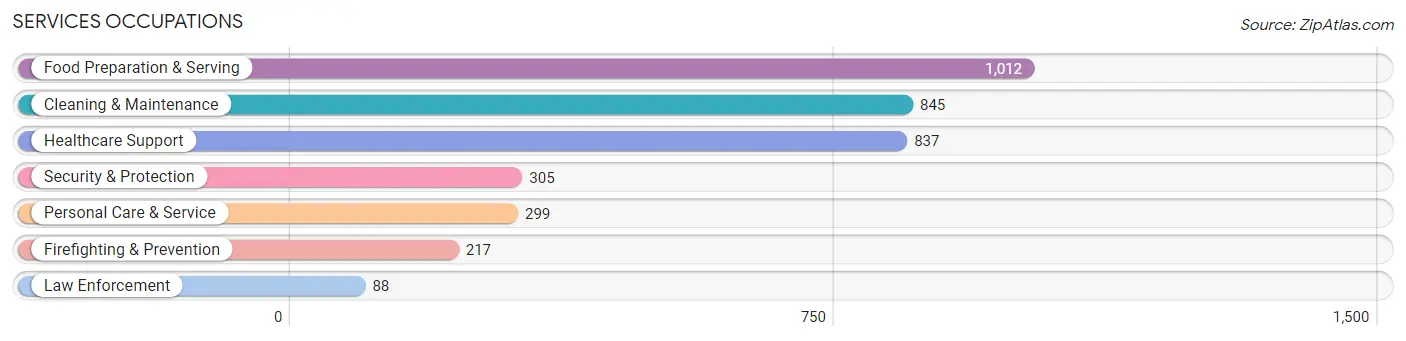
The most common Services occupations in Greenbrier County are Food Preparation & Serving (1,012 | 7.5%), Cleaning & Maintenance (845 | 6.3%), Healthcare Support (837 | 6.2%), Security & Protection (305 | 2.3%), and Personal Care & Service (299 | 2.2%).
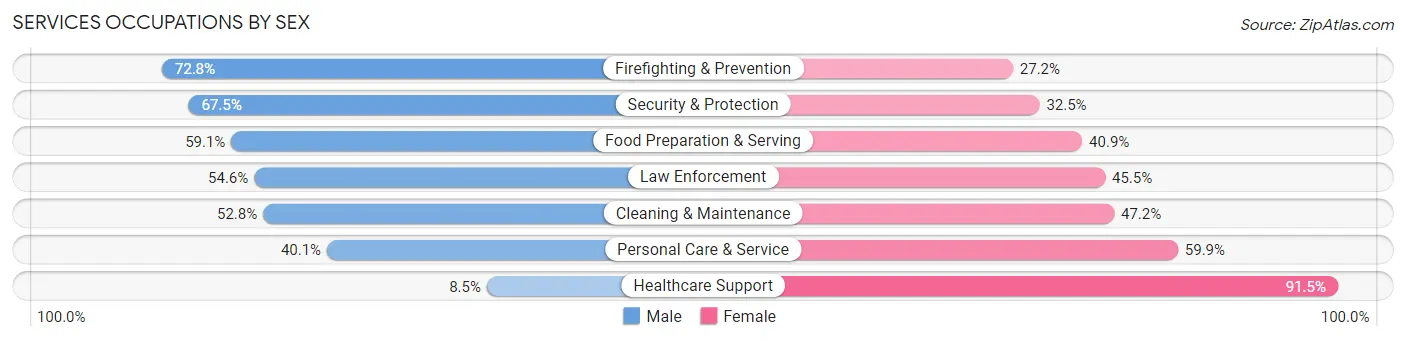
Services Occupations by Sex
Within the Services occupations in Greenbrier County, the most male-oriented occupations are Firefighting & Prevention (72.8%), Security & Protection (67.5%), and Food Preparation & Serving (59.1%), while the most female-oriented occupations are Healthcare Support (91.5%), Personal Care & Service (59.9%), and Cleaning & Maintenance (47.2%).
| Occupation | Male | Female |
| Healthcare Support | 71 (8.5%) | 766 (91.5%) |
| Security & Protection | 206 (67.5%) | 99 (32.5%) |
| Firefighting & Prevention | 158 (72.8%) | 59 (27.2%) |
| Law Enforcement | 48 (54.5%) | 40 (45.5%) |
| Food Preparation & Serving | 598 (59.1%) | 414 (40.9%) |
| Cleaning & Maintenance | 446 (52.8%) | 399 (47.2%) |
| Personal Care & Service | 120 (40.1%) | 179 (59.9%) |
| Total (Category) | 1,441 (43.7%) | 1,857 (56.3%) |
| Total (Overall) | 6,817 (50.8%) | 6,605 (49.2%) |
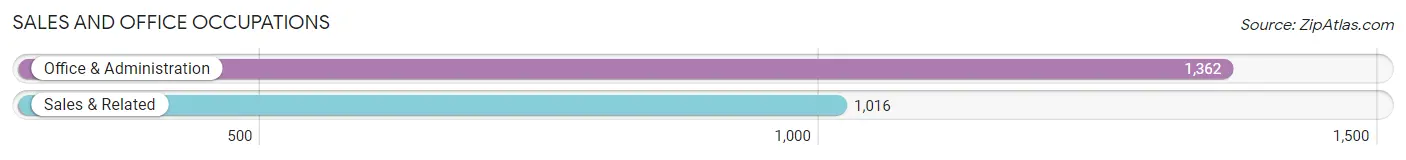
Sales and Office Occupations
The most common Sales and Office occupations in Greenbrier County are Office & Administration (1,362 | 10.2%), and Sales & Related (1,016 | 7.6%).
Sales and Office Occupations by Sex
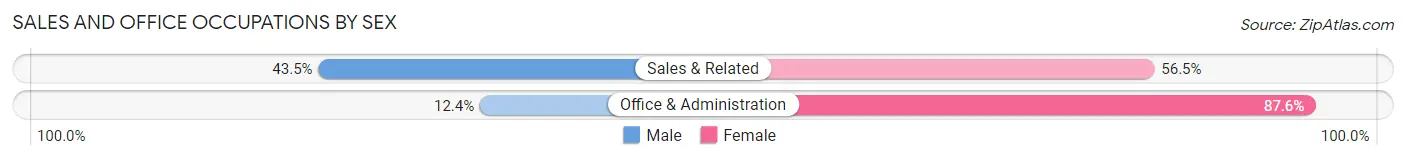
| Occupation | Male | Female |
| Sales & Related | 442 (43.5%) | 574 (56.5%) |
| Office & Administration | 169 (12.4%) | 1,193 (87.6%) |
| Total (Category) | 611 (25.7%) | 1,767 (74.3%) |
| Total (Overall) | 6,817 (50.8%) | 6,605 (49.2%) |
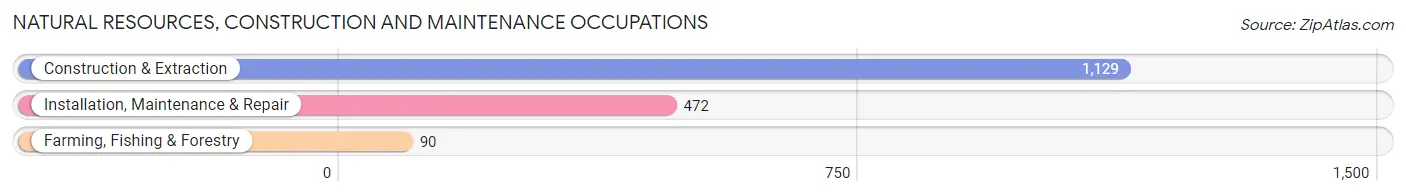
Natural Resources, Construction and Maintenance Occupations
The most common Natural Resources, Construction and Maintenance occupations in Greenbrier County are Construction & Extraction (1,129 | 8.4%), Installation, Maintenance & Repair (472 | 3.5%), and Farming, Fishing & Forestry (90 | 0.7%).
Natural Resources, Construction and Maintenance Occupations by Sex
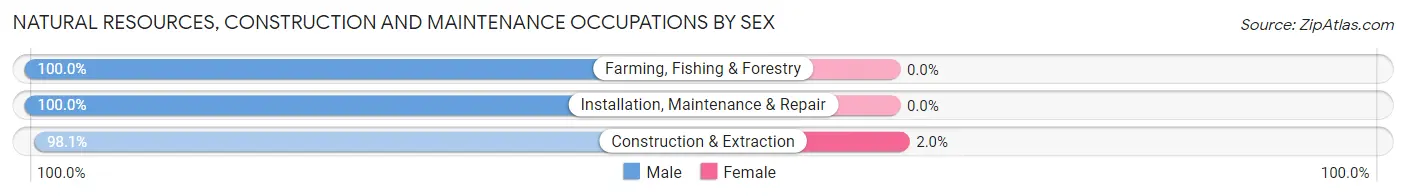
| Occupation | Male | Female |
| Farming, Fishing & Forestry | 90 (100.0%) | 0 (0.0%) |
| Construction & Extraction | 1,107 (98.1%) | 22 (1.9%) |
| Installation, Maintenance & Repair | 472 (100.0%) | 0 (0.0%) |
| Total (Category) | 1,669 (98.7%) | 22 (1.3%) |
| Total (Overall) | 6,817 (50.8%) | 6,605 (49.2%) |
Production, Transportation and Moving Occupations
The most common Production, Transportation and Moving occupations in Greenbrier County are Production (848 | 6.3%), Transportation (536 | 4.0%), and Material Moving (324 | 2.4%).
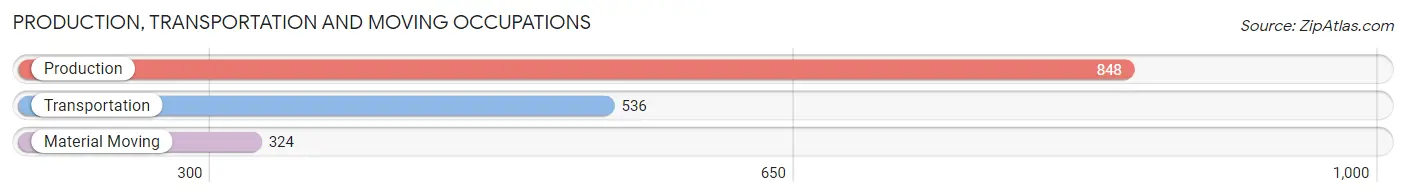
Production, Transportation and Moving Occupations by Sex
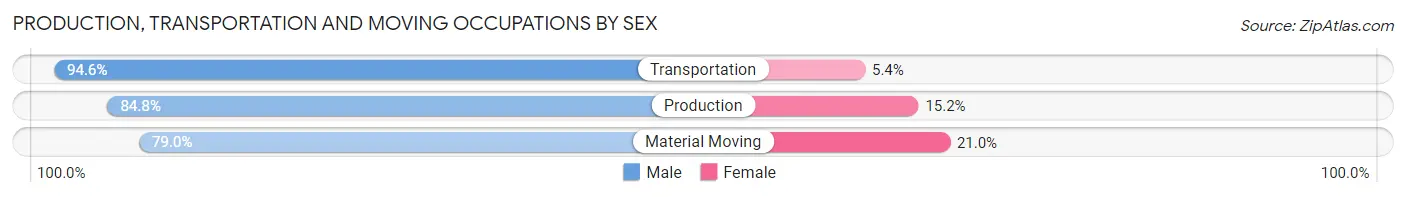
| Occupation | Male | Female |
| Production | 719 (84.8%) | 129 (15.2%) |
| Transportation | 507 (94.6%) | 29 (5.4%) |
| Material Moving | 256 (79.0%) | 68 (21.0%) |
| Total (Category) | 1,482 (86.8%) | 226 (13.2%) |
| Total (Overall) | 6,817 (50.8%) | 6,605 (49.2%) |
Employment Industries by Sex in Greenbrier County
Employment Industries in Greenbrier County
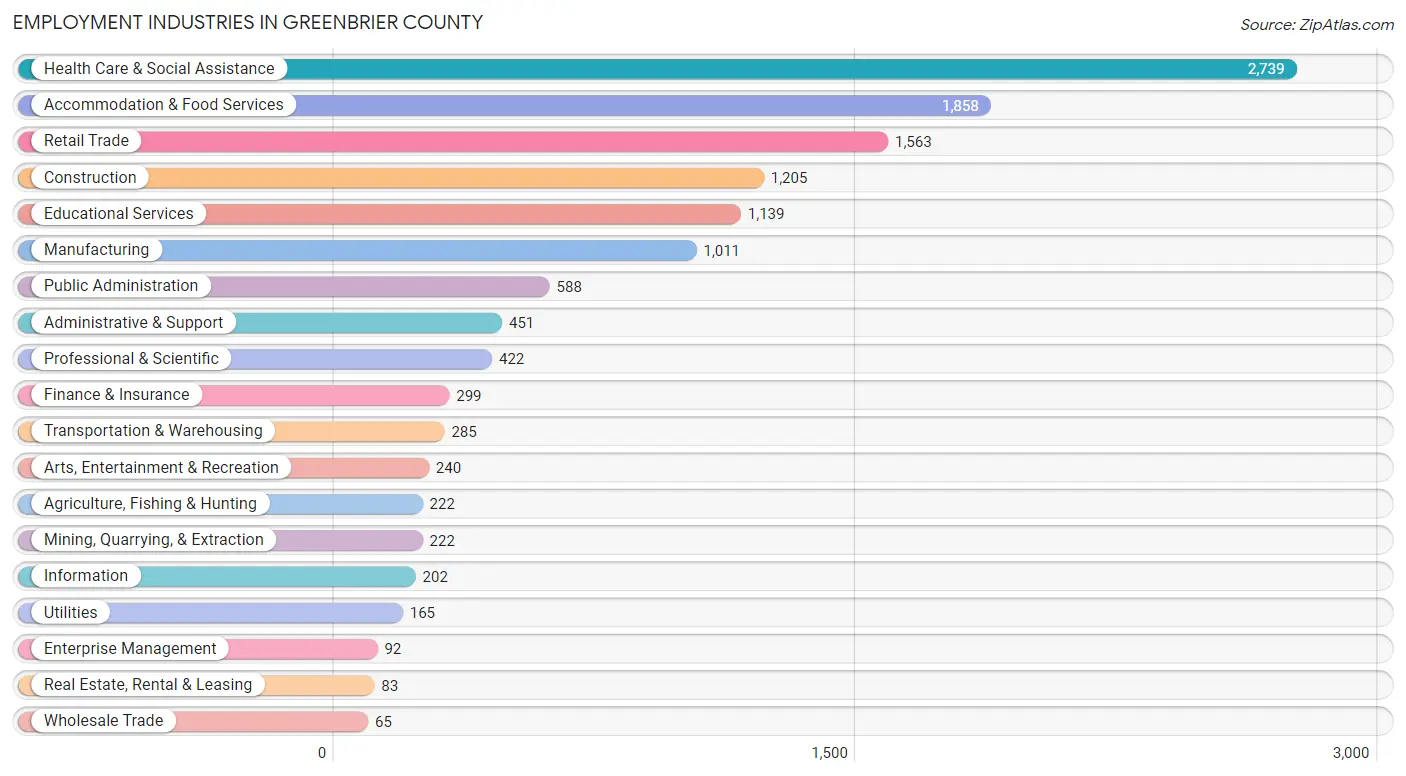
The major employment industries in Greenbrier County include Health Care & Social Assistance (2,739 | 20.4%), Accommodation & Food Services (1,858 | 13.8%), Retail Trade (1,563 | 11.7%), Construction (1,205 | 9.0%), and Educational Services (1,139 | 8.5%).
Employment Industries by Sex in Greenbrier County
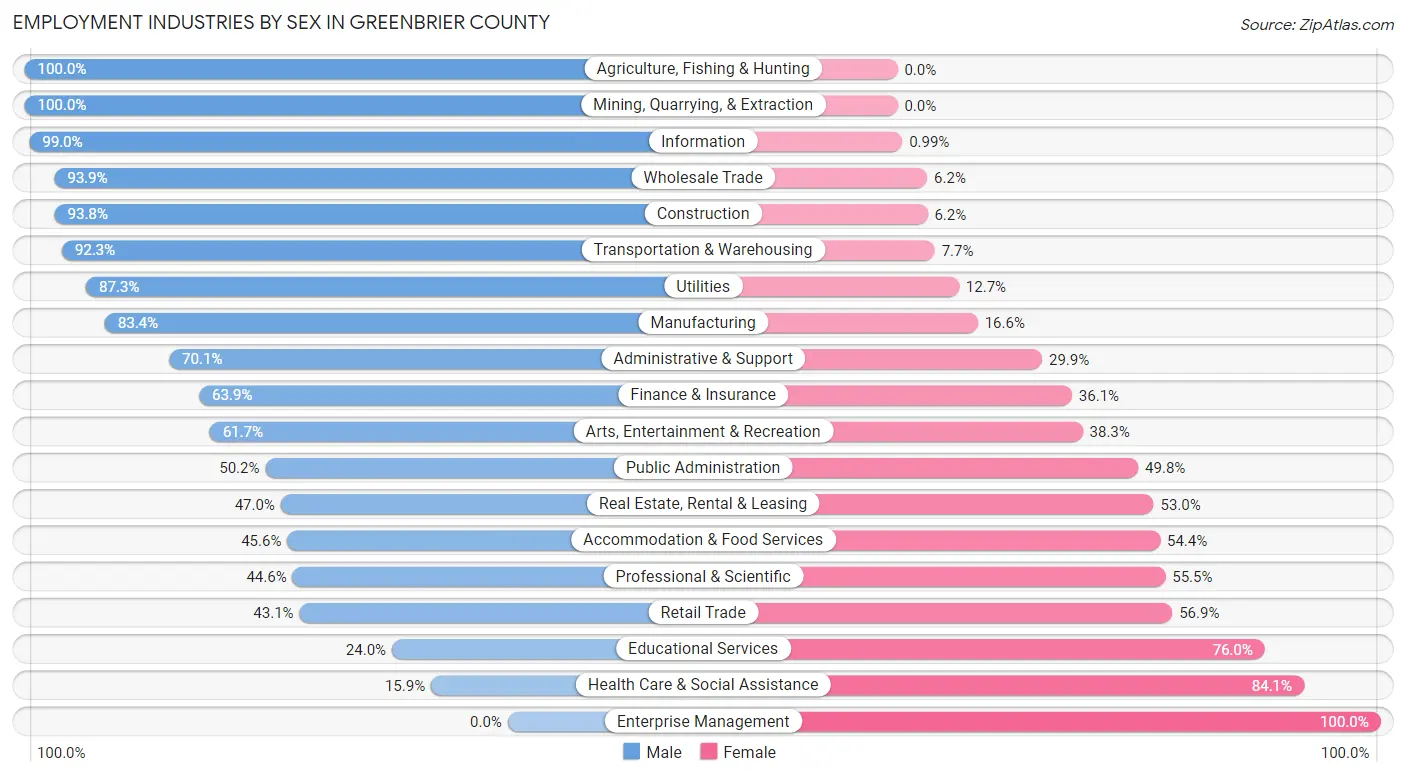
The Greenbrier County industries that see more men than women are Agriculture, Fishing & Hunting (100.0%), Mining, Quarrying, & Extraction (100.0%), and Information (99.0%), whereas the industries that tend to have a higher number of women are Enterprise Management (100.0%), Health Care & Social Assistance (84.1%), and Educational Services (76.0%).
| Industry | Male | Female |
| Agriculture, Fishing & Hunting | 222 (100.0%) | 0 (0.0%) |
| Mining, Quarrying, & Extraction | 222 (100.0%) | 0 (0.0%) |
| Construction | 1,130 (93.8%) | 75 (6.2%) |
| Manufacturing | 843 (83.4%) | 168 (16.6%) |
| Wholesale Trade | 61 (93.9%) | 4 (6.1%) |
| Retail Trade | 674 (43.1%) | 889 (56.9%) |
| Transportation & Warehousing | 263 (92.3%) | 22 (7.7%) |
| Utilities | 144 (87.3%) | 21 (12.7%) |
| Information | 200 (99.0%) | 2 (1.0%) |
| Finance & Insurance | 191 (63.9%) | 108 (36.1%) |
| Real Estate, Rental & Leasing | 39 (47.0%) | 44 (53.0%) |
| Professional & Scientific | 188 (44.6%) | 234 (55.4%) |
| Enterprise Management | 0 (0.0%) | 92 (100.0%) |
| Administrative & Support | 316 (70.1%) | 135 (29.9%) |
| Educational Services | 273 (24.0%) | 866 (76.0%) |
| Health Care & Social Assistance | 435 (15.9%) | 2,304 (84.1%) |
| Arts, Entertainment & Recreation | 148 (61.7%) | 92 (38.3%) |
| Accommodation & Food Services | 848 (45.6%) | 1,010 (54.4%) |
| Public Administration | 295 (50.2%) | 293 (49.8%) |
| Total | 6,817 (50.8%) | 6,605 (49.2%) |
Education in Greenbrier County
School Enrollment in Greenbrier County
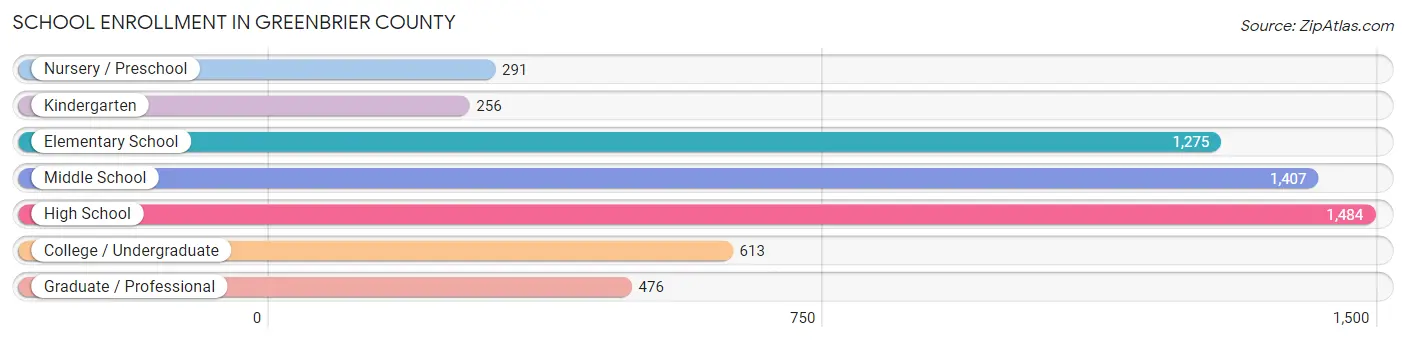
The most common levels of schooling among the 5,802 students in Greenbrier County are high school (1,484 | 25.6%), middle school (1,407 | 24.2%), and elementary school (1,275 | 22.0%).
| School Level | # Students | % Students |
| Nursery / Preschool | 291 | 5.0% |
| Kindergarten | 256 | 4.4% |
| Elementary School | 1,275 | 22.0% |
| Middle School | 1,407 | 24.2% |
| High School | 1,484 | 25.6% |
| College / Undergraduate | 613 | 10.6% |
| Graduate / Professional | 476 | 8.2% |
| Total | 5,802 | 100.0% |
School Enrollment by Age by Funding Source in Greenbrier County
Out of a total of 5,802 students who are enrolled in schools in Greenbrier County, 1,178 (20.3%) attend a private institution, while the remaining 4,624 (79.7%) are enrolled in public schools. The age group of 20 to 24 year olds has the highest likelihood of being enrolled in private schools, with 167 (54.4% in the age bracket) enrolled. Conversely, the age group of 15 to 17 year olds has the lowest likelihood of being enrolled in a private school, with 1,033 (96.4% in the age bracket) attending a public institution.
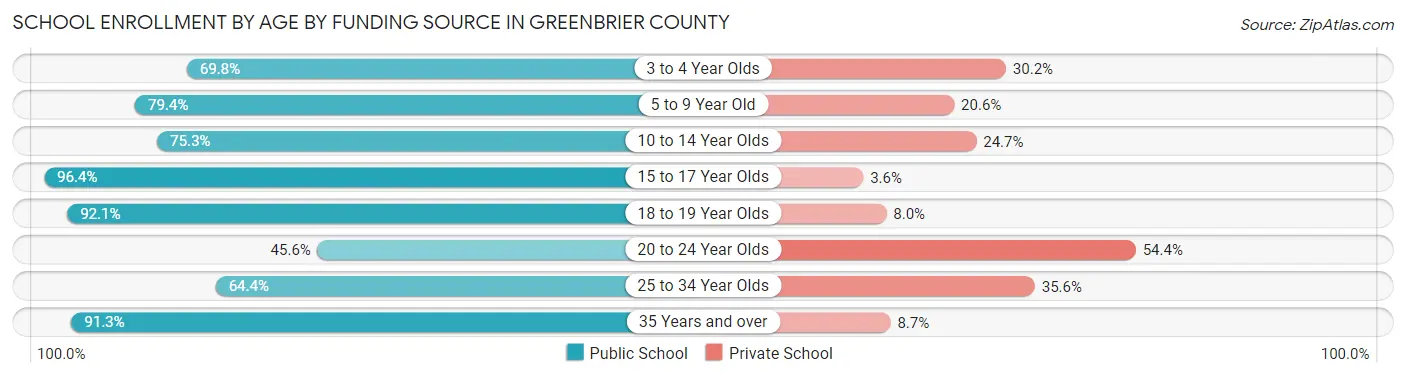
| Age Bracket | Public School | Private School |
| 3 to 4 Year Olds | 127 (69.8%) | 55 (30.2%) |
| 5 to 9 Year Old | 1,142 (79.4%) | 296 (20.6%) |
| 10 to 14 Year Olds | 1,317 (75.3%) | 432 (24.7%) |
| 15 to 17 Year Olds | 1,033 (96.4%) | 39 (3.6%) |
| 18 to 19 Year Olds | 336 (92.0%) | 29 (8.0%) |
| 20 to 24 Year Olds | 140 (45.6%) | 167 (54.4%) |
| 25 to 34 Year Olds | 237 (64.4%) | 131 (35.6%) |
| 35 Years and over | 293 (91.3%) | 28 (8.7%) |
| Total | 4,624 (79.7%) | 1,178 (20.3%) |
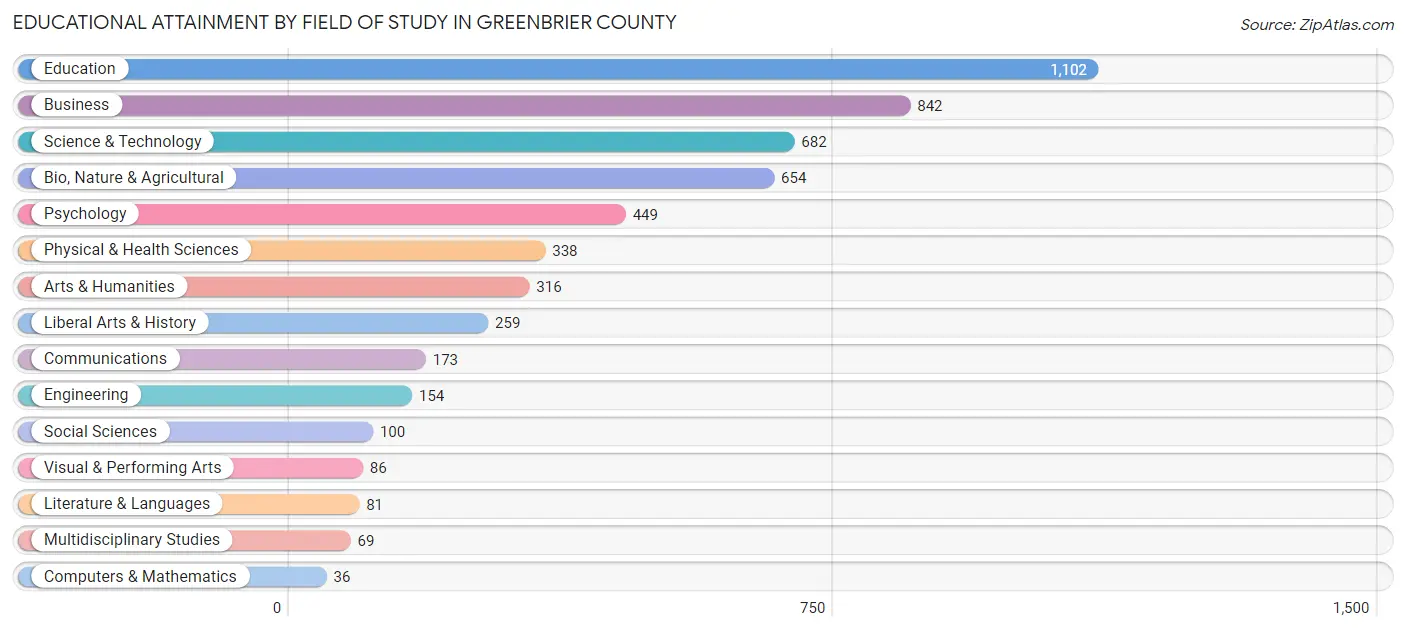
Educational Attainment by Field of Study in Greenbrier County
Education (1,102 | 20.6%), business (842 | 15.8%), science & technology (682 | 12.8%), bio, nature & agricultural (654 | 12.2%), and psychology (449 | 8.4%) are the most common fields of study among 5,341 individuals in Greenbrier County who have obtained a bachelor's degree or higher.
| Field of Study | # Graduates | % Graduates |
| Computers & Mathematics | 36 | 0.7% |
| Bio, Nature & Agricultural | 654 | 12.2% |
| Physical & Health Sciences | 338 | 6.3% |
| Psychology | 449 | 8.4% |
| Social Sciences | 100 | 1.9% |
| Engineering | 154 | 2.9% |
| Multidisciplinary Studies | 69 | 1.3% |
| Science & Technology | 682 | 12.8% |
| Business | 842 | 15.8% |
| Education | 1,102 | 20.6% |
| Literature & Languages | 81 | 1.5% |
| Liberal Arts & History | 259 | 4.9% |
| Visual & Performing Arts | 86 | 1.6% |
| Communications | 173 | 3.2% |
| Arts & Humanities | 316 | 5.9% |
| Total | 5,341 | 100.0% |
Transportation & Commute in Greenbrier County
Vehicle Availability by Sex in Greenbrier County
The most prevalent vehicle ownership categories in Greenbrier County are males with 2 vehicles (2,589, accounting for 38.8%) and females with 2 vehicles (2,507, making up 40.0%).
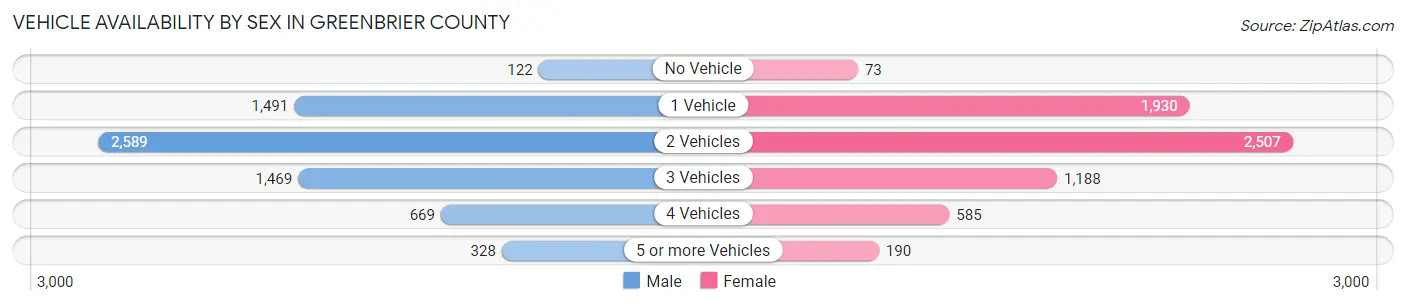
| Vehicles Available | Male | Female |
| No Vehicle | 122 (1.8%) | 73 (1.1%) |
| 1 Vehicle | 1,491 (22.4%) | 1,930 (29.8%) |
| 2 Vehicles | 2,589 (38.8%) | 2,507 (38.7%) |
| 3 Vehicles | 1,469 (22.0%) | 1,188 (18.3%) |
| 4 Vehicles | 669 (10.0%) | 585 (9.0%) |
| 5 or more Vehicles | 328 (4.9%) | 190 (2.9%) |
| Total | 6,668 (100.0%) | 6,473 (100.0%) |
Commute Time in Greenbrier County
The most frequently occuring commute durations in Greenbrier County are 30 to 34 minutes (2,212 commuters, 17.3%), 15 to 19 minutes (1,866 commuters, 14.6%), and 10 to 14 minutes (1,585 commuters, 12.4%).
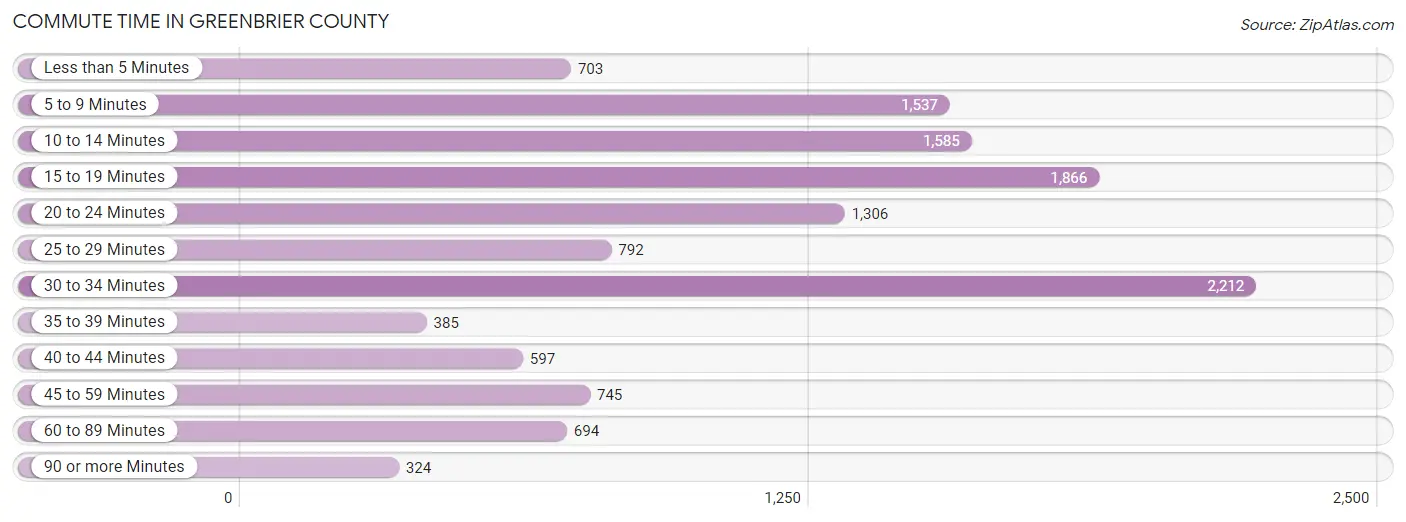
| Commute Time | # Commuters | % Commuters |
| Less than 5 Minutes | 703 | 5.5% |
| 5 to 9 Minutes | 1,537 | 12.1% |
| 10 to 14 Minutes | 1,585 | 12.4% |
| 15 to 19 Minutes | 1,866 | 14.6% |
| 20 to 24 Minutes | 1,306 | 10.2% |
| 25 to 29 Minutes | 792 | 6.2% |
| 30 to 34 Minutes | 2,212 | 17.3% |
| 35 to 39 Minutes | 385 | 3.0% |
| 40 to 44 Minutes | 597 | 4.7% |
| 45 to 59 Minutes | 745 | 5.8% |
| 60 to 89 Minutes | 694 | 5.4% |
| 90 or more Minutes | 324 | 2.5% |
Commute Time by Sex in Greenbrier County
The most common commute times in Greenbrier County are 30 to 34 minutes (1,073 commuters, 16.7%) for males and 30 to 34 minutes (1,139 commuters, 18.1%) for females.
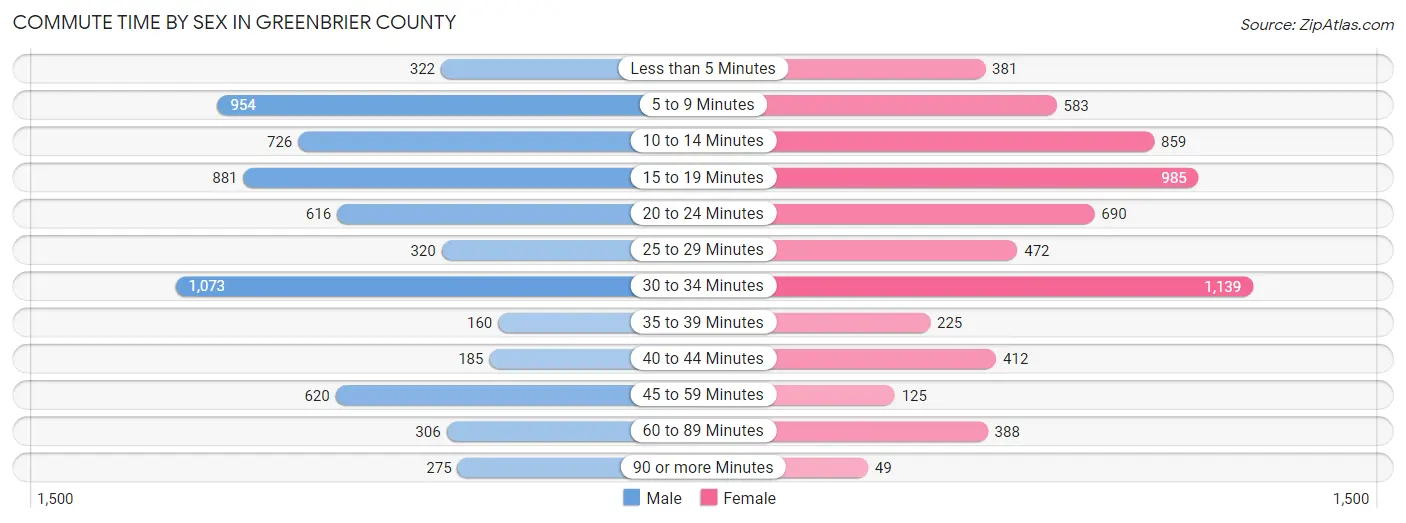
| Commute Time | Male | Female |
| Less than 5 Minutes | 322 (5.0%) | 381 (6.0%) |
| 5 to 9 Minutes | 954 (14.8%) | 583 (9.2%) |
| 10 to 14 Minutes | 726 (11.3%) | 859 (13.6%) |
| 15 to 19 Minutes | 881 (13.7%) | 985 (15.6%) |
| 20 to 24 Minutes | 616 (9.6%) | 690 (10.9%) |
| 25 to 29 Minutes | 320 (5.0%) | 472 (7.5%) |
| 30 to 34 Minutes | 1,073 (16.7%) | 1,139 (18.1%) |
| 35 to 39 Minutes | 160 (2.5%) | 225 (3.6%) |
| 40 to 44 Minutes | 185 (2.9%) | 412 (6.5%) |
| 45 to 59 Minutes | 620 (9.6%) | 125 (2.0%) |
| 60 to 89 Minutes | 306 (4.8%) | 388 (6.1%) |
| 90 or more Minutes | 275 (4.3%) | 49 (0.8%) |
Time of Departure to Work by Sex in Greenbrier County
The most frequent times of departure to work in Greenbrier County are 7:00 AM to 7:29 AM (1,071, 16.6%) for males and 7:30 AM to 7:59 AM (1,226, 19.4%) for females.
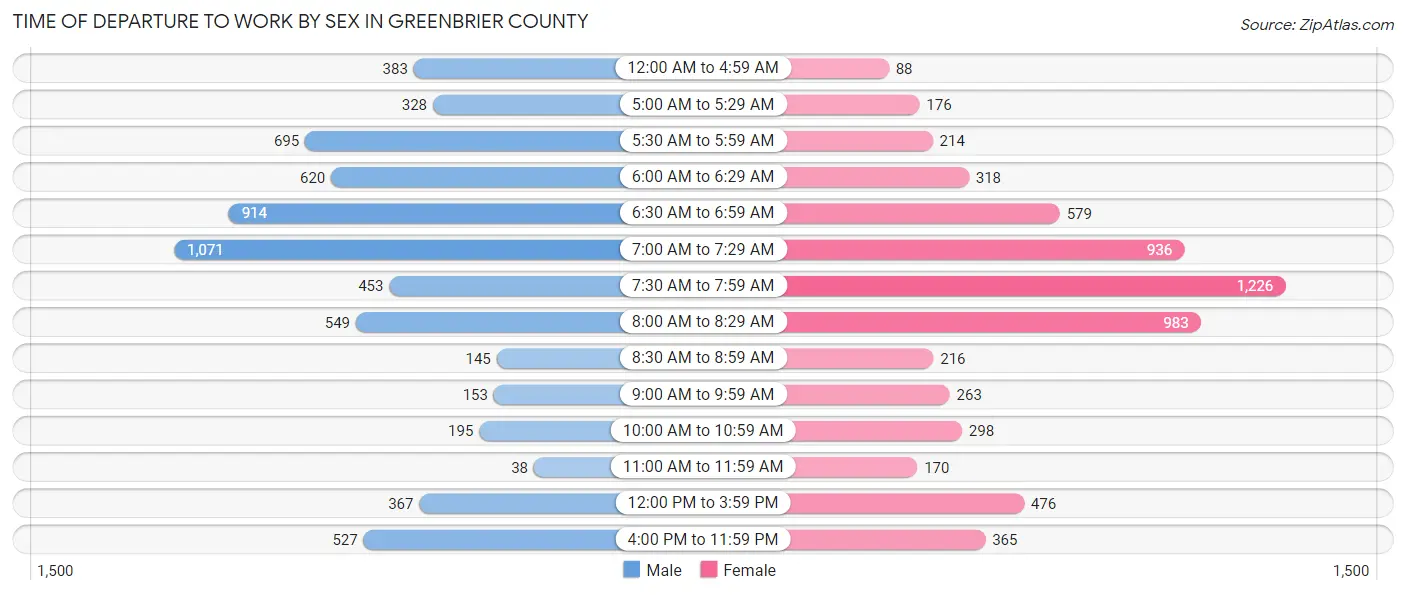
| Time of Departure | Male | Female |
| 12:00 AM to 4:59 AM | 383 (5.9%) | 88 (1.4%) |
| 5:00 AM to 5:29 AM | 328 (5.1%) | 176 (2.8%) |
| 5:30 AM to 5:59 AM | 695 (10.8%) | 214 (3.4%) |
| 6:00 AM to 6:29 AM | 620 (9.6%) | 318 (5.0%) |
| 6:30 AM to 6:59 AM | 914 (14.2%) | 579 (9.2%) |
| 7:00 AM to 7:29 AM | 1,071 (16.6%) | 936 (14.8%) |
| 7:30 AM to 7:59 AM | 453 (7.0%) | 1,226 (19.4%) |
| 8:00 AM to 8:29 AM | 549 (8.5%) | 983 (15.6%) |
| 8:30 AM to 8:59 AM | 145 (2.2%) | 216 (3.4%) |
| 9:00 AM to 9:59 AM | 153 (2.4%) | 263 (4.2%) |
| 10:00 AM to 10:59 AM | 195 (3.0%) | 298 (4.7%) |
| 11:00 AM to 11:59 AM | 38 (0.6%) | 170 (2.7%) |
| 12:00 PM to 3:59 PM | 367 (5.7%) | 476 (7.5%) |
| 4:00 PM to 11:59 PM | 527 (8.2%) | 365 (5.8%) |
| Total | 6,438 (100.0%) | 6,308 (100.0%) |
Housing Occupancy in Greenbrier County
Occupancy by Ownership in Greenbrier County
Of the total 14,724 dwellings in Greenbrier County, owner-occupied units account for 11,027 (74.9%), while renter-occupied units make up 3,697 (25.1%).
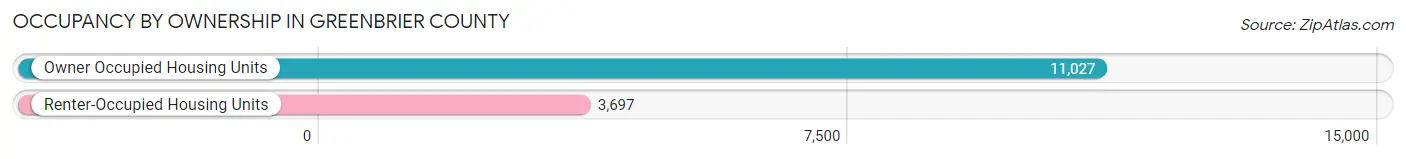
| Occupancy | # Housing Units | % Housing Units |
| Owner Occupied Housing Units | 11,027 | 74.9% |
| Renter-Occupied Housing Units | 3,697 | 25.1% |
| Total Occupied Housing Units | 14,724 | 100.0% |
Occupancy by Household Size in Greenbrier County
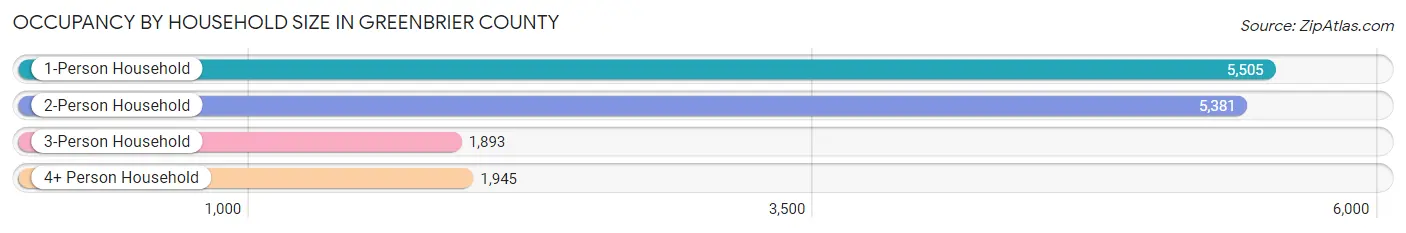
| Household Size | # Housing Units | % Housing Units |
| 1-Person Household | 5,505 | 37.4% |
| 2-Person Household | 5,381 | 36.5% |
| 3-Person Household | 1,893 | 12.9% |
| 4+ Person Household | 1,945 | 13.2% |
| Total Housing Units | 14,724 | 100.0% |
Occupancy by Ownership by Household Size in Greenbrier County
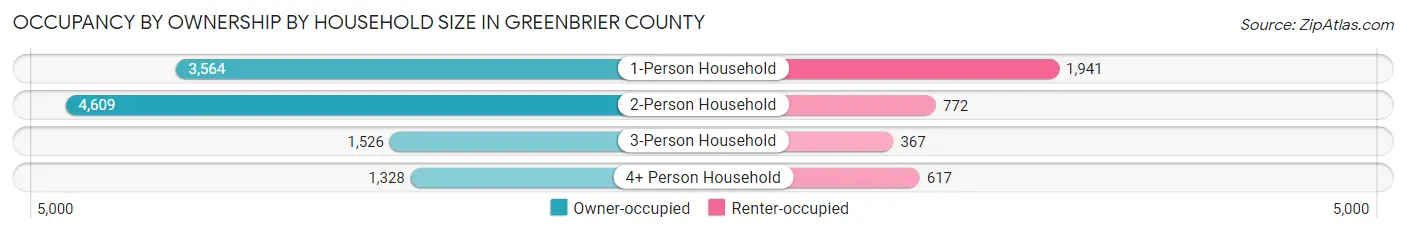
| Household Size | Owner-occupied | Renter-occupied |
| 1-Person Household | 3,564 (64.7%) | 1,941 (35.3%) |
| 2-Person Household | 4,609 (85.7%) | 772 (14.3%) |
| 3-Person Household | 1,526 (80.6%) | 367 (19.4%) |
| 4+ Person Household | 1,328 (68.3%) | 617 (31.7%) |
| Total Housing Units | 11,027 (74.9%) | 3,697 (25.1%) |
Occupancy by Educational Attainment in Greenbrier County
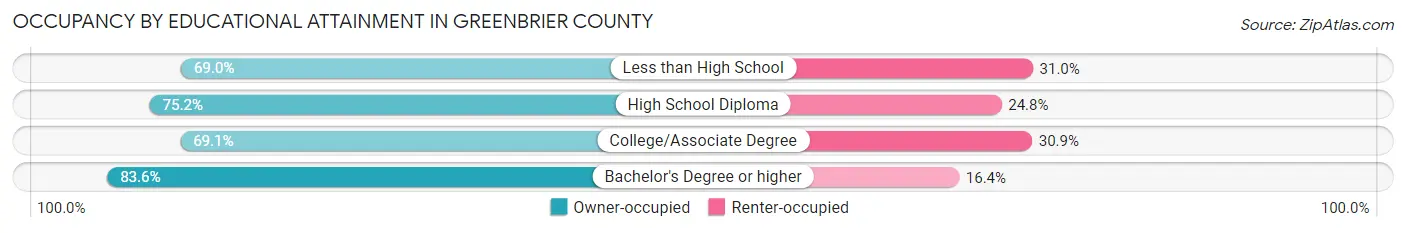
| Household Size | Owner-occupied | Renter-occupied |
| Less than High School | 1,159 (69.0%) | 521 (31.0%) |
| High School Diploma | 4,329 (75.2%) | 1,428 (24.8%) |
| College/Associate Degree | 2,646 (69.1%) | 1,181 (30.9%) |
| Bachelor's Degree or higher | 2,893 (83.6%) | 567 (16.4%) |
Occupancy by Age of Householder in Greenbrier County
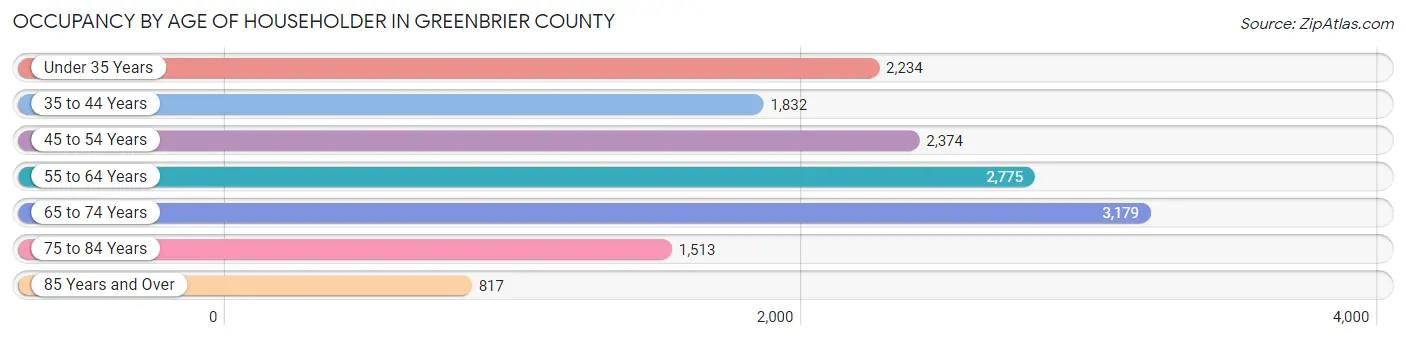
| Age Bracket | # Households | % Households |
| Under 35 Years | 2,234 | 15.2% |
| 35 to 44 Years | 1,832 | 12.4% |
| 45 to 54 Years | 2,374 | 16.1% |
| 55 to 64 Years | 2,775 | 18.9% |
| 65 to 74 Years | 3,179 | 21.6% |
| 75 to 84 Years | 1,513 | 10.3% |
| 85 Years and Over | 817 | 5.6% |
| Total | 14,724 | 100.0% |
Housing Finances in Greenbrier County
Median Income by Occupancy in Greenbrier County
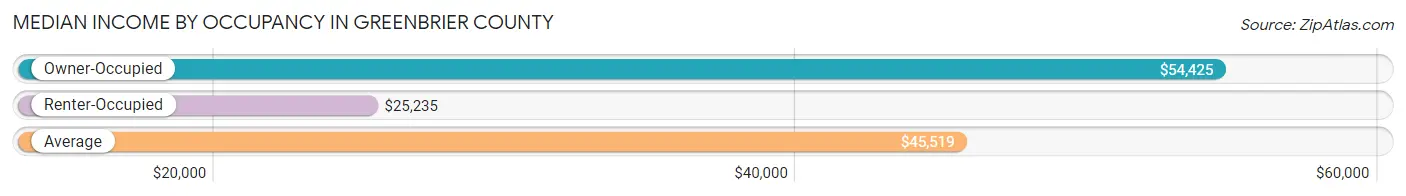
| Occupancy Type | # Households | Median Income |
| Owner-Occupied | 11,027 (74.9%) | $54,425 |
| Renter-Occupied | 3,697 (25.1%) | $25,235 |
| Average | 14,724 (100.0%) | $45,519 |
Occupancy by Householder Income Bracket in Greenbrier County
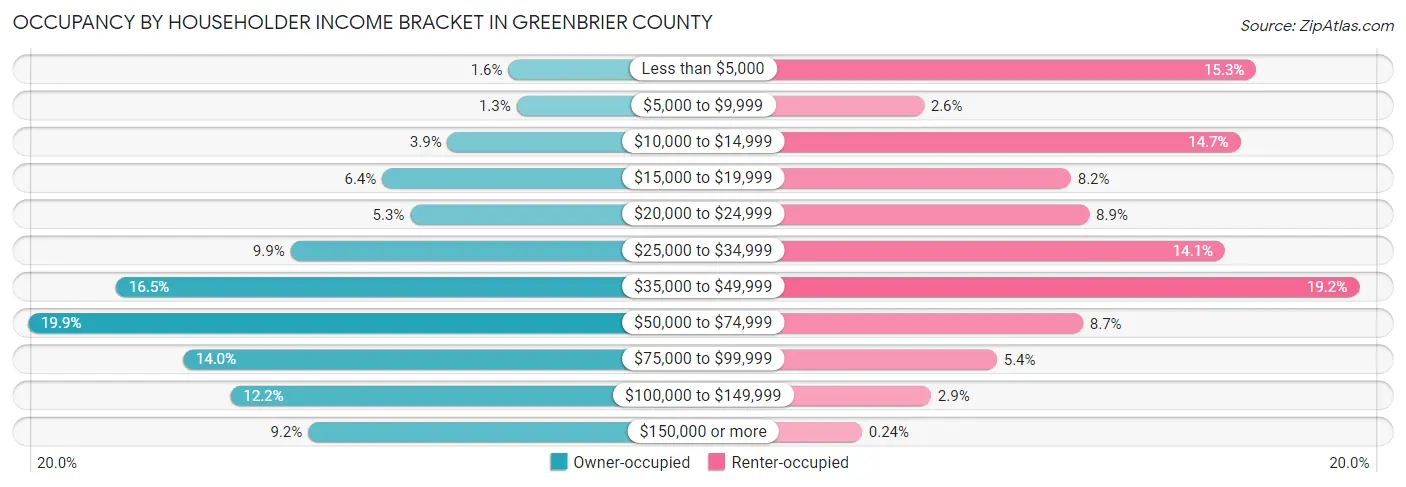
| Income Bracket | Owner-occupied | Renter-occupied |
| Less than $5,000 | 173 (1.6%) | 564 (15.3%) |
| $5,000 to $9,999 | 139 (1.3%) | 96 (2.6%) |
| $10,000 to $14,999 | 429 (3.9%) | 542 (14.7%) |
| $15,000 to $19,999 | 703 (6.4%) | 303 (8.2%) |
| $20,000 to $24,999 | 586 (5.3%) | 329 (8.9%) |
| $25,000 to $34,999 | 1,088 (9.9%) | 520 (14.1%) |
| $35,000 to $49,999 | 1,822 (16.5%) | 709 (19.2%) |
| $50,000 to $74,999 | 2,191 (19.9%) | 320 (8.7%) |
| $75,000 to $99,999 | 1,540 (14.0%) | 199 (5.4%) |
| $100,000 to $149,999 | 1,341 (12.2%) | 106 (2.9%) |
| $150,000 or more | 1,015 (9.2%) | 9 (0.2%) |
| Total | 11,027 (100.0%) | 3,697 (100.0%) |
Monthly Housing Cost Tiers in Greenbrier County
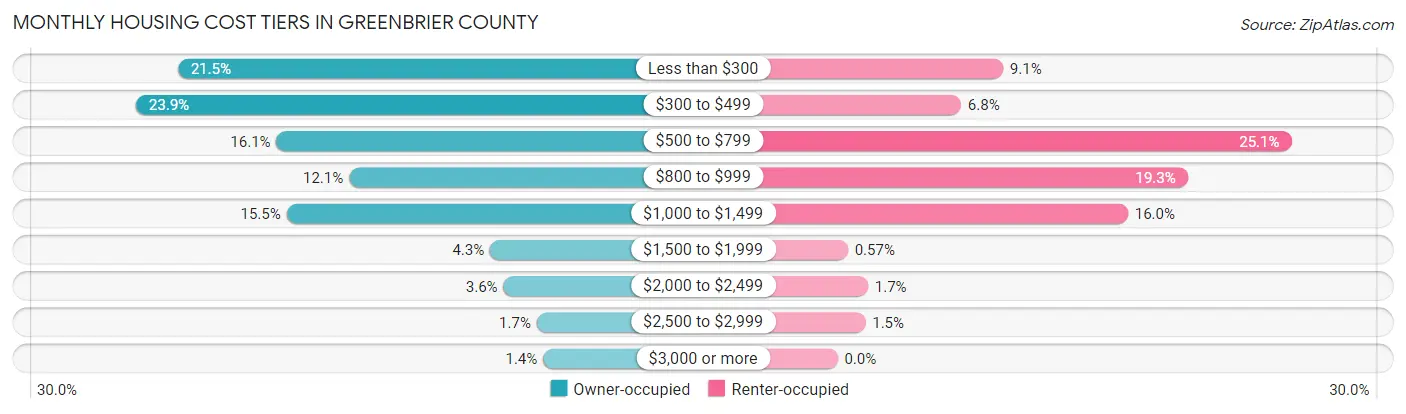
| Monthly Cost | Owner-occupied | Renter-occupied |
| Less than $300 | 2,375 (21.5%) | 338 (9.1%) |
| $300 to $499 | 2,630 (23.8%) | 252 (6.8%) |
| $500 to $799 | 1,774 (16.1%) | 927 (25.1%) |
| $800 to $999 | 1,332 (12.1%) | 715 (19.3%) |
| $1,000 to $1,499 | 1,712 (15.5%) | 593 (16.0%) |
| $1,500 to $1,999 | 473 (4.3%) | 21 (0.6%) |
| $2,000 to $2,499 | 392 (3.5%) | 62 (1.7%) |
| $2,500 to $2,999 | 189 (1.7%) | 57 (1.5%) |
| $3,000 or more | 150 (1.4%) | 0 (0.0%) |
| Total | 11,027 (100.0%) | 3,697 (100.0%) |
Physical Housing Characteristics in Greenbrier County
Housing Structures in Greenbrier County
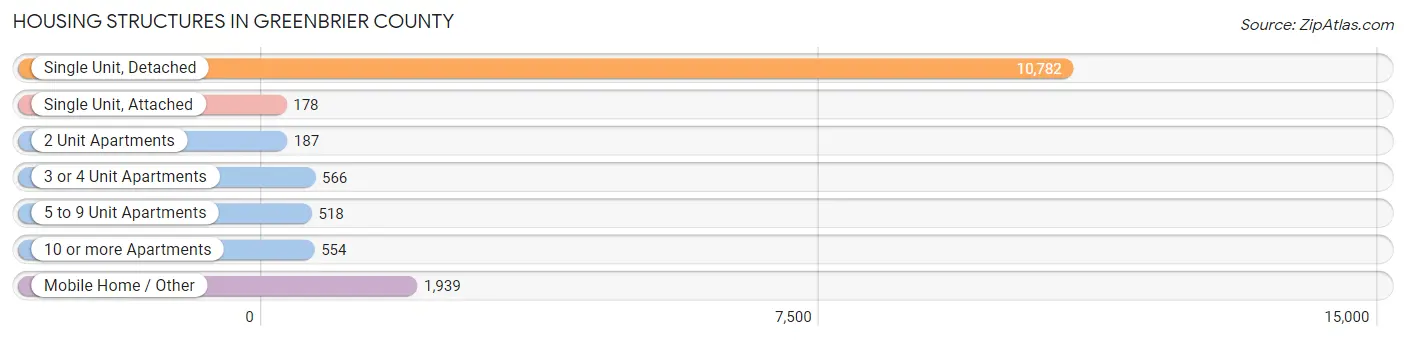
| Structure Type | # Housing Units | % Housing Units |
| Single Unit, Detached | 10,782 | 73.2% |
| Single Unit, Attached | 178 | 1.2% |
| 2 Unit Apartments | 187 | 1.3% |
| 3 or 4 Unit Apartments | 566 | 3.8% |
| 5 to 9 Unit Apartments | 518 | 3.5% |
| 10 or more Apartments | 554 | 3.8% |
| Mobile Home / Other | 1,939 | 13.2% |
| Total | 14,724 | 100.0% |
Housing Structures by Occupancy in Greenbrier County
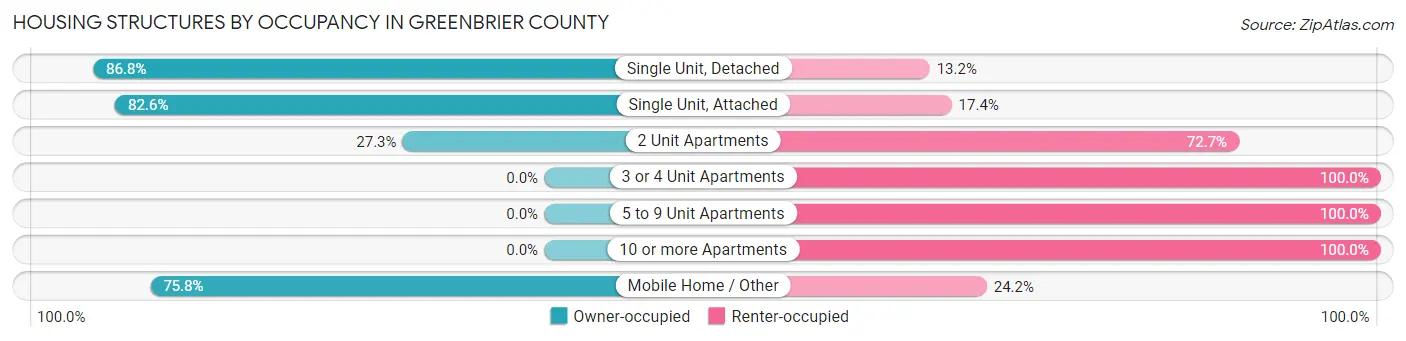
| Structure Type | Owner-occupied | Renter-occupied |
| Single Unit, Detached | 9,359 (86.8%) | 1,423 (13.2%) |
| Single Unit, Attached | 147 (82.6%) | 31 (17.4%) |
| 2 Unit Apartments | 51 (27.3%) | 136 (72.7%) |
| 3 or 4 Unit Apartments | 0 (0.0%) | 566 (100.0%) |
| 5 to 9 Unit Apartments | 0 (0.0%) | 518 (100.0%) |
| 10 or more Apartments | 0 (0.0%) | 554 (100.0%) |
| Mobile Home / Other | 1,470 (75.8%) | 469 (24.2%) |
| Total | 11,027 (74.9%) | 3,697 (25.1%) |
Housing Structures by Number of Rooms in Greenbrier County
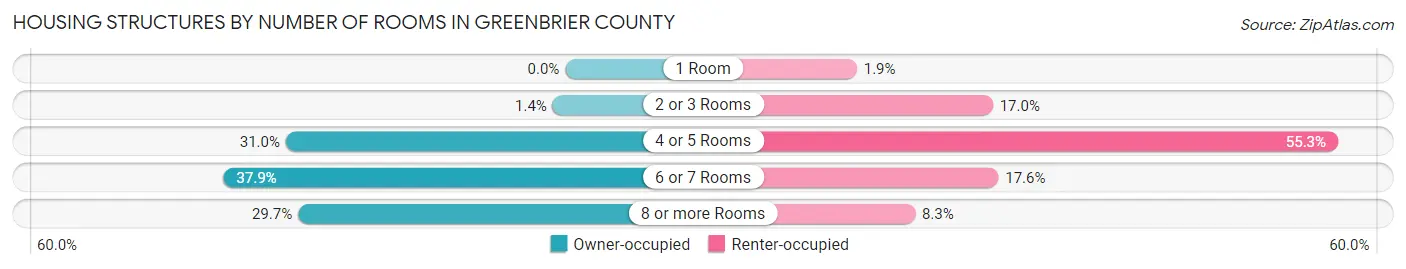
| Number of Rooms | Owner-occupied | Renter-occupied |
| 1 Room | 0 (0.0%) | 69 (1.9%) |
| 2 or 3 Rooms | 153 (1.4%) | 627 (17.0%) |
| 4 or 5 Rooms | 3,420 (31.0%) | 2,043 (55.3%) |
| 6 or 7 Rooms | 4,183 (37.9%) | 650 (17.6%) |
| 8 or more Rooms | 3,271 (29.7%) | 308 (8.3%) |
| Total | 11,027 (100.0%) | 3,697 (100.0%) |
Housing Structure by Heating Type in Greenbrier County
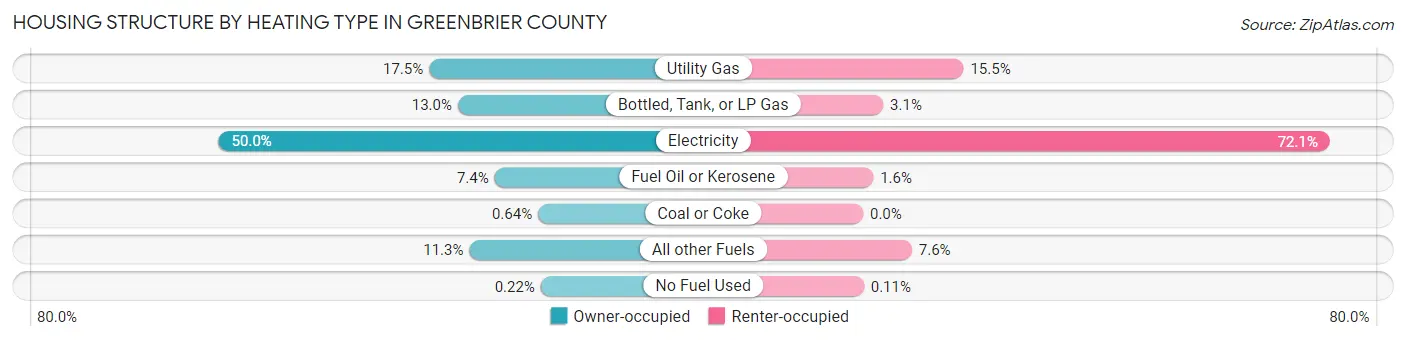
| Heating Type | Owner-occupied | Renter-occupied |
| Utility Gas | 1,928 (17.5%) | 574 (15.5%) |
| Bottled, Tank, or LP Gas | 1,437 (13.0%) | 115 (3.1%) |
| Electricity | 5,517 (50.0%) | 2,667 (72.1%) |
| Fuel Oil or Kerosene | 810 (7.3%) | 58 (1.6%) |
| Coal or Coke | 71 (0.6%) | 0 (0.0%) |
| All other Fuels | 1,240 (11.3%) | 279 (7.5%) |
| No Fuel Used | 24 (0.2%) | 4 (0.1%) |
| Total | 11,027 (100.0%) | 3,697 (100.0%) |
Household Vehicle Usage in Greenbrier County
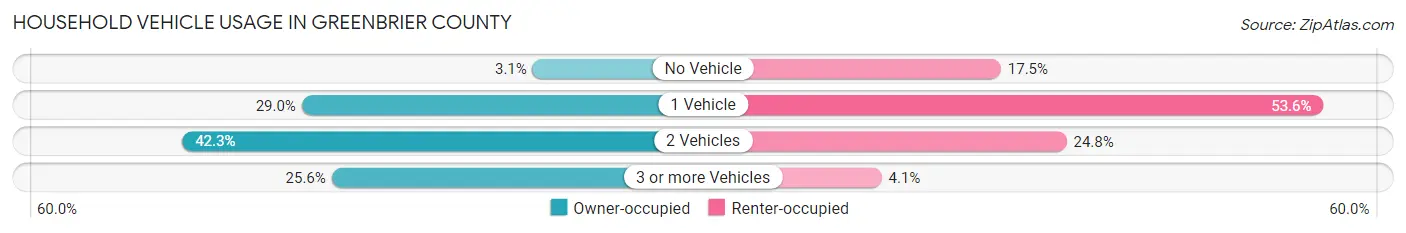
| Vehicles per Household | Owner-occupied | Renter-occupied |
| No Vehicle | 341 (3.1%) | 646 (17.5%) |
| 1 Vehicle | 3,193 (29.0%) | 1,981 (53.6%) |
| 2 Vehicles | 4,669 (42.3%) | 918 (24.8%) |
| 3 or more Vehicles | 2,824 (25.6%) | 152 (4.1%) |
| Total | 11,027 (100.0%) | 3,697 (100.0%) |
Real Estate & Mortgages in Greenbrier County
Real Estate and Mortgage Overview in Greenbrier County
| Characteristic | Without Mortgage | With Mortgage |
| Housing Units | 6,091 | 4,936 |
| Median Property Value | $110,500 | $160,000 |
| Median Household Income | $42,495 | $745 |
| Monthly Housing Costs | $353 | $145 |
| Real Estate Taxes | $561 | $230 |
Property Value by Mortgage Status in Greenbrier County
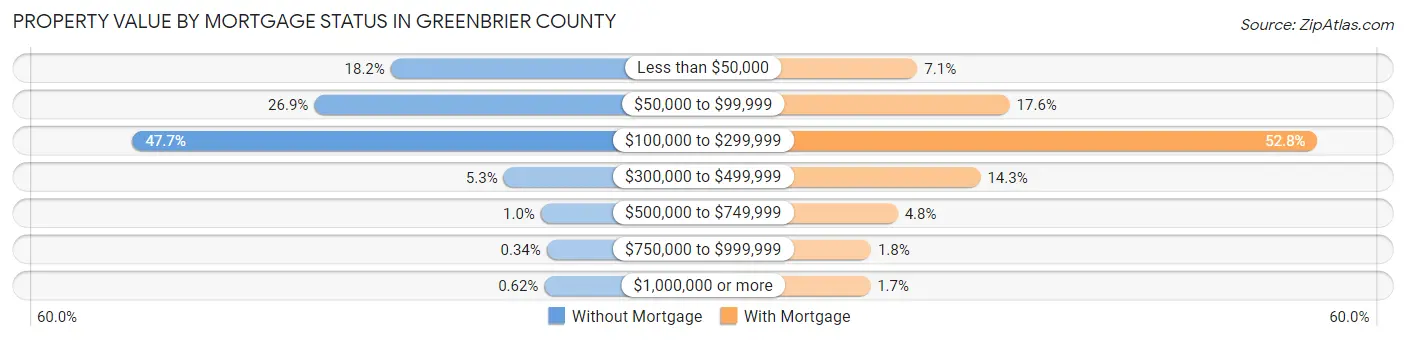
| Property Value | Without Mortgage | With Mortgage |
| Less than $50,000 | 1,107 (18.2%) | 349 (7.1%) |
| $50,000 to $99,999 | 1,639 (26.9%) | 869 (17.6%) |
| $100,000 to $299,999 | 2,903 (47.7%) | 2,605 (52.8%) |
| $300,000 to $499,999 | 321 (5.3%) | 705 (14.3%) |
| $500,000 to $749,999 | 62 (1.0%) | 238 (4.8%) |
| $750,000 to $999,999 | 21 (0.3%) | 87 (1.8%) |
| $1,000,000 or more | 38 (0.6%) | 83 (1.7%) |
| Total | 6,091 (100.0%) | 4,936 (100.0%) |
Household Income by Mortgage Status in Greenbrier County
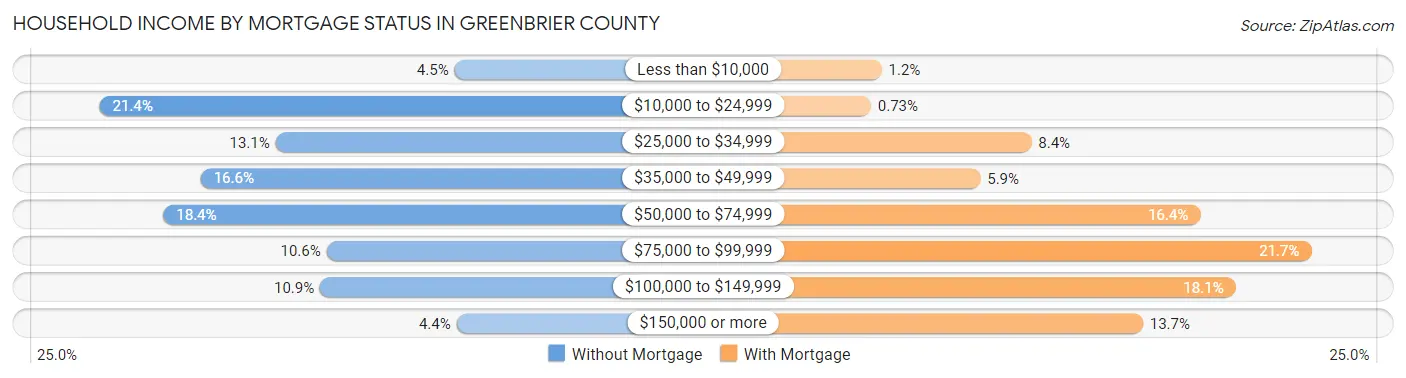
| Household Income | Without Mortgage | With Mortgage |
| Less than $10,000 | 276 (4.5%) | 61 (1.2%) |
| $10,000 to $24,999 | 1,305 (21.4%) | 36 (0.7%) |
| $25,000 to $34,999 | 795 (13.1%) | 413 (8.4%) |
| $35,000 to $49,999 | 1,012 (16.6%) | 293 (5.9%) |
| $50,000 to $74,999 | 1,120 (18.4%) | 810 (16.4%) |
| $75,000 to $99,999 | 647 (10.6%) | 1,071 (21.7%) |
| $100,000 to $149,999 | 666 (10.9%) | 893 (18.1%) |
| $150,000 or more | 270 (4.4%) | 675 (13.7%) |
| Total | 6,091 (100.0%) | 4,936 (100.0%) |
Property Value to Household Income Ratio in Greenbrier County
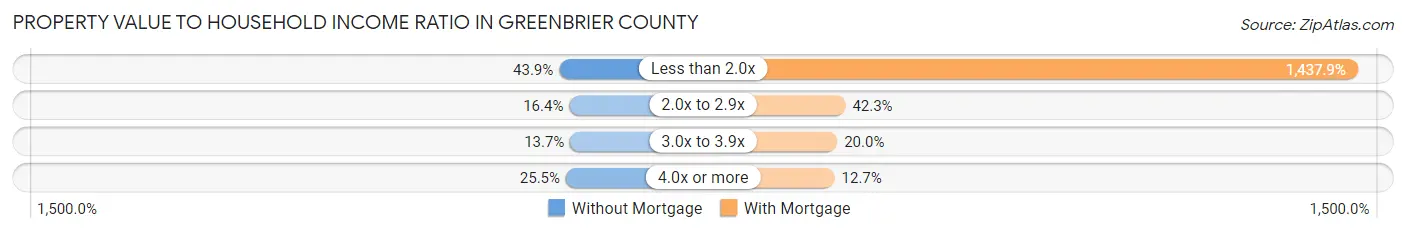
| Value-to-Income Ratio | Without Mortgage | With Mortgage |
| Less than 2.0x | 2,672 (43.9%) | 70,976 (1,437.9%) |
| 2.0x to 2.9x | 998 (16.4%) | 2,088 (42.3%) |
| 3.0x to 3.9x | 835 (13.7%) | 987 (20.0%) |
| 4.0x or more | 1,554 (25.5%) | 629 (12.7%) |
| Total | 6,091 (100.0%) | 4,936 (100.0%) |
Real Estate Taxes by Mortgage Status in Greenbrier County
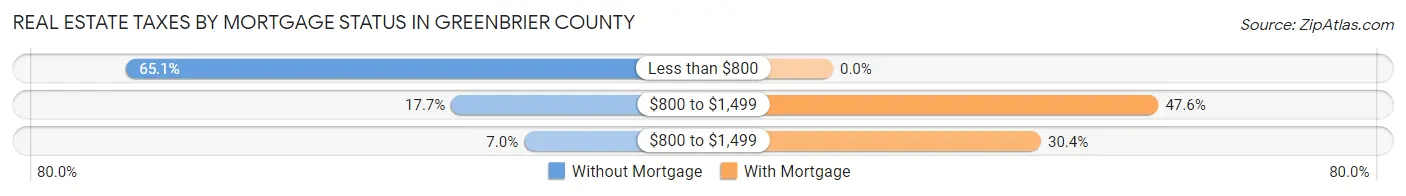
| Property Taxes | Without Mortgage | With Mortgage |
| Less than $800 | 3,967 (65.1%) | 0 (0.0%) |
| $800 to $1,499 | 1,077 (17.7%) | 2,347 (47.5%) |
| $800 to $1,499 | 428 (7.0%) | 1,500 (30.4%) |
| Total | 6,091 (100.0%) | 4,936 (100.0%) |
Health & Disability in Greenbrier County
Health Insurance Coverage by Age in Greenbrier County
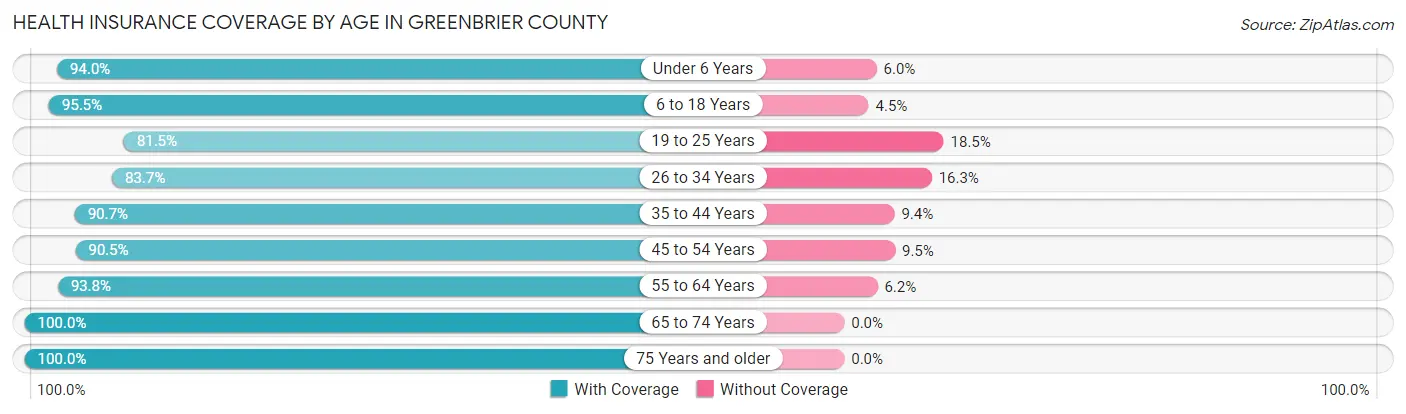
| Age Bracket | With Coverage | Without Coverage |
| Under 6 Years | 1,980 (94.0%) | 127 (6.0%) |
| 6 to 18 Years | 4,316 (95.5%) | 205 (4.5%) |
| 19 to 25 Years | 1,738 (81.5%) | 395 (18.5%) |
| 26 to 34 Years | 2,835 (83.7%) | 552 (16.3%) |
| 35 to 44 Years | 3,295 (90.6%) | 340 (9.3%) |
| 45 to 54 Years | 3,655 (90.5%) | 382 (9.5%) |
| 55 to 64 Years | 4,710 (93.8%) | 310 (6.2%) |
| 65 to 74 Years | 4,530 (100.0%) | 0 (0.0%) |
| 75 Years and older | 3,037 (100.0%) | 0 (0.0%) |
| Total | 30,096 (92.9%) | 2,311 (7.1%) |
Health Insurance Coverage by Citizenship Status in Greenbrier County
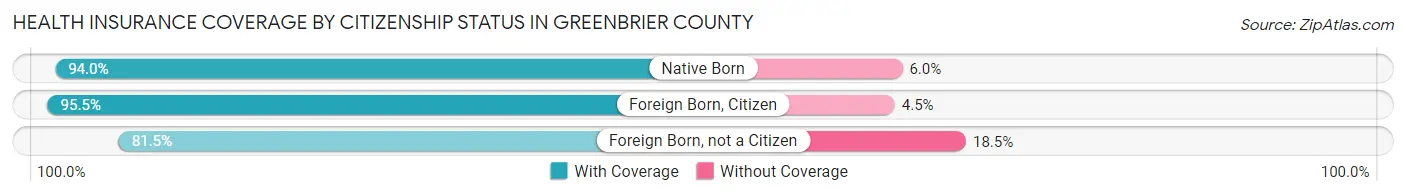
| Citizenship Status | With Coverage | Without Coverage |
| Native Born | 1,980 (94.0%) | 127 (6.0%) |
| Foreign Born, Citizen | 4,316 (95.5%) | 205 (4.5%) |
| Foreign Born, not a Citizen | 1,738 (81.5%) | 395 (18.5%) |
Health Insurance Coverage by Household Income in Greenbrier County
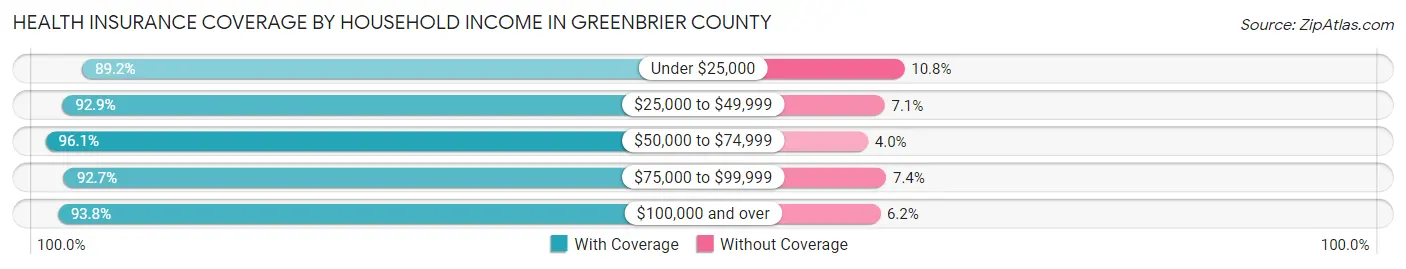
| Household Income | With Coverage | Without Coverage |
| Under $25,000 | 5,854 (89.2%) | 707 (10.8%) |
| $25,000 to $49,999 | 7,809 (92.9%) | 594 (7.1%) |
| $50,000 to $74,999 | 5,348 (96.1%) | 220 (4.0%) |
| $75,000 to $99,999 | 4,489 (92.6%) | 356 (7.3%) |
| $100,000 and over | 6,537 (93.8%) | 433 (6.2%) |
Public vs Private Health Insurance Coverage by Age in Greenbrier County
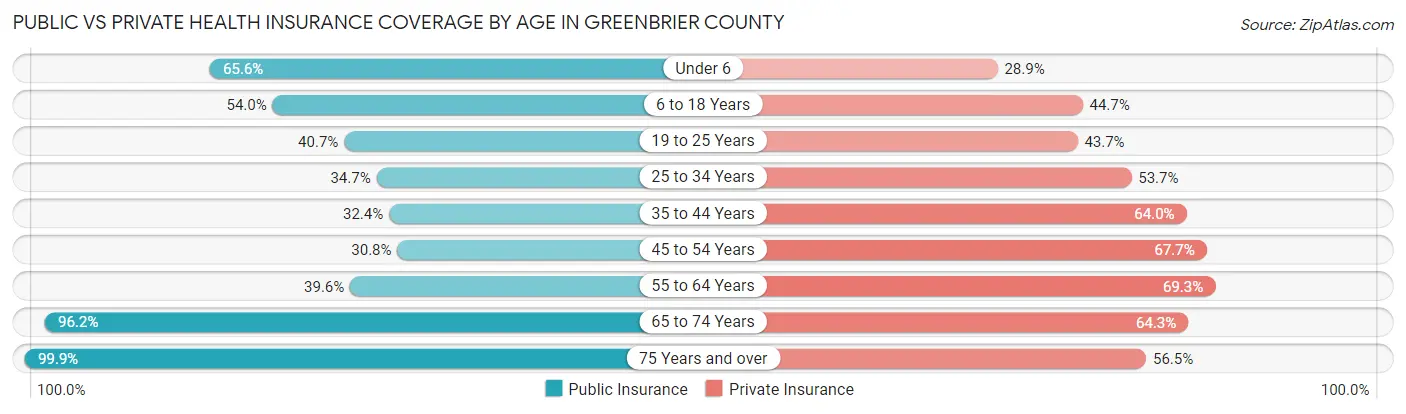
| Age Bracket | Public Insurance | Private Insurance |
| Under 6 | 1,382 (65.6%) | 609 (28.9%) |
| 6 to 18 Years | 2,440 (54.0%) | 2,020 (44.7%) |
| 19 to 25 Years | 868 (40.7%) | 933 (43.7%) |
| 25 to 34 Years | 1,175 (34.7%) | 1,820 (53.7%) |
| 35 to 44 Years | 1,176 (32.4%) | 2,325 (64.0%) |
| 45 to 54 Years | 1,244 (30.8%) | 2,733 (67.7%) |
| 55 to 64 Years | 1,987 (39.6%) | 3,478 (69.3%) |
| 65 to 74 Years | 4,358 (96.2%) | 2,911 (64.3%) |
| 75 Years and over | 3,035 (99.9%) | 1,715 (56.5%) |
| Total | 17,665 (54.5%) | 18,544 (57.2%) |
Disability Status by Sex by Age in Greenbrier County
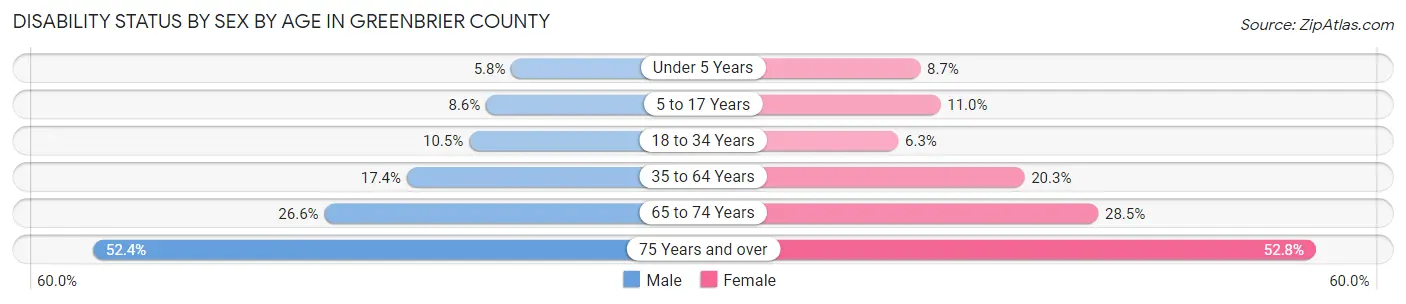
| Age Bracket | Male | Female |
| Under 5 Years | 53 (5.8%) | 73 (8.7%) |
| 5 to 17 Years | 197 (8.6%) | 252 (11.0%) |
| 18 to 34 Years | 305 (10.5%) | 182 (6.3%) |
| 35 to 64 Years | 1,065 (17.4%) | 1,337 (20.3%) |
| 65 to 74 Years | 578 (26.6%) | 673 (28.5%) |
| 75 Years and over | 680 (52.4%) | 918 (52.8%) |
Disability Class by Sex by Age in Greenbrier County
Disability Class: Hearing Difficulty
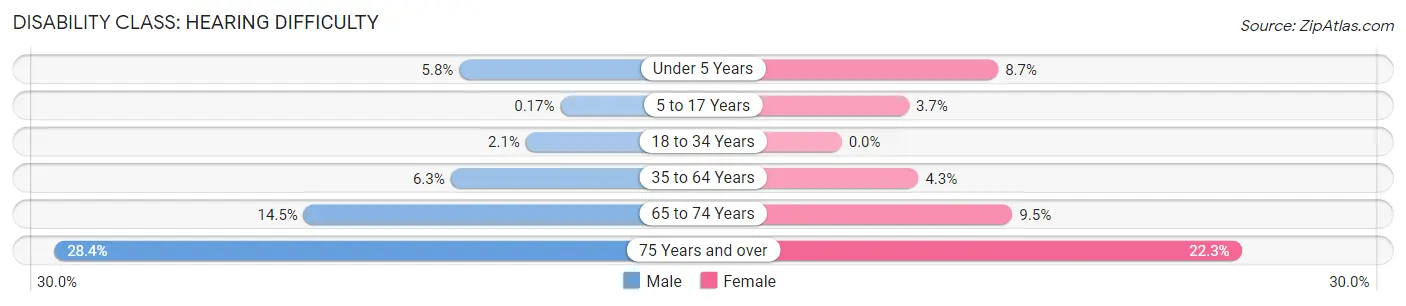
| Age Bracket | Male | Female |
| Under 5 Years | 53 (5.8%) | 73 (8.7%) |
| 5 to 17 Years | 4 (0.2%) | 86 (3.7%) |
| 18 to 34 Years | 61 (2.1%) | 0 (0.0%) |
| 35 to 64 Years | 384 (6.3%) | 281 (4.3%) |
| 65 to 74 Years | 314 (14.5%) | 224 (9.5%) |
| 75 Years and over | 368 (28.3%) | 387 (22.3%) |
Disability Class: Vision Difficulty
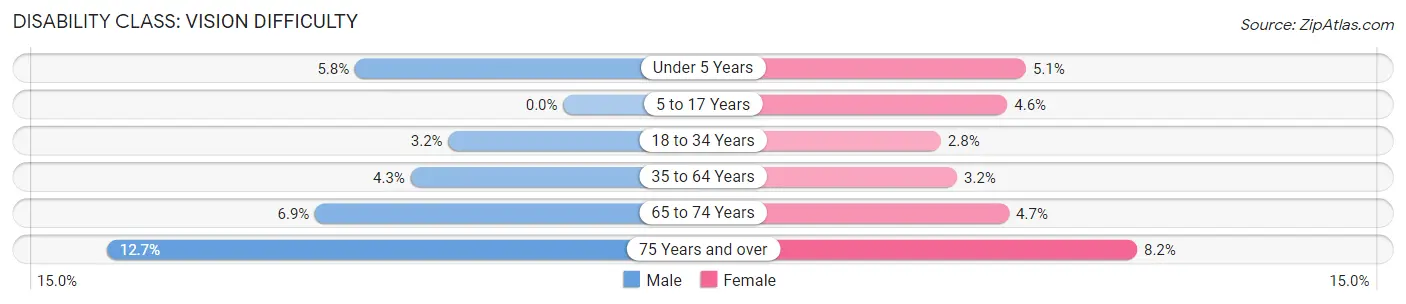
| Age Bracket | Male | Female |
| Under 5 Years | 53 (5.8%) | 43 (5.1%) |
| 5 to 17 Years | 0 (0.0%) | 106 (4.6%) |
| 18 to 34 Years | 93 (3.2%) | 80 (2.8%) |
| 35 to 64 Years | 260 (4.3%) | 211 (3.2%) |
| 65 to 74 Years | 150 (6.9%) | 110 (4.7%) |
| 75 Years and over | 165 (12.7%) | 143 (8.2%) |
Disability Class: Cognitive Difficulty
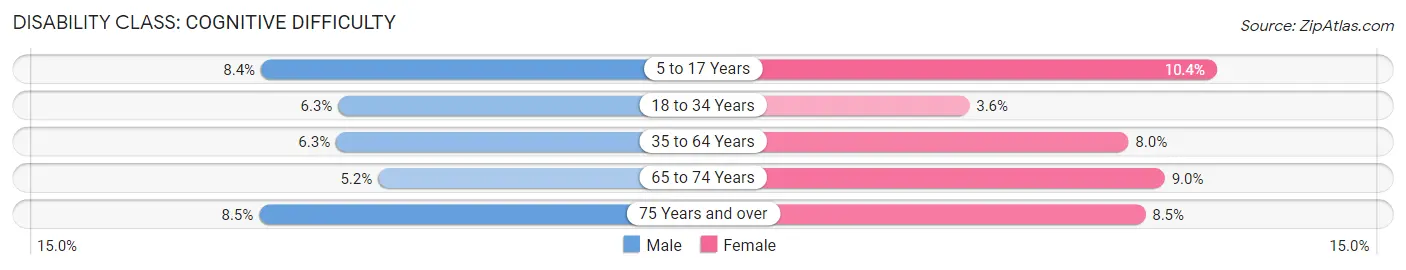
| Age Bracket | Male | Female |
| 5 to 17 Years | 193 (8.4%) | 240 (10.4%) |
| 18 to 34 Years | 182 (6.3%) | 103 (3.5%) |
| 35 to 64 Years | 387 (6.3%) | 525 (8.0%) |
| 65 to 74 Years | 112 (5.2%) | 212 (9.0%) |
| 75 Years and over | 110 (8.5%) | 147 (8.5%) |
Disability Class: Ambulatory Difficulty
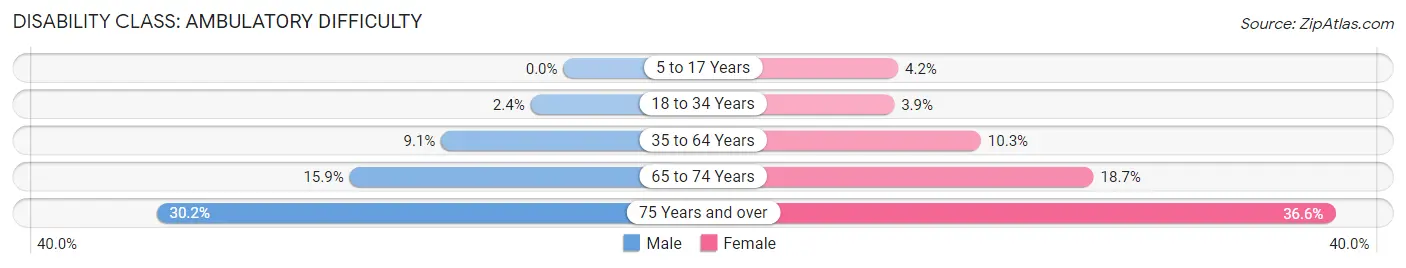
| Age Bracket | Male | Female |
| 5 to 17 Years | 0 (0.0%) | 96 (4.2%) |
| 18 to 34 Years | 71 (2.4%) | 113 (3.9%) |
| 35 to 64 Years | 554 (9.1%) | 680 (10.3%) |
| 65 to 74 Years | 345 (15.9%) | 441 (18.7%) |
| 75 Years and over | 392 (30.2%) | 637 (36.6%) |
Disability Class: Self-Care Difficulty
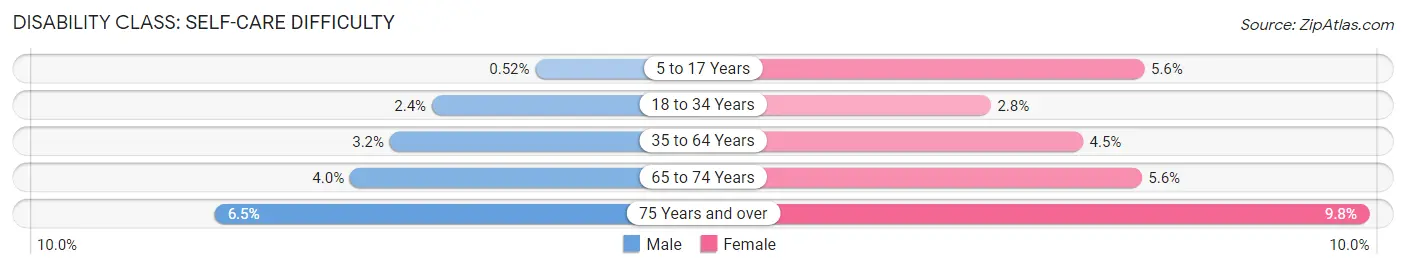
| Age Bracket | Male | Female |
| 5 to 17 Years | 12 (0.5%) | 129 (5.6%) |
| 18 to 34 Years | 71 (2.4%) | 80 (2.8%) |
| 35 to 64 Years | 197 (3.2%) | 294 (4.5%) |
| 65 to 74 Years | 86 (4.0%) | 131 (5.6%) |
| 75 Years and over | 84 (6.5%) | 170 (9.8%) |
Technology Access in Greenbrier County
Computing Device Access in Greenbrier County
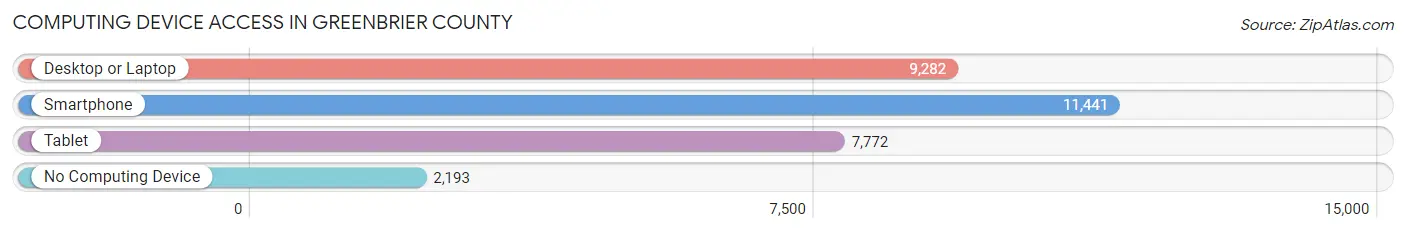
| Device Type | # Households | % Households |
| Desktop or Laptop | 9,282 | 63.0% |
| Smartphone | 11,441 | 77.7% |
| Tablet | 7,772 | 52.8% |
| No Computing Device | 2,193 | 14.9% |
| Total | 14,724 | 100.0% |
Internet Access in Greenbrier County
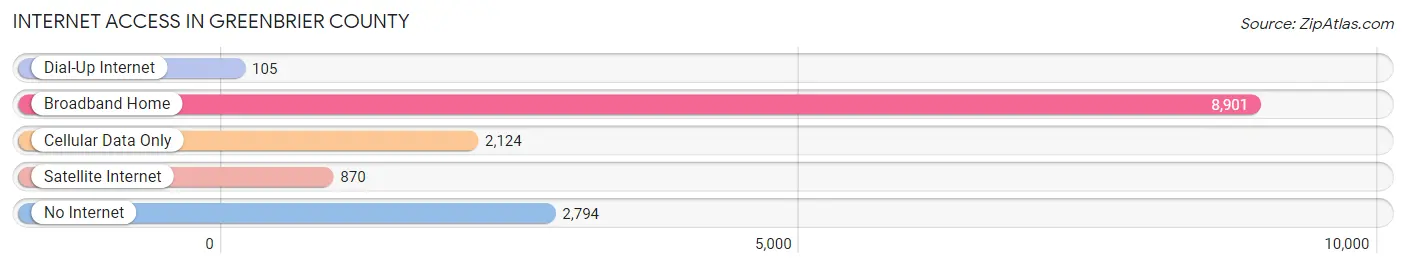
| Internet Type | # Households | % Households |
| Dial-Up Internet | 105 | 0.7% |
| Broadband Home | 8,901 | 60.5% |
| Cellular Data Only | 2,124 | 14.4% |
| Satellite Internet | 870 | 5.9% |
| No Internet | 2,794 | 19.0% |
| Total | 14,724 | 100.0% |
Greenbrier County Summary
Greenbrier County is located in the southeastern part of West Virginia, and is part of the Appalachian region. It is bordered by Monroe County to the north, Summers County to the east, Fayette County to the south, and Pocahontas County to the west. The county seat is Lewisburg, and the county has a total area of 1,068 square miles.
History
Greenbrier County was formed in 1778 from parts of Montgomery and Botetourt counties in Virginia. It was named for the Greenbrier River, which runs through the county. The county was part of the Trans-Allegheny region of Virginia, and was home to many Native American tribes, including the Shawnee, Cherokee, and Iroquois.
The first European settlers arrived in the area in the late 1700s, and the county was officially established in 1778. During the American Revolution, the county was a major center of activity, and was the site of several battles. After the war, the county grew rapidly, and by the mid-1800s, it was one of the most prosperous counties in the state.
During the Civil War, Greenbrier County was a major center of Confederate activity. The county was the site of several battles, including the Battle of Lewisburg in 1862. After the war, the county continued to grow, and by the early 1900s, it was one of the most prosperous counties in the state.
Geography
Greenbrier County is located in the southeastern part of West Virginia, and is part of the Appalachian region. It is bordered by Monroe County to the north, Summers County to the east, Fayette County to the south, and Pocahontas County to the west. The county seat is Lewisburg, and the county has a total area of 1,068 square miles.
The county is mostly mountainous, with the Allegheny Mountains running through the center of the county. The highest point in the county is Bald Knob, which has an elevation of 4,848 feet. The Greenbrier River runs through the county, and is a major tributary of the New River.
Economy
Greenbrier County has a diverse economy, with a mix of agriculture, manufacturing, and tourism. Agriculture is the largest sector of the economy, and the county is home to several large farms. The county is also home to several manufacturing companies, including a paper mill, a furniture factory, and a glass factory.
Tourism is also an important part of the economy, and the county is home to several popular attractions, including the Greenbrier Resort, the Lewisburg Historic District, and the Greenbrier River Trail. The county is also home to several state parks, including the Greenbrier State Forest and the Monongahela National Forest.
Demographics
As of the 2010 census, Greenbrier County had a population of 35,480. The population was spread out, with 24.3% under the age of 18, 8.2% from 18 to 24, 28.2% from 25 to 44, 24.7% from 45 to 64, and 14.6% who were 65 years of age or older. The median age was 38.4 years.
The median income for a household in the county was $41,945, and the median income for a family was $50,945. The per capita income for the county was $21,945. About 11.2% of families and 15.2% of the population were below the poverty line, including 21.2% of those under age 18 and 10.2% of those age 65 or over.
Common Questions
What is the Total Population of Greenbrier County?
Total Population of Greenbrier County is 32,995.
What is the Total Male Population of Greenbrier County?
Total Male Population of Greenbrier County is 16,010.
What is the Total Female Population of Greenbrier County?
Total Female Population of Greenbrier County is 16,985.
What is the Ratio of Males per 100 Females in Greenbrier County?
There are 94.26 Males per 100 Females in Greenbrier County.
What is the Ratio of Females per 100 Males in Greenbrier County?
There are 106.09 Females per 100 Males in Greenbrier County.
What is the Median Population Age in Greenbrier County?
Median Population Age in Greenbrier County is 46.6 Years.
What is the Average Family Size in Greenbrier County
Average Family Size in Greenbrier County is 2.8 People.
What is the Average Household Size in Greenbrier County
Average Household Size in Greenbrier County is 2.2 People.
What is Per Capita Income in Greenbrier County?
Per Capita income in Greenbrier County is $29,992.
What is the Median Family Income in Greenbrier County?
Median Family Income in Greenbrier County is $61,170.
What is the Median Household income in Greenbrier County?
Median Household Income in Greenbrier County is $45,519.
What is Income or Wage Gap in Greenbrier County?
Income or Wage Gap in Greenbrier County is 24.4%.
Women in Greenbrier County earn 75.6 cents for every dollar earned by a man.
What is Family Income Deficit in Greenbrier County?
Family Income Deficit in Greenbrier County is $9,319.
Families that are below poverty line in Greenbrier County earn $9,319 less on average than the poverty threshold level.
What is Inequality or Gini Index in Greenbrier County?
Inequality or Gini Index in Greenbrier County is 0.49.
How Large is the Labor Force in Greenbrier County?
There are 14,027 People in the Labor Forcein in Greenbrier County.
What is the Percentage of People in the Labor Force in Greenbrier County?
51.2% of People are in the Labor Force in Greenbrier County.
What is the Unemployment Rate in Greenbrier County?
Unemployment Rate in Greenbrier County is 4.3%.