Grant County, WV
Grant County Map

Grant County Overview
11,034
TOTAL POPULATION
5,564
MALE POPULATION
5,470
FEMALE POPULATION
101.72
MALES / 100 FEMALES
98.31
FEMALES / 100 MALES
46.2
MEDIAN AGE
3.4
AVG FAMILY SIZE
2.6
AVG HOUSEHOLD SIZE
$28,274
PER CAPITA INCOME
$69,000
AVG FAMILY INCOME
$52,877
AVG HOUSEHOLD INCOME
27.1%
WAGE / INCOME GAP [ % ]
72.9¢/ $1
WAGE / INCOME GAP [ $ ]
$13,262
FAMILY INCOME DEFICIT
0.43
INEQUALITY / GINI INDEX
5,340
LABOR FORCE [ PEOPLE ]
57.7%
PERCENT IN LABOR FORCE
5.3%
UNEMPLOYMENT RATE
Race in Grant County
The most populous races in Grant County are White / Caucasian (10,574 | 95.8%), Two or more Races (244 | 2.2%), and Black / African American (159 | 1.4%).

| Race | # Population | % Population |
| Asian | 29 | 0.3% |
| Black / African American | 159 | 1.4% |
| Hawaiian / Pacific | 26 | 0.2% |
| Hispanic or Latino | 48 | 0.4% |
| Native / Alaskan | 0 | 0.0% |
| White / Caucasian | 10,574 | 95.8% |
| Two or more Races | 244 | 2.2% |
| Some other Race | 2 | 0.0% |
| Total | 11,034 | 100.0% |
Ancestry in Grant County
The most populous ancestries reported in Grant County are German (3,112 | 28.2%), American (1,204 | 10.9%), Irish (610 | 5.5%), English (417 | 3.8%), and Italian (236 | 2.1%), together accounting for 50.6% of all Grant County residents.

| Ancestry | # Population | % Population |
| American | 1,204 | 10.9% |
| Austrian | 18 | 0.2% |
| Belgian | 4 | 0.0% |
| Bhutanese | 29 | 0.3% |
| Blackfeet | 35 | 0.3% |
| British | 58 | 0.5% |
| Cherokee | 8 | 0.1% |
| Dutch | 87 | 0.8% |
| Eastern European | 16 | 0.2% |
| English | 417 | 3.8% |
| European | 138 | 1.3% |
| French | 118 | 1.1% |
| French Canadian | 4 | 0.0% |
| German | 3,112 | 28.2% |
| Hungarian | 4 | 0.0% |
| Indian (Asian) | 17 | 0.2% |
| Irish | 610 | 5.5% |
| Italian | 236 | 2.1% |
| Lithuanian | 7 | 0.1% |
| Mexican | 11 | 0.1% |
| Norwegian | 19 | 0.2% |
| Polish | 133 | 1.2% |
| Puerto Rican | 27 | 0.2% |
| Russian | 17 | 0.2% |
| Samoan | 26 | 0.2% |
| Scandinavian | 11 | 0.1% |
| Scotch-Irish | 15 | 0.1% |
| Scottish | 79 | 0.7% |
| South African | 101 | 0.9% |
| South American | 10 | 0.1% |
| Subsaharan African | 152 | 1.4% |
| Swedish | 20 | 0.2% |
| Swiss | 9 | 0.1% |
| Ukrainian | 56 | 0.5% |
| Venezuelan | 10 | 0.1% |
| Welsh | 20 | 0.2% |
| Yugoslavian | 2 | 0.0% |
| Zimbabwean | 51 | 0.5% | View All 38 Rows |
Immigrants in Grant County
The most numerous immigrant groups reported in Grant County came from Africa (51 | 0.5%), Eastern Africa (51 | 0.5%), Zimbabwe (51 | 0.5%), Asia (29 | 0.3%), and Eastern Asia (29 | 0.3%), together accounting for 1.9% of all Grant County residents.

| Immigration Origin | # Population | % Population |
| Africa | 51 | 0.5% |
| Asia | 29 | 0.3% |
| Eastern Africa | 51 | 0.5% |
| Eastern Asia | 29 | 0.3% |
| Korea | 29 | 0.3% |
| Latin America | 10 | 0.1% |
| South America | 10 | 0.1% |
| Venezuela | 10 | 0.1% |
| Zimbabwe | 51 | 0.5% | View All 9 Rows |
Sex and Age in Grant County
Sex and Age in Grant County
The most populous age groups in Grant County are 55 to 59 Years (503 | 9.0%) for men and 55 to 59 Years (460 | 8.4%) for women.

| Age Bracket | Male | Female |
| Under 5 Years | 299 (5.4%) | 299 (5.5%) |
| 5 to 9 Years | 289 (5.2%) | 322 (5.9%) |
| 10 to 14 Years | 279 (5.0%) | 235 (4.3%) |
| 15 to 19 Years | 324 (5.8%) | 313 (5.7%) |
| 20 to 24 Years | 274 (4.9%) | 236 (4.3%) |
| 25 to 29 Years | 422 (7.6%) | 288 (5.3%) |
| 30 to 34 Years | 285 (5.1%) | 256 (4.7%) |
| 35 to 39 Years | 211 (3.8%) | 258 (4.7%) |
| 40 to 44 Years | 335 (6.0%) | 335 (6.1%) |
| 45 to 49 Years | 358 (6.4%) | 317 (5.8%) |
| 50 to 54 Years | 390 (7.0%) | 365 (6.7%) |
| 55 to 59 Years | 503 (9.0%) | 460 (8.4%) |
| 60 to 64 Years | 299 (5.4%) | 404 (7.4%) |
| 65 to 69 Years | 407 (7.3%) | 395 (7.2%) |
| 70 to 74 Years | 350 (6.3%) | 364 (6.7%) |
| 75 to 79 Years | 271 (4.9%) | 289 (5.3%) |
| 80 to 84 Years | 131 (2.4%) | 216 (4.0%) |
| 85 Years and over | 137 (2.5%) | 118 (2.2%) |
| Total | 5,564 (100.0%) | 5,470 (100.0%) |
Families and Households in Grant County
Median Family Size in Grant County
The median family size in Grant County is 3.37 persons per family, with single male/father families (147 | 5.8%) accounting for the largest median family size of 4.24 persons per family. On the other hand, married-couple families (2,079 | 81.8%) represent the smallest median family size with 3.23 persons per family.

| Family Type | # Families | Family Size |
| Married-Couple | 2,079 (81.8%) | 3.23 |
| Single Male/Father | 147 (5.8%) | 4.24 |
| Single Female/Mother | 316 (12.4%) | 3.93 |
| Total Families | 2,542 (100.0%) | 3.37 |
Median Household Size in Grant County
The median household size in Grant County is 2.62 persons per household, with single male/father households (147 | 3.5%) accounting for the largest median household size of 4.82 persons per household. non-family households (1,618 | 38.9%) represent the smallest median household size with 1.25 persons per household.

| Household Type | # Households | Household Size |
| Married-Couple | 2,079 (50.0%) | 3.24 |
| Single Male/Father | 147 (3.5%) | 4.82 |
| Single Female/Mother | 316 (7.6%) | 4.47 |
| Non-family | 1,618 (38.9%) | 1.25 |
| Total Households | 4,160 (100.0%) | 2.62 |
Household Size by Marriage Status in Grant County
Out of a total of 4,160 households in Grant County, 2,542 (61.1%) are family households, while 1,618 (38.9%) are nonfamily households. The most numerous type of family households are 2-person households, comprising 1,317, and the most common type of nonfamily households are 1-person households, comprising 1,425.

| Household Size | Family Households | Nonfamily Households |
| 1-Person Households | - | 1,425 (34.3%) |
| 2-Person Households | 1,317 (31.7%) | 182 (4.4%) |
| 3-Person Households | 494 (11.9%) | 0 (0.0%) |
| 4-Person Households | 464 (11.2%) | 11 (0.3%) |
| 5-Person Households | 189 (4.5%) | 0 (0.0%) |
| 6-Person Households | 66 (1.6%) | 0 (0.0%) |
| 7+ Person Households | 12 (0.3%) | 0 (0.0%) |
| Total | 2,542 (61.1%) | 1,618 (38.9%) |
Female Fertility in Grant County
Fertility by Age in Grant County
Average fertility rate in Grant County is 62.0 births per 1,000 women. Women in the age bracket of 20 to 34 years have the highest fertility rate with 146.0 births per 1,000 women. Women in the age bracket of 20 to 34 years acount for 91.2% of all women with births.

| Age Bracket | Women with Births | Births / 1,000 Women |
| 15 to 19 years | 0 (0.0%) | 0.0 |
| 20 to 34 years | 114 (91.2%) | 146.0 |
| 35 to 50 years | 11 (8.8%) | 12.0 |
| Total | 125 (100.0%) | 62.0 |
Fertility by Age by Marriage Status in Grant County
63.2% of women with births (125) in Grant County are married. The highest percentage of unmarried women with births falls into 20 to 34 years age bracket with 40.4% of them unmarried at the time of birth, while the lowest percentage of unmarried women with births belong to 35 to 50 years age bracket with 0.0% of them unmarried.

| Age Bracket | Married | Unmarried |
| 15 to 19 years | 0 (0.0%) | 0 (0.0%) |
| 20 to 34 years | 68 (59.7%) | 46 (40.4%) |
| 35 to 50 years | 11 (100.0%) | 0 (0.0%) |
| Total | 79 (63.2%) | 46 (36.8%) |
Fertility by Education in Grant County

| Educational Attainment | Women with Births | Births / 1,000 Women |
| Less than High School | 11 (8.8%) | 34.0 |
| High School Diploma | 50 (40.0%) | 75.0 |
| College or Associate's Degree | 64 (51.2%) | 104.0 |
| Bachelor's Degree | 0 (0.0%) | 0.0 |
| Graduate Degree | 0 (0.0%) | 0.0 |
| Total | 125 (100.0%) | 62.0 |
Fertility by Education by Marriage Status in Grant County
36.8% of women with births in Grant County are unmarried. Women with the educational attainment of less than high school are most likely to be married with 100.0% of them married at childbirth, while women with the educational attainment of high school diploma are least likely to be married with 64.0% of them unmarried at childbirth.

| Educational Attainment | Married | Unmarried |
| Less than High School | 11 (100.0%) | 0 (0.0%) |
| High School Diploma | 18 (36.0%) | 32 (64.0%) |
| College or Associate's Degree | 50 (78.1%) | 14 (21.9%) |
| Bachelor's Degree | 0 (0.0%) | 0 (0.0%) |
| Graduate Degree | 0 (0.0%) | 0 (0.0%) |
| Total | 79 (63.2%) | 46 (36.8%) |
Income in Grant County
Income Overview in Grant County
Per Capita Income in Grant County is $28,274, while median incomes of families and households are $69,000 and $52,877 respectively.
| Characteristic | Number | Measure |
| Per Capita Income | 11,034 | $28,274 |
| Median Family Income | 2,542 | $69,000 |
| Mean Family Income | 2,542 | $82,795 |
| Median Household Income | 4,160 | $52,877 |
| Mean Household Income | 4,160 | $65,368 |
| Income Deficit | 2,542 | $13,262 |
| Wage / Income Gap (%) | 11,034 | 27.11% |
| Wage / Income Gap ($) | 11,034 | 72.89¢ per $1 |
| Gini / Inequality Index | 11,034 | 0.43 |
Earnings by Sex in Grant County
Average Earnings in Grant County are $33,582, $40,714 for men and $29,675 for women, a difference of 27.1%.

| Sex | Number | Average Earnings |
| Male | 2,896 (52.6%) | $40,714 |
| Female | 2,614 (47.4%) | $29,675 |
| Total | 5,510 (100.0%) | $33,582 |
Earnings by Sex by Income Bracket in Grant County
The most common earnings brackets in Grant County are $45,000 to $49,999 for men (350 | 12.1%) and $30,000 to $34,999 for women (361 | 13.8%).

| Income | Male | Female |
| $2,499 or less | 108 (3.7%) | 180 (6.9%) |
| $2,500 to $4,999 | 99 (3.4%) | 32 (1.2%) |
| $5,000 to $7,499 | 163 (5.6%) | 109 (4.2%) |
| $7,500 to $9,999 | 13 (0.4%) | 91 (3.5%) |
| $10,000 to $12,499 | 87 (3.0%) | 65 (2.5%) |
| $12,500 to $14,999 | 76 (2.6%) | 169 (6.5%) |
| $15,000 to $17,499 | 58 (2.0%) | 111 (4.3%) |
| $17,500 to $19,999 | 112 (3.9%) | 57 (2.2%) |
| $20,000 to $22,499 | 55 (1.9%) | 214 (8.2%) |
| $22,500 to $24,999 | 48 (1.7%) | 23 (0.9%) |
| $25,000 to $29,999 | 126 (4.3%) | 275 (10.5%) |
| $30,000 to $34,999 | 233 (8.1%) | 361 (13.8%) |
| $35,000 to $39,999 | 256 (8.8%) | 242 (9.3%) |
| $40,000 to $44,999 | 111 (3.8%) | 158 (6.0%) |
| $45,000 to $49,999 | 350 (12.1%) | 105 (4.0%) |
| $50,000 to $54,999 | 174 (6.0%) | 3 (0.1%) |
| $55,000 to $64,999 | 225 (7.8%) | 183 (7.0%) |
| $65,000 to $74,999 | 194 (6.7%) | 80 (3.1%) |
| $75,000 to $99,999 | 215 (7.4%) | 61 (2.3%) |
| $100,000+ | 193 (6.7%) | 95 (3.6%) |
| Total | 2,896 (100.0%) | 2,614 (100.0%) |
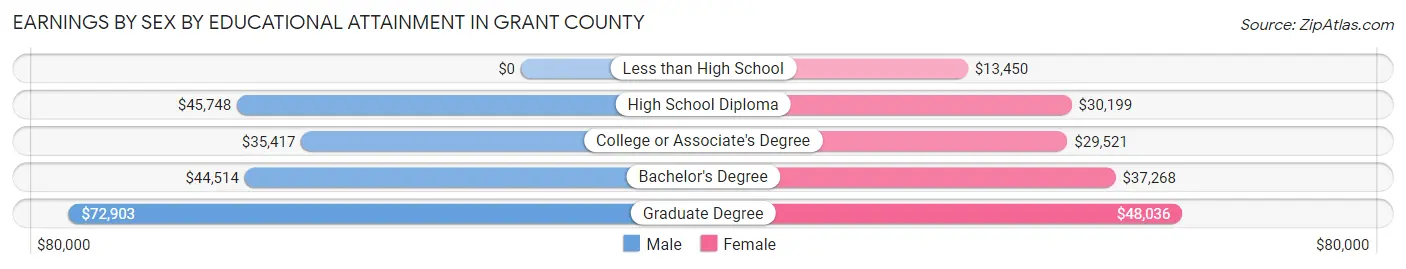
Earnings by Sex by Educational Attainment in Grant County
Average earnings in Grant County are $45,476 for men and $31,135 for women, a difference of 31.5%. Men with an educational attainment of graduate degree enjoy the highest average annual earnings of $72,903, while those with college or associate's degree education earn the least with $35,417. Women with an educational attainment of graduate degree earn the most with the average annual earnings of $48,036, while those with less than high school education have the smallest earnings of $13,450.
| Educational Attainment | Male Income | Female Income |
| Less than High School | - | - |
| High School Diploma | $45,748 | $30,199 |
| College or Associate's Degree | $35,417 | $29,521 |
| Bachelor's Degree | $44,514 | $37,268 |
| Graduate Degree | $72,903 | $48,036 |
| Total | $45,476 | $31,135 |
Family Income in Grant County
Family Income Brackets in Grant County
According to the Grant County family income data, there are 653 families falling into the $50,000 to $74,999 income range, which is the most common income bracket and makes up 25.7% of all families. Conversely, the less than $10,000 income bracket is the least frequent group with only 53 families (2.1%) belonging to this category.

| Income Bracket | # Families | % Families |
| Less than $10,000 | 53 | 2.1% |
| $10,000 to $14,999 | 61 | 2.4% |
| $15,000 to $24,999 | 66 | 2.6% |
| $25,000 to $34,999 | 130 | 5.1% |
| $35,000 to $49,999 | 455 | 17.9% |
| $50,000 to $74,999 | 653 | 25.7% |
| $75,000 to $99,999 | 455 | 17.9% |
| $100,000 to $149,999 | 452 | 17.8% |
| $150,000 to $199,999 | 102 | 4.0% |
| $200,000+ | 114 | 4.5% |
Family Income by Famaliy Size in Grant County
6-person families (78 | 3.1%) account for the highest median family income in Grant County with $103,750 per family, while 2-person families (1,396 | 54.9%) have the highest median income of $30,296 per family member.

| Income Bracket | # Families | Median Income |
| 2-Person Families | 1,396 (54.9%) | $60,592 |
| 3-Person Families | 473 (18.6%) | $69,269 |
| 4-Person Families | 408 (16.1%) | $94,808 |
| 5-Person Families | 187 (7.4%) | $94,455 |
| 6-Person Families | 78 (3.1%) | $103,750 |
| 7+ Person Families | 0 (0.0%) | $0 |
| Total | 2,542 (100.0%) | $69,000 |
Family Income by Number of Earners in Grant County
The median family income in Grant County is $69,000, with families comprising 3+ earners (312) having the highest median family income of $114,063, while families with no earners (478) have the lowest median family income of $46,000, accounting for 12.3% and 18.8% of families, respectively.

| Number of Earners | # Families | Median Income |
| No Earners | 478 (18.8%) | $46,000 |
| 1 Earner | 844 (33.2%) | $49,688 |
| 2 Earners | 908 (35.7%) | $91,711 |
| 3+ Earners | 312 (12.3%) | $114,063 |
| Total | 2,542 (100.0%) | $69,000 |
Household Income in Grant County
Household Income Brackets in Grant County
With 928 households falling in the category, the $50,000 to $74,999 income range is the most frequent in Grant County, accounting for 22.3% of all households. In contrast, only 104 households (2.5%) fall into the $150,000 to $199,999 income bracket, making it the least populous group.

| Income Bracket | # Households | % Households |
| Less than $10,000 | 275 | 6.6% |
| $10,000 to $14,999 | 208 | 5.0% |
| $15,000 to $24,999 | 433 | 10.4% |
| $25,000 to $34,999 | 491 | 11.8% |
| $35,000 to $49,999 | 591 | 14.2% |
| $50,000 to $74,999 | 928 | 22.3% |
| $75,000 to $99,999 | 491 | 11.8% |
| $100,000 to $149,999 | 512 | 12.3% |
| $150,000 to $199,999 | 104 | 2.5% |
| $200,000+ | 133 | 3.2% |
Household Income by Householder Age in Grant County
The median household income in Grant County is $52,877, with the highest median household income of $73,750 found in the 25 to 44 years age bracket for the primary householder. A total of 872 households (21.0%) fall into this category. Meanwhile, the 65+ years age bracket for the primary householder has the lowest median household income of $40,625, with 1,607 households (38.6%) in this group.

| Income Bracket | # Households | Median Income |
| 15 to 24 Years | 77 (1.8%) | $53,073 |
| 25 to 44 Years | 872 (21.0%) | $73,750 |
| 45 to 64 Years | 1,604 (38.6%) | $58,430 |
| 65+ Years | 1,607 (38.6%) | $40,625 |
| Total | 4,160 (100.0%) | $52,877 |
Poverty in Grant County
Income Below Poverty by Sex and Age in Grant County
With 12.0% poverty level for males and 11.4% for females among the residents of Grant County, 35 to 44 year old males and 18 to 24 year old females are the most vulnerable to poverty, with 102 males (18.7%) and 79 females (21.3%) in their respective age groups living below the poverty level.

| Age Bracket | Male | Female |
| Under 5 Years | 26 (8.7%) | 29 (9.7%) |
| 5 Years | 0 (0.0%) | 5 (8.3%) |
| 6 to 11 Years | 41 (11.2%) | 74 (21.0%) |
| 12 to 14 Years | 20 (12.0%) | 22 (15.3%) |
| 15 Years | 0 (0.0%) | 0 (0.0%) |
| 16 and 17 Years | 12 (7.5%) | 0 (0.0%) |
| 18 to 24 Years | 28 (6.8%) | 79 (21.3%) |
| 25 to 34 Years | 42 (5.9%) | 46 (8.5%) |
| 35 to 44 Years | 102 (18.7%) | 38 (6.4%) |
| 45 to 54 Years | 126 (16.8%) | 98 (14.4%) |
| 55 to 64 Years | 84 (10.5%) | 45 (5.2%) |
| 65 to 74 Years | 104 (14.0%) | 79 (10.5%) |
| 75 Years and over | 80 (15.5%) | 100 (17.9%) |
| Total | 665 (12.0%) | 615 (11.4%) |
Income Above Poverty by Sex and Age in Grant County
According to the poverty statistics in Grant County, males aged 5 years and females aged 15 years are the age groups that are most secure financially, with 100.0% of males and 100.0% of females in these age groups living above the poverty line.

| Age Bracket | Male | Female |
| Under 5 Years | 273 (91.3%) | 270 (90.3%) |
| 5 Years | 35 (100.0%) | 55 (91.7%) |
| 6 to 11 Years | 325 (88.8%) | 279 (79.0%) |
| 12 to 14 Years | 147 (88.0%) | 122 (84.7%) |
| 15 Years | 28 (100.0%) | 28 (100.0%) |
| 16 and 17 Years | 148 (92.5%) | 150 (100.0%) |
| 18 to 24 Years | 382 (93.2%) | 292 (78.7%) |
| 25 to 34 Years | 665 (94.1%) | 498 (91.5%) |
| 35 to 44 Years | 444 (81.3%) | 555 (93.6%) |
| 45 to 54 Years | 622 (83.2%) | 584 (85.6%) |
| 55 to 64 Years | 714 (89.5%) | 819 (94.8%) |
| 65 to 74 Years | 638 (86.0%) | 671 (89.5%) |
| 75 Years and over | 436 (84.5%) | 458 (82.1%) |
| Total | 4,857 (88.0%) | 4,781 (88.6%) |
Income Below Poverty Among Married-Couple Families in Grant County
The poverty statistics for married-couple families in Grant County show that 2.1% or 44 of the total 2,079 families live below the poverty line. Families with 1 or 2 children have the highest poverty rate of 3.2%, comprising of 19 families. On the other hand, families with 3 or 4 children have the lowest poverty rate of 0.0%, which includes 0 families.

| Children | Above Poverty | Below Poverty |
| No Children | 1,338 (98.2%) | 25 (1.8%) |
| 1 or 2 Children | 568 (96.8%) | 19 (3.2%) |
| 3 or 4 Children | 129 (100.0%) | 0 (0.0%) |
| 5 or more Children | 0 (0.0%) | 0 (0.0%) |
| Total | 2,035 (97.9%) | 44 (2.1%) |
Income Below Poverty Among Single-Parent Households in Grant County
According to the poverty data in Grant County, 31.3% or 46 single-father households and 19.6% or 62 single-mother households are living below the poverty line. Among single-father households, those with 3 or 4 children have the highest poverty rate, with 27 households (100.0%) experiencing poverty. Likewise, among single-mother households, those with 3 or 4 children have the highest poverty rate, with 14 households (50.0%) falling below the poverty line.

| Children | Single Father | Single Mother |
| No Children | 15 (17.6%) | 11 (11.1%) |
| 1 or 2 Children | 4 (11.4%) | 37 (19.6%) |
| 3 or 4 Children | 27 (100.0%) | 14 (50.0%) |
| 5 or more Children | 0 (0.0%) | 0 (0.0%) |
| Total | 46 (31.3%) | 62 (19.6%) |
Income Below Poverty Among Married-Couple vs Single-Parent Households in Grant County
The poverty data for Grant County shows that 44 of the married-couple family households (2.1%) and 108 of the single-parent households (23.3%) are living below the poverty level. Within the married-couple family households, those with 1 or 2 children have the highest poverty rate, with 19 households (3.2%) falling below the poverty line. Among the single-parent households, those with 3 or 4 children have the highest poverty rate, with 41 household (74.6%) living below poverty.

| Children | Married-Couple Families | Single-Parent Households |
| No Children | 25 (1.8%) | 26 (14.1%) |
| 1 or 2 Children | 19 (3.2%) | 41 (18.3%) |
| 3 or 4 Children | 0 (0.0%) | 41 (74.6%) |
| 5 or more Children | 0 (0.0%) | 0 (0.0%) |
| Total | 44 (2.1%) | 108 (23.3%) |
Employment Characteristics in Grant County
Employment by Class of Employer in Grant County
Among the 4,973 employed individuals in Grant County, private company employees (3,386 | 68.1%), local government employees (536 | 10.8%), and state government employees (329 | 6.6%) make up the most common classes of employment.

| Employer Class | # Employees | % Employees |
| Private Company Employees | 3,386 | 68.1% |
| Self-Employed (Incorporated) | 121 | 2.4% |
| Self-Employed (Not Incorporated) | 322 | 6.5% |
| Not-for-profit Organizations | 201 | 4.0% |
| Local Government Employees | 536 | 10.8% |
| State Government Employees | 329 | 6.6% |
| Federal Government Employees | 78 | 1.6% |
| Unpaid Family Workers | 0 | 0.0% |
| Total | 4,973 | 100.0% |
Employment Status by Age in Grant County
According to the labor force statistics for Grant County, out of the total population over 16 years of age (9,255), 57.7% or 5,340 individuals are in the labor force, with 5.3% or 283 of them unemployed. The age group with the highest labor force participation rate is 35 to 44 years, with 89.7% or 1,022 individuals in the labor force. Within the labor force, the 20 to 24 years age range has the highest percentage of unemployed individuals, with 23.2% or 89 of them being unemployed.

| Age Bracket | In Labor Force | Unemployed |
| 16 to 19 Years | 282 (48.5%) | 57 (20.2%) |
| 20 to 24 Years | 384 (75.3%) | 89 (23.2%) |
| 25 to 29 Years | 608 (85.6%) | 12 (2.0%) |
| 30 to 34 Years | 428 (79.1%) | 0 (0.0%) |
| 35 to 44 Years | 1,022 (89.7%) | 47 (4.6%) |
| 45 to 54 Years | 1,118 (78.2%) | 63 (5.6%) |
| 55 to 59 Years | 688 (71.4%) | 16 (2.3%) |
| 60 to 64 Years | 457 (65.0%) | 0 (0.0%) |
| 65 to 74 Years | 309 (20.4%) | 0 (0.0%) |
| 75 Years and over | 43 (3.7%) | 0 (0.0%) |
| Total | 5,340 (57.7%) | 283 (5.3%) |
Employment Status by Educational Attainment in Grant County
According to labor force statistics for Grant County, 78.8% of individuals (4,323) out of the total population between 25 and 64 years of age (5,486) are in the labor force, with 3.2% or 138 of them being unemployed. The group with the highest labor force participation rate are those with the educational attainment of bachelor's degree or higher, with 90.0% or 776 individuals in the labor force. Within the labor force, individuals with less than high school education have the highest percentage of unemployment, with 9.0% or 23 of them being unemployed.

| Educational Attainment | In Labor Force | Unemployed |
| Less than High School | 255 (49.1%) | 47 (9.0%) |
| High School Diploma | 2,207 (77.9%) | 127 (4.5%) |
| College / Associate Degree | 1,084 (85.2%) | 18 (1.4%) |
| Bachelor's Degree or higher | 776 (90.0%) | 0 (0.0%) |
| Total | 4,323 (78.8%) | 176 (3.2%) |
Employment Occupations by Sex in Grant County
Management, Business, Science and Arts Occupations
The most common Management, Business, Science and Arts occupations in Grant County are Community & Social Service (403 | 8.0%), Management (301 | 5.9%), Health Diagnosing & Treating (298 | 5.9%), Education Instruction & Library (219 | 4.3%), and Health Technologists (191 | 3.8%).

Management, Business, Science and Arts Occupations by Sex
Within the Management, Business, Science and Arts occupations in Grant County, the most male-oriented occupations are Computers & Mathematics (100.0%), Computers, Engineering & Science (79.4%), and Life, Physical & Social Science (76.9%), while the most female-oriented occupations are Education, Arts & Media (92.6%), Community & Social Service (88.1%), and Education Instruction & Library (87.2%).

| Occupation | Male | Female |
| Management | 159 (52.8%) | 142 (47.2%) |
| Business & Financial | 17 (34.7%) | 32 (65.3%) |
| Computers, Engineering & Science | 112 (79.4%) | 29 (20.6%) |
| Computers & Mathematics | 54 (100.0%) | 0 (0.0%) |
| Architecture & Engineering | 38 (62.3%) | 23 (37.7%) |
| Life, Physical & Social Science | 20 (76.9%) | 6 (23.1%) |
| Community & Social Service | 48 (11.9%) | 355 (88.1%) |
| Education, Arts & Media | 10 (7.4%) | 125 (92.6%) |
| Legal Services & Support | 7 (16.3%) | 36 (83.7%) |
| Education Instruction & Library | 28 (12.8%) | 191 (87.2%) |
| Arts, Media & Entertainment | 3 (50.0%) | 3 (50.0%) |
| Health Diagnosing & Treating | 125 (41.9%) | 173 (58.1%) |
| Health Technologists | 82 (42.9%) | 109 (57.1%) |
| Total (Category) | 461 (38.7%) | 731 (61.3%) |
| Total (Overall) | 2,646 (52.3%) | 2,409 (47.7%) |
Services Occupations
The most common Services occupations in Grant County are Cleaning & Maintenance (285 | 5.6%), Food Preparation & Serving (275 | 5.4%), Healthcare Support (227 | 4.5%), Personal Care & Service (165 | 3.3%), and Security & Protection (1 | 0.0%).

Services Occupations by Sex
Within the Services occupations in Grant County, the most male-oriented occupations are Security & Protection (100.0%), Law Enforcement (100.0%), and Cleaning & Maintenance (72.3%), while the most female-oriented occupations are Healthcare Support (94.3%), Personal Care & Service (89.7%), and Food Preparation & Serving (69.8%).

| Occupation | Male | Female |
| Healthcare Support | 13 (5.7%) | 214 (94.3%) |
| Security & Protection | 1 (100.0%) | 0 (0.0%) |
| Firefighting & Prevention | 0 (0.0%) | 0 (0.0%) |
| Law Enforcement | 1 (100.0%) | 0 (0.0%) |
| Food Preparation & Serving | 83 (30.2%) | 192 (69.8%) |
| Cleaning & Maintenance | 206 (72.3%) | 79 (27.7%) |
| Personal Care & Service | 17 (10.3%) | 148 (89.7%) |
| Total (Category) | 320 (33.6%) | 633 (66.4%) |
| Total (Overall) | 2,646 (52.3%) | 2,409 (47.7%) |
Sales and Office Occupations
The most common Sales and Office occupations in Grant County are Sales & Related (607 | 12.0%), and Office & Administration (467 | 9.2%).

Sales and Office Occupations by Sex

| Occupation | Male | Female |
| Sales & Related | 320 (52.7%) | 287 (47.3%) |
| Office & Administration | 68 (14.6%) | 399 (85.4%) |
| Total (Category) | 388 (36.1%) | 686 (63.9%) |
| Total (Overall) | 2,646 (52.3%) | 2,409 (47.7%) |
Natural Resources, Construction and Maintenance Occupations
The most common Natural Resources, Construction and Maintenance occupations in Grant County are Construction & Extraction (457 | 9.0%), Installation, Maintenance & Repair (282 | 5.6%), and Farming, Fishing & Forestry (41 | 0.8%).

Natural Resources, Construction and Maintenance Occupations by Sex

| Occupation | Male | Female |
| Farming, Fishing & Forestry | 41 (100.0%) | 0 (0.0%) |
| Construction & Extraction | 443 (96.9%) | 14 (3.1%) |
| Installation, Maintenance & Repair | 282 (100.0%) | 0 (0.0%) |
| Total (Category) | 766 (98.2%) | 14 (1.8%) |
| Total (Overall) | 2,646 (52.3%) | 2,409 (47.7%) |
Production, Transportation and Moving Occupations
The most common Production, Transportation and Moving occupations in Grant County are Production (564 | 11.2%), Transportation (358 | 7.1%), and Material Moving (134 | 2.6%).

Production, Transportation and Moving Occupations by Sex

| Occupation | Male | Female |
| Production | 309 (54.8%) | 255 (45.2%) |
| Transportation | 315 (88.0%) | 43 (12.0%) |
| Material Moving | 87 (64.9%) | 47 (35.1%) |
| Total (Category) | 711 (67.3%) | 345 (32.7%) |
| Total (Overall) | 2,646 (52.3%) | 2,409 (47.7%) |
Employment Industries by Sex in Grant County
Employment Industries in Grant County
The major employment industries in Grant County include Health Care & Social Assistance (817 | 16.2%), Retail Trade (705 | 14.0%), Manufacturing (698 | 13.8%), Construction (528 | 10.4%), and Accommodation & Food Services (434 | 8.6%).

Employment Industries by Sex in Grant County
The Grant County industries that see more men than women are Agriculture, Fishing & Hunting (100.0%), Mining, Quarrying, & Extraction (100.0%), and Transportation & Warehousing (100.0%), whereas the industries that tend to have a higher number of women are Real Estate, Rental & Leasing (100.0%), Educational Services (87.8%), and Finance & Insurance (86.9%).

| Industry | Male | Female |
| Agriculture, Fishing & Hunting | 35 (100.0%) | 0 (0.0%) |
| Mining, Quarrying, & Extraction | 96 (100.0%) | 0 (0.0%) |
| Construction | 483 (91.5%) | 45 (8.5%) |
| Manufacturing | 414 (59.3%) | 284 (40.7%) |
| Wholesale Trade | 74 (92.5%) | 6 (7.5%) |
| Retail Trade | 407 (57.7%) | 298 (42.3%) |
| Transportation & Warehousing | 216 (100.0%) | 0 (0.0%) |
| Utilities | 42 (36.2%) | 74 (63.8%) |
| Information | 34 (72.3%) | 13 (27.7%) |
| Finance & Insurance | 18 (13.1%) | 119 (86.9%) |
| Real Estate, Rental & Leasing | 0 (0.0%) | 33 (100.0%) |
| Professional & Scientific | 98 (61.3%) | 62 (38.8%) |
| Enterprise Management | 0 (0.0%) | 0 (0.0%) |
| Administrative & Support | 133 (73.5%) | 48 (26.5%) |
| Educational Services | 31 (12.2%) | 224 (87.8%) |
| Health Care & Social Assistance | 177 (21.7%) | 640 (78.3%) |
| Arts, Entertainment & Recreation | 21 (100.0%) | 0 (0.0%) |
| Accommodation & Food Services | 149 (34.3%) | 285 (65.7%) |
| Public Administration | 101 (38.3%) | 163 (61.7%) |
| Total | 2,646 (52.3%) | 2,409 (47.7%) |
Education in Grant County
School Enrollment in Grant County
The most common levels of schooling among the 1,885 students in Grant County are high school (579 | 30.7%), elementary school (463 | 24.6%), and middle school (411 | 21.8%).

| School Level | # Students | % Students |
| Nursery / Preschool | 99 | 5.2% |
| Kindergarten | 101 | 5.4% |
| Elementary School | 463 | 24.6% |
| Middle School | 411 | 21.8% |
| High School | 579 | 30.7% |
| College / Undergraduate | 161 | 8.5% |
| Graduate / Professional | 71 | 3.8% |
| Total | 1,885 | 100.0% |
School Enrollment by Age by Funding Source in Grant County
Out of a total of 1,885 students who are enrolled in schools in Grant County, 185 (9.8%) attend a private institution, while the remaining 1,700 (90.2%) are enrolled in public schools. The age group of 35 years and over has the highest likelihood of being enrolled in private schools, with 44 (57.1% in the age bracket) enrolled. Conversely, the age group of 25 to 34 year olds has the lowest likelihood of being enrolled in a private school, with 48 (100.0% in the age bracket) attending a public institution.

| Age Bracket | Public School | Private School |
| 3 to 4 Year Olds | 39 (65.0%) | 21 (35.0%) |
| 5 to 9 Year Old | 545 (92.8%) | 42 (7.2%) |
| 10 to 14 Year Olds | 487 (94.8%) | 27 (5.2%) |
| 15 to 17 Year Olds | 345 (94.3%) | 21 (5.7%) |
| 18 to 19 Year Olds | 124 (82.7%) | 26 (17.3%) |
| 20 to 24 Year Olds | 80 (96.4%) | 3 (3.6%) |
| 25 to 34 Year Olds | 48 (100.0%) | 0 (0.0%) |
| 35 Years and over | 33 (42.9%) | 44 (57.1%) |
| Total | 1,700 (90.2%) | 185 (9.8%) |
Educational Attainment by Field of Study in Grant County
Business (243 | 21.9%), education (193 | 17.4%), arts & humanities (163 | 14.7%), science & technology (161 | 14.5%), and bio, nature & agricultural (151 | 13.6%) are the most common fields of study among 1,110 individuals in Grant County who have obtained a bachelor's degree or higher.

| Field of Study | # Graduates | % Graduates |
| Computers & Mathematics | 46 | 4.1% |
| Bio, Nature & Agricultural | 151 | 13.6% |
| Physical & Health Sciences | 0 | 0.0% |
| Psychology | 48 | 4.3% |
| Social Sciences | 0 | 0.0% |
| Engineering | 41 | 3.7% |
| Multidisciplinary Studies | 0 | 0.0% |
| Science & Technology | 161 | 14.5% |
| Business | 243 | 21.9% |
| Education | 193 | 17.4% |
| Literature & Languages | 25 | 2.2% |
| Liberal Arts & History | 22 | 2.0% |
| Visual & Performing Arts | 9 | 0.8% |
| Communications | 8 | 0.7% |
| Arts & Humanities | 163 | 14.7% |
| Total | 1,110 | 100.0% |
Transportation & Commute in Grant County
Vehicle Availability by Sex in Grant County
The most prevalent vehicle ownership categories in Grant County are males with 2 vehicles (875, accounting for 33.4%) and females with 2 vehicles (734, making up 37.2%).

| Vehicles Available | Male | Female |
| No Vehicle | 13 (0.5%) | 53 (2.2%) |
| 1 Vehicle | 324 (12.4%) | 399 (17.0%) |
| 2 Vehicles | 875 (33.4%) | 734 (31.2%) |
| 3 Vehicles | 716 (27.3%) | 649 (27.6%) |
| 4 Vehicles | 532 (20.3%) | 312 (13.3%) |
| 5 or more Vehicles | 159 (6.1%) | 207 (8.8%) |
| Total | 2,619 (100.0%) | 2,354 (100.0%) |
Commute Time in Grant County
The most frequently occuring commute durations in Grant County are 10 to 14 minutes (797 commuters, 17.2%), 20 to 24 minutes (793 commuters, 17.1%), and 15 to 19 minutes (712 commuters, 15.3%).

| Commute Time | # Commuters | % Commuters |
| Less than 5 Minutes | 530 | 11.4% |
| 5 to 9 Minutes | 445 | 9.6% |
| 10 to 14 Minutes | 797 | 17.2% |
| 15 to 19 Minutes | 712 | 15.3% |
| 20 to 24 Minutes | 793 | 17.1% |
| 25 to 29 Minutes | 209 | 4.5% |
| 30 to 34 Minutes | 356 | 7.7% |
| 35 to 39 Minutes | 216 | 4.7% |
| 40 to 44 Minutes | 138 | 3.0% |
| 45 to 59 Minutes | 193 | 4.2% |
| 60 to 89 Minutes | 97 | 2.1% |
| 90 or more Minutes | 152 | 3.3% |
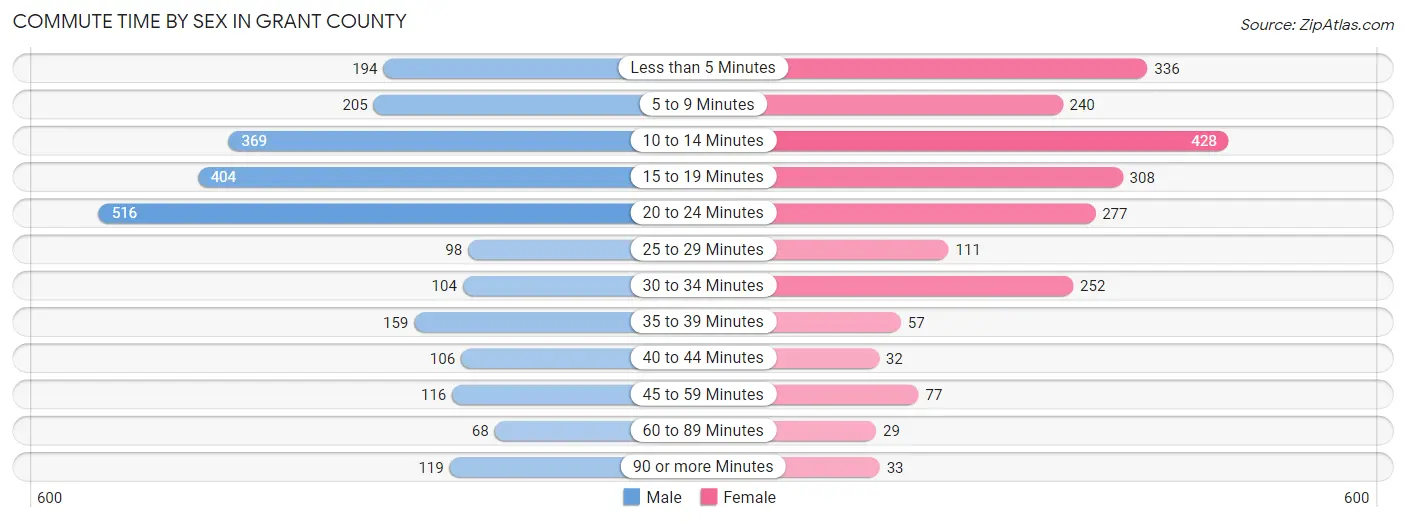
Commute Time by Sex in Grant County
The most common commute times in Grant County are 20 to 24 minutes (516 commuters, 21.0%) for males and 10 to 14 minutes (428 commuters, 19.6%) for females.
| Commute Time | Male | Female |
| Less than 5 Minutes | 194 (7.9%) | 336 (15.4%) |
| 5 to 9 Minutes | 205 (8.3%) | 240 (11.0%) |
| 10 to 14 Minutes | 369 (15.0%) | 428 (19.6%) |
| 15 to 19 Minutes | 404 (16.4%) | 308 (14.1%) |
| 20 to 24 Minutes | 516 (21.0%) | 277 (12.7%) |
| 25 to 29 Minutes | 98 (4.0%) | 111 (5.1%) |
| 30 to 34 Minutes | 104 (4.2%) | 252 (11.6%) |
| 35 to 39 Minutes | 159 (6.5%) | 57 (2.6%) |
| 40 to 44 Minutes | 106 (4.3%) | 32 (1.5%) |
| 45 to 59 Minutes | 116 (4.7%) | 77 (3.5%) |
| 60 to 89 Minutes | 68 (2.8%) | 29 (1.3%) |
| 90 or more Minutes | 119 (4.8%) | 33 (1.5%) |
Time of Departure to Work by Sex in Grant County
The most frequent times of departure to work in Grant County are 12:00 AM to 4:59 AM (632, 25.7%) for males and 7:00 AM to 7:29 AM (410, 18.8%) for females.

| Time of Departure | Male | Female |
| 12:00 AM to 4:59 AM | 632 (25.7%) | 190 (8.7%) |
| 5:00 AM to 5:29 AM | 45 (1.8%) | 87 (4.0%) |
| 5:30 AM to 5:59 AM | 115 (4.7%) | 70 (3.2%) |
| 6:00 AM to 6:29 AM | 212 (8.6%) | 101 (4.6%) |
| 6:30 AM to 6:59 AM | 193 (7.9%) | 80 (3.7%) |
| 7:00 AM to 7:29 AM | 211 (8.6%) | 410 (18.8%) |
| 7:30 AM to 7:59 AM | 177 (7.2%) | 209 (9.6%) |
| 8:00 AM to 8:29 AM | 84 (3.4%) | 232 (10.6%) |
| 8:30 AM to 8:59 AM | 174 (7.1%) | 200 (9.2%) |
| 9:00 AM to 9:59 AM | 0 (0.0%) | 148 (6.8%) |
| 10:00 AM to 10:59 AM | 6 (0.2%) | 67 (3.1%) |
| 11:00 AM to 11:59 AM | 48 (1.9%) | 70 (3.2%) |
| 12:00 PM to 3:59 PM | 357 (14.5%) | 128 (5.9%) |
| 4:00 PM to 11:59 PM | 204 (8.3%) | 188 (8.6%) |
| Total | 2,458 (100.0%) | 2,180 (100.0%) |
Housing Occupancy in Grant County
Occupancy by Ownership in Grant County
Of the total 4,160 dwellings in Grant County, owner-occupied units account for 3,341 (80.3%), while renter-occupied units make up 819 (19.7%).

| Occupancy | # Housing Units | % Housing Units |
| Owner Occupied Housing Units | 3,341 | 80.3% |
| Renter-Occupied Housing Units | 819 | 19.7% |
| Total Occupied Housing Units | 4,160 | 100.0% |
Occupancy by Household Size in Grant County

| Household Size | # Housing Units | % Housing Units |
| 1-Person Household | 1,425 | 34.3% |
| 2-Person Household | 1,499 | 36.0% |
| 3-Person Household | 494 | 11.9% |
| 4+ Person Household | 742 | 17.8% |
| Total Housing Units | 4,160 | 100.0% |
Occupancy by Ownership by Household Size in Grant County

| Household Size | Owner-occupied | Renter-occupied |
| 1-Person Household | 1,047 (73.5%) | 378 (26.5%) |
| 2-Person Household | 1,331 (88.8%) | 168 (11.2%) |
| 3-Person Household | 361 (73.1%) | 133 (26.9%) |
| 4+ Person Household | 602 (81.1%) | 140 (18.9%) |
| Total Housing Units | 3,341 (80.3%) | 819 (19.7%) |
Occupancy by Educational Attainment in Grant County

| Household Size | Owner-occupied | Renter-occupied |
| Less than High School | 469 (77.9%) | 133 (22.1%) |
| High School Diploma | 1,627 (81.7%) | 364 (18.3%) |
| College/Associate Degree | 746 (74.5%) | 255 (25.5%) |
| Bachelor's Degree or higher | 499 (88.2%) | 67 (11.8%) |
Occupancy by Age of Householder in Grant County

| Age Bracket | # Households | % Households |
| Under 35 Years | 483 | 11.6% |
| 35 to 44 Years | 466 | 11.2% |
| 45 to 54 Years | 656 | 15.8% |
| 55 to 64 Years | 948 | 22.8% |
| 65 to 74 Years | 959 | 23.1% |
| 75 to 84 Years | 505 | 12.1% |
| 85 Years and Over | 143 | 3.4% |
| Total | 4,160 | 100.0% |
Housing Finances in Grant County
Median Income by Occupancy in Grant County

| Occupancy Type | # Households | Median Income |
| Owner-Occupied | 3,341 (80.3%) | $59,170 |
| Renter-Occupied | 819 (19.7%) | $28,945 |
| Average | 4,160 (100.0%) | $52,877 |
Occupancy by Householder Income Bracket in Grant County

| Income Bracket | Owner-occupied | Renter-occupied |
| Less than $5,000 | 91 (2.7%) | 25 (3.0%) |
| $5,000 to $9,999 | 57 (1.7%) | 101 (12.3%) |
| $10,000 to $14,999 | 151 (4.5%) | 55 (6.7%) |
| $15,000 to $19,999 | 122 (3.6%) | 61 (7.4%) |
| $20,000 to $24,999 | 133 (4.0%) | 117 (14.3%) |
| $25,000 to $34,999 | 371 (11.1%) | 118 (14.4%) |
| $35,000 to $49,999 | 479 (14.3%) | 113 (13.8%) |
| $50,000 to $74,999 | 865 (25.9%) | 64 (7.8%) |
| $75,000 to $99,999 | 378 (11.3%) | 113 (13.8%) |
| $100,000 to $149,999 | 458 (13.7%) | 52 (6.4%) |
| $150,000 or more | 236 (7.1%) | 0 (0.0%) |
| Total | 3,341 (100.0%) | 819 (100.0%) |
Monthly Housing Cost Tiers in Grant County

| Monthly Cost | Owner-occupied | Renter-occupied |
| Less than $300 | 788 (23.6%) | 38 (4.6%) |
| $300 to $499 | 785 (23.5%) | 99 (12.1%) |
| $500 to $799 | 652 (19.5%) | 356 (43.5%) |
| $800 to $999 | 419 (12.5%) | 108 (13.2%) |
| $1,000 to $1,499 | 479 (14.3%) | 36 (4.4%) |
| $1,500 to $1,999 | 171 (5.1%) | 0 (0.0%) |
| $2,000 to $2,499 | 29 (0.9%) | 0 (0.0%) |
| $2,500 to $2,999 | 13 (0.4%) | 0 (0.0%) |
| $3,000 or more | 5 (0.2%) | 0 (0.0%) |
| Total | 3,341 (100.0%) | 819 (100.0%) |
Physical Housing Characteristics in Grant County
Housing Structures in Grant County

| Structure Type | # Housing Units | % Housing Units |
| Single Unit, Detached | 3,133 | 75.3% |
| Single Unit, Attached | 70 | 1.7% |
| 2 Unit Apartments | 36 | 0.9% |
| 3 or 4 Unit Apartments | 64 | 1.5% |
| 5 to 9 Unit Apartments | 129 | 3.1% |
| 10 or more Apartments | 53 | 1.3% |
| Mobile Home / Other | 675 | 16.2% |
| Total | 4,160 | 100.0% |
Housing Structures by Occupancy in Grant County

| Structure Type | Owner-occupied | Renter-occupied |
| Single Unit, Detached | 2,736 (87.3%) | 397 (12.7%) |
| Single Unit, Attached | 57 (81.4%) | 13 (18.6%) |
| 2 Unit Apartments | 0 (0.0%) | 36 (100.0%) |
| 3 or 4 Unit Apartments | 0 (0.0%) | 64 (100.0%) |
| 5 to 9 Unit Apartments | 15 (11.6%) | 114 (88.4%) |
| 10 or more Apartments | 0 (0.0%) | 53 (100.0%) |
| Mobile Home / Other | 533 (79.0%) | 142 (21.0%) |
| Total | 3,341 (80.3%) | 819 (19.7%) |
Housing Structures by Number of Rooms in Grant County

| Number of Rooms | Owner-occupied | Renter-occupied |
| 1 Room | 0 (0.0%) | 11 (1.3%) |
| 2 or 3 Rooms | 73 (2.2%) | 110 (13.4%) |
| 4 or 5 Rooms | 914 (27.4%) | 356 (43.5%) |
| 6 or 7 Rooms | 1,430 (42.8%) | 224 (27.4%) |
| 8 or more Rooms | 924 (27.7%) | 118 (14.4%) |
| Total | 3,341 (100.0%) | 819 (100.0%) |
Housing Structure by Heating Type in Grant County

| Heating Type | Owner-occupied | Renter-occupied |
| Utility Gas | 110 (3.3%) | 15 (1.8%) |
| Bottled, Tank, or LP Gas | 502 (15.0%) | 82 (10.0%) |
| Electricity | 1,415 (42.3%) | 491 (60.0%) |
| Fuel Oil or Kerosene | 456 (13.7%) | 177 (21.6%) |
| Coal or Coke | 49 (1.5%) | 0 (0.0%) |
| All other Fuels | 799 (23.9%) | 54 (6.6%) |
| No Fuel Used | 10 (0.3%) | 0 (0.0%) |
| Total | 3,341 (100.0%) | 819 (100.0%) |
Household Vehicle Usage in Grant County

| Vehicles per Household | Owner-occupied | Renter-occupied |
| No Vehicle | 108 (3.2%) | 191 (23.3%) |
| 1 Vehicle | 905 (27.1%) | 244 (29.8%) |
| 2 Vehicles | 1,211 (36.2%) | 283 (34.5%) |
| 3 or more Vehicles | 1,117 (33.4%) | 101 (12.3%) |
| Total | 3,341 (100.0%) | 819 (100.0%) |
Real Estate & Mortgages in Grant County
Real Estate and Mortgage Overview in Grant County
| Characteristic | Without Mortgage | With Mortgage |
| Housing Units | 1,844 | 1,497 |
| Median Property Value | $130,600 | $159,200 |
| Median Household Income | $50,833 | $137 |
| Monthly Housing Costs | $339 | $0 |
| Real Estate Taxes | $430 | $43 |
Property Value by Mortgage Status in Grant County

| Property Value | Without Mortgage | With Mortgage |
| Less than $50,000 | 240 (13.0%) | 98 (6.6%) |
| $50,000 to $99,999 | 336 (18.2%) | 192 (12.8%) |
| $100,000 to $299,999 | 902 (48.9%) | 1,041 (69.5%) |
| $300,000 to $499,999 | 298 (16.2%) | 127 (8.5%) |
| $500,000 to $749,999 | 46 (2.5%) | 31 (2.1%) |
| $750,000 to $999,999 | 0 (0.0%) | 8 (0.5%) |
| $1,000,000 or more | 22 (1.2%) | 0 (0.0%) |
| Total | 1,844 (100.0%) | 1,497 (100.0%) |
Household Income by Mortgage Status in Grant County

| Household Income | Without Mortgage | With Mortgage |
| Less than $10,000 | 105 (5.7%) | 31 (2.1%) |
| $10,000 to $24,999 | 357 (19.4%) | 43 (2.9%) |
| $25,000 to $34,999 | 233 (12.6%) | 49 (3.3%) |
| $35,000 to $49,999 | 214 (11.6%) | 138 (9.2%) |
| $50,000 to $74,999 | 479 (26.0%) | 265 (17.7%) |
| $75,000 to $99,999 | 191 (10.4%) | 386 (25.8%) |
| $100,000 to $149,999 | 166 (9.0%) | 187 (12.5%) |
| $150,000 or more | 99 (5.4%) | 292 (19.5%) |
| Total | 1,844 (100.0%) | 1,497 (100.0%) |
Property Value to Household Income Ratio in Grant County

| Value-to-Income Ratio | Without Mortgage | With Mortgage |
| Less than 2.0x | 623 (33.8%) | 68,869 (4,600.5%) |
| 2.0x to 2.9x | 323 (17.5%) | 717 (47.9%) |
| 3.0x to 3.9x | 170 (9.2%) | 286 (19.1%) |
| 4.0x or more | 718 (38.9%) | 178 (11.9%) |
| Total | 1,844 (100.0%) | 1,497 (100.0%) |
Real Estate Taxes by Mortgage Status in Grant County

| Property Taxes | Without Mortgage | With Mortgage |
| Less than $800 | 1,463 (79.3%) | 28 (1.9%) |
| $800 to $1,499 | 176 (9.5%) | 1,031 (68.9%) |
| $800 to $1,499 | 93 (5.0%) | 323 (21.6%) |
| Total | 1,844 (100.0%) | 1,497 (100.0%) |
Health & Disability in Grant County
Health Insurance Coverage by Age in Grant County

| Age Bracket | With Coverage | Without Coverage |
| Under 6 Years | 693 (100.0%) | 0 (0.0%) |
| 6 to 18 Years | 1,413 (91.5%) | 132 (8.5%) |
| 19 to 25 Years | 707 (84.3%) | 132 (15.7%) |
| 26 to 34 Years | 952 (91.2%) | 92 (8.8%) |
| 35 to 44 Years | 774 (67.9%) | 365 (32.1%) |
| 45 to 54 Years | 1,363 (95.3%) | 67 (4.7%) |
| 55 to 64 Years | 1,522 (91.6%) | 140 (8.4%) |
| 65 to 74 Years | 1,488 (99.7%) | 4 (0.3%) |
| 75 Years and older | 1,074 (100.0%) | 0 (0.0%) |
| Total | 9,986 (91.5%) | 932 (8.5%) |
Health Insurance Coverage by Citizenship Status in Grant County

| Citizenship Status | With Coverage | Without Coverage |
| Native Born | 693 (100.0%) | 0 (0.0%) |
| Foreign Born, Citizen | 1,413 (91.5%) | 132 (8.5%) |
| Foreign Born, not a Citizen | 707 (84.3%) | 132 (15.7%) |
Health Insurance Coverage by Household Income in Grant County

| Household Income | With Coverage | Without Coverage |
| Under $25,000 | 1,271 (91.5%) | 118 (8.5%) |
| $25,000 to $49,999 | 2,091 (96.3%) | 80 (3.7%) |
| $50,000 to $74,999 | 2,290 (91.0%) | 226 (9.0%) |
| $75,000 to $99,999 | 1,596 (89.6%) | 185 (10.4%) |
| $100,000 and over | 2,718 (89.8%) | 308 (10.2%) |
Public vs Private Health Insurance Coverage by Age in Grant County

| Age Bracket | Public Insurance | Private Insurance |
| Under 6 | 410 (59.2%) | 287 (41.4%) |
| 6 to 18 Years | 582 (37.7%) | 897 (58.1%) |
| 19 to 25 Years | 251 (29.9%) | 458 (54.6%) |
| 25 to 34 Years | 319 (30.6%) | 641 (61.4%) |
| 35 to 44 Years | 198 (17.4%) | 637 (55.9%) |
| 45 to 54 Years | 365 (25.5%) | 1,032 (72.2%) |
| 55 to 64 Years | 346 (20.8%) | 1,276 (76.8%) |
| 65 to 74 Years | 1,397 (93.6%) | 986 (66.1%) |
| 75 Years and over | 1,074 (100.0%) | 780 (72.6%) |
| Total | 4,942 (45.3%) | 6,994 (64.1%) |
Disability Status by Sex by Age in Grant County

| Age Bracket | Male | Female |
| Under 5 Years | 13 (4.3%) | 0 (0.0%) |
| 5 to 17 Years | 30 (4.0%) | 50 (6.8%) |
| 18 to 34 Years | 126 (11.3%) | 56 (6.1%) |
| 35 to 64 Years | 314 (15.0%) | 218 (10.2%) |
| 65 to 74 Years | 179 (24.1%) | 102 (13.6%) |
| 75 Years and over | 208 (40.3%) | 313 (56.1%) |
Disability Class by Sex by Age in Grant County
Disability Class: Hearing Difficulty

| Age Bracket | Male | Female |
| Under 5 Years | 13 (4.3%) | 0 (0.0%) |
| 5 to 17 Years | 0 (0.0%) | 16 (2.2%) |
| 18 to 34 Years | 58 (5.2%) | 19 (2.1%) |
| 35 to 64 Years | 62 (3.0%) | 69 (3.2%) |
| 65 to 74 Years | 92 (12.4%) | 20 (2.7%) |
| 75 Years and over | 160 (31.0%) | 96 (17.2%) |
Disability Class: Vision Difficulty

| Age Bracket | Male | Female |
| Under 5 Years | 0 (0.0%) | 0 (0.0%) |
| 5 to 17 Years | 12 (1.6%) | 0 (0.0%) |
| 18 to 34 Years | 0 (0.0%) | 11 (1.2%) |
| 35 to 64 Years | 74 (3.5%) | 45 (2.1%) |
| 65 to 74 Years | 14 (1.9%) | 26 (3.5%) |
| 75 Years and over | 46 (8.9%) | 111 (19.9%) |
Disability Class: Cognitive Difficulty

| Age Bracket | Male | Female |
| 5 to 17 Years | 24 (3.2%) | 29 (4.0%) |
| 18 to 34 Years | 62 (5.6%) | 56 (6.1%) |
| 35 to 64 Years | 173 (8.3%) | 116 (5.4%) |
| 65 to 74 Years | 45 (6.1%) | 11 (1.5%) |
| 75 Years and over | 61 (11.8%) | 156 (28.0%) |
Disability Class: Ambulatory Difficulty

| Age Bracket | Male | Female |
| 5 to 17 Years | 0 (0.0%) | 20 (2.7%) |
| 18 to 34 Years | 0 (0.0%) | 9 (1.0%) |
| 35 to 64 Years | 164 (7.8%) | 59 (2.8%) |
| 65 to 74 Years | 97 (13.1%) | 82 (10.9%) |
| 75 Years and over | 162 (31.4%) | 192 (34.4%) |
Disability Class: Self-Care Difficulty

| Age Bracket | Male | Female |
| 5 to 17 Years | 0 (0.0%) | 20 (2.7%) |
| 18 to 34 Years | 0 (0.0%) | 9 (1.0%) |
| 35 to 64 Years | 39 (1.9%) | 37 (1.7%) |
| 65 to 74 Years | 68 (9.2%) | 0 (0.0%) |
| 75 Years and over | 85 (16.5%) | 92 (16.5%) |
Technology Access in Grant County
Computing Device Access in Grant County

| Device Type | # Households | % Households |
| Desktop or Laptop | 2,530 | 60.8% |
| Smartphone | 3,048 | 73.3% |
| Tablet | 1,988 | 47.8% |
| No Computing Device | 695 | 16.7% |
| Total | 4,160 | 100.0% |
Internet Access in Grant County

| Internet Type | # Households | % Households |
| Dial-Up Internet | 26 | 0.6% |
| Broadband Home | 2,440 | 58.7% |
| Cellular Data Only | 619 | 14.9% |
| Satellite Internet | 335 | 8.1% |
| No Internet | 775 | 18.6% |
| Total | 4,160 | 100.0% |
Grant County Summary
Introduction
Grant County is located in the eastern panhandle of West Virginia, and is bordered by Hampshire, Hardy, Mineral, and Pendleton counties. It is part of the Potomac Highlands region of the state, and is home to a population of 11,299 people as of the 2010 census. The county seat is located in the town of Petersburg, and the county is home to several small towns and villages, including Maysville, Bayard, and Mount Storm.
History
Grant County was formed in 1866 from parts of Hardy and Pendleton counties. It was named for General Ulysses S. Grant, who had recently been elected President of the United States. The county was largely rural and agricultural in its early years, and the population remained relatively small until the early 20th century.
In the early 1900s, the county began to experience a period of growth and development. The Chesapeake and Ohio Railway was extended through the county, and the town of Petersburg was established as a railroad hub. This led to an influx of new residents and businesses, and the county’s population began to grow.
The county continued to experience growth and development throughout the 20th century. In the 1950s, the county was home to several coal mines, and the population continued to grow. In the 1970s, the county was home to several manufacturing plants, and the population continued to grow.
Geography
Grant County is located in the eastern panhandle of West Virginia, and is bordered by Hampshire, Hardy, Mineral, and Pendleton counties. It is part of the Potomac Highlands region of the state, and is home to a population of 11,299 people as of the 2010 census.
The county is located in the Appalachian Mountains, and is home to several mountain ranges, including the Allegheny Mountains, the Blue Ridge Mountains, and the Appalachian Plateau. The county is home to several rivers, including the Potomac River, the South Branch Potomac River, and the North Branch Potomac River.
The county is home to several state parks, including the Spruce Knob-Seneca Rocks National Recreation Area, the Monongahela National Forest, and the Canaan Valley National Wildlife Refuge.
Economy
Grant County is largely rural and agricultural, and the economy is largely based on farming and timber production. The county is home to several small businesses, including restaurants, retail stores, and service providers.
The county is also home to several manufacturing plants, including a paper mill, a plastics plant, and a furniture factory. The county is home to several coal mines, and the coal industry is a major employer in the county.
Demographics
As of the 2010 census, Grant County had a population of 11,299 people. The racial makeup of the county was 95.3% White, 2.2% African American, 0.3% Native American, 0.3% Asian, 0.1% Pacific Islander, 0.5% from other races, and 1.3% from two or more races. Hispanic or Latino of any race were 1.3% of the population.
The median income for a household in the county was $35,945, and the median income for a family was $41,944. The per capita income for the county was $17,845. About 13.2% of families and 16.7% of the population were below the poverty line, including 22.2% of those under age 18 and 11.2% of those age 65 or over.
Common Questions
What is the Total Population of Grant County?
Total Population of Grant County is 11,034.
What is the Total Male Population of Grant County?
Total Male Population of Grant County is 5,564.
What is the Total Female Population of Grant County?
Total Female Population of Grant County is 5,470.
What is the Ratio of Males per 100 Females in Grant County?
There are 101.72 Males per 100 Females in Grant County.
What is the Ratio of Females per 100 Males in Grant County?
There are 98.31 Females per 100 Males in Grant County.
What is the Median Population Age in Grant County?
Median Population Age in Grant County is 46.2 Years.
What is the Average Family Size in Grant County
Average Family Size in Grant County is 3.4 People.
What is the Average Household Size in Grant County
Average Household Size in Grant County is 2.6 People.
What is Per Capita Income in Grant County?
Per Capita income in Grant County is $28,274.
What is the Median Family Income in Grant County?
Median Family Income in Grant County is $69,000.
What is the Median Household income in Grant County?
Median Household Income in Grant County is $52,877.
What is Income or Wage Gap in Grant County?
Income or Wage Gap in Grant County is 27.1%.
Women in Grant County earn 72.9 cents for every dollar earned by a man.
What is Family Income Deficit in Grant County?
Family Income Deficit in Grant County is $13,262.
Families that are below poverty line in Grant County earn $13,262 less on average than the poverty threshold level.
What is Inequality or Gini Index in Grant County?
Inequality or Gini Index in Grant County is 0.43.
How Large is the Labor Force in Grant County?
There are 5,340 People in the Labor Forcein in Grant County.
What is the Percentage of People in the Labor Force in Grant County?
57.7% of People are in the Labor Force in Grant County.
What is the Unemployment Rate in Grant County?
Unemployment Rate in Grant County is 5.3%.