Gilmer County, WV
Gilmer County Map

Gilmer County Overview
7,444
TOTAL POPULATION
4,491
MALE POPULATION
2,953
FEMALE POPULATION
152.08
MALES / 100 FEMALES
65.75
FEMALES / 100 MALES
40.5
MEDIAN AGE
3.2
AVG FAMILY SIZE
2.6
AVG HOUSEHOLD SIZE
$20,653
PER CAPITA INCOME
$64,795
AVG FAMILY INCOME
$51,552
AVG HOUSEHOLD INCOME
24.9%
WAGE / INCOME GAP [ % ]
75.1¢/ $1
WAGE / INCOME GAP [ $ ]
0.41
INEQUALITY / GINI INDEX
2,546
LABOR FORCE [ PEOPLE ]
39.9%
PERCENT IN LABOR FORCE
7.1%
UNEMPLOYMENT RATE
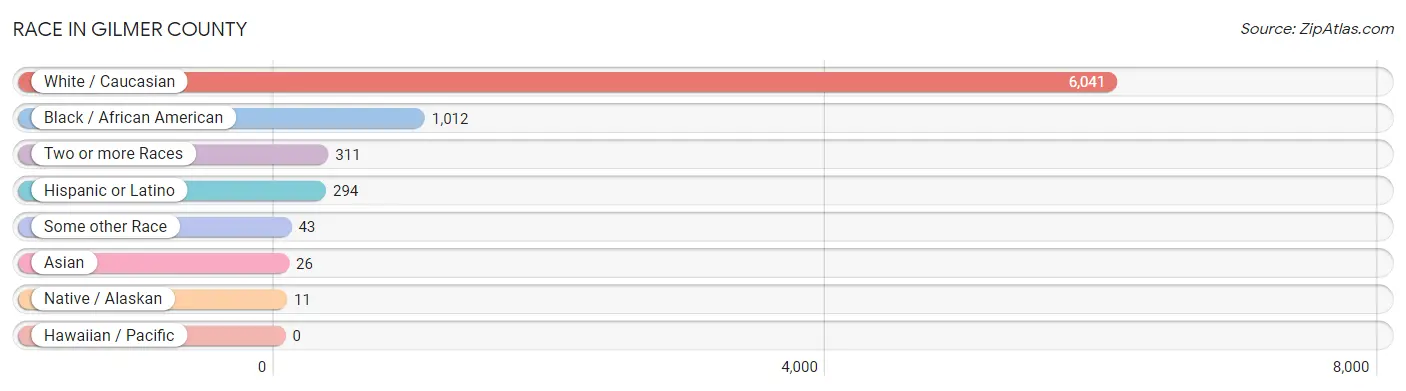
Race in Gilmer County
The most populous races in Gilmer County are White / Caucasian (6,041 | 81.1%), Black / African American (1,012 | 13.6%), and Two or more Races (311 | 4.2%).
| Race | # Population | % Population |
| Asian | 26 | 0.4% |
| Black / African American | 1,012 | 13.6% |
| Hawaiian / Pacific | 0 | 0.0% |
| Hispanic or Latino | 294 | 4.0% |
| Native / Alaskan | 11 | 0.2% |
| White / Caucasian | 6,041 | 81.1% |
| Two or more Races | 311 | 4.2% |
| Some other Race | 43 | 0.6% |
| Total | 7,444 | 100.0% |
Ancestry in Gilmer County
The most populous ancestries reported in Gilmer County are German (1,346 | 18.1%), Irish (852 | 11.5%), American (581 | 7.8%), English (523 | 7.0%), and Scottish (155 | 2.1%), together accounting for 46.4% of all Gilmer County residents.

| Ancestry | # Population | % Population |
| African | 2 | 0.0% |
| American | 581 | 7.8% |
| Apache | 5 | 0.1% |
| Bhutanese | 25 | 0.3% |
| Blackfeet | 4 | 0.1% |
| British | 3 | 0.0% |
| Cajun | 5 | 0.1% |
| Central American | 7 | 0.1% |
| Central American Indian | 48 | 0.6% |
| Cherokee | 13 | 0.2% |
| Colombian | 3 | 0.0% |
| Czech | 6 | 0.1% |
| Dutch | 37 | 0.5% |
| Eastern European | 24 | 0.3% |
| English | 523 | 7.0% |
| European | 80 | 1.1% |
| French | 51 | 0.7% |
| French Canadian | 12 | 0.2% |
| German | 1,346 | 18.1% |
| Greek | 5 | 0.1% |
| Guatemalan | 7 | 0.1% |
| Haitian | 4 | 0.1% |
| Hungarian | 14 | 0.2% |
| Irish | 852 | 11.5% |
| Italian | 115 | 1.5% |
| Korean | 12 | 0.2% |
| Lumbee | 12 | 0.2% |
| Mexican | 41 | 0.5% |
| Norwegian | 19 | 0.3% |
| Polish | 63 | 0.9% |
| Portuguese | 3 | 0.0% |
| Puerto Rican | 48 | 0.6% |
| Russian | 127 | 1.7% |
| Scandinavian | 22 | 0.3% |
| Scotch-Irish | 14 | 0.2% |
| Scottish | 155 | 2.1% |
| South American | 3 | 0.0% |
| Spaniard | 3 | 0.0% |
| Subsaharan African | 2 | 0.0% |
| Swedish | 19 | 0.3% |
| Swiss | 18 | 0.2% |
| Welsh | 61 | 0.8% | View All 42 Rows |
Immigrants in Gilmer County
The most numerous immigrant groups reported in Gilmer County came from Latin America (127 | 1.7%), Central America (75 | 1.0%), Mexico (45 | 0.6%), South America (28 | 0.4%), and Asia (26 | 0.4%), together accounting for 4.1% of all Gilmer County residents.

| Immigration Origin | # Population | % Population |
| Africa | 15 | 0.2% |
| Asia | 26 | 0.4% |
| Bahamas | 12 | 0.2% |
| Caribbean | 24 | 0.3% |
| Central America | 75 | 1.0% |
| Colombia | 14 | 0.2% |
| Dominican Republic | 12 | 0.2% |
| Eastern Asia | 3 | 0.0% |
| Ecuador | 12 | 0.2% |
| El Salvador | 23 | 0.3% |
| Guatemala | 7 | 0.1% |
| India | 11 | 0.2% |
| Japan | 3 | 0.0% |
| Latin America | 127 | 1.7% |
| Mexico | 45 | 0.6% |
| Nigeria | 15 | 0.2% |
| Philippines | 12 | 0.2% |
| South America | 28 | 0.4% |
| South Central Asia | 11 | 0.2% |
| South Eastern Asia | 12 | 0.2% |
| Western Africa | 15 | 0.2% | View All 21 Rows |
Sex and Age in Gilmer County
Sex and Age in Gilmer County
The most populous age groups in Gilmer County are 35 to 39 Years (474 | 10.5%) for men and 15 to 19 Years (354 | 12.0%) for women.

| Age Bracket | Male | Female |
| Under 5 Years | 111 (2.5%) | 182 (6.2%) |
| 5 to 9 Years | 251 (5.6%) | 109 (3.7%) |
| 10 to 14 Years | 174 (3.9%) | 186 (6.3%) |
| 15 to 19 Years | 221 (4.9%) | 354 (12.0%) |
| 20 to 24 Years | 415 (9.2%) | 153 (5.2%) |
| 25 to 29 Years | 316 (7.0%) | 121 (4.1%) |
| 30 to 34 Years | 336 (7.5%) | 132 (4.5%) |
| 35 to 39 Years | 474 (10.5%) | 81 (2.7%) |
| 40 to 44 Years | 363 (8.1%) | 221 (7.5%) |
| 45 to 49 Years | 350 (7.8%) | 158 (5.3%) |
| 50 to 54 Years | 328 (7.3%) | 158 (5.3%) |
| 55 to 59 Years | 295 (6.6%) | 161 (5.4%) |
| 60 to 64 Years | 234 (5.2%) | 257 (8.7%) |
| 65 to 69 Years | 257 (5.7%) | 219 (7.4%) |
| 70 to 74 Years | 125 (2.8%) | 142 (4.8%) |
| 75 to 79 Years | 74 (1.7%) | 181 (6.1%) |
| 80 to 84 Years | 124 (2.8%) | 72 (2.4%) |
| 85 Years and over | 43 (1.0%) | 66 (2.2%) |
| Total | 4,491 (100.0%) | 2,953 (100.0%) |
Families and Households in Gilmer County
Median Family Size in Gilmer County
The median family size in Gilmer County is 3.24 persons per family, with single female/mother families (232 | 16.5%) accounting for the largest median family size of 4.77 persons per family. On the other hand, married-couple families (1,078 | 76.7%) represent the smallest median family size with 2.84 persons per family.

| Family Type | # Families | Family Size |
| Married-Couple | 1,078 (76.7%) | 2.84 |
| Single Male/Father | 96 (6.8%) | 4.15 |
| Single Female/Mother | 232 (16.5%) | 4.77 |
| Total Families | 1,406 (100.0%) | 3.24 |
Median Household Size in Gilmer County
The median household size in Gilmer County is 2.60 persons per household, with single female/mother households (232 | 10.9%) accounting for the largest median household size of 4.84 persons per household. non-family households (726 | 34.1%) represent the smallest median household size with 1.16 persons per household.

| Household Type | # Households | Household Size |
| Married-Couple | 1,078 (50.6%) | 2.91 |
| Single Male/Father | 96 (4.5%) | 4.69 |
| Single Female/Mother | 232 (10.9%) | 4.84 |
| Non-family | 726 (34.1%) | 1.16 |
| Total Households | 2,132 (100.0%) | 2.60 |
Household Size by Marriage Status in Gilmer County
Out of a total of 2,132 households in Gilmer County, 1,406 (65.9%) are family households, while 726 (34.1%) are nonfamily households. The most numerous type of family households are 2-person households, comprising 779, and the most common type of nonfamily households are 1-person households, comprising 622.

| Household Size | Family Households | Nonfamily Households |
| 1-Person Households | - | 622 (29.2%) |
| 2-Person Households | 779 (36.5%) | 102 (4.8%) |
| 3-Person Households | 307 (14.4%) | 2 (0.1%) |
| 4-Person Households | 248 (11.6%) | 0 (0.0%) |
| 5-Person Households | 68 (3.2%) | 0 (0.0%) |
| 6-Person Households | 4 (0.2%) | 0 (0.0%) |
| 7+ Person Households | 0 (0.0%) | 0 (0.0%) |
| Total | 1,406 (65.9%) | 726 (34.1%) |
Female Fertility in Gilmer County
Fertility by Age in Gilmer County
Average fertility rate in Gilmer County is 76.0 births per 1,000 women. Women in the age bracket of 20 to 34 years have the highest fertility rate with 158.0 births per 1,000 women. Women in the age bracket of 20 to 34 years acount for 68.8% of all women with births.

| Age Bracket | Women with Births | Births / 1,000 Women |
| 15 to 19 years | 0 (0.0%) | 0.0 |
| 20 to 34 years | 64 (68.8%) | 158.0 |
| 35 to 50 years | 29 (31.2%) | 63.0 |
| Total | 93 (100.0%) | 76.0 |
Fertility by Age by Marriage Status in Gilmer County
24.7% of women with births (93) in Gilmer County are married. The highest percentage of unmarried women with births falls into 35 to 50 years age bracket with 86.2% of them unmarried at the time of birth, while the lowest percentage of unmarried women with births belong to 20 to 34 years age bracket with 70.3% of them unmarried.

| Age Bracket | Married | Unmarried |
| 15 to 19 years | 0 (0.0%) | 0 (0.0%) |
| 20 to 34 years | 19 (29.7%) | 45 (70.3%) |
| 35 to 50 years | 4 (13.8%) | 25 (86.2%) |
| Total | 23 (24.7%) | 70 (75.3%) |
Fertility by Education in Gilmer County

| Educational Attainment | Women with Births | Births / 1,000 Women |
| Less than High School | 0 (0.0%) | 0.0 |
| High School Diploma | 57 (61.3%) | 168.0 |
| College or Associate's Degree | 0 (0.0%) | 0.0 |
| Bachelor's Degree | 32 (34.4%) | 130.0 |
| Graduate Degree | 4 (4.3%) | 30.0 |
| Total | 93 (100.0%) | 76.0 |
Fertility by Education by Marriage Status in Gilmer County
75.3% of women with births in Gilmer County are unmarried. Women with the educational attainment of graduate degree are most likely to be married with 100.0% of them married at childbirth, while women with the educational attainment of high school diploma are least likely to be married with 78.9% of them unmarried at childbirth.

| Educational Attainment | Married | Unmarried |
| Less than High School | 0 (0.0%) | 0 (0.0%) |
| High School Diploma | 12 (21.0%) | 45 (78.9%) |
| College or Associate's Degree | 0 (0.0%) | 0 (0.0%) |
| Bachelor's Degree | 7 (21.9%) | 25 (78.1%) |
| Graduate Degree | 4 (100.0%) | 0 (0.0%) |
| Total | 23 (24.7%) | 70 (75.3%) |
Income in Gilmer County
Income Overview in Gilmer County
Per Capita Income in Gilmer County is $20,653, while median incomes of families and households are $64,795 and $51,552 respectively.
| Characteristic | Number | Measure |
| Per Capita Income | 7,444 | $20,653 |
| Median Family Income | 1,406 | $64,795 |
| Mean Family Income | 1,406 | $73,753 |
| Median Household Income | 2,132 | $51,552 |
| Mean Household Income | 2,132 | $62,586 |
| Income Deficit | 1,406 | $0 |
| Wage / Income Gap (%) | 7,444 | 24.94% |
| Wage / Income Gap ($) | 7,444 | 75.06¢ per $1 |
| Gini / Inequality Index | 7,444 | 0.41 |
Earnings by Sex in Gilmer County
Average Earnings in Gilmer County are $29,032, $31,855 for men and $23,911 for women, a difference of 24.9%.

| Sex | Number | Average Earnings |
| Male | 1,577 (55.5%) | $31,855 |
| Female | 1,263 (44.5%) | $23,911 |
| Total | 2,840 (100.0%) | $29,032 |
Earnings by Sex by Income Bracket in Gilmer County
The most common earnings brackets in Gilmer County are $2,499 or less for men (195 | 12.4%) and $2,499 or less for women (202 | 16.0%).

| Income | Male | Female |
| $2,499 or less | 195 (12.4%) | 202 (16.0%) |
| $2,500 to $4,999 | 81 (5.1%) | 45 (3.6%) |
| $5,000 to $7,499 | 94 (6.0%) | 44 (3.5%) |
| $7,500 to $9,999 | 45 (2.9%) | 56 (4.4%) |
| $10,000 to $12,499 | 73 (4.6%) | 87 (6.9%) |
| $12,500 to $14,999 | 19 (1.2%) | 14 (1.1%) |
| $15,000 to $17,499 | 23 (1.5%) | 68 (5.4%) |
| $17,500 to $19,999 | 51 (3.2%) | 36 (2.9%) |
| $20,000 to $22,499 | 27 (1.7%) | 62 (4.9%) |
| $22,500 to $24,999 | 10 (0.6%) | 31 (2.5%) |
| $25,000 to $29,999 | 123 (7.8%) | 70 (5.5%) |
| $30,000 to $34,999 | 173 (11.0%) | 66 (5.2%) |
| $35,000 to $39,999 | 91 (5.8%) | 106 (8.4%) |
| $40,000 to $44,999 | 54 (3.4%) | 23 (1.8%) |
| $45,000 to $49,999 | 65 (4.1%) | 78 (6.2%) |
| $50,000 to $54,999 | 30 (1.9%) | 27 (2.1%) |
| $55,000 to $64,999 | 60 (3.8%) | 148 (11.7%) |
| $65,000 to $74,999 | 107 (6.8%) | 40 (3.2%) |
| $75,000 to $99,999 | 178 (11.3%) | 21 (1.7%) |
| $100,000+ | 78 (5.0%) | 39 (3.1%) |
| Total | 1,577 (100.0%) | 1,263 (100.0%) |
Earnings by Sex by Educational Attainment in Gilmer County
Average earnings in Gilmer County are $35,932 for men and $32,721 for women, a difference of 8.9%. Men with an educational attainment of less than high school enjoy the highest average annual earnings of $80,444, while those with bachelor's degree education earn the least with $27,283. Women with an educational attainment of graduate degree earn the most with the average annual earnings of $60,827, while those with less than high school education have the smallest earnings of $12,407.

| Educational Attainment | Male Income | Female Income |
| Less than High School | $80,444 | $12,407 |
| High School Diploma | $35,254 | $24,907 |
| College or Associate's Degree | $39,813 | $25,250 |
| Bachelor's Degree | $27,283 | $46,398 |
| Graduate Degree | $41,250 | $60,827 |
| Total | $35,932 | $32,721 |
Family Income in Gilmer County
Family Income Brackets in Gilmer County
According to the Gilmer County family income data, there are 290 families falling into the $50,000 to $74,999 income range, which is the most common income bracket and makes up 20.6% of all families. Conversely, the $150,000 to $199,999 income bracket is the least frequent group with only 18 families (1.3%) belonging to this category.

| Income Bracket | # Families | % Families |
| Less than $10,000 | 60 | 4.3% |
| $10,000 to $14,999 | 46 | 3.3% |
| $15,000 to $24,999 | 98 | 7.0% |
| $25,000 to $34,999 | 150 | 10.7% |
| $35,000 to $49,999 | 183 | 13.0% |
| $50,000 to $74,999 | 290 | 20.6% |
| $75,000 to $99,999 | 239 | 17.0% |
| $100,000 to $149,999 | 283 | 20.1% |
| $150,000 to $199,999 | 18 | 1.3% |
| $200,000+ | 39 | 2.8% |
Family Income by Famaliy Size in Gilmer County
4-person families (238 | 16.9%) account for the highest median family income in Gilmer County with $91,250 per family, while 3-person families (316 | 22.5%) have the highest median income of $25,333 per family member.

| Income Bracket | # Families | Median Income |
| 2-Person Families | 799 (56.8%) | $46,599 |
| 3-Person Families | 316 (22.5%) | $76,000 |
| 4-Person Families | 238 (16.9%) | $91,250 |
| 5-Person Families | 49 (3.5%) | $0 |
| 6-Person Families | 4 (0.3%) | $0 |
| 7+ Person Families | 0 (0.0%) | $0 |
| Total | 1,406 (100.0%) | $64,795 |
Family Income by Number of Earners in Gilmer County

| Number of Earners | # Families | Median Income |
| No Earners | 440 (31.3%) | $34,750 |
| 1 Earner | 394 (28.0%) | $52,054 |
| 2 Earners | 498 (35.4%) | $85,700 |
| 3+ Earners | 74 (5.3%) | $0 |
| Total | 1,406 (100.0%) | $64,795 |
Household Income in Gilmer County
Household Income Brackets in Gilmer County
With 469 households falling in the category, the $50,000 to $74,999 income range is the most frequent in Gilmer County, accounting for 22.0% of all households. In contrast, only 41 households (1.9%) fall into the $150,000 to $199,999 income bracket, making it the least populous group.

| Income Bracket | # Households | % Households |
| Less than $10,000 | 128 | 6.0% |
| $10,000 to $14,999 | 126 | 5.9% |
| $15,000 to $24,999 | 243 | 11.4% |
| $25,000 to $34,999 | 237 | 11.1% |
| $35,000 to $49,999 | 298 | 14.0% |
| $50,000 to $74,999 | 469 | 22.0% |
| $75,000 to $99,999 | 266 | 12.5% |
| $100,000 to $149,999 | 284 | 13.3% |
| $150,000 to $199,999 | 41 | 1.9% |
| $200,000+ | 43 | 2.0% |
Household Income by Householder Age in Gilmer County
The median household income in Gilmer County is $51,552, with the highest median household income of $71,078 found in the 25 to 44 years age bracket for the primary householder. A total of 469 households (22.0%) fall into this category. Meanwhile, the 15 to 24 years age bracket for the primary householder has the lowest median household income of $25,500, with 88 households (4.1%) in this group.

| Income Bracket | # Households | Median Income |
| 15 to 24 Years | 88 (4.1%) | $25,500 |
| 25 to 44 Years | 469 (22.0%) | $71,078 |
| 45 to 64 Years | 798 (37.4%) | $53,750 |
| 65+ Years | 777 (36.4%) | $44,669 |
| Total | 2,132 (100.0%) | $51,552 |
Poverty in Gilmer County
Income Below Poverty by Sex and Age in Gilmer County
With 9.3% poverty level for males and 13.1% for females among the residents of Gilmer County, 18 to 24 year old males and 16 and 17 year old females are the most vulnerable to poverty, with 76 males (22.1%) and 33 females (75.0%) in their respective age groups living below the poverty level.

| Age Bracket | Male | Female |
| Under 5 Years | 4 (3.6%) | 0 (0.0%) |
| 5 Years | 0 (0.0%) | 0 (0.0%) |
| 6 to 11 Years | 0 (0.0%) | 0 (0.0%) |
| 12 to 14 Years | 26 (18.2%) | 4 (7.4%) |
| 15 Years | 0 (0.0%) | 0 (0.0%) |
| 16 and 17 Years | 0 (0.0%) | 33 (75.0%) |
| 18 to 24 Years | 76 (22.1%) | 78 (34.8%) |
| 25 to 34 Years | 17 (5.5%) | 7 (2.8%) |
| 35 to 44 Years | 50 (19.6%) | 39 (12.9%) |
| 45 to 54 Years | 45 (12.6%) | 60 (19.0%) |
| 55 to 64 Years | 44 (12.1%) | 69 (16.8%) |
| 65 to 74 Years | 2 (0.6%) | 22 (6.1%) |
| 75 Years and over | 2 (0.9%) | 36 (12.3%) |
| Total | 266 (9.3%) | 348 (13.1%) |
Income Above Poverty by Sex and Age in Gilmer County
According to the poverty statistics in Gilmer County, males aged 5 years and females aged under 5 years are the age groups that are most secure financially, with 100.0% of males and 100.0% of females in these age groups living above the poverty line.

| Age Bracket | Male | Female |
| Under 5 Years | 107 (96.4%) | 182 (100.0%) |
| 5 Years | 50 (100.0%) | 9 (100.0%) |
| 6 to 11 Years | 229 (100.0%) | 184 (100.0%) |
| 12 to 14 Years | 117 (81.8%) | 50 (92.6%) |
| 15 Years | 27 (100.0%) | 24 (100.0%) |
| 16 and 17 Years | 85 (100.0%) | 11 (25.0%) |
| 18 to 24 Years | 268 (77.9%) | 146 (65.2%) |
| 25 to 34 Years | 294 (94.5%) | 246 (97.2%) |
| 35 to 44 Years | 205 (80.4%) | 263 (87.1%) |
| 45 to 54 Years | 313 (87.4%) | 256 (81.0%) |
| 55 to 64 Years | 320 (87.9%) | 343 (83.3%) |
| 65 to 74 Years | 351 (99.4%) | 339 (93.9%) |
| 75 Years and over | 222 (99.1%) | 256 (87.7%) |
| Total | 2,588 (90.7%) | 2,309 (86.9%) |
Income Below Poverty Among Married-Couple Families in Gilmer County
The poverty statistics for married-couple families in Gilmer County show that 7.9% or 85 of the total 1,078 families live below the poverty line. Families with no children have the highest poverty rate of 10.0%, comprising of 84 families. On the other hand, families with 3 or 4 children have the lowest poverty rate of 0.0%, which includes 0 families.

| Children | Above Poverty | Below Poverty |
| No Children | 759 (90.0%) | 84 (10.0%) |
| 1 or 2 Children | 220 (99.6%) | 1 (0.4%) |
| 3 or 4 Children | 14 (100.0%) | 0 (0.0%) |
| 5 or more Children | 0 (0.0%) | 0 (0.0%) |
| Total | 993 (92.1%) | 85 (7.9%) |
Income Below Poverty Among Single-Parent Households in Gilmer County
According to the poverty data in Gilmer County, 27.1% or 26 single-father households and 16.0% or 37 single-mother households are living below the poverty line. Among single-father households, those with no children have the highest poverty rate, with 26 households (68.4%) experiencing poverty. Likewise, among single-mother households, those with 1 or 2 children have the highest poverty rate, with 36 households (24.2%) falling below the poverty line.

| Children | Single Father | Single Mother |
| No Children | 26 (68.4%) | 1 (1.2%) |
| 1 or 2 Children | 0 (0.0%) | 36 (24.2%) |
| 3 or 4 Children | 0 (0.0%) | 0 (0.0%) |
| 5 or more Children | 0 (0.0%) | 0 (0.0%) |
| Total | 26 (27.1%) | 37 (16.0%) |
Income Below Poverty Among Married-Couple vs Single-Parent Households in Gilmer County
The poverty data for Gilmer County shows that 85 of the married-couple family households (7.9%) and 63 of the single-parent households (19.2%) are living below the poverty level. Within the married-couple family households, those with no children have the highest poverty rate, with 84 households (10.0%) falling below the poverty line. Among the single-parent households, those with no children have the highest poverty rate, with 27 household (22.3%) living below poverty.

| Children | Married-Couple Families | Single-Parent Households |
| No Children | 84 (10.0%) | 27 (22.3%) |
| 1 or 2 Children | 1 (0.4%) | 36 (18.2%) |
| 3 or 4 Children | 0 (0.0%) | 0 (0.0%) |
| 5 or more Children | 0 (0.0%) | 0 (0.0%) |
| Total | 85 (7.9%) | 63 (19.2%) |
Employment Characteristics in Gilmer County
Employment by Class of Employer in Gilmer County
Among the 2,245 employed individuals in Gilmer County, private company employees (1,278 | 56.9%), state government employees (359 | 16.0%), and local government employees (239 | 10.6%) make up the most common classes of employment.

| Employer Class | # Employees | % Employees |
| Private Company Employees | 1,278 | 56.9% |
| Self-Employed (Incorporated) | 39 | 1.7% |
| Self-Employed (Not Incorporated) | 60 | 2.7% |
| Not-for-profit Organizations | 95 | 4.2% |
| Local Government Employees | 239 | 10.6% |
| State Government Employees | 359 | 16.0% |
| Federal Government Employees | 175 | 7.8% |
| Unpaid Family Workers | 0 | 0.0% |
| Total | 2,245 | 100.0% |
Employment Status by Age in Gilmer County
According to the labor force statistics for Gilmer County, out of the total population over 16 years of age (6,380), 39.9% or 2,546 individuals are in the labor force, with 7.1% or 181 of them unemployed. The age group with the highest labor force participation rate is 30 to 34 years, with 60.3% or 282 individuals in the labor force. Within the labor force, the 60 to 64 years age range has the highest percentage of unemployed individuals, with 18.9% or 30 of them being unemployed.

| Age Bracket | In Labor Force | Unemployed |
| 16 to 19 Years | 162 (30.9%) | 17 (10.5%) |
| 20 to 24 Years | 285 (50.2%) | 20 (7.0%) |
| 25 to 29 Years | 213 (48.7%) | 0 (0.0%) |
| 30 to 34 Years | 282 (60.3%) | 47 (16.7%) |
| 35 to 44 Years | 502 (44.1%) | 35 (7.0%) |
| 45 to 54 Years | 531 (53.4%) | 27 (5.1%) |
| 55 to 59 Years | 270 (59.2%) | 5 (1.9%) |
| 60 to 64 Years | 159 (32.4%) | 30 (18.9%) |
| 65 to 74 Years | 133 (17.9%) | 0 (0.0%) |
| 75 Years and over | 11 (2.0%) | 0 (0.0%) |
| Total | 2,546 (39.9%) | 181 (7.1%) |
Employment Status by Educational Attainment in Gilmer County
According to labor force statistics for Gilmer County, 49.1% of individuals (1,957) out of the total population between 25 and 64 years of age (3,985) are in the labor force, with 7.4% or 145 of them being unemployed. The group with the highest labor force participation rate are those with the educational attainment of bachelor's degree or higher, with 79.5% or 654 individuals in the labor force. Within the labor force, individuals with less than high school education have the highest percentage of unemployment, with 36.8% or 57 of them being unemployed.

| Educational Attainment | In Labor Force | Unemployed |
| Less than High School | 155 (24.7%) | 231 (36.8%) |
| High School Diploma | 853 (44.4%) | 167 (8.7%) |
| College / Associate Degree | 295 (48.0%) | 21 (3.4%) |
| Bachelor's Degree or higher | 654 (79.5%) | 4 (0.5%) |
| Total | 1,957 (49.1%) | 295 (7.4%) |
Employment Occupations by Sex in Gilmer County
Management, Business, Science and Arts Occupations
The most common Management, Business, Science and Arts occupations in Gilmer County are Community & Social Service (380 | 16.1%), Education Instruction & Library (309 | 13.1%), Management (174 | 7.3%), Computers, Engineering & Science (137 | 5.8%), and Health Diagnosing & Treating (135 | 5.7%).

Management, Business, Science and Arts Occupations by Sex
Within the Management, Business, Science and Arts occupations in Gilmer County, the most male-oriented occupations are Management (87.9%), Arts, Media & Entertainment (79.4%), and Education, Arts & Media (75.7%), while the most female-oriented occupations are Health Technologists (100.0%), Business & Financial (90.4%), and Health Diagnosing & Treating (83.7%).

| Occupation | Male | Female |
| Management | 153 (87.9%) | 21 (12.1%) |
| Business & Financial | 9 (9.6%) | 85 (90.4%) |
| Computers, Engineering & Science | 64 (46.7%) | 73 (53.3%) |
| Computers & Mathematics | 29 (61.7%) | 18 (38.3%) |
| Architecture & Engineering | 32 (38.1%) | 52 (61.9%) |
| Life, Physical & Social Science | 3 (50.0%) | 3 (50.0%) |
| Community & Social Service | 194 (51.0%) | 186 (48.9%) |
| Education, Arts & Media | 28 (75.7%) | 9 (24.3%) |
| Legal Services & Support | 0 (0.0%) | 0 (0.0%) |
| Education Instruction & Library | 139 (45.0%) | 170 (55.0%) |
| Arts, Media & Entertainment | 27 (79.4%) | 7 (20.6%) |
| Health Diagnosing & Treating | 22 (16.3%) | 113 (83.7%) |
| Health Technologists | 0 (0.0%) | 71 (100.0%) |
| Total (Category) | 442 (48.0%) | 478 (52.0%) |
| Total (Overall) | 1,260 (53.2%) | 1,107 (46.8%) |
Services Occupations
The most common Services occupations in Gilmer County are Food Preparation & Serving (155 | 6.6%), Cleaning & Maintenance (86 | 3.6%), Healthcare Support (64 | 2.7%), Security & Protection (64 | 2.7%), and Law Enforcement (49 | 2.1%).

Services Occupations by Sex
Within the Services occupations in Gilmer County, the most male-oriented occupations are Law Enforcement (100.0%), Security & Protection (93.8%), and Firefighting & Prevention (73.3%), while the most female-oriented occupations are Personal Care & Service (87.9%), Cleaning & Maintenance (77.9%), and Healthcare Support (76.6%).

| Occupation | Male | Female |
| Healthcare Support | 15 (23.4%) | 49 (76.6%) |
| Security & Protection | 60 (93.8%) | 4 (6.2%) |
| Firefighting & Prevention | 11 (73.3%) | 4 (26.7%) |
| Law Enforcement | 49 (100.0%) | 0 (0.0%) |
| Food Preparation & Serving | 52 (33.6%) | 103 (66.4%) |
| Cleaning & Maintenance | 19 (22.1%) | 67 (77.9%) |
| Personal Care & Service | 4 (12.1%) | 29 (87.9%) |
| Total (Category) | 150 (37.3%) | 252 (62.7%) |
| Total (Overall) | 1,260 (53.2%) | 1,107 (46.8%) |
Sales and Office Occupations
The most common Sales and Office occupations in Gilmer County are Office & Administration (274 | 11.6%), and Sales & Related (198 | 8.4%).

Sales and Office Occupations by Sex

| Occupation | Male | Female |
| Sales & Related | 92 (46.5%) | 106 (53.5%) |
| Office & Administration | 26 (9.5%) | 248 (90.5%) |
| Total (Category) | 118 (25.0%) | 354 (75.0%) |
| Total (Overall) | 1,260 (53.2%) | 1,107 (46.8%) |
Natural Resources, Construction and Maintenance Occupations
The most common Natural Resources, Construction and Maintenance occupations in Gilmer County are Construction & Extraction (176 | 7.4%), and Installation, Maintenance & Repair (49 | 2.1%).

Natural Resources, Construction and Maintenance Occupations by Sex

| Occupation | Male | Female |
| Farming, Fishing & Forestry | 0 (0.0%) | 0 (0.0%) |
| Construction & Extraction | 176 (100.0%) | 0 (0.0%) |
| Installation, Maintenance & Repair | 49 (100.0%) | 0 (0.0%) |
| Total (Category) | 225 (100.0%) | 0 (0.0%) |
| Total (Overall) | 1,260 (53.2%) | 1,107 (46.8%) |
Production, Transportation and Moving Occupations
The most common Production, Transportation and Moving occupations in Gilmer County are Material Moving (140 | 5.9%), Transportation (106 | 4.5%), and Production (102 | 4.3%).

Production, Transportation and Moving Occupations by Sex

| Occupation | Male | Female |
| Production | 92 (90.2%) | 10 (9.8%) |
| Transportation | 106 (100.0%) | 0 (0.0%) |
| Material Moving | 127 (90.7%) | 13 (9.3%) |
| Total (Category) | 325 (93.4%) | 23 (6.6%) |
| Total (Overall) | 1,260 (53.2%) | 1,107 (46.8%) |
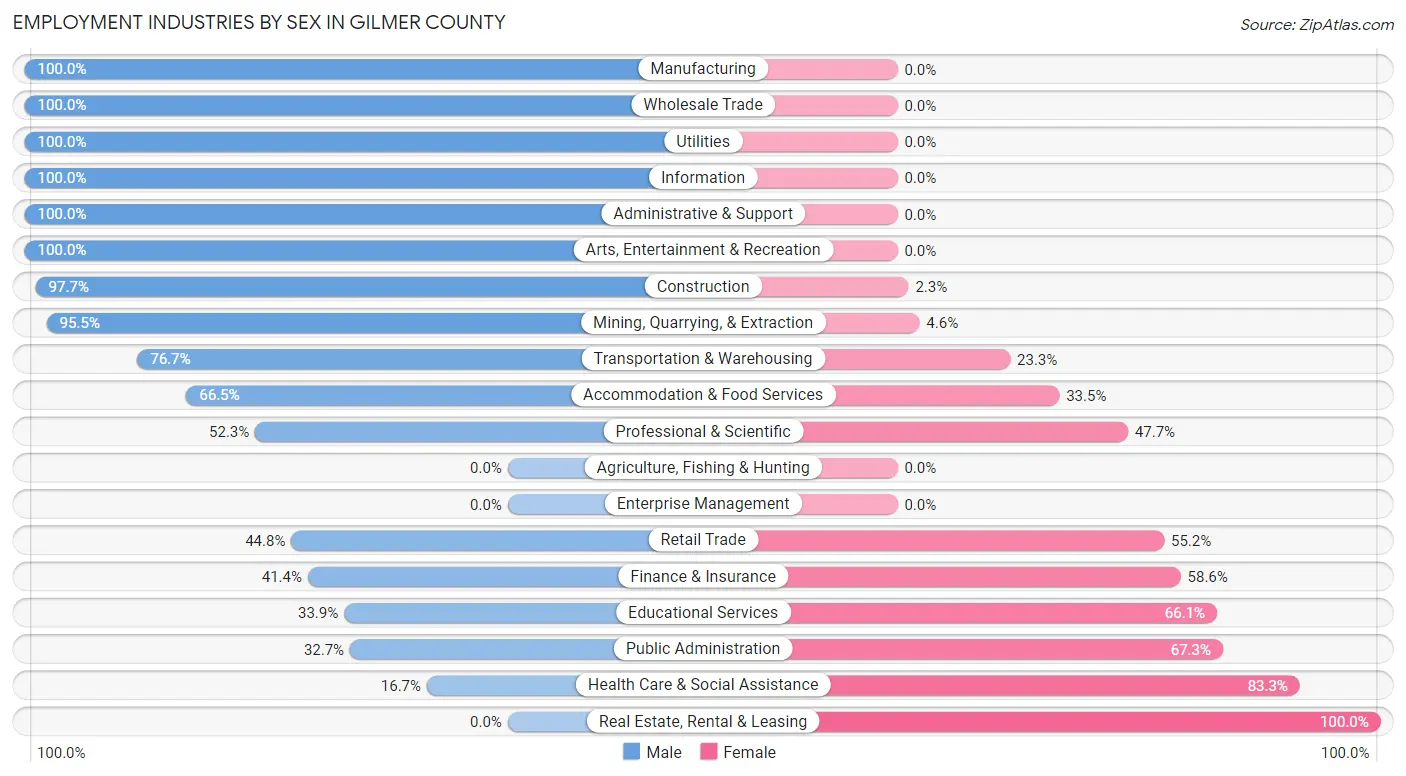
Employment Industries by Sex in Gilmer County
Employment Industries in Gilmer County
The major employment industries in Gilmer County include Educational Services (611 | 25.8%), Retail Trade (270 | 11.4%), Health Care & Social Assistance (239 | 10.1%), Accommodation & Food Services (212 | 9.0%), and Public Administration (199 | 8.4%).

Employment Industries by Sex in Gilmer County
The Gilmer County industries that see more men than women are Manufacturing (100.0%), Wholesale Trade (100.0%), and Utilities (100.0%), whereas the industries that tend to have a higher number of women are Real Estate, Rental & Leasing (100.0%), Health Care & Social Assistance (83.3%), and Public Administration (67.3%).
| Industry | Male | Female |
| Agriculture, Fishing & Hunting | 0 (0.0%) | 0 (0.0%) |
| Mining, Quarrying, & Extraction | 168 (95.5%) | 8 (4.5%) |
| Construction | 171 (97.7%) | 4 (2.3%) |
| Manufacturing | 111 (100.0%) | 0 (0.0%) |
| Wholesale Trade | 6 (100.0%) | 0 (0.0%) |
| Retail Trade | 121 (44.8%) | 149 (55.2%) |
| Transportation & Warehousing | 69 (76.7%) | 21 (23.3%) |
| Utilities | 17 (100.0%) | 0 (0.0%) |
| Information | 4 (100.0%) | 0 (0.0%) |
| Finance & Insurance | 12 (41.4%) | 17 (58.6%) |
| Real Estate, Rental & Leasing | 0 (0.0%) | 8 (100.0%) |
| Professional & Scientific | 57 (52.3%) | 52 (47.7%) |
| Enterprise Management | 0 (0.0%) | 0 (0.0%) |
| Administrative & Support | 9 (100.0%) | 0 (0.0%) |
| Educational Services | 207 (33.9%) | 404 (66.1%) |
| Health Care & Social Assistance | 40 (16.7%) | 199 (83.3%) |
| Arts, Entertainment & Recreation | 17 (100.0%) | 0 (0.0%) |
| Accommodation & Food Services | 141 (66.5%) | 71 (33.5%) |
| Public Administration | 65 (32.7%) | 134 (67.3%) |
| Total | 1,260 (53.2%) | 1,107 (46.8%) |
Education in Gilmer County
School Enrollment in Gilmer County
The most common levels of schooling among the 1,885 students in Gilmer County are college / undergraduate (797 | 42.3%), elementary school (320 | 17.0%), and middle school (244 | 12.9%).

| School Level | # Students | % Students |
| Nursery / Preschool | 95 | 5.0% |
| Kindergarten | 51 | 2.7% |
| Elementary School | 320 | 17.0% |
| Middle School | 244 | 12.9% |
| High School | 243 | 12.9% |
| College / Undergraduate | 797 | 42.3% |
| Graduate / Professional | 135 | 7.2% |
| Total | 1,885 | 100.0% |
School Enrollment by Age by Funding Source in Gilmer County
Out of a total of 1,885 students who are enrolled in schools in Gilmer County, 303 (16.1%) attend a private institution, while the remaining 1,582 (83.9%) are enrolled in public schools. The age group of 18 to 19 year olds has the highest likelihood of being enrolled in private schools, with 189 (48.2% in the age bracket) enrolled. Conversely, the age group of 3 to 4 year olds has the lowest likelihood of being enrolled in a private school, with 80 (100.0% in the age bracket) attending a public institution.

| Age Bracket | Public School | Private School |
| 3 to 4 Year Olds | 80 (100.0%) | 0 (0.0%) |
| 5 to 9 Year Old | 339 (100.0%) | 0 (0.0%) |
| 10 to 14 Year Olds | 310 (99.4%) | 2 (0.6%) |
| 15 to 17 Year Olds | 180 (100.0%) | 0 (0.0%) |
| 18 to 19 Year Olds | 203 (51.8%) | 189 (48.2%) |
| 20 to 24 Year Olds | 293 (73.1%) | 108 (26.9%) |
| 25 to 34 Year Olds | 29 (100.0%) | 0 (0.0%) |
| 35 Years and over | 148 (97.4%) | 4 (2.6%) |
| Total | 1,582 (83.9%) | 303 (16.1%) |
Educational Attainment by Field of Study in Gilmer County
Education (439 | 36.4%), arts & humanities (141 | 11.7%), business (121 | 10.0%), bio, nature & agricultural (106 | 8.8%), and science & technology (101 | 8.4%) are the most common fields of study among 1,205 individuals in Gilmer County who have obtained a bachelor's degree or higher.

| Field of Study | # Graduates | % Graduates |
| Computers & Mathematics | 18 | 1.5% |
| Bio, Nature & Agricultural | 106 | 8.8% |
| Physical & Health Sciences | 21 | 1.7% |
| Psychology | 56 | 4.6% |
| Social Sciences | 51 | 4.2% |
| Engineering | 0 | 0.0% |
| Multidisciplinary Studies | 68 | 5.6% |
| Science & Technology | 101 | 8.4% |
| Business | 121 | 10.0% |
| Education | 439 | 36.4% |
| Literature & Languages | 42 | 3.5% |
| Liberal Arts & History | 14 | 1.2% |
| Visual & Performing Arts | 10 | 0.8% |
| Communications | 17 | 1.4% |
| Arts & Humanities | 141 | 11.7% |
| Total | 1,205 | 100.0% |
Transportation & Commute in Gilmer County
Vehicle Availability by Sex in Gilmer County
The most prevalent vehicle ownership categories in Gilmer County are males with 3 vehicles (365, accounting for 31.6%) and females with 3 vehicles (198, making up 36.6%).

| Vehicles Available | Male | Female |
| No Vehicle | 2 (0.2%) | 16 (1.6%) |
| 1 Vehicle | 214 (18.5%) | 208 (20.9%) |
| 2 Vehicles | 359 (31.0%) | 384 (38.5%) |
| 3 Vehicles | 365 (31.6%) | 198 (19.9%) |
| 4 Vehicles | 151 (13.1%) | 100 (10.0%) |
| 5 or more Vehicles | 66 (5.7%) | 91 (9.1%) |
| Total | 1,157 (100.0%) | 997 (100.0%) |
Commute Time in Gilmer County
The most frequently occuring commute durations in Gilmer County are 5 to 9 minutes (364 commuters, 16.8%), 60 to 89 minutes (360 commuters, 16.6%), and 10 to 14 minutes (281 commuters, 13.0%).

| Commute Time | # Commuters | % Commuters |
| Less than 5 Minutes | 226 | 10.4% |
| 5 to 9 Minutes | 364 | 16.8% |
| 10 to 14 Minutes | 281 | 13.0% |
| 15 to 19 Minutes | 182 | 8.4% |
| 20 to 24 Minutes | 177 | 8.2% |
| 25 to 29 Minutes | 93 | 4.3% |
| 30 to 34 Minutes | 115 | 5.3% |
| 35 to 39 Minutes | 15 | 0.7% |
| 40 to 44 Minutes | 65 | 3.0% |
| 45 to 59 Minutes | 192 | 8.8% |
| 60 to 89 Minutes | 360 | 16.6% |
| 90 or more Minutes | 99 | 4.6% |
Commute Time by Sex in Gilmer County
The most common commute times in Gilmer County are 60 to 89 minutes (233 commuters, 20.5%) for males and 5 to 9 minutes (258 commuters, 24.9%) for females.

| Commute Time | Male | Female |
| Less than 5 Minutes | 148 (13.0%) | 78 (7.5%) |
| 5 to 9 Minutes | 106 (9.3%) | 258 (24.9%) |
| 10 to 14 Minutes | 139 (12.2%) | 142 (13.7%) |
| 15 to 19 Minutes | 47 (4.1%) | 135 (13.1%) |
| 20 to 24 Minutes | 128 (11.3%) | 49 (4.7%) |
| 25 to 29 Minutes | 39 (3.4%) | 54 (5.2%) |
| 30 to 34 Minutes | 59 (5.2%) | 56 (5.4%) |
| 35 to 39 Minutes | 15 (1.3%) | 0 (0.0%) |
| 40 to 44 Minutes | 21 (1.8%) | 44 (4.3%) |
| 45 to 59 Minutes | 128 (11.3%) | 64 (6.2%) |
| 60 to 89 Minutes | 233 (20.5%) | 127 (12.3%) |
| 90 or more Minutes | 72 (6.3%) | 27 (2.6%) |
Time of Departure to Work by Sex in Gilmer County
The most frequent times of departure to work in Gilmer County are 6:00 AM to 6:29 AM (180, 15.9%) for males and 7:30 AM to 7:59 AM (249, 24.1%) for females.

| Time of Departure | Male | Female |
| 12:00 AM to 4:59 AM | 56 (4.9%) | 23 (2.2%) |
| 5:00 AM to 5:29 AM | 8 (0.7%) | 30 (2.9%) |
| 5:30 AM to 5:59 AM | 158 (13.9%) | 103 (10.0%) |
| 6:00 AM to 6:29 AM | 180 (15.9%) | 50 (4.8%) |
| 6:30 AM to 6:59 AM | 118 (10.4%) | 70 (6.8%) |
| 7:00 AM to 7:29 AM | 88 (7.7%) | 238 (23.0%) |
| 7:30 AM to 7:59 AM | 164 (14.4%) | 249 (24.1%) |
| 8:00 AM to 8:29 AM | 110 (9.7%) | 72 (7.0%) |
| 8:30 AM to 8:59 AM | 92 (8.1%) | 23 (2.2%) |
| 9:00 AM to 9:59 AM | 58 (5.1%) | 23 (2.2%) |
| 10:00 AM to 10:59 AM | 18 (1.6%) | 16 (1.5%) |
| 11:00 AM to 11:59 AM | 0 (0.0%) | 18 (1.7%) |
| 12:00 PM to 3:59 PM | 36 (3.2%) | 89 (8.6%) |
| 4:00 PM to 11:59 PM | 49 (4.3%) | 30 (2.9%) |
| Total | 1,135 (100.0%) | 1,034 (100.0%) |
Housing Occupancy in Gilmer County
Occupancy by Ownership in Gilmer County
Of the total 2,132 dwellings in Gilmer County, owner-occupied units account for 1,584 (74.3%), while renter-occupied units make up 548 (25.7%).

| Occupancy | # Housing Units | % Housing Units |
| Owner Occupied Housing Units | 1,584 | 74.3% |
| Renter-Occupied Housing Units | 548 | 25.7% |
| Total Occupied Housing Units | 2,132 | 100.0% |
Occupancy by Household Size in Gilmer County

| Household Size | # Housing Units | % Housing Units |
| 1-Person Household | 622 | 29.2% |
| 2-Person Household | 881 | 41.3% |
| 3-Person Household | 309 | 14.5% |
| 4+ Person Household | 320 | 15.0% |
| Total Housing Units | 2,132 | 100.0% |
Occupancy by Ownership by Household Size in Gilmer County

| Household Size | Owner-occupied | Renter-occupied |
| 1-Person Household | 409 (65.8%) | 213 (34.2%) |
| 2-Person Household | 683 (77.5%) | 198 (22.5%) |
| 3-Person Household | 231 (74.8%) | 78 (25.2%) |
| 4+ Person Household | 261 (81.6%) | 59 (18.4%) |
| Total Housing Units | 1,584 (74.3%) | 548 (25.7%) |
Occupancy by Educational Attainment in Gilmer County

| Household Size | Owner-occupied | Renter-occupied |
| Less than High School | 174 (69.6%) | 76 (30.4%) |
| High School Diploma | 674 (80.6%) | 162 (19.4%) |
| College/Associate Degree | 280 (70.7%) | 116 (29.3%) |
| Bachelor's Degree or higher | 456 (70.2%) | 194 (29.8%) |
Occupancy by Age of Householder in Gilmer County

| Age Bracket | # Households | % Households |
| Under 35 Years | 218 | 10.2% |
| 35 to 44 Years | 339 | 15.9% |
| 45 to 54 Years | 323 | 15.1% |
| 55 to 64 Years | 475 | 22.3% |
| 65 to 74 Years | 417 | 19.6% |
| 75 to 84 Years | 271 | 12.7% |
| 85 Years and Over | 89 | 4.2% |
| Total | 2,132 | 100.0% |
Housing Finances in Gilmer County
Median Income by Occupancy in Gilmer County

| Occupancy Type | # Households | Median Income |
| Owner-Occupied | 1,584 (74.3%) | $59,259 |
| Renter-Occupied | 548 (25.7%) | $31,286 |
| Average | 2,132 (100.0%) | $51,552 |
Occupancy by Householder Income Bracket in Gilmer County

| Income Bracket | Owner-occupied | Renter-occupied |
| Less than $5,000 | 44 (2.8%) | 51 (9.3%) |
| $5,000 to $9,999 | 23 (1.5%) | 10 (1.8%) |
| $10,000 to $14,999 | 61 (3.8%) | 65 (11.9%) |
| $15,000 to $19,999 | 9 (0.6%) | 38 (6.9%) |
| $20,000 to $24,999 | 126 (8.0%) | 69 (12.6%) |
| $25,000 to $34,999 | 178 (11.2%) | 58 (10.6%) |
| $35,000 to $49,999 | 231 (14.6%) | 67 (12.2%) |
| $50,000 to $74,999 | 335 (21.1%) | 134 (24.4%) |
| $75,000 to $99,999 | 222 (14.0%) | 45 (8.2%) |
| $100,000 to $149,999 | 272 (17.2%) | 11 (2.0%) |
| $150,000 or more | 83 (5.2%) | 0 (0.0%) |
| Total | 1,584 (100.0%) | 548 (100.0%) |
Monthly Housing Cost Tiers in Gilmer County

| Monthly Cost | Owner-occupied | Renter-occupied |
| Less than $300 | 794 (50.1%) | 9 (1.6%) |
| $300 to $499 | 303 (19.1%) | 56 (10.2%) |
| $500 to $799 | 295 (18.6%) | 215 (39.2%) |
| $800 to $999 | 84 (5.3%) | 88 (16.1%) |
| $1,000 to $1,499 | 53 (3.4%) | 66 (12.0%) |
| $1,500 to $1,999 | 44 (2.8%) | 0 (0.0%) |
| $2,000 to $2,499 | 0 (0.0%) | 0 (0.0%) |
| $2,500 to $2,999 | 11 (0.7%) | 0 (0.0%) |
| $3,000 or more | 0 (0.0%) | 0 (0.0%) |
| Total | 1,584 (100.0%) | 548 (100.0%) |
Physical Housing Characteristics in Gilmer County
Housing Structures in Gilmer County

| Structure Type | # Housing Units | % Housing Units |
| Single Unit, Detached | 1,444 | 67.7% |
| Single Unit, Attached | 6 | 0.3% |
| 2 Unit Apartments | 14 | 0.7% |
| 3 or 4 Unit Apartments | 13 | 0.6% |
| 5 to 9 Unit Apartments | 23 | 1.1% |
| 10 or more Apartments | 23 | 1.1% |
| Mobile Home / Other | 609 | 28.6% |
| Total | 2,132 | 100.0% |
Housing Structures by Occupancy in Gilmer County

| Structure Type | Owner-occupied | Renter-occupied |
| Single Unit, Detached | 1,152 (79.8%) | 292 (20.2%) |
| Single Unit, Attached | 1 (16.7%) | 5 (83.3%) |
| 2 Unit Apartments | 1 (7.1%) | 13 (92.9%) |
| 3 or 4 Unit Apartments | 0 (0.0%) | 13 (100.0%) |
| 5 to 9 Unit Apartments | 0 (0.0%) | 23 (100.0%) |
| 10 or more Apartments | 0 (0.0%) | 23 (100.0%) |
| Mobile Home / Other | 430 (70.6%) | 179 (29.4%) |
| Total | 1,584 (74.3%) | 548 (25.7%) |
Housing Structures by Number of Rooms in Gilmer County

| Number of Rooms | Owner-occupied | Renter-occupied |
| 1 Room | 0 (0.0%) | 2 (0.4%) |
| 2 or 3 Rooms | 18 (1.1%) | 76 (13.9%) |
| 4 or 5 Rooms | 455 (28.7%) | 219 (40.0%) |
| 6 or 7 Rooms | 674 (42.5%) | 191 (34.8%) |
| 8 or more Rooms | 437 (27.6%) | 60 (11.0%) |
| Total | 1,584 (100.0%) | 548 (100.0%) |
Housing Structure by Heating Type in Gilmer County

| Heating Type | Owner-occupied | Renter-occupied |
| Utility Gas | 1,216 (76.8%) | 369 (67.3%) |
| Bottled, Tank, or LP Gas | 87 (5.5%) | 10 (1.8%) |
| Electricity | 179 (11.3%) | 132 (24.1%) |
| Fuel Oil or Kerosene | 0 (0.0%) | 0 (0.0%) |
| Coal or Coke | 0 (0.0%) | 0 (0.0%) |
| All other Fuels | 90 (5.7%) | 37 (6.8%) |
| No Fuel Used | 12 (0.8%) | 0 (0.0%) |
| Total | 1,584 (100.0%) | 548 (100.0%) |
Household Vehicle Usage in Gilmer County

| Vehicles per Household | Owner-occupied | Renter-occupied |
| No Vehicle | 76 (4.8%) | 65 (11.9%) |
| 1 Vehicle | 366 (23.1%) | 300 (54.7%) |
| 2 Vehicles | 695 (43.9%) | 139 (25.4%) |
| 3 or more Vehicles | 447 (28.2%) | 44 (8.0%) |
| Total | 1,584 (100.0%) | 548 (100.0%) |
Real Estate & Mortgages in Gilmer County
Real Estate and Mortgage Overview in Gilmer County
| Characteristic | Without Mortgage | With Mortgage |
| Housing Units | 1,136 | 448 |
| Median Property Value | $83,100 | $103,000 |
| Median Household Income | $48,200 | $45 |
| Monthly Housing Costs | $244 | $0 |
| Real Estate Taxes | $447 | $0 |
Property Value by Mortgage Status in Gilmer County

| Property Value | Without Mortgage | With Mortgage |
| Less than $50,000 | 346 (30.5%) | 42 (9.4%) |
| $50,000 to $99,999 | 330 (29.0%) | 173 (38.6%) |
| $100,000 to $299,999 | 456 (40.1%) | 187 (41.7%) |
| $300,000 to $499,999 | 3 (0.3%) | 35 (7.8%) |
| $500,000 to $749,999 | 1 (0.1%) | 11 (2.5%) |
| $750,000 to $999,999 | 0 (0.0%) | 0 (0.0%) |
| $1,000,000 or more | 0 (0.0%) | 0 (0.0%) |
| Total | 1,136 (100.0%) | 448 (100.0%) |
Household Income by Mortgage Status in Gilmer County

| Household Income | Without Mortgage | With Mortgage |
| Less than $10,000 | 59 (5.2%) | 17 (3.8%) |
| $10,000 to $24,999 | 194 (17.1%) | 8 (1.8%) |
| $25,000 to $34,999 | 133 (11.7%) | 2 (0.4%) |
| $35,000 to $49,999 | 200 (17.6%) | 45 (10.0%) |
| $50,000 to $74,999 | 219 (19.3%) | 31 (6.9%) |
| $75,000 to $99,999 | 127 (11.2%) | 116 (25.9%) |
| $100,000 to $149,999 | 166 (14.6%) | 95 (21.2%) |
| $150,000 or more | 38 (3.4%) | 106 (23.7%) |
| Total | 1,136 (100.0%) | 448 (100.0%) |
Property Value to Household Income Ratio in Gilmer County

| Value-to-Income Ratio | Without Mortgage | With Mortgage |
| Less than 2.0x | 683 (60.1%) | 85,300 (19,040.2%) |
| 2.0x to 2.9x | 168 (14.8%) | 278 (62.1%) |
| 3.0x to 3.9x | 109 (9.6%) | 91 (20.3%) |
| 4.0x or more | 156 (13.7%) | 21 (4.7%) |
| Total | 1,136 (100.0%) | 448 (100.0%) |
Real Estate Taxes by Mortgage Status in Gilmer County

| Property Taxes | Without Mortgage | With Mortgage |
| Less than $800 | 828 (72.9%) | 5 (1.1%) |
| $800 to $1,499 | 110 (9.7%) | 340 (75.9%) |
| $800 to $1,499 | 46 (4.1%) | 79 (17.6%) |
| Total | 1,136 (100.0%) | 448 (100.0%) |
Health & Disability in Gilmer County
Health Insurance Coverage by Age in Gilmer County

| Age Bracket | With Coverage | Without Coverage |
| Under 6 Years | 339 (96.3%) | 13 (3.7%) |
| 6 to 18 Years | 1,049 (98.7%) | 14 (1.3%) |
| 19 to 25 Years | 665 (79.3%) | 174 (20.7%) |
| 26 to 34 Years | 378 (87.9%) | 52 (12.1%) |
| 35 to 44 Years | 489 (87.8%) | 68 (12.2%) |
| 45 to 54 Years | 627 (93.0%) | 47 (7.0%) |
| 55 to 64 Years | 685 (88.3%) | 91 (11.7%) |
| 65 to 74 Years | 714 (100.0%) | 0 (0.0%) |
| 75 Years and older | 516 (100.0%) | 0 (0.0%) |
| Total | 5,462 (92.2%) | 459 (7.7%) |
Health Insurance Coverage by Citizenship Status in Gilmer County

| Citizenship Status | With Coverage | Without Coverage |
| Native Born | 339 (96.3%) | 13 (3.7%) |
| Foreign Born, Citizen | 1,049 (98.7%) | 14 (1.3%) |
| Foreign Born, not a Citizen | 665 (79.3%) | 174 (20.7%) |
Health Insurance Coverage by Household Income in Gilmer County

| Household Income | With Coverage | Without Coverage |
| Under $25,000 | 707 (86.8%) | 108 (13.3%) |
| $25,000 to $49,999 | 888 (89.8%) | 101 (10.2%) |
| $50,000 to $74,999 | 1,211 (93.1%) | 89 (6.9%) |
| $75,000 to $99,999 | 869 (88.0%) | 119 (12.0%) |
| $100,000 and over | 1,449 (99.5%) | 7 (0.5%) |
Public vs Private Health Insurance Coverage by Age in Gilmer County

| Age Bracket | Public Insurance | Private Insurance |
| Under 6 | 210 (59.7%) | 129 (36.6%) |
| 6 to 18 Years | 247 (23.2%) | 835 (78.5%) |
| 19 to 25 Years | 124 (14.8%) | 568 (67.7%) |
| 25 to 34 Years | 149 (34.6%) | 236 (54.9%) |
| 35 to 44 Years | 107 (19.2%) | 398 (71.5%) |
| 45 to 54 Years | 173 (25.7%) | 494 (73.3%) |
| 55 to 64 Years | 224 (28.9%) | 534 (68.8%) |
| 65 to 74 Years | 712 (99.7%) | 384 (53.8%) |
| 75 Years and over | 516 (100.0%) | 376 (72.9%) |
| Total | 2,462 (41.6%) | 3,954 (66.8%) |
Disability Status by Sex by Age in Gilmer County

| Age Bracket | Male | Female |
| Under 5 Years | 0 (0.0%) | 0 (0.0%) |
| 5 to 17 Years | 15 (2.8%) | 11 (3.0%) |
| 18 to 34 Years | 79 (9.9%) | 85 (12.3%) |
| 35 to 64 Years | 205 (21.0%) | 91 (8.8%) |
| 65 to 74 Years | 184 (52.1%) | 105 (29.1%) |
| 75 Years and over | 71 (31.7%) | 72 (24.7%) |
Disability Class by Sex by Age in Gilmer County
Disability Class: Hearing Difficulty

| Age Bracket | Male | Female |
| Under 5 Years | 0 (0.0%) | 0 (0.0%) |
| 5 to 17 Years | 0 (0.0%) | 0 (0.0%) |
| 18 to 34 Years | 0 (0.0%) | 3 (0.4%) |
| 35 to 64 Years | 73 (7.5%) | 21 (2.0%) |
| 65 to 74 Years | 63 (17.8%) | 2 (0.5%) |
| 75 Years and over | 60 (26.8%) | 23 (7.9%) |
Disability Class: Vision Difficulty

| Age Bracket | Male | Female |
| Under 5 Years | 0 (0.0%) | 0 (0.0%) |
| 5 to 17 Years | 3 (0.6%) | 11 (3.0%) |
| 18 to 34 Years | 0 (0.0%) | 5 (0.7%) |
| 35 to 64 Years | 49 (5.0%) | 3 (0.3%) |
| 65 to 74 Years | 8 (2.3%) | 7 (1.9%) |
| 75 Years and over | 10 (4.5%) | 13 (4.4%) |
Disability Class: Cognitive Difficulty

| Age Bracket | Male | Female |
| 5 to 17 Years | 12 (2.2%) | 11 (3.0%) |
| 18 to 34 Years | 59 (7.4%) | 76 (11.0%) |
| 35 to 64 Years | 55 (5.6%) | 26 (2.5%) |
| 65 to 74 Years | 50 (14.2%) | 27 (7.5%) |
| 75 Years and over | 11 (4.9%) | 9 (3.1%) |
Disability Class: Ambulatory Difficulty

| Age Bracket | Male | Female |
| 5 to 17 Years | 0 (0.0%) | 11 (3.0%) |
| 18 to 34 Years | 20 (2.5%) | 22 (3.2%) |
| 35 to 64 Years | 180 (18.4%) | 71 (6.9%) |
| 65 to 74 Years | 101 (28.6%) | 64 (17.7%) |
| 75 Years and over | 31 (13.8%) | 71 (24.3%) |
Disability Class: Self-Care Difficulty

| Age Bracket | Male | Female |
| 5 to 17 Years | 12 (2.2%) | 11 (3.0%) |
| 18 to 34 Years | 18 (2.2%) | 0 (0.0%) |
| 35 to 64 Years | 29 (3.0%) | 22 (2.1%) |
| 65 to 74 Years | 2 (0.6%) | 31 (8.6%) |
| 75 Years and over | 23 (10.3%) | 43 (14.7%) |
Technology Access in Gilmer County
Computing Device Access in Gilmer County

| Device Type | # Households | % Households |
| Desktop or Laptop | 1,340 | 62.8% |
| Smartphone | 1,398 | 65.6% |
| Tablet | 958 | 44.9% |
| No Computing Device | 419 | 19.7% |
| Total | 2,132 | 100.0% |
Internet Access in Gilmer County

| Internet Type | # Households | % Households |
| Dial-Up Internet | 2 | 0.1% |
| Broadband Home | 1,124 | 52.7% |
| Cellular Data Only | 95 | 4.5% |
| Satellite Internet | 396 | 18.6% |
| No Internet | 546 | 25.6% |
| Total | 2,132 | 100.0% |
Gilmer County Summary
Gilmer County, West Virginia is located in the north-central part of the state, and is bordered by Calhoun, Roane, Wirt, and Ritchie counties. The county seat is Glenville, and the county was created in 1845 from parts of Lewis, Harrison, and Ritchie counties. The county has a total area of 441 square miles, and a population of 8,693 as of the 2010 census.
History
The area that is now Gilmer County was first settled in the late 1700s by European settlers, primarily of German and Scots-Irish descent. The county was created in 1845 from parts of Lewis, Harrison, and Ritchie counties. The county was named for Thomas Walker Gilmer, who served as Governor of Virginia from 1840 to 1841.
During the Civil War, Gilmer County was a part of the Union-controlled state of West Virginia. The county was home to several Union regiments, and the Battle of Bulltown was fought in the county in 1863.
Geography
Gilmer County is located in the north-central part of West Virginia, and is bordered by Calhoun, Roane, Wirt, and Ritchie counties. The county has a total area of 441 square miles, and is located in the Appalachian Mountains. The highest point in the county is Spruce Knob, which has an elevation of 4,863 feet.
The county is home to several rivers and streams, including the Little Kanawha River, the Hughes River, and the Little Sandy Creek. The county is also home to several state parks, including the Spruce Knob-Seneca Rocks National Recreation Area, the Monongahela National Forest, and the Canaan Valley National Wildlife Refuge.
Economy
The economy of Gilmer County is largely based on agriculture and tourism. The county is home to several farms, and the primary crops grown in the county are corn, hay, and soybeans. The county is also home to several tourist attractions, including the Spruce Knob-Seneca Rocks National Recreation Area, the Monongahela National Forest, and the Canaan Valley National Wildlife Refuge.
The county is also home to several manufacturing companies, including a paper mill, a furniture factory, and a plastics plant. The county is also home to several coal mines, and the county is a major producer of coal in the state.
Demographics
As of the 2010 census, there were 8,693 people, 3,541 households, and 2,521 families living in Gilmer County. The population density was 20 people per square mile. The racial makeup of the county was 97.3% White, 0.7% African American, 0.2% Native American, 0.2% Asian, 0.1% Pacific Islander, 0.3% from other races, and 1.2% from two or more races. Hispanic or Latino of any race were 0.7% of the population.
The median income for a household in the county was $30,945, and the median income for a family was $37,917. The per capita income for the county was $16,845. About 16.2% of the population was below the poverty line.
Conclusion
Gilmer County, West Virginia is located in the north-central part of the state, and is bordered by Calhoun, Roane, Wirt, and Ritchie counties. The county was created in 1845 from parts of Lewis, Harrison, and Ritchie counties, and has a total area of 441 square miles. The county has a population of 8,693 as of the 2010 census, and the economy is largely based on agriculture and tourism. The county is home to several farms, tourist attractions, manufacturing companies, and coal mines. The median income for a household in the county was $30,945, and the median income for a family was $37,917. About 16.2% of the population was below the poverty line.
Common Questions
What is the Total Population of Gilmer County?
Total Population of Gilmer County is 7,444.
What is the Total Male Population of Gilmer County?
Total Male Population of Gilmer County is 4,491.
What is the Total Female Population of Gilmer County?
Total Female Population of Gilmer County is 2,953.
What is the Ratio of Males per 100 Females in Gilmer County?
There are 152.08 Males per 100 Females in Gilmer County.
What is the Ratio of Females per 100 Males in Gilmer County?
There are 65.75 Females per 100 Males in Gilmer County.
What is the Median Population Age in Gilmer County?
Median Population Age in Gilmer County is 40.5 Years.
What is the Average Family Size in Gilmer County
Average Family Size in Gilmer County is 3.2 People.
What is the Average Household Size in Gilmer County
Average Household Size in Gilmer County is 2.6 People.
What is Per Capita Income in Gilmer County?
Per Capita income in Gilmer County is $20,653.
What is the Median Family Income in Gilmer County?
Median Family Income in Gilmer County is $64,795.
What is the Median Household income in Gilmer County?
Median Household Income in Gilmer County is $51,552.
What is Income or Wage Gap in Gilmer County?
Income or Wage Gap in Gilmer County is 24.9%.
Women in Gilmer County earn 75.1 cents for every dollar earned by a man.
What is Inequality or Gini Index in Gilmer County?
Inequality or Gini Index in Gilmer County is 0.41.
How Large is the Labor Force in Gilmer County?
There are 2,546 People in the Labor Forcein in Gilmer County.
What is the Percentage of People in the Labor Force in Gilmer County?
39.9% of People are in the Labor Force in Gilmer County.
What is the Unemployment Rate in Gilmer County?
Unemployment Rate in Gilmer County is 7.1%.