Fayette County, WV
Fayette County Map
Fayette County Overview
40,545
TOTAL POPULATION
20,365
MALE POPULATION
20,180
FEMALE POPULATION
100.92
MALES / 100 FEMALES
99.09
FEMALES / 100 MALES
44.7
MEDIAN AGE
3.0
AVG FAMILY SIZE
2.5
AVG HOUSEHOLD SIZE
$24,818
PER CAPITA INCOME
$61,952
AVG FAMILY INCOME
$50,090
AVG HOUSEHOLD INCOME
23.5%
WAGE / INCOME GAP [ % ]
76.5¢/ $1
WAGE / INCOME GAP [ $ ]
$10,449
FAMILY INCOME DEFICIT
0.44
INEQUALITY / GINI INDEX
15,359
LABOR FORCE [ PEOPLE ]
46.2%
PERCENT IN LABOR FORCE
7.5%
UNEMPLOYMENT RATE
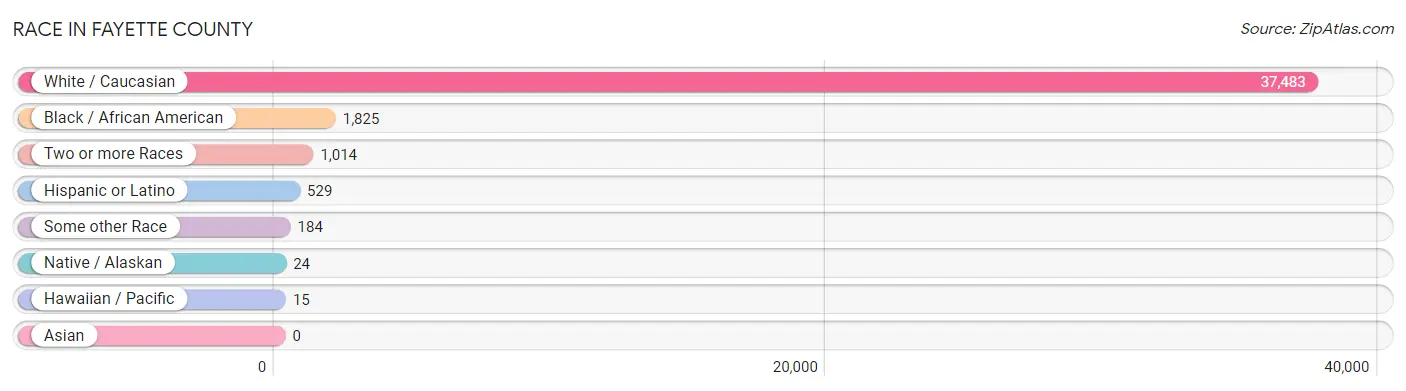
Race in Fayette County
The most populous races in Fayette County are White / Caucasian (37,483 | 92.4%), Black / African American (1,825 | 4.5%), and Two or more Races (1,014 | 2.5%).
| Race | # Population | % Population |
| Asian | 0 | 0.0% |
| Black / African American | 1,825 | 4.5% |
| Hawaiian / Pacific | 15 | 0.0% |
| Hispanic or Latino | 529 | 1.3% |
| Native / Alaskan | 24 | 0.1% |
| White / Caucasian | 37,483 | 92.4% |
| Two or more Races | 1,014 | 2.5% |
| Some other Race | 184 | 0.4% |
| Total | 40,545 | 100.0% |
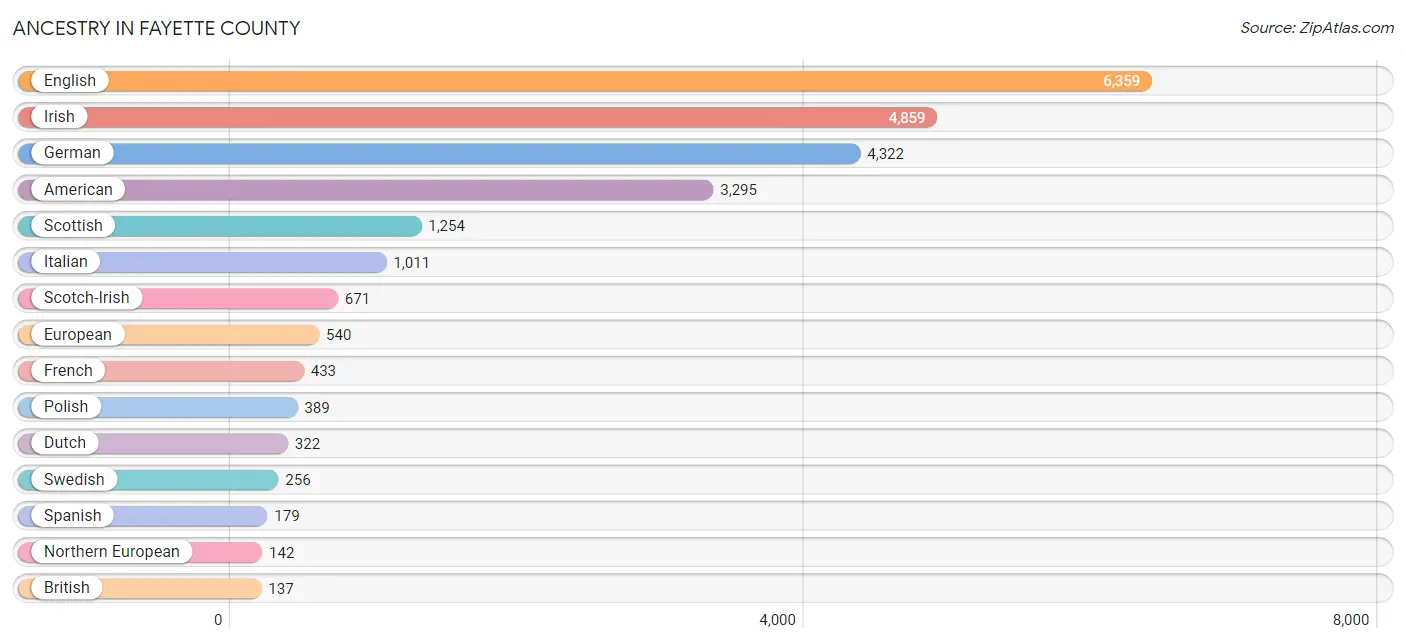
Ancestry in Fayette County
The most populous ancestries reported in Fayette County are English (6,359 | 15.7%), Irish (4,859 | 12.0%), German (4,322 | 10.7%), American (3,295 | 8.1%), and Scottish (1,254 | 3.1%), together accounting for 49.5% of all Fayette County residents.
| Ancestry | # Population | % Population |
| African | 24 | 0.1% |
| American | 3,295 | 8.1% |
| Arab | 76 | 0.2% |
| Austrian | 7 | 0.0% |
| Belgian | 15 | 0.0% |
| British | 137 | 0.3% |
| Canadian | 7 | 0.0% |
| Celtic | 41 | 0.1% |
| Central American | 10 | 0.0% |
| Cherokee | 81 | 0.2% |
| Colombian | 102 | 0.3% |
| Czech | 14 | 0.0% |
| Czechoslovakian | 13 | 0.0% |
| Dominican | 10 | 0.0% |
| Dutch | 322 | 0.8% |
| Dutch West Indian | 8 | 0.0% |
| Eastern European | 64 | 0.2% |
| Egyptian | 20 | 0.1% |
| English | 6,359 | 15.7% |
| European | 540 | 1.3% |
| Finnish | 65 | 0.2% |
| French | 433 | 1.1% |
| French Canadian | 62 | 0.2% |
| German | 4,322 | 10.7% |
| Greek | 71 | 0.2% |
| Guamanian / Chamorro | 15 | 0.0% |
| Hungarian | 27 | 0.1% |
| Irish | 4,859 | 12.0% |
| Iroquois | 23 | 0.1% |
| Italian | 1,011 | 2.5% |
| Jamaican | 96 | 0.2% |
| Lebanese | 45 | 0.1% |
| Lithuanian | 7 | 0.0% |
| Mexican | 101 | 0.3% |
| Moroccan | 8 | 0.0% |
| Northern European | 142 | 0.4% |
| Norwegian | 19 | 0.1% |
| Panamanian | 10 | 0.0% |
| Pennsylvania German | 37 | 0.1% |
| Polish | 389 | 1.0% |
| Portuguese | 51 | 0.1% |
| Puerto Rican | 27 | 0.1% |
| Russian | 99 | 0.2% |
| Scandinavian | 73 | 0.2% |
| Scotch-Irish | 671 | 1.7% |
| Scottish | 1,254 | 3.1% |
| Serbian | 16 | 0.0% |
| Slavic | 10 | 0.0% |
| Slovak | 11 | 0.0% |
| South American | 102 | 0.3% |
| Spaniard | 100 | 0.3% |
| Spanish | 179 | 0.4% |
| Subsaharan African | 24 | 0.1% |
| Swedish | 256 | 0.6% |
| Swiss | 57 | 0.1% |
| Syrian | 3 | 0.0% |
| Ukrainian | 45 | 0.1% |
| Welsh | 106 | 0.3% | View All 58 Rows |
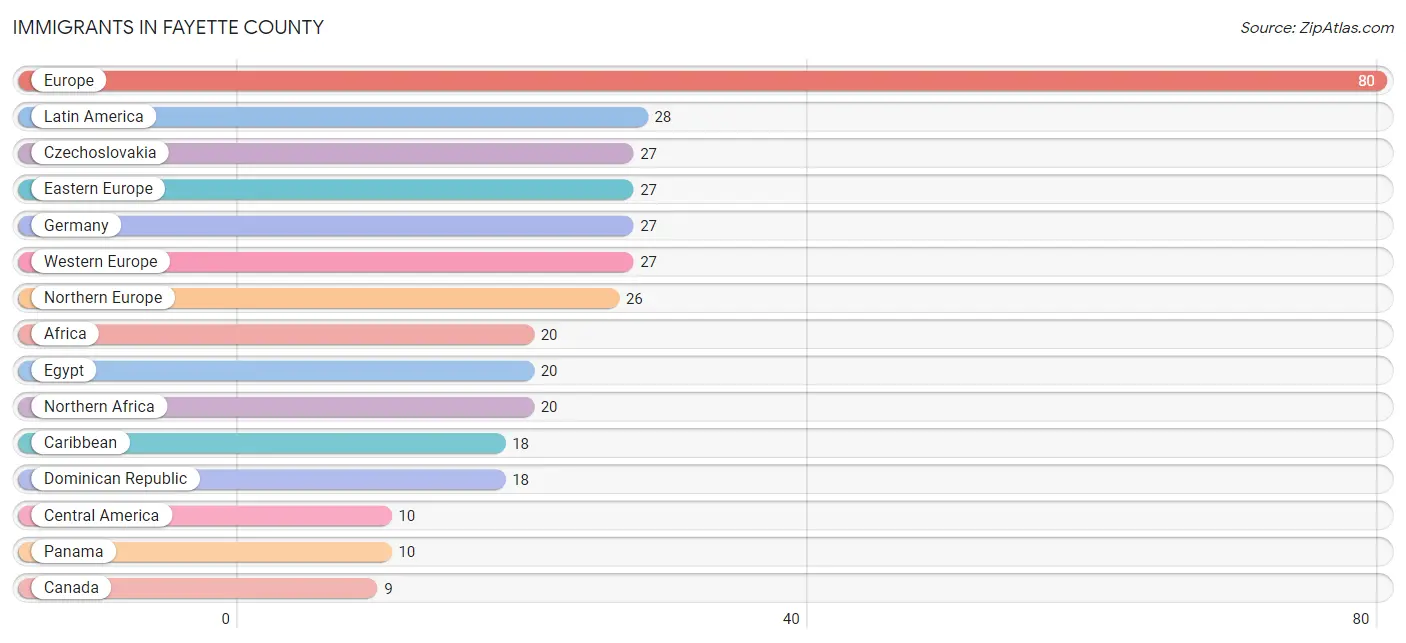
Immigrants in Fayette County
The most numerous immigrant groups reported in Fayette County came from Europe (80 | 0.2%), Latin America (28 | 0.1%), Czechoslovakia (27 | 0.1%), Eastern Europe (27 | 0.1%), and Germany (27 | 0.1%), together accounting for 0.5% of all Fayette County residents.
| Immigration Origin | # Population | % Population |
| Africa | 20 | 0.1% |
| Canada | 9 | 0.0% |
| Caribbean | 18 | 0.0% |
| Central America | 10 | 0.0% |
| Czechoslovakia | 27 | 0.1% |
| Dominican Republic | 18 | 0.0% |
| Eastern Europe | 27 | 0.1% |
| Egypt | 20 | 0.1% |
| Europe | 80 | 0.2% |
| Germany | 27 | 0.1% |
| Latin America | 28 | 0.1% |
| Northern Africa | 20 | 0.1% |
| Northern Europe | 26 | 0.1% |
| Panama | 10 | 0.0% |
| Western Europe | 27 | 0.1% | View All 15 Rows |
Sex and Age in Fayette County
Sex and Age in Fayette County
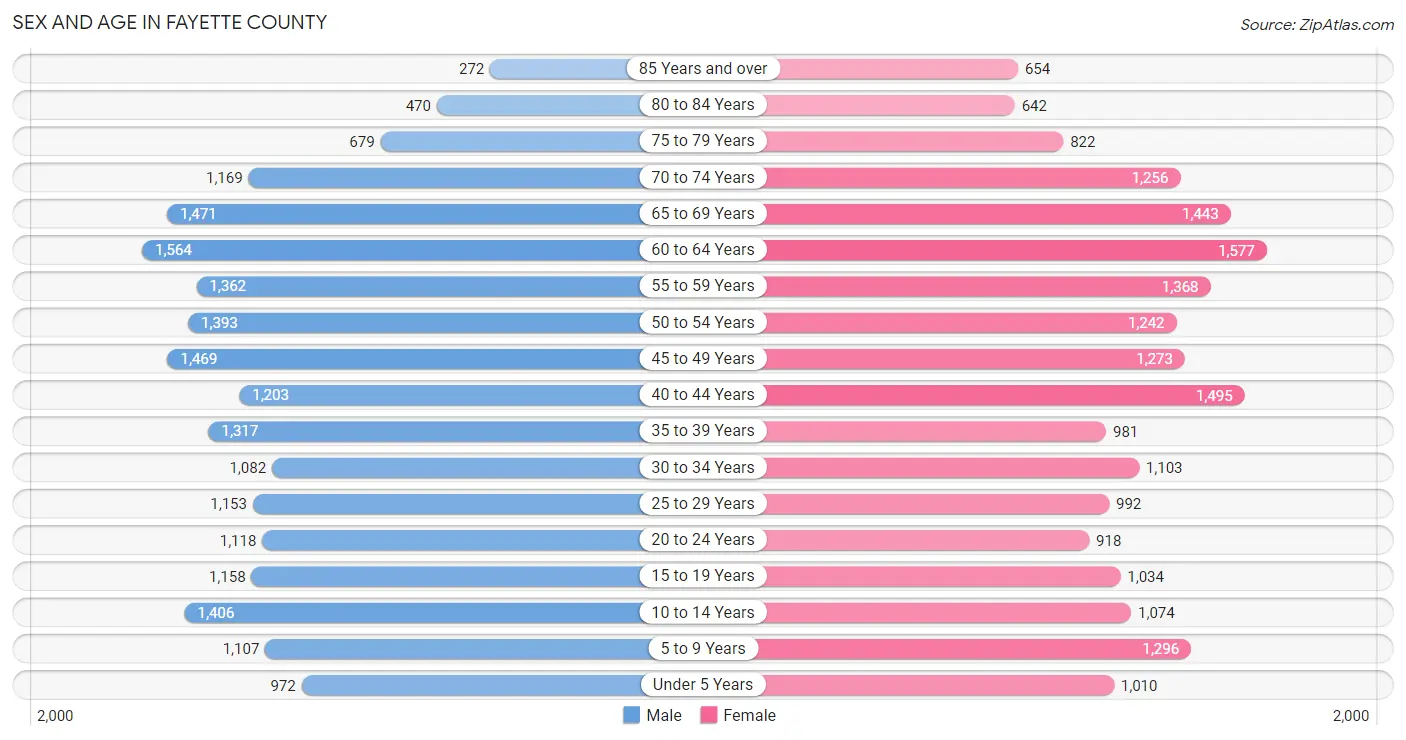
The most populous age groups in Fayette County are 60 to 64 Years (1,564 | 7.7%) for men and 60 to 64 Years (1,577 | 7.8%) for women.
| Age Bracket | Male | Female |
| Under 5 Years | 972 (4.8%) | 1,010 (5.0%) |
| 5 to 9 Years | 1,107 (5.4%) | 1,296 (6.4%) |
| 10 to 14 Years | 1,406 (6.9%) | 1,074 (5.3%) |
| 15 to 19 Years | 1,158 (5.7%) | 1,034 (5.1%) |
| 20 to 24 Years | 1,118 (5.5%) | 918 (4.5%) |
| 25 to 29 Years | 1,153 (5.7%) | 992 (4.9%) |
| 30 to 34 Years | 1,082 (5.3%) | 1,103 (5.5%) |
| 35 to 39 Years | 1,317 (6.5%) | 981 (4.9%) |
| 40 to 44 Years | 1,203 (5.9%) | 1,495 (7.4%) |
| 45 to 49 Years | 1,469 (7.2%) | 1,273 (6.3%) |
| 50 to 54 Years | 1,393 (6.8%) | 1,242 (6.1%) |
| 55 to 59 Years | 1,362 (6.7%) | 1,368 (6.8%) |
| 60 to 64 Years | 1,564 (7.7%) | 1,577 (7.8%) |
| 65 to 69 Years | 1,471 (7.2%) | 1,443 (7.1%) |
| 70 to 74 Years | 1,169 (5.7%) | 1,256 (6.2%) |
| 75 to 79 Years | 679 (3.3%) | 822 (4.1%) |
| 80 to 84 Years | 470 (2.3%) | 642 (3.2%) |
| 85 Years and over | 272 (1.3%) | 654 (3.2%) |
| Total | 20,365 (100.0%) | 20,180 (100.0%) |
Families and Households in Fayette County
Median Family Size in Fayette County
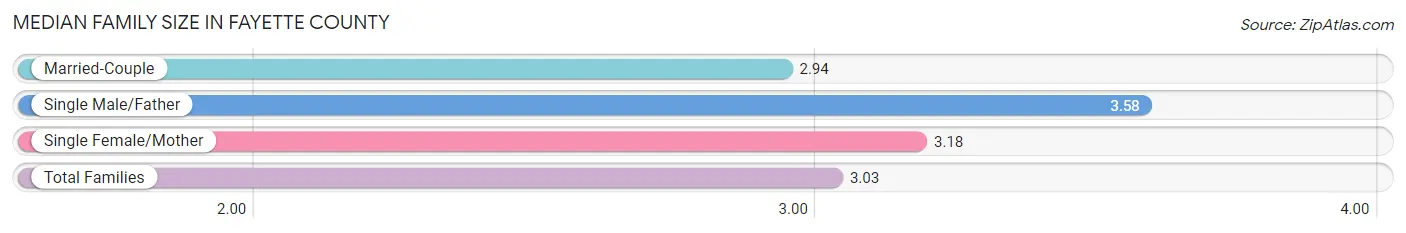
The median family size in Fayette County is 3.03 persons per family, with single male/father families (852 | 8.1%) accounting for the largest median family size of 3.58 persons per family. On the other hand, married-couple families (7,858 | 74.4%) represent the smallest median family size with 2.94 persons per family.
| Family Type | # Families | Family Size |
| Married-Couple | 7,858 (74.4%) | 2.94 |
| Single Male/Father | 852 (8.1%) | 3.58 |
| Single Female/Mother | 1,851 (17.5%) | 3.18 |
| Total Families | 10,561 (100.0%) | 3.03 |
Median Household Size in Fayette County
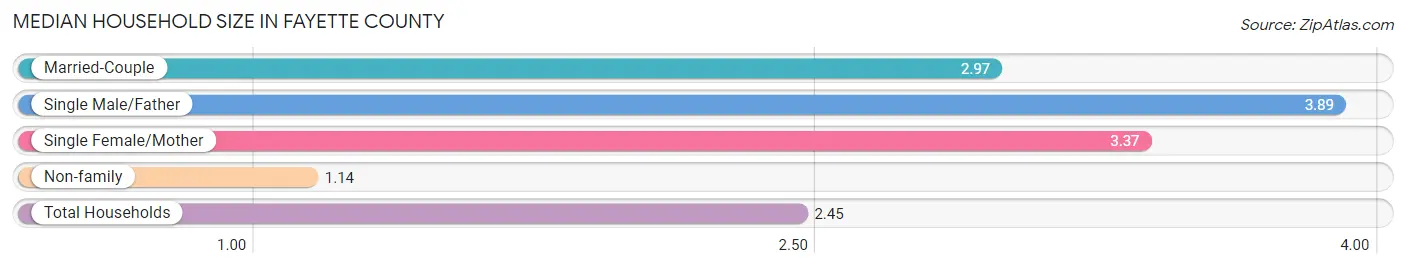
The median household size in Fayette County is 2.45 persons per household, with single male/father households (852 | 5.3%) accounting for the largest median household size of 3.89 persons per household. non-family households (5,377 | 33.7%) represent the smallest median household size with 1.14 persons per household.
| Household Type | # Households | Household Size |
| Married-Couple | 7,858 (49.3%) | 2.97 |
| Single Male/Father | 852 (5.3%) | 3.89 |
| Single Female/Mother | 1,851 (11.6%) | 3.37 |
| Non-family | 5,377 (33.7%) | 1.14 |
| Total Households | 15,938 (100.0%) | 2.45 |
Household Size by Marriage Status in Fayette County
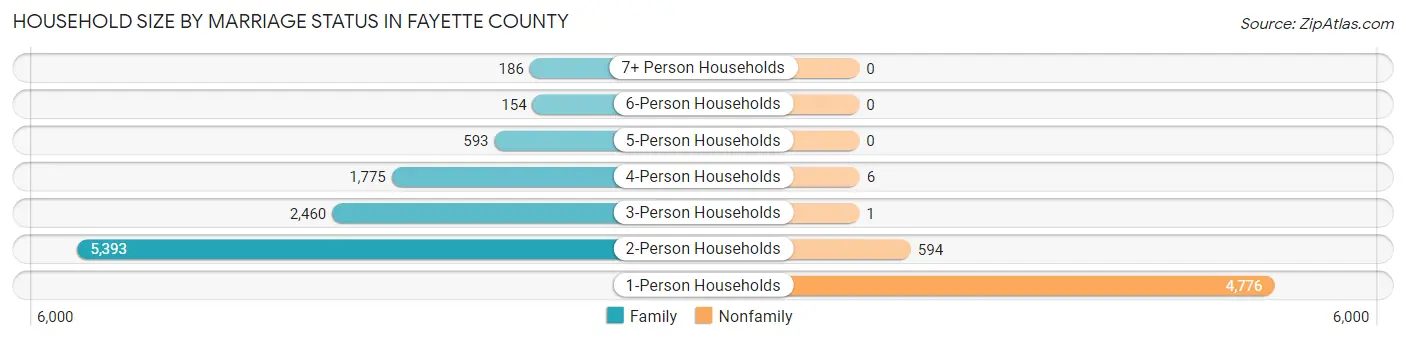
Out of a total of 15,938 households in Fayette County, 10,561 (66.3%) are family households, while 5,377 (33.7%) are nonfamily households. The most numerous type of family households are 2-person households, comprising 5,393, and the most common type of nonfamily households are 1-person households, comprising 4,776.
| Household Size | Family Households | Nonfamily Households |
| 1-Person Households | - | 4,776 (30.0%) |
| 2-Person Households | 5,393 (33.8%) | 594 (3.7%) |
| 3-Person Households | 2,460 (15.4%) | 1 (0.0%) |
| 4-Person Households | 1,775 (11.1%) | 6 (0.0%) |
| 5-Person Households | 593 (3.7%) | 0 (0.0%) |
| 6-Person Households | 154 (1.0%) | 0 (0.0%) |
| 7+ Person Households | 186 (1.2%) | 0 (0.0%) |
| Total | 10,561 (66.3%) | 5,377 (33.7%) |
Female Fertility in Fayette County
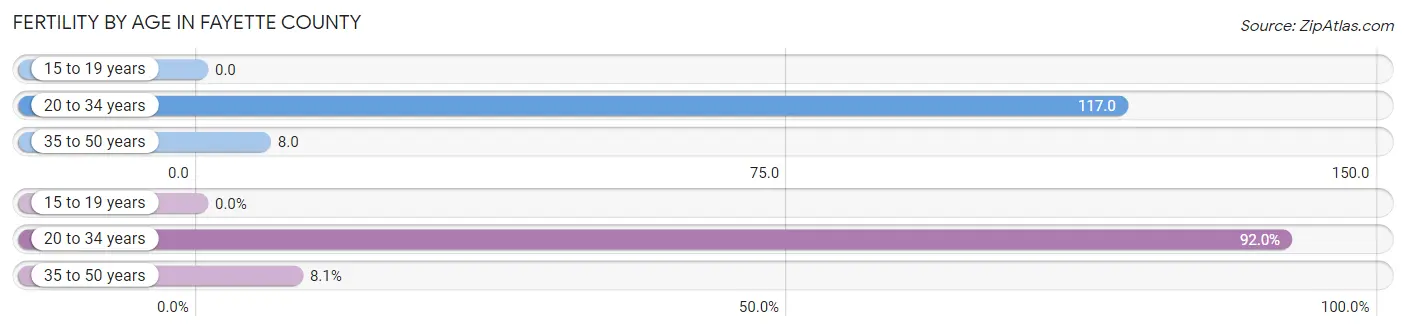
Fertility by Age in Fayette County
Average fertility rate in Fayette County is 48.0 births per 1,000 women. Women in the age bracket of 20 to 34 years have the highest fertility rate with 117.0 births per 1,000 women. Women in the age bracket of 20 to 34 years acount for 91.9% of all women with births.
| Age Bracket | Women with Births | Births / 1,000 Women |
| 15 to 19 years | 0 (0.0%) | 0.0 |
| 20 to 34 years | 354 (91.9%) | 117.0 |
| 35 to 50 years | 31 (8.1%) | 8.0 |
| Total | 385 (100.0%) | 48.0 |
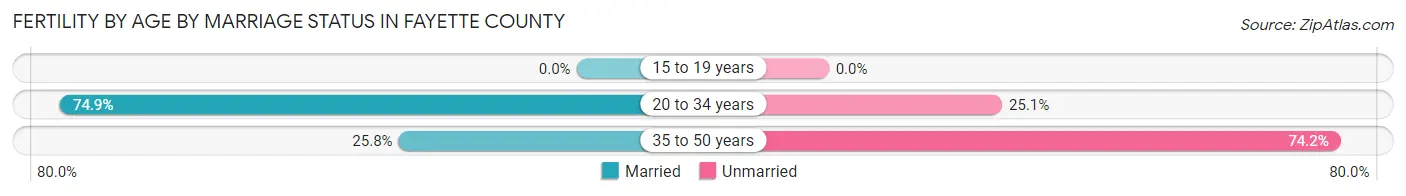
Fertility by Age by Marriage Status in Fayette County
70.9% of women with births (385) in Fayette County are married. The highest percentage of unmarried women with births falls into 35 to 50 years age bracket with 74.2% of them unmarried at the time of birth, while the lowest percentage of unmarried women with births belong to 20 to 34 years age bracket with 25.1% of them unmarried.
| Age Bracket | Married | Unmarried |
| 15 to 19 years | 0 (0.0%) | 0 (0.0%) |
| 20 to 34 years | 265 (74.9%) | 89 (25.1%) |
| 35 to 50 years | 8 (25.8%) | 23 (74.2%) |
| Total | 273 (70.9%) | 112 (29.1%) |
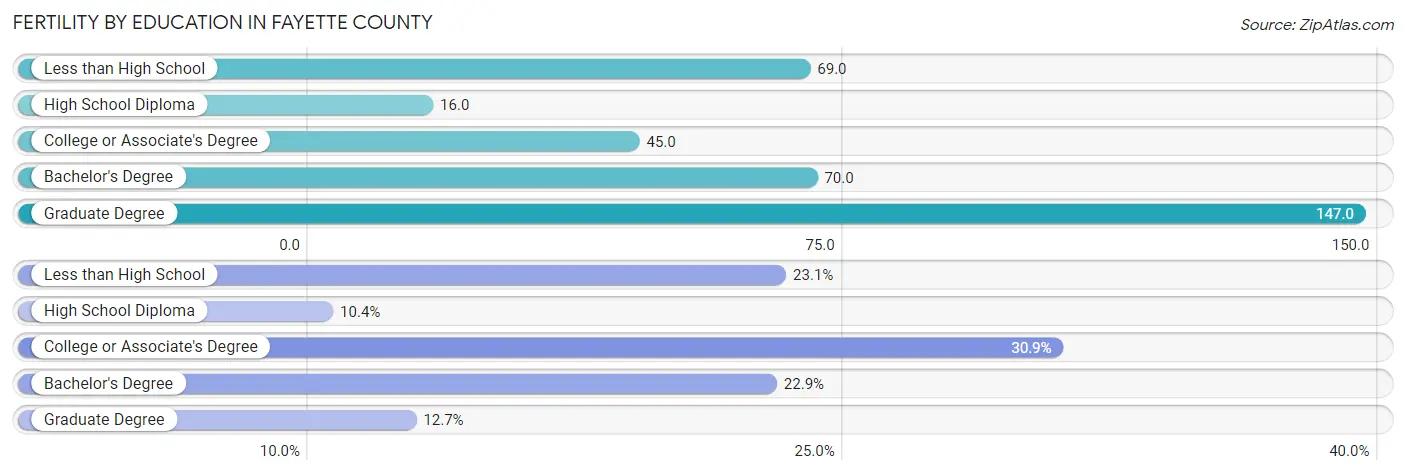
Fertility by Education in Fayette County
Average fertility rate in Fayette County is 48.0 births per 1,000 women. Women with the education attainment of graduate degree have the highest fertility rate of 147.0 births per 1,000 women, while women with the education attainment of high school diploma have the lowest fertility at 16.0 births per 1,000 women. Women with the education attainment of college or associate's degree represent 30.9% of all women with births.
| Educational Attainment | Women with Births | Births / 1,000 Women |
| Less than High School | 89 (23.1%) | 69.0 |
| High School Diploma | 40 (10.4%) | 16.0 |
| College or Associate's Degree | 119 (30.9%) | 45.0 |
| Bachelor's Degree | 88 (22.9%) | 70.0 |
| Graduate Degree | 49 (12.7%) | 147.0 |
| Total | 385 (100.0%) | 48.0 |
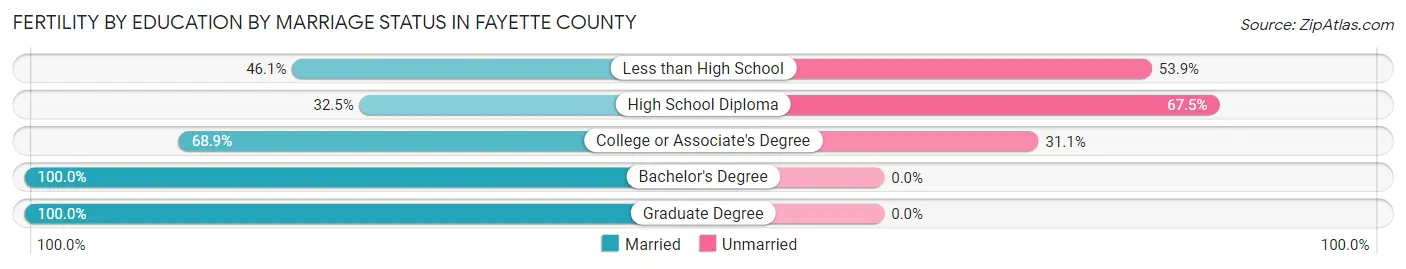
Fertility by Education by Marriage Status in Fayette County
29.1% of women with births in Fayette County are unmarried. Women with the educational attainment of bachelor's degree are most likely to be married with 100.0% of them married at childbirth, while women with the educational attainment of high school diploma are least likely to be married with 67.5% of them unmarried at childbirth.
| Educational Attainment | Married | Unmarried |
| Less than High School | 41 (46.1%) | 48 (53.9%) |
| High School Diploma | 13 (32.5%) | 27 (67.5%) |
| College or Associate's Degree | 82 (68.9%) | 37 (31.1%) |
| Bachelor's Degree | 88 (100.0%) | 0 (0.0%) |
| Graduate Degree | 49 (100.0%) | 0 (0.0%) |
| Total | 273 (70.9%) | 112 (29.1%) |
Income in Fayette County
Income Overview in Fayette County
Per Capita Income in Fayette County is $24,818, while median incomes of families and households are $61,952 and $50,090 respectively.
| Characteristic | Number | Measure |
| Per Capita Income | 40,545 | $24,818 |
| Median Family Income | 10,561 | $61,952 |
| Mean Family Income | 10,561 | $72,321 |
| Median Household Income | 15,938 | $50,090 |
| Mean Household Income | 15,938 | $60,852 |
| Income Deficit | 10,561 | $10,449 |
| Wage / Income Gap (%) | 40,545 | 23.55% |
| Wage / Income Gap ($) | 40,545 | 76.45¢ per $1 |
| Gini / Inequality Index | 40,545 | 0.44 |
Earnings by Sex in Fayette County
Average Earnings in Fayette County are $33,898, $37,886 for men and $28,965 for women, a difference of 23.5%.
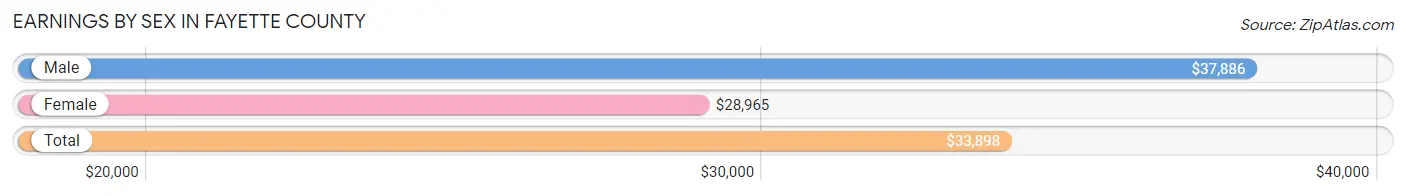
| Sex | Number | Average Earnings |
| Male | 8,758 (54.5%) | $37,886 |
| Female | 7,313 (45.5%) | $28,965 |
| Total | 16,071 (100.0%) | $33,898 |
Earnings by Sex by Income Bracket in Fayette County
The most common earnings brackets in Fayette County are $55,000 to $64,999 for men (912 | 10.4%) and $30,000 to $34,999 for women (731 | 10.0%).
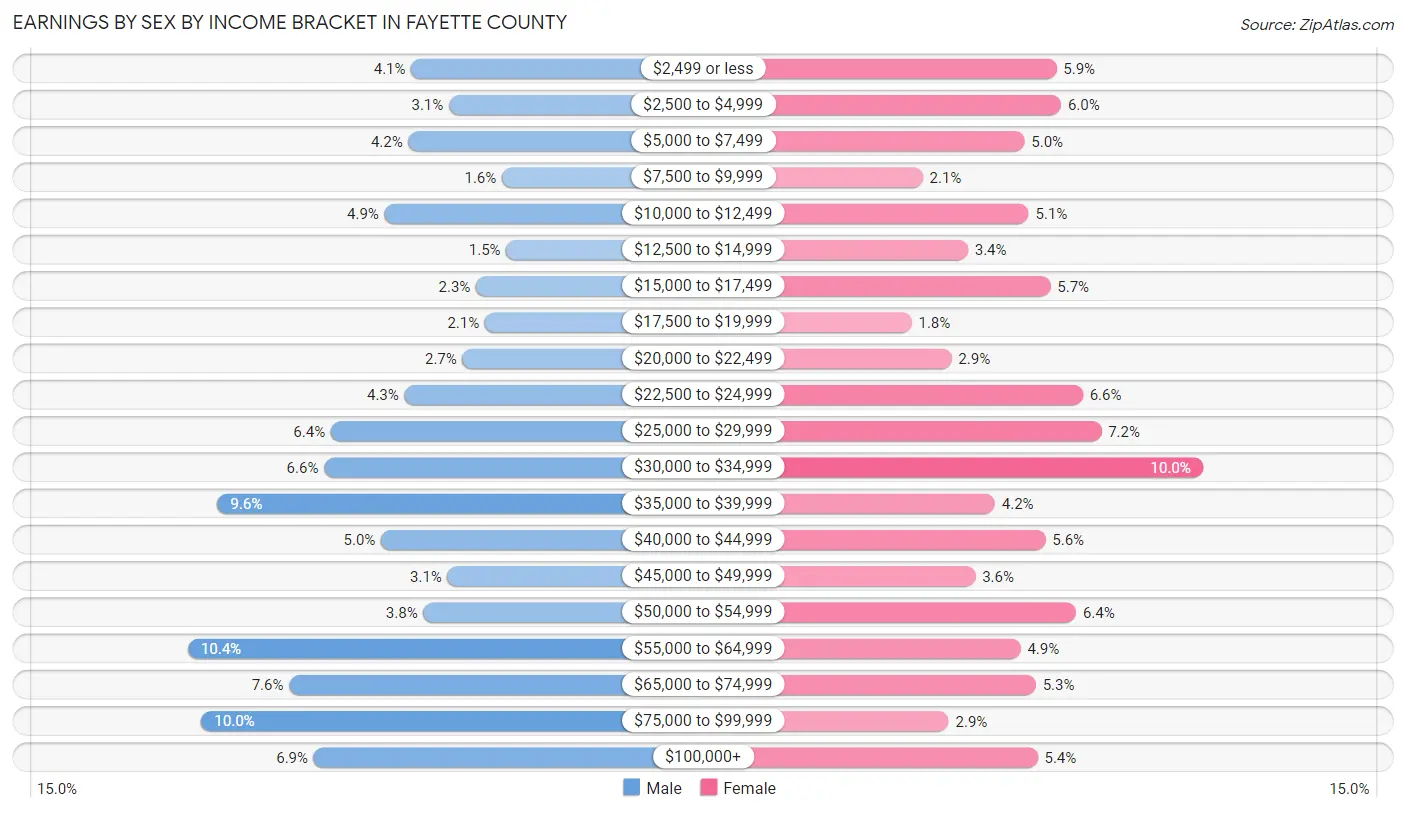
| Income | Male | Female |
| $2,499 or less | 362 (4.1%) | 431 (5.9%) |
| $2,500 to $4,999 | 269 (3.1%) | 440 (6.0%) |
| $5,000 to $7,499 | 369 (4.2%) | 365 (5.0%) |
| $7,500 to $9,999 | 138 (1.6%) | 156 (2.1%) |
| $10,000 to $12,499 | 427 (4.9%) | 374 (5.1%) |
| $12,500 to $14,999 | 128 (1.5%) | 249 (3.4%) |
| $15,000 to $17,499 | 202 (2.3%) | 418 (5.7%) |
| $17,500 to $19,999 | 180 (2.1%) | 133 (1.8%) |
| $20,000 to $22,499 | 236 (2.7%) | 215 (2.9%) |
| $22,500 to $24,999 | 378 (4.3%) | 485 (6.6%) |
| $25,000 to $29,999 | 560 (6.4%) | 523 (7.1%) |
| $30,000 to $34,999 | 576 (6.6%) | 731 (10.0%) |
| $35,000 to $39,999 | 839 (9.6%) | 304 (4.2%) |
| $40,000 to $44,999 | 436 (5.0%) | 408 (5.6%) |
| $45,000 to $49,999 | 272 (3.1%) | 264 (3.6%) |
| $50,000 to $54,999 | 332 (3.8%) | 471 (6.4%) |
| $55,000 to $64,999 | 912 (10.4%) | 357 (4.9%) |
| $65,000 to $74,999 | 662 (7.6%) | 388 (5.3%) |
| $75,000 to $99,999 | 878 (10.0%) | 209 (2.9%) |
| $100,000+ | 602 (6.9%) | 392 (5.4%) |
| Total | 8,758 (100.0%) | 7,313 (100.0%) |
Earnings by Sex by Educational Attainment in Fayette County
Average earnings in Fayette County are $41,866 for men and $31,972 for women, a difference of 23.6%. Men with an educational attainment of graduate degree enjoy the highest average annual earnings of $55,898, while those with less than high school education earn the least with $30,962. Women with an educational attainment of graduate degree earn the most with the average annual earnings of $58,850, while those with less than high school education have the smallest earnings of $12,446.
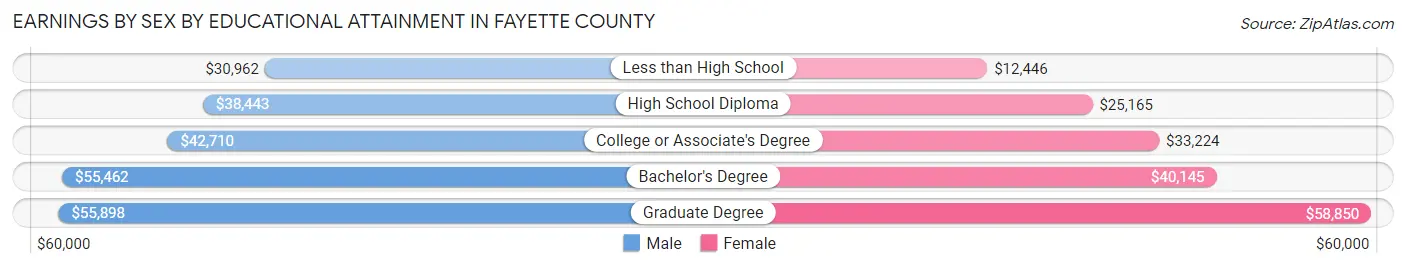
| Educational Attainment | Male Income | Female Income |
| Less than High School | $30,962 | $12,446 |
| High School Diploma | $38,443 | $25,165 |
| College or Associate's Degree | $42,710 | $33,224 |
| Bachelor's Degree | $55,462 | $40,145 |
| Graduate Degree | $55,898 | $58,850 |
| Total | $41,866 | $31,972 |
Family Income in Fayette County
Family Income Brackets in Fayette County
According to the Fayette County family income data, there are 2,471 families falling into the $50,000 to $74,999 income range, which is the most common income bracket and makes up 23.4% of all families. Conversely, the $200,000+ income bracket is the least frequent group with only 327 families (3.1%) belonging to this category.
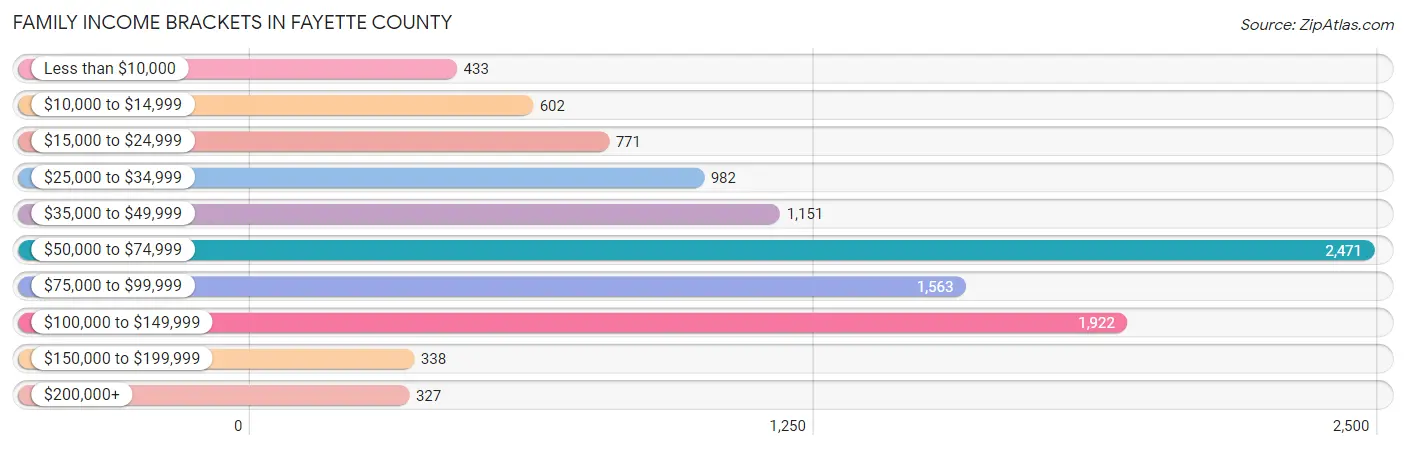
| Income Bracket | # Families | % Families |
| Less than $10,000 | 433 | 4.1% |
| $10,000 to $14,999 | 602 | 5.7% |
| $15,000 to $24,999 | 771 | 7.3% |
| $25,000 to $34,999 | 982 | 9.3% |
| $35,000 to $49,999 | 1,151 | 10.9% |
| $50,000 to $74,999 | 2,471 | 23.4% |
| $75,000 to $99,999 | 1,563 | 14.8% |
| $100,000 to $149,999 | 1,922 | 18.2% |
| $150,000 to $199,999 | 338 | 3.2% |
| $200,000+ | 327 | 3.1% |
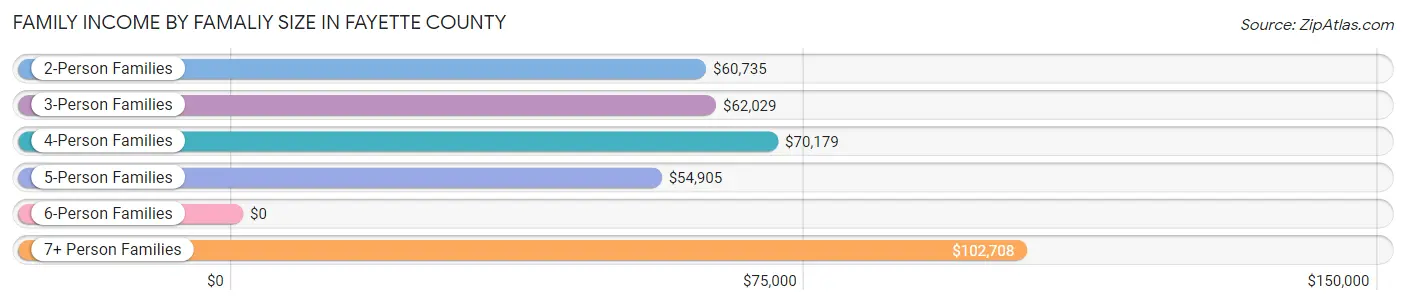
Family Income by Famaliy Size in Fayette County
7+ person families (104 | 1.0%) account for the highest median family income in Fayette County with $102,708 per family, while 2-person families (5,649 | 53.5%) have the highest median income of $30,368 per family member.
| Income Bracket | # Families | Median Income |
| 2-Person Families | 5,649 (53.5%) | $60,735 |
| 3-Person Families | 2,393 (22.7%) | $62,029 |
| 4-Person Families | 1,691 (16.0%) | $70,179 |
| 5-Person Families | 557 (5.3%) | $54,905 |
| 6-Person Families | 167 (1.6%) | $0 |
| 7+ Person Families | 104 (1.0%) | $102,708 |
| Total | 10,561 (100.0%) | $61,952 |
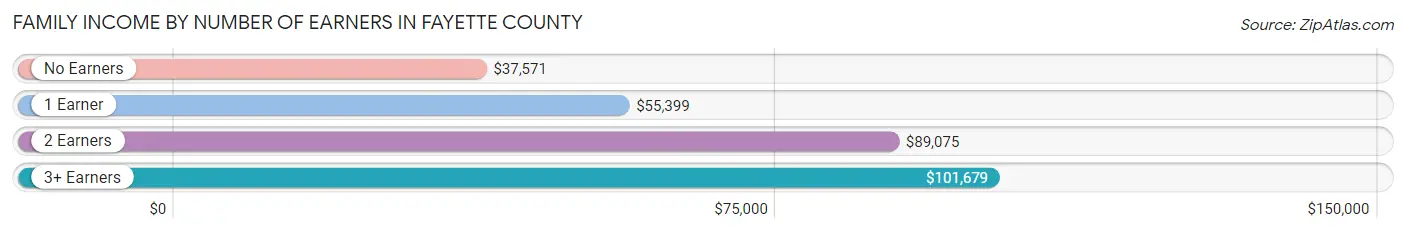
Family Income by Number of Earners in Fayette County
The median family income in Fayette County is $61,952, with families comprising 3+ earners (451) having the highest median family income of $101,679, while families with no earners (2,842) have the lowest median family income of $37,571, accounting for 4.3% and 26.9% of families, respectively.
| Number of Earners | # Families | Median Income |
| No Earners | 2,842 (26.9%) | $37,571 |
| 1 Earner | 3,742 (35.4%) | $55,399 |
| 2 Earners | 3,526 (33.4%) | $89,075 |
| 3+ Earners | 451 (4.3%) | $101,679 |
| Total | 10,561 (100.0%) | $61,952 |
Household Income in Fayette County
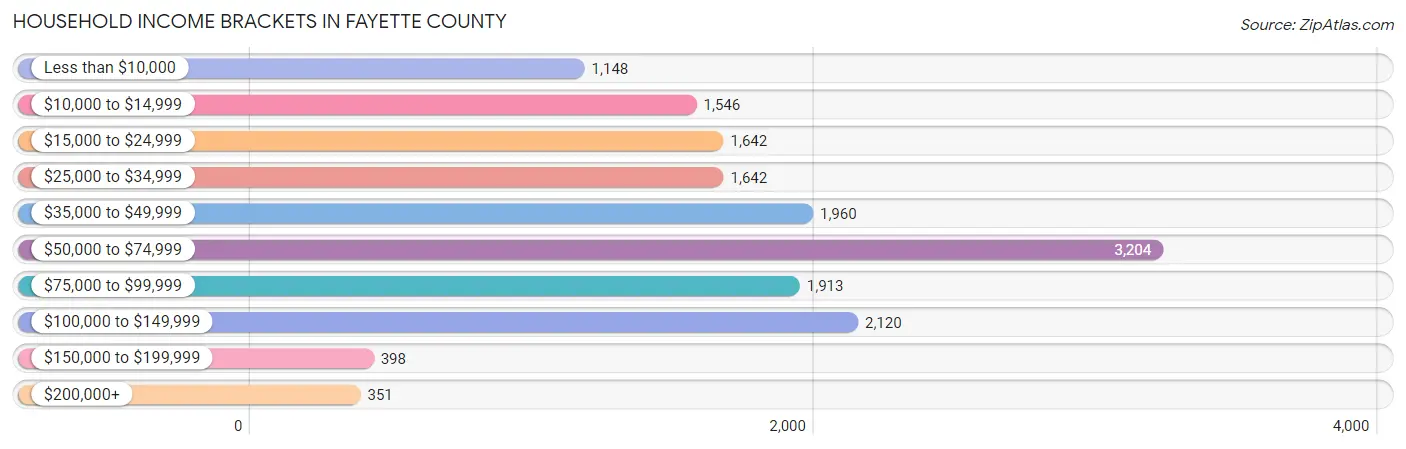
Household Income Brackets in Fayette County
With 3,204 households falling in the category, the $50,000 to $74,999 income range is the most frequent in Fayette County, accounting for 20.1% of all households. In contrast, only 351 households (2.2%) fall into the $200,000+ income bracket, making it the least populous group.
| Income Bracket | # Households | % Households |
| Less than $10,000 | 1,148 | 7.2% |
| $10,000 to $14,999 | 1,546 | 9.7% |
| $15,000 to $24,999 | 1,642 | 10.3% |
| $25,000 to $34,999 | 1,642 | 10.3% |
| $35,000 to $49,999 | 1,960 | 12.3% |
| $50,000 to $74,999 | 3,204 | 20.1% |
| $75,000 to $99,999 | 1,913 | 12.0% |
| $100,000 to $149,999 | 2,120 | 13.3% |
| $150,000 to $199,999 | 398 | 2.5% |
| $200,000+ | 351 | 2.2% |
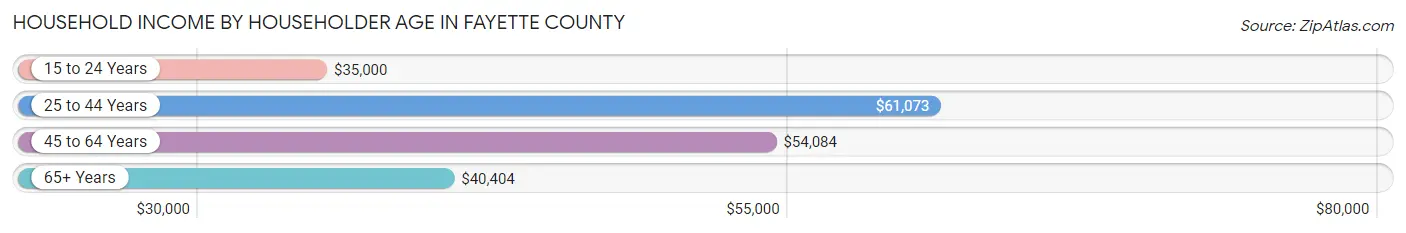
Household Income by Householder Age in Fayette County
The median household income in Fayette County is $50,090, with the highest median household income of $61,073 found in the 25 to 44 years age bracket for the primary householder. A total of 4,105 households (25.8%) fall into this category. Meanwhile, the 15 to 24 years age bracket for the primary householder has the lowest median household income of $35,000, with 482 households (3.0%) in this group.
| Income Bracket | # Households | Median Income |
| 15 to 24 Years | 482 (3.0%) | $35,000 |
| 25 to 44 Years | 4,105 (25.8%) | $61,073 |
| 45 to 64 Years | 5,717 (35.9%) | $54,084 |
| 65+ Years | 5,634 (35.3%) | $40,404 |
| Total | 15,938 (100.0%) | $50,090 |
Poverty in Fayette County
Income Below Poverty by Sex and Age in Fayette County
With 20.9% poverty level for males and 22.1% for females among the residents of Fayette County, 16 and 17 year old males and under 5 year old females are the most vulnerable to poverty, with 267 males (50.2%) and 394 females (40.2%) in their respective age groups living below the poverty level.
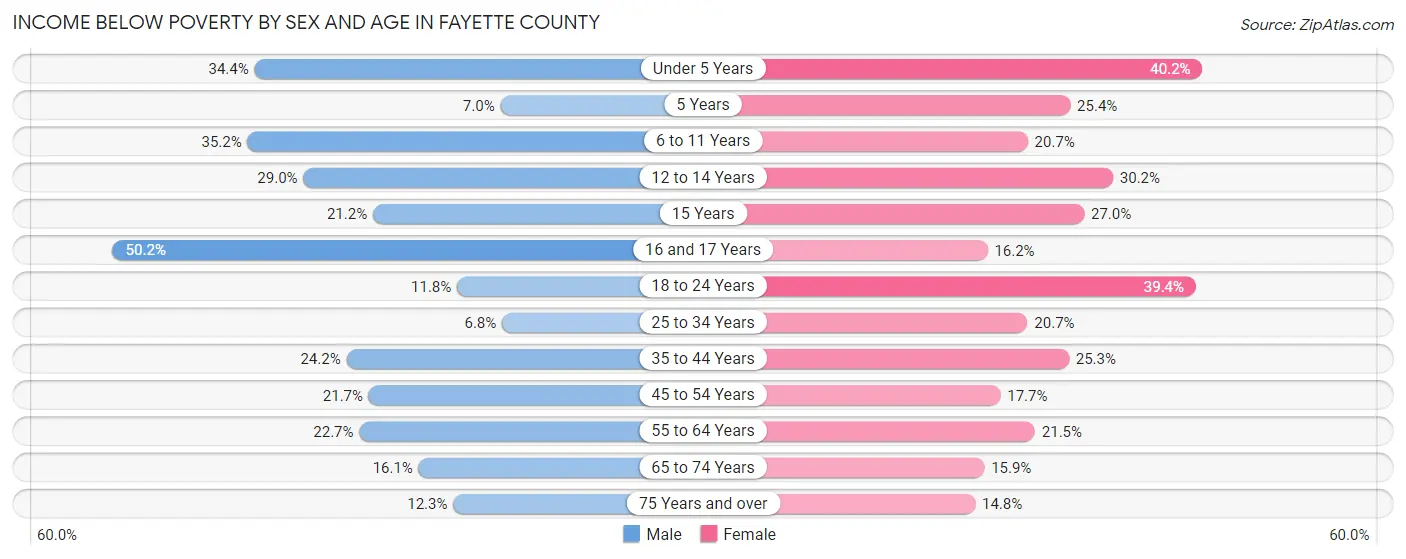
| Age Bracket | Male | Female |
| Under 5 Years | 316 (34.4%) | 394 (40.2%) |
| 5 Years | 14 (7.0%) | 44 (25.4%) |
| 6 to 11 Years | 486 (35.2%) | 329 (20.7%) |
| 12 to 14 Years | 260 (28.9%) | 163 (30.2%) |
| 15 Years | 46 (21.2%) | 58 (27.0%) |
| 16 and 17 Years | 267 (50.2%) | 79 (16.2%) |
| 18 to 24 Years | 164 (11.8%) | 457 (39.4%) |
| 25 to 34 Years | 143 (6.8%) | 433 (20.7%) |
| 35 to 44 Years | 546 (24.1%) | 626 (25.3%) |
| 45 to 54 Years | 553 (21.7%) | 444 (17.6%) |
| 55 to 64 Years | 644 (22.7%) | 623 (21.5%) |
| 65 to 74 Years | 412 (16.1%) | 425 (15.9%) |
| 75 Years and over | 166 (12.3%) | 296 (14.8%) |
| Total | 4,017 (20.9%) | 4,371 (22.1%) |
Income Above Poverty by Sex and Age in Fayette County
According to the poverty statistics in Fayette County, males aged 25 to 34 years and females aged 75 years and over are the age groups that are most secure financially, with 93.2% of males and 85.2% of females in these age groups living above the poverty line.
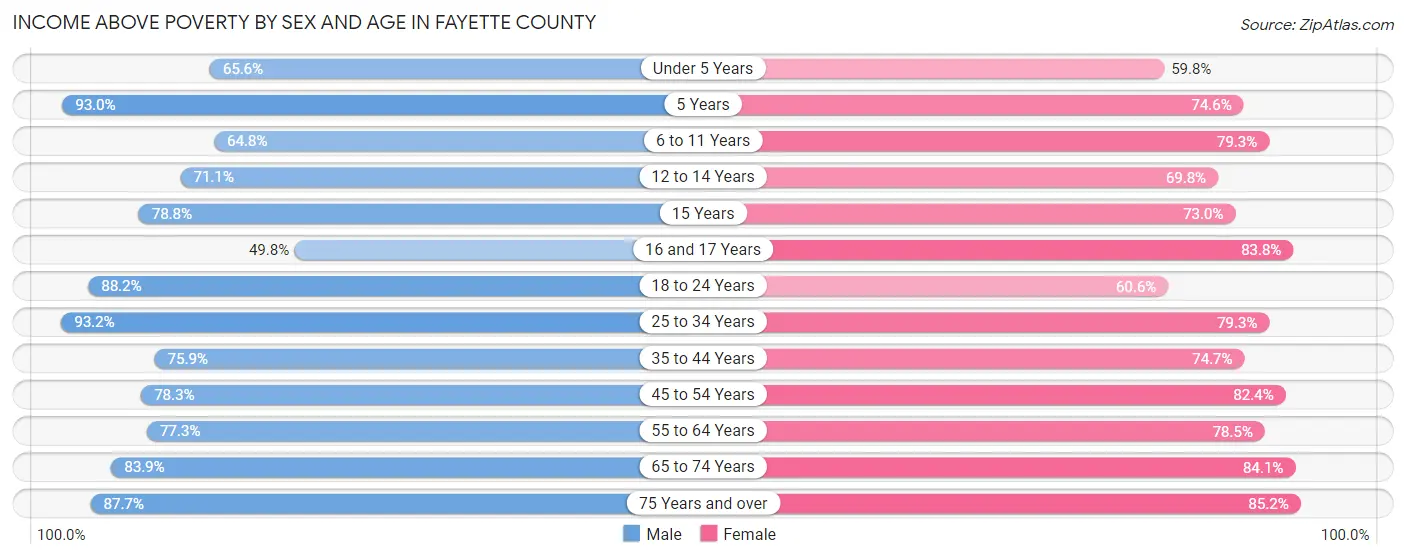
| Age Bracket | Male | Female |
| Under 5 Years | 603 (65.6%) | 587 (59.8%) |
| 5 Years | 186 (93.0%) | 129 (74.6%) |
| 6 to 11 Years | 896 (64.8%) | 1,260 (79.3%) |
| 12 to 14 Years | 638 (71.1%) | 377 (69.8%) |
| 15 Years | 171 (78.8%) | 157 (73.0%) |
| 16 and 17 Years | 265 (49.8%) | 408 (83.8%) |
| 18 to 24 Years | 1,222 (88.2%) | 702 (60.6%) |
| 25 to 34 Years | 1,953 (93.2%) | 1,662 (79.3%) |
| 35 to 44 Years | 1,715 (75.8%) | 1,850 (74.7%) |
| 45 to 54 Years | 2,000 (78.3%) | 2,071 (82.4%) |
| 55 to 64 Years | 2,190 (77.3%) | 2,275 (78.5%) |
| 65 to 74 Years | 2,145 (83.9%) | 2,254 (84.1%) |
| 75 Years and over | 1,188 (87.7%) | 1,699 (85.2%) |
| Total | 15,172 (79.1%) | 15,431 (77.9%) |
Income Below Poverty Among Married-Couple Families in Fayette County
The poverty statistics for married-couple families in Fayette County show that 7.4% or 582 of the total 7,858 families live below the poverty line. Families with 3 or 4 children have the highest poverty rate of 18.4%, comprising of 57 families. On the other hand, families with 5 or more children have the lowest poverty rate of 0.0%, which includes 0 families.
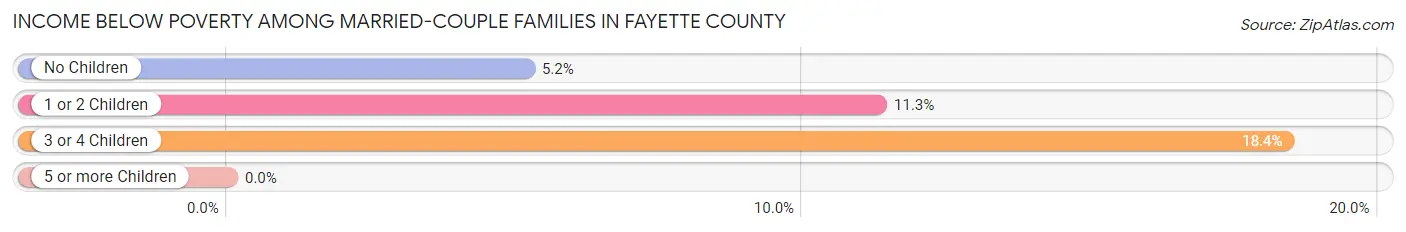
| Children | Above Poverty | Below Poverty |
| No Children | 5,012 (94.8%) | 273 (5.2%) |
| 1 or 2 Children | 1,978 (88.7%) | 252 (11.3%) |
| 3 or 4 Children | 253 (81.6%) | 57 (18.4%) |
| 5 or more Children | 33 (100.0%) | 0 (0.0%) |
| Total | 7,276 (92.6%) | 582 (7.4%) |
Income Below Poverty Among Single-Parent Households in Fayette County
According to the poverty data in Fayette County, 29.2% or 249 single-father households and 46.0% or 851 single-mother households are living below the poverty line. Among single-father households, those with 5 or more children have the highest poverty rate, with 46 households (55.4%) experiencing poverty. Likewise, among single-mother households, those with 1 or 2 children have the highest poverty rate, with 498 households (67.3%) falling below the poverty line.
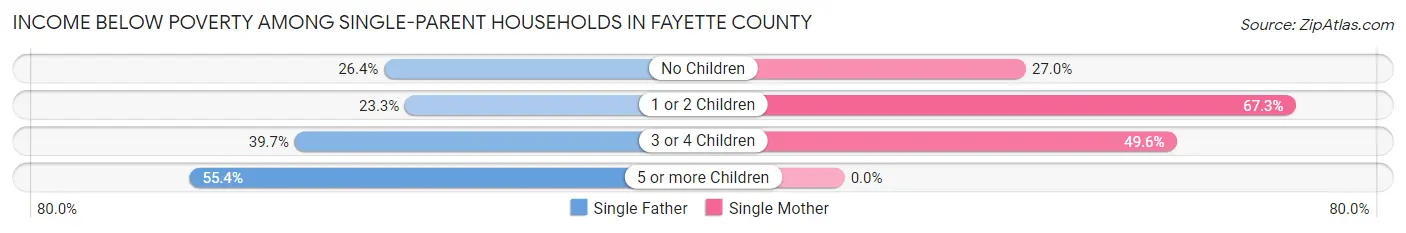
| Children | Single Father | Single Mother |
| No Children | 93 (26.4%) | 237 (27.0%) |
| 1 or 2 Children | 79 (23.3%) | 498 (67.3%) |
| 3 or 4 Children | 31 (39.7%) | 116 (49.6%) |
| 5 or more Children | 46 (55.4%) | 0 (0.0%) |
| Total | 249 (29.2%) | 851 (46.0%) |
Income Below Poverty Among Married-Couple vs Single-Parent Households in Fayette County
The poverty data for Fayette County shows that 582 of the married-couple family households (7.4%) and 1,100 of the single-parent households (40.7%) are living below the poverty level. Within the married-couple family households, those with 3 or 4 children have the highest poverty rate, with 57 households (18.4%) falling below the poverty line. Among the single-parent households, those with 5 or more children have the highest poverty rate, with 46 household (55.4%) living below poverty.
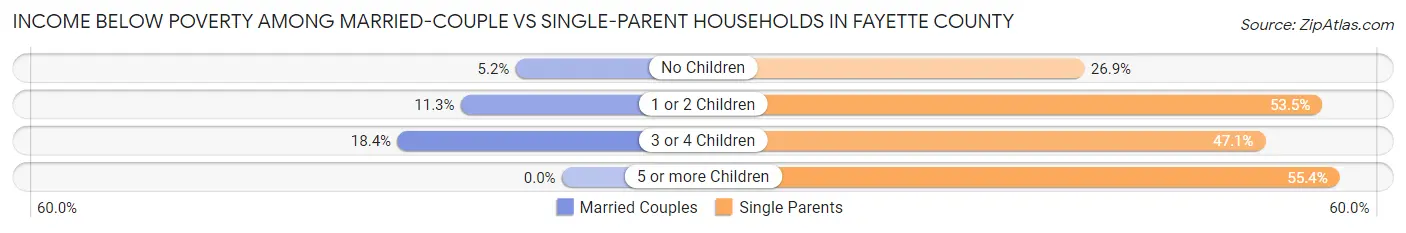
| Children | Married-Couple Families | Single-Parent Households |
| No Children | 273 (5.2%) | 330 (26.9%) |
| 1 or 2 Children | 252 (11.3%) | 577 (53.5%) |
| 3 or 4 Children | 57 (18.4%) | 147 (47.1%) |
| 5 or more Children | 0 (0.0%) | 46 (55.4%) |
| Total | 582 (7.4%) | 1,100 (40.7%) |
Employment Characteristics in Fayette County
Employment by Class of Employer in Fayette County
Among the 13,818 employed individuals in Fayette County, private company employees (9,679 | 70.1%), state government employees (1,160 | 8.4%), and local government employees (923 | 6.7%) make up the most common classes of employment.
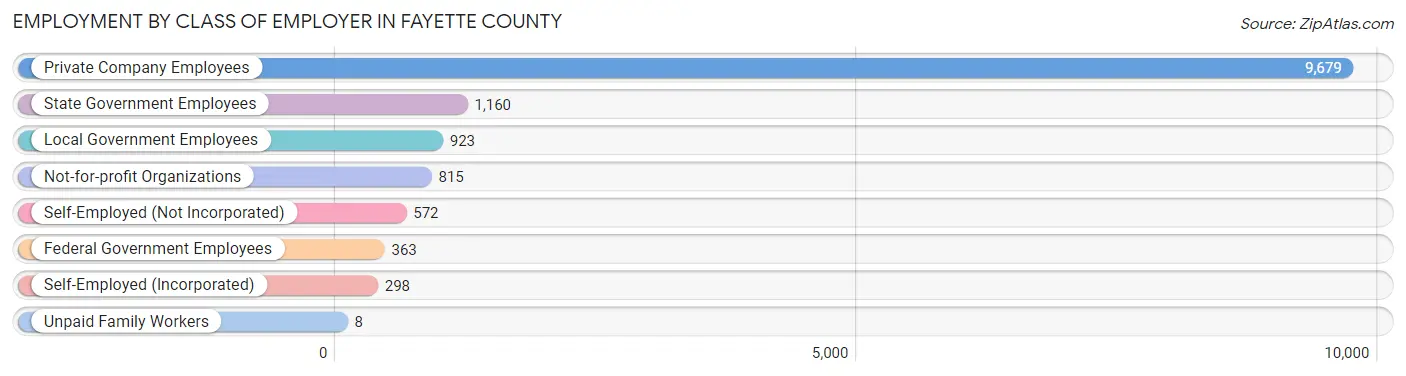
| Employer Class | # Employees | % Employees |
| Private Company Employees | 9,679 | 70.1% |
| Self-Employed (Incorporated) | 298 | 2.2% |
| Self-Employed (Not Incorporated) | 572 | 4.1% |
| Not-for-profit Organizations | 815 | 5.9% |
| Local Government Employees | 923 | 6.7% |
| State Government Employees | 1,160 | 8.4% |
| Federal Government Employees | 363 | 2.6% |
| Unpaid Family Workers | 8 | 0.1% |
| Total | 13,818 | 100.0% |
Employment Status by Age in Fayette County
According to the labor force statistics for Fayette County, out of the total population over 16 years of age (33,244), 46.2% or 15,359 individuals are in the labor force, with 7.5% or 1,152 of them unemployed. The age group with the highest labor force participation rate is 30 to 34 years, with 74.4% or 1,626 individuals in the labor force. Within the labor force, the 16 to 19 years age range has the highest percentage of unemployed individuals, with 28.5% or 182 of them being unemployed.
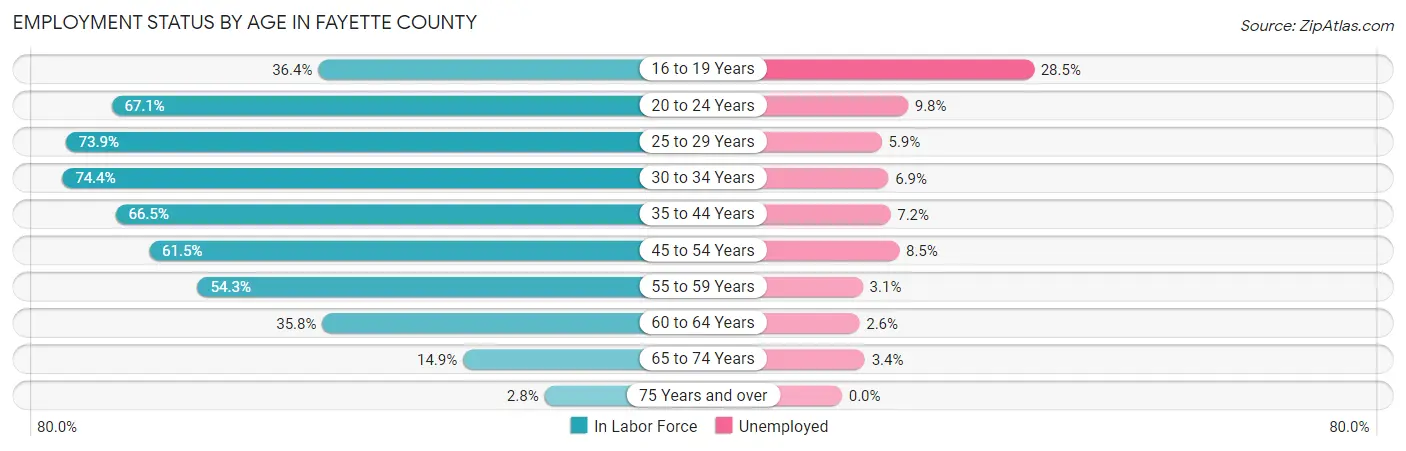
| Age Bracket | In Labor Force | Unemployed |
| 16 to 19 Years | 639 (36.4%) | 182 (28.5%) |
| 20 to 24 Years | 1,366 (67.1%) | 134 (9.8%) |
| 25 to 29 Years | 1,585 (73.9%) | 94 (5.9%) |
| 30 to 34 Years | 1,626 (74.4%) | 112 (6.9%) |
| 35 to 44 Years | 3,322 (66.5%) | 239 (7.2%) |
| 45 to 54 Years | 3,307 (61.5%) | 281 (8.5%) |
| 55 to 59 Years | 1,482 (54.3%) | 46 (3.1%) |
| 60 to 64 Years | 1,124 (35.8%) | 29 (2.6%) |
| 65 to 74 Years | 796 (14.9%) | 27 (3.4%) |
| 75 Years and over | 99 (2.8%) | 0 (0.0%) |
| Total | 15,359 (46.2%) | 1,152 (7.5%) |
Employment Status by Educational Attainment in Fayette County
According to labor force statistics for Fayette County, 60.5% of individuals (12,447) out of the total population between 25 and 64 years of age (20,574) are in the labor force, with 6.4% or 797 of them being unemployed. The group with the highest labor force participation rate are those with the educational attainment of bachelor's degree or higher, with 84.7% or 2,944 individuals in the labor force. Within the labor force, individuals with less than high school education have the highest percentage of unemployment, with 12.1% or 102 of them being unemployed.
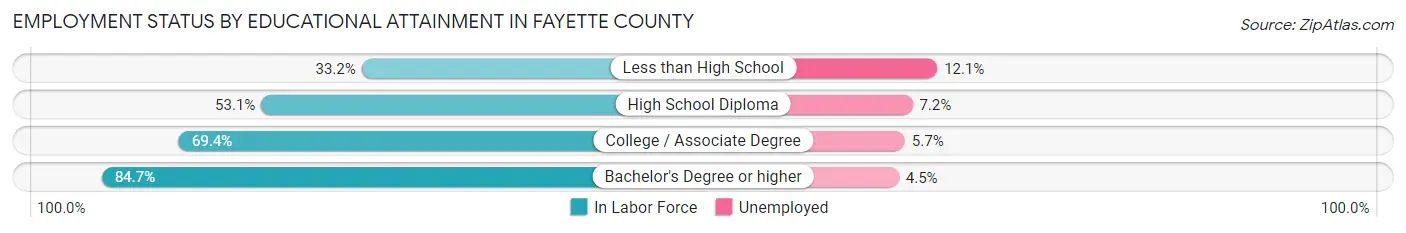
| Educational Attainment | In Labor Force | Unemployed |
| Less than High School | 847 (33.2%) | 309 (12.1%) |
| High School Diploma | 4,701 (53.1%) | 637 (7.2%) |
| College / Associate Degree | 3,950 (69.4%) | 324 (5.7%) |
| Bachelor's Degree or higher | 2,944 (84.7%) | 156 (4.5%) |
| Total | 12,447 (60.5%) | 1,317 (6.4%) |
Employment Occupations by Sex in Fayette County
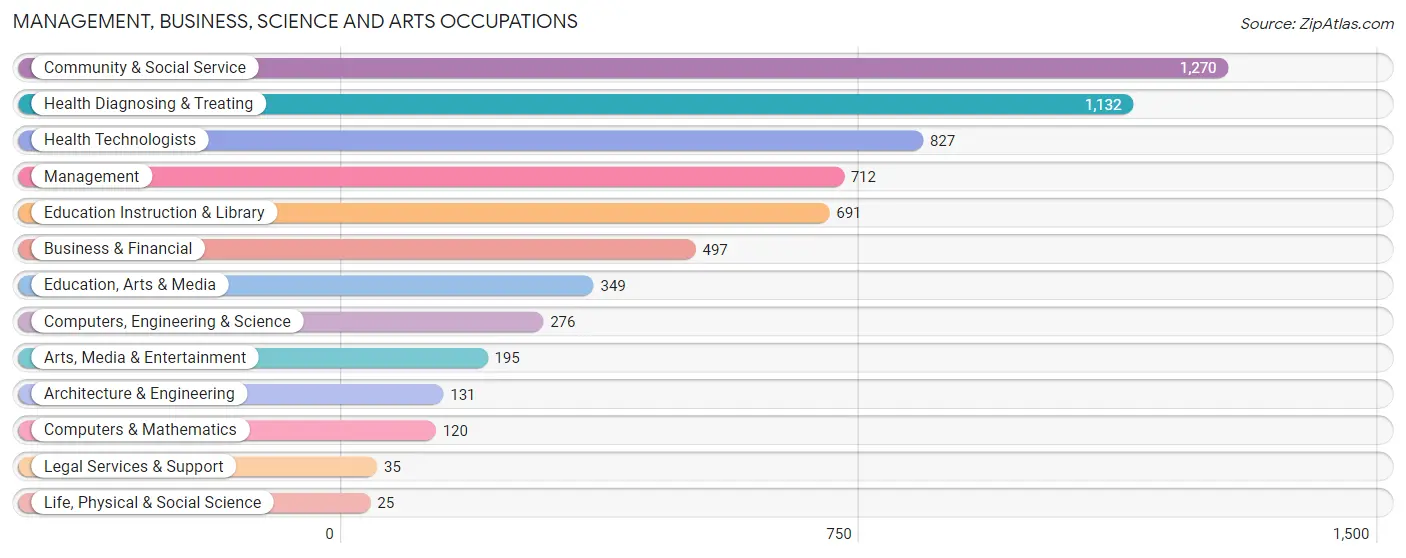
Management, Business, Science and Arts Occupations
The most common Management, Business, Science and Arts occupations in Fayette County are Community & Social Service (1,270 | 9.0%), Health Diagnosing & Treating (1,132 | 8.0%), Health Technologists (827 | 5.8%), Management (712 | 5.0%), and Education Instruction & Library (691 | 4.9%).
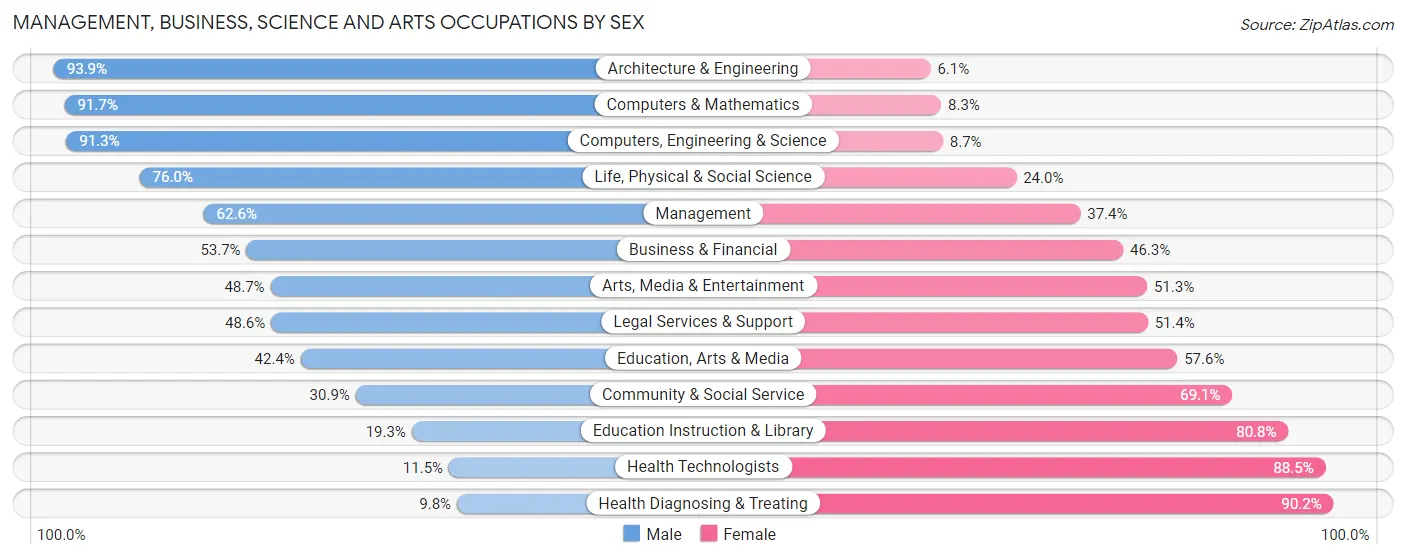
Management, Business, Science and Arts Occupations by Sex
Within the Management, Business, Science and Arts occupations in Fayette County, the most male-oriented occupations are Architecture & Engineering (93.9%), Computers & Mathematics (91.7%), and Computers, Engineering & Science (91.3%), while the most female-oriented occupations are Health Diagnosing & Treating (90.2%), Health Technologists (88.5%), and Education Instruction & Library (80.7%).
| Occupation | Male | Female |
| Management | 446 (62.6%) | 266 (37.4%) |
| Business & Financial | 267 (53.7%) | 230 (46.3%) |
| Computers, Engineering & Science | 252 (91.3%) | 24 (8.7%) |
| Computers & Mathematics | 110 (91.7%) | 10 (8.3%) |
| Architecture & Engineering | 123 (93.9%) | 8 (6.1%) |
| Life, Physical & Social Science | 19 (76.0%) | 6 (24.0%) |
| Community & Social Service | 393 (30.9%) | 877 (69.1%) |
| Education, Arts & Media | 148 (42.4%) | 201 (57.6%) |
| Legal Services & Support | 17 (48.6%) | 18 (51.4%) |
| Education Instruction & Library | 133 (19.3%) | 558 (80.7%) |
| Arts, Media & Entertainment | 95 (48.7%) | 100 (51.3%) |
| Health Diagnosing & Treating | 111 (9.8%) | 1,021 (90.2%) |
| Health Technologists | 95 (11.5%) | 732 (88.5%) |
| Total (Category) | 1,469 (37.8%) | 2,418 (62.2%) |
| Total (Overall) | 7,869 (55.5%) | 6,313 (44.5%) |
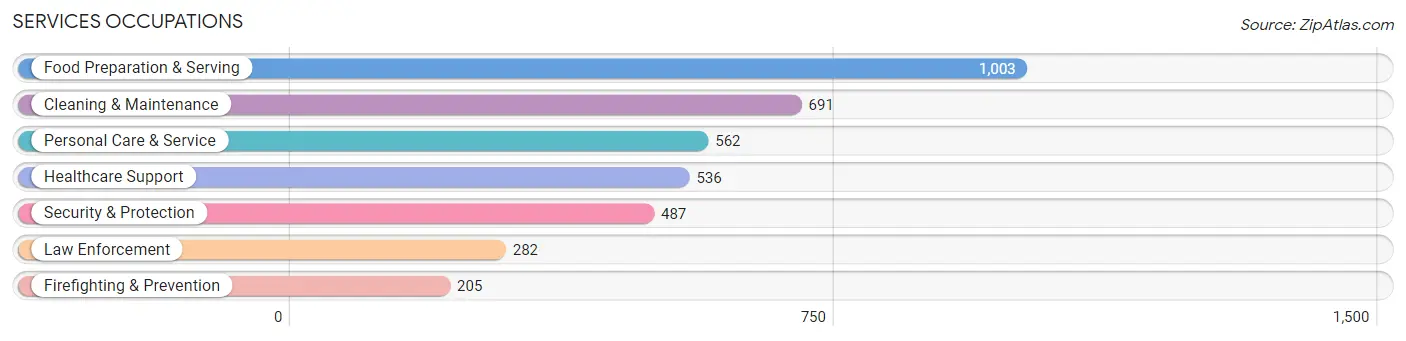
Services Occupations
The most common Services occupations in Fayette County are Food Preparation & Serving (1,003 | 7.1%), Cleaning & Maintenance (691 | 4.9%), Personal Care & Service (562 | 4.0%), Healthcare Support (536 | 3.8%), and Security & Protection (487 | 3.4%).
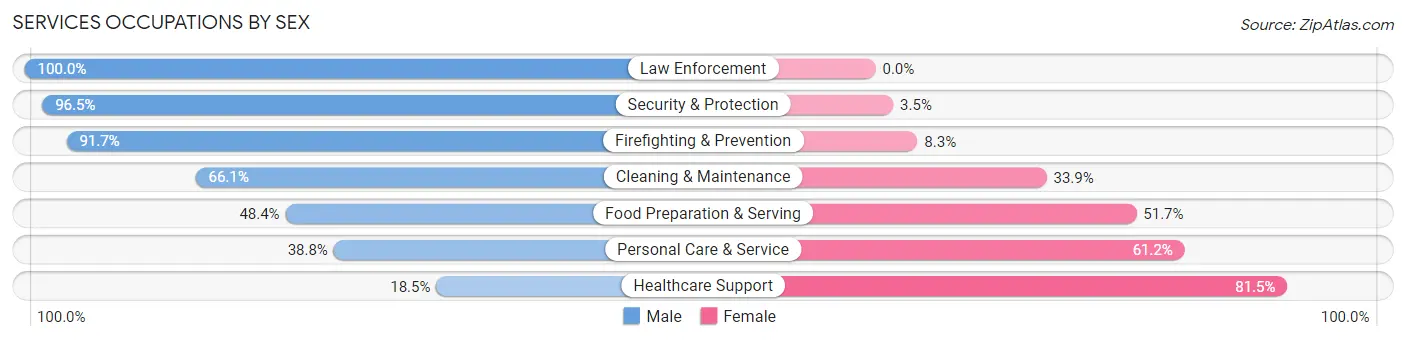
Services Occupations by Sex
Within the Services occupations in Fayette County, the most male-oriented occupations are Law Enforcement (100.0%), Security & Protection (96.5%), and Firefighting & Prevention (91.7%), while the most female-oriented occupations are Healthcare Support (81.5%), Personal Care & Service (61.2%), and Food Preparation & Serving (51.6%).
| Occupation | Male | Female |
| Healthcare Support | 99 (18.5%) | 437 (81.5%) |
| Security & Protection | 470 (96.5%) | 17 (3.5%) |
| Firefighting & Prevention | 188 (91.7%) | 17 (8.3%) |
| Law Enforcement | 282 (100.0%) | 0 (0.0%) |
| Food Preparation & Serving | 485 (48.3%) | 518 (51.6%) |
| Cleaning & Maintenance | 457 (66.1%) | 234 (33.9%) |
| Personal Care & Service | 218 (38.8%) | 344 (61.2%) |
| Total (Category) | 1,729 (52.7%) | 1,550 (47.3%) |
| Total (Overall) | 7,869 (55.5%) | 6,313 (44.5%) |
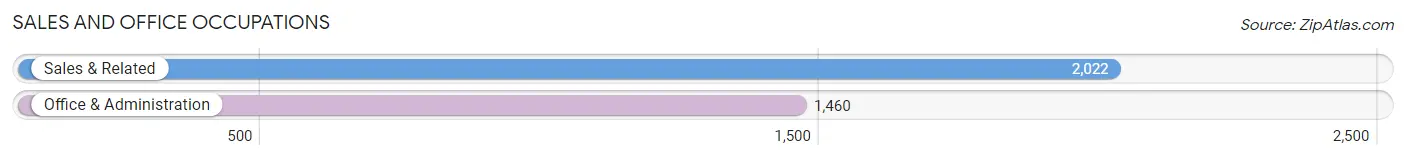
Sales and Office Occupations
The most common Sales and Office occupations in Fayette County are Sales & Related (2,022 | 14.3%), and Office & Administration (1,460 | 10.3%).
Sales and Office Occupations by Sex
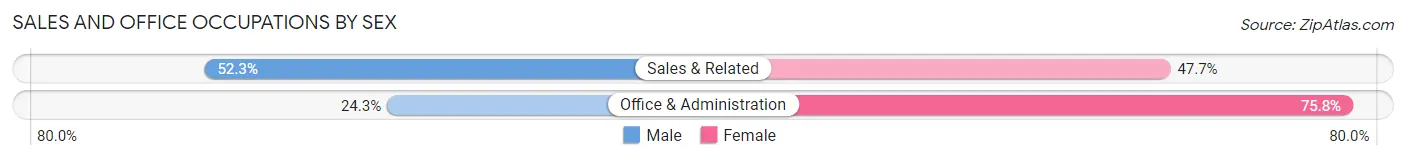
| Occupation | Male | Female |
| Sales & Related | 1,058 (52.3%) | 964 (47.7%) |
| Office & Administration | 354 (24.2%) | 1,106 (75.7%) |
| Total (Category) | 1,412 (40.6%) | 2,070 (59.5%) |
| Total (Overall) | 7,869 (55.5%) | 6,313 (44.5%) |
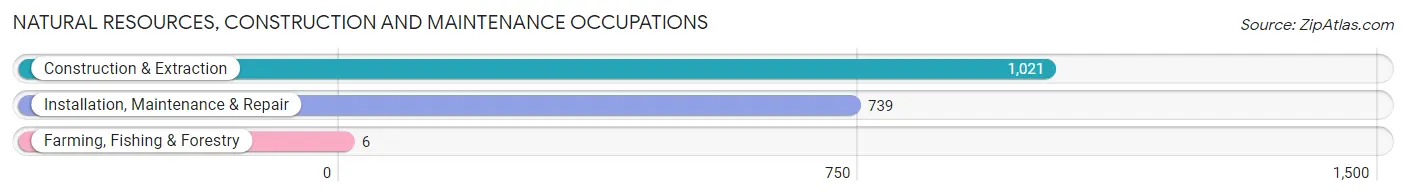
Natural Resources, Construction and Maintenance Occupations
The most common Natural Resources, Construction and Maintenance occupations in Fayette County are Construction & Extraction (1,021 | 7.2%), Installation, Maintenance & Repair (739 | 5.2%), and Farming, Fishing & Forestry (6 | 0.0%).
Natural Resources, Construction and Maintenance Occupations by Sex
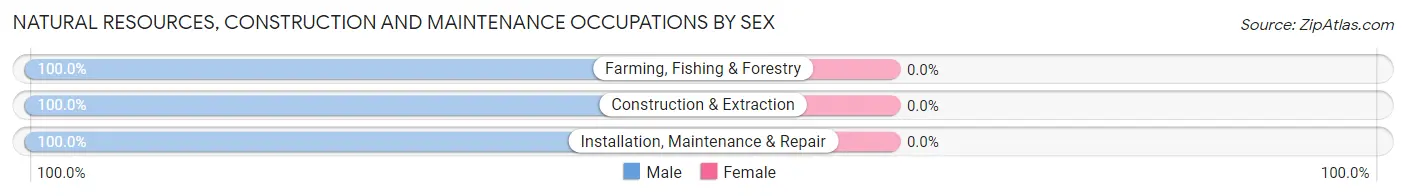
| Occupation | Male | Female |
| Farming, Fishing & Forestry | 6 (100.0%) | 0 (0.0%) |
| Construction & Extraction | 1,021 (100.0%) | 0 (0.0%) |
| Installation, Maintenance & Repair | 739 (100.0%) | 0 (0.0%) |
| Total (Category) | 1,766 (100.0%) | 0 (0.0%) |
| Total (Overall) | 7,869 (55.5%) | 6,313 (44.5%) |
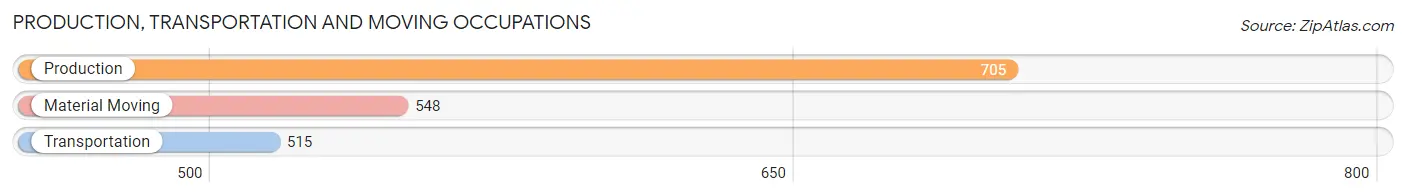
Production, Transportation and Moving Occupations
The most common Production, Transportation and Moving occupations in Fayette County are Production (705 | 5.0%), Material Moving (548 | 3.9%), and Transportation (515 | 3.6%).
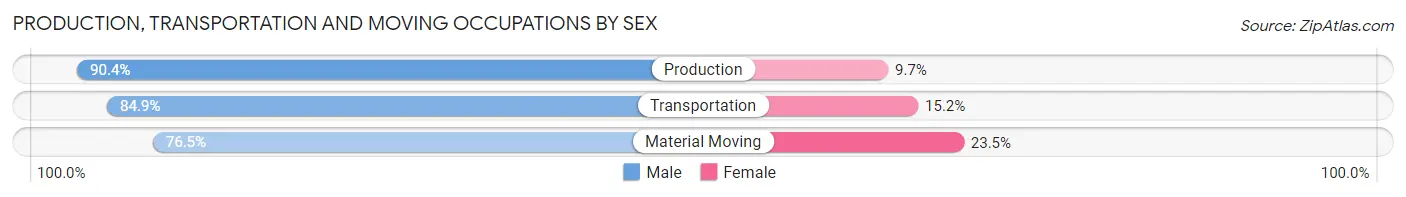
Production, Transportation and Moving Occupations by Sex
| Occupation | Male | Female |
| Production | 637 (90.3%) | 68 (9.7%) |
| Transportation | 437 (84.9%) | 78 (15.1%) |
| Material Moving | 419 (76.5%) | 129 (23.5%) |
| Total (Category) | 1,493 (84.5%) | 275 (15.5%) |
| Total (Overall) | 7,869 (55.5%) | 6,313 (44.5%) |
Employment Industries by Sex in Fayette County
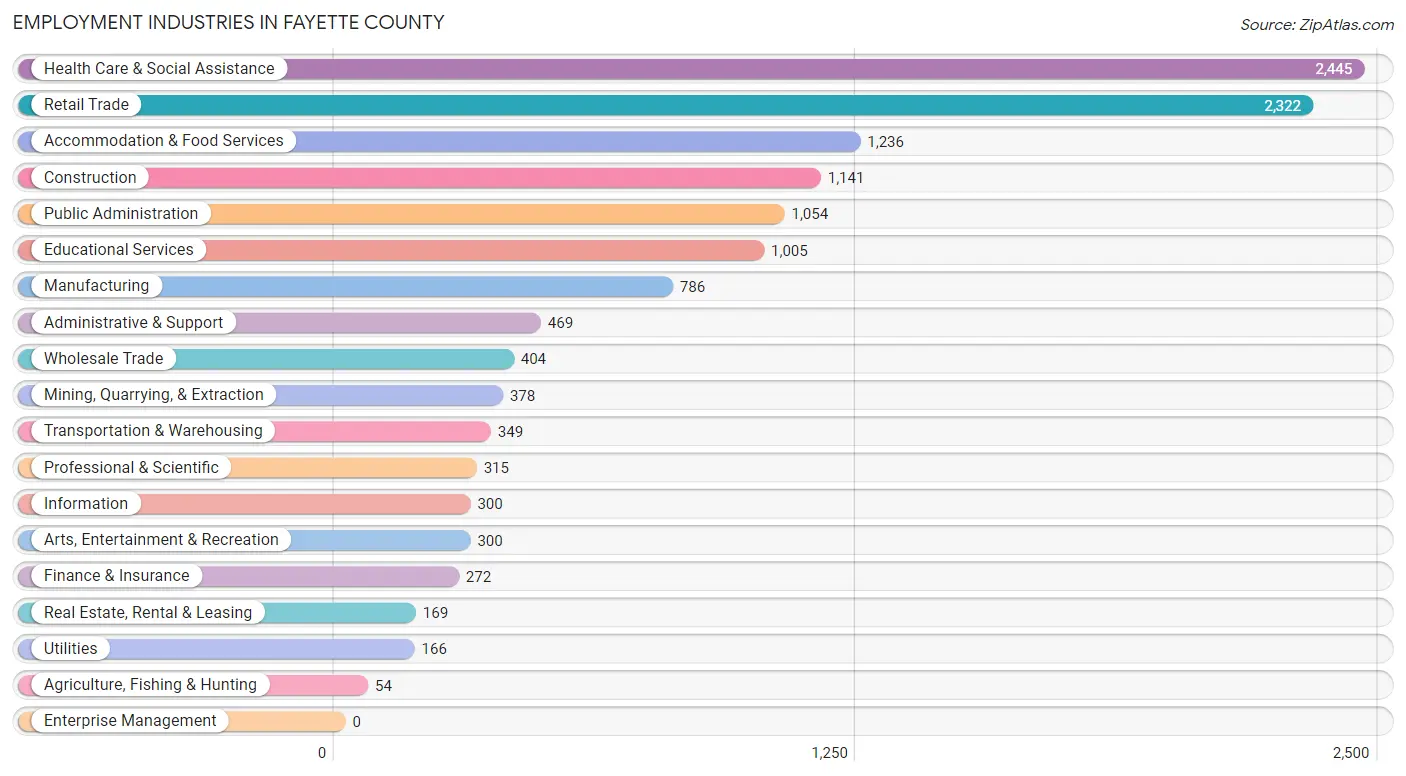
Employment Industries in Fayette County
The major employment industries in Fayette County include Health Care & Social Assistance (2,445 | 17.2%), Retail Trade (2,322 | 16.4%), Accommodation & Food Services (1,236 | 8.7%), Construction (1,141 | 8.1%), and Public Administration (1,054 | 7.4%).
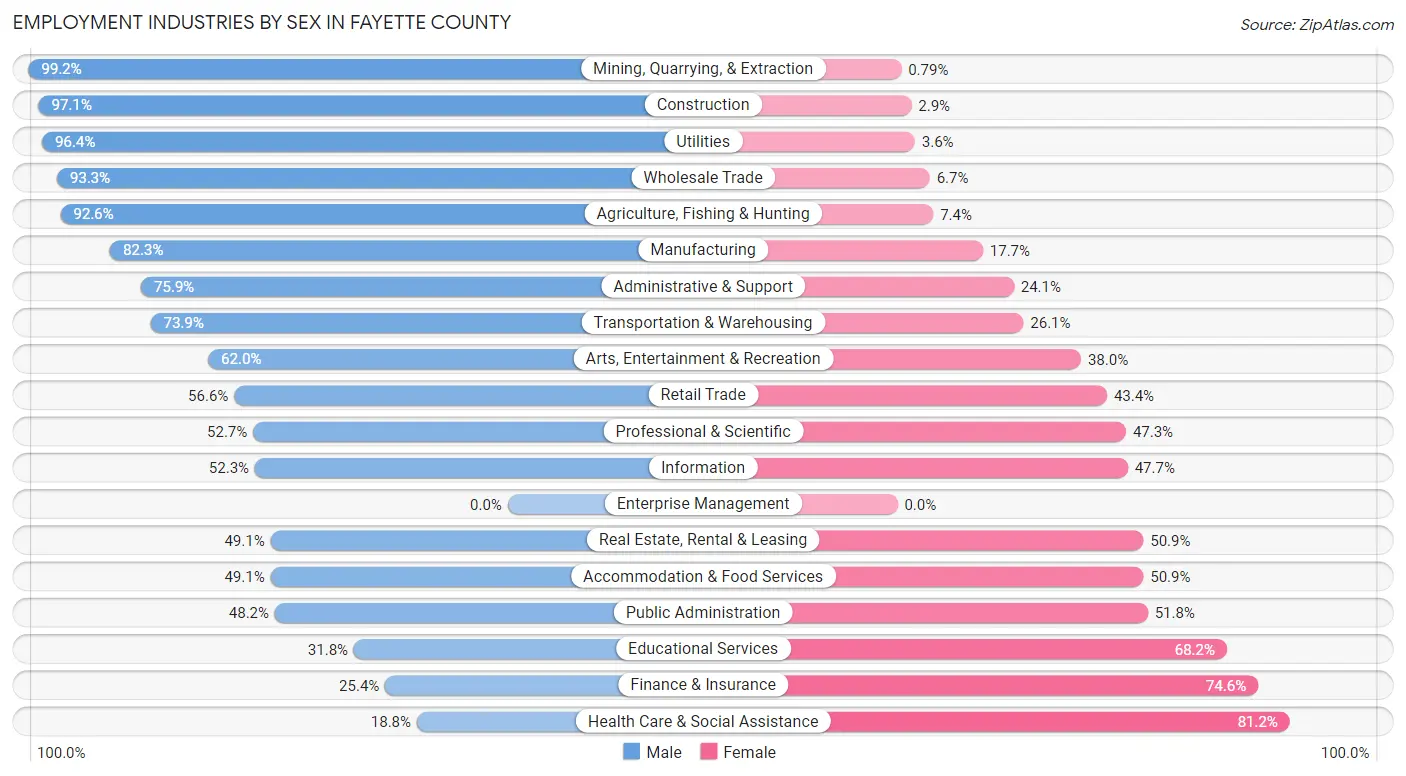
Employment Industries by Sex in Fayette County
The Fayette County industries that see more men than women are Mining, Quarrying, & Extraction (99.2%), Construction (97.1%), and Utilities (96.4%), whereas the industries that tend to have a higher number of women are Health Care & Social Assistance (81.2%), Finance & Insurance (74.6%), and Educational Services (68.2%).
| Industry | Male | Female |
| Agriculture, Fishing & Hunting | 50 (92.6%) | 4 (7.4%) |
| Mining, Quarrying, & Extraction | 375 (99.2%) | 3 (0.8%) |
| Construction | 1,108 (97.1%) | 33 (2.9%) |
| Manufacturing | 647 (82.3%) | 139 (17.7%) |
| Wholesale Trade | 377 (93.3%) | 27 (6.7%) |
| Retail Trade | 1,315 (56.6%) | 1,007 (43.4%) |
| Transportation & Warehousing | 258 (73.9%) | 91 (26.1%) |
| Utilities | 160 (96.4%) | 6 (3.6%) |
| Information | 157 (52.3%) | 143 (47.7%) |
| Finance & Insurance | 69 (25.4%) | 203 (74.6%) |
| Real Estate, Rental & Leasing | 83 (49.1%) | 86 (50.9%) |
| Professional & Scientific | 166 (52.7%) | 149 (47.3%) |
| Enterprise Management | 0 (0.0%) | 0 (0.0%) |
| Administrative & Support | 356 (75.9%) | 113 (24.1%) |
| Educational Services | 320 (31.8%) | 685 (68.2%) |
| Health Care & Social Assistance | 460 (18.8%) | 1,985 (81.2%) |
| Arts, Entertainment & Recreation | 186 (62.0%) | 114 (38.0%) |
| Accommodation & Food Services | 607 (49.1%) | 629 (50.9%) |
| Public Administration | 508 (48.2%) | 546 (51.8%) |
| Total | 7,869 (55.5%) | 6,313 (44.5%) |
Education in Fayette County
School Enrollment in Fayette County
The most common levels of schooling among the 7,568 students in Fayette County are middle school (1,985 | 26.2%), elementary school (1,940 | 25.6%), and high school (1,630 | 21.5%).
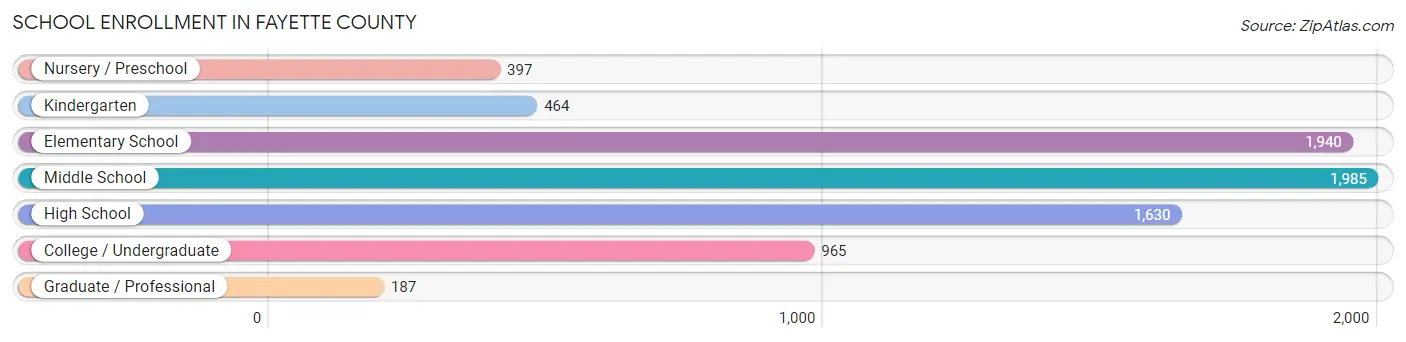
| School Level | # Students | % Students |
| Nursery / Preschool | 397 | 5.2% |
| Kindergarten | 464 | 6.1% |
| Elementary School | 1,940 | 25.6% |
| Middle School | 1,985 | 26.2% |
| High School | 1,630 | 21.5% |
| College / Undergraduate | 965 | 12.8% |
| Graduate / Professional | 187 | 2.5% |
| Total | 7,568 | 100.0% |
School Enrollment by Age by Funding Source in Fayette County
Out of a total of 7,568 students who are enrolled in schools in Fayette County, 810 (10.7%) attend a private institution, while the remaining 6,758 (89.3%) are enrolled in public schools. The age group of 35 years and over has the highest likelihood of being enrolled in private schools, with 109 (35.2% in the age bracket) enrolled. Conversely, the age group of 18 to 19 year olds has the lowest likelihood of being enrolled in a private school, with 338 (100.0% in the age bracket) attending a public institution.
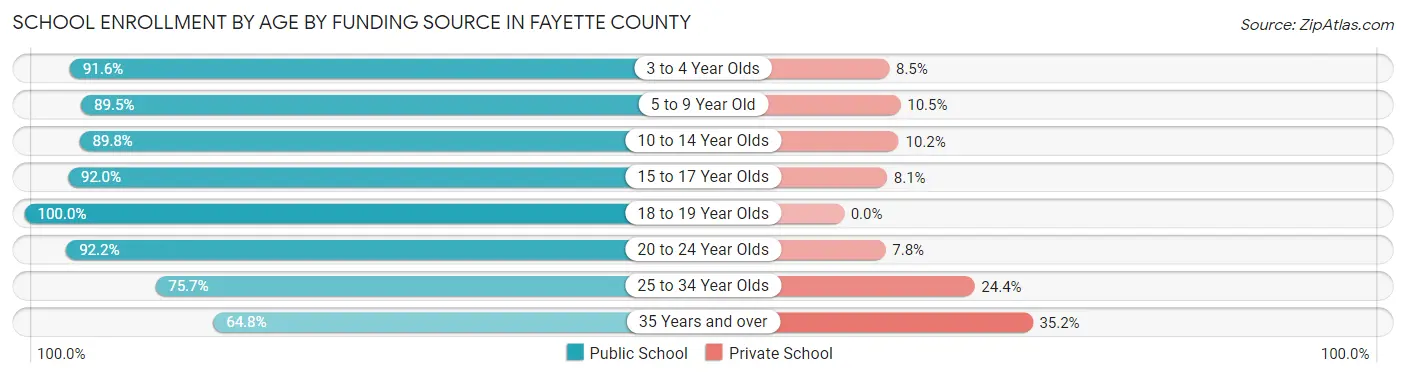
| Age Bracket | Public School | Private School |
| 3 to 4 Year Olds | 260 (91.5%) | 24 (8.5%) |
| 5 to 9 Year Old | 1,952 (89.5%) | 230 (10.5%) |
| 10 to 14 Year Olds | 2,117 (89.8%) | 241 (10.2%) |
| 15 to 17 Year Olds | 1,325 (91.9%) | 116 (8.1%) |
| 18 to 19 Year Olds | 338 (100.0%) | 0 (0.0%) |
| 20 to 24 Year Olds | 392 (92.2%) | 33 (7.8%) |
| 25 to 34 Year Olds | 174 (75.6%) | 56 (24.3%) |
| 35 Years and over | 201 (64.8%) | 109 (35.2%) |
| Total | 6,758 (89.3%) | 810 (10.7%) |
Educational Attainment by Field of Study in Fayette County
Education (986 | 19.5%), science & technology (830 | 16.4%), business (824 | 16.3%), arts & humanities (437 | 8.6%), and psychology (371 | 7.3%) are the most common fields of study among 5,064 individuals in Fayette County who have obtained a bachelor's degree or higher.
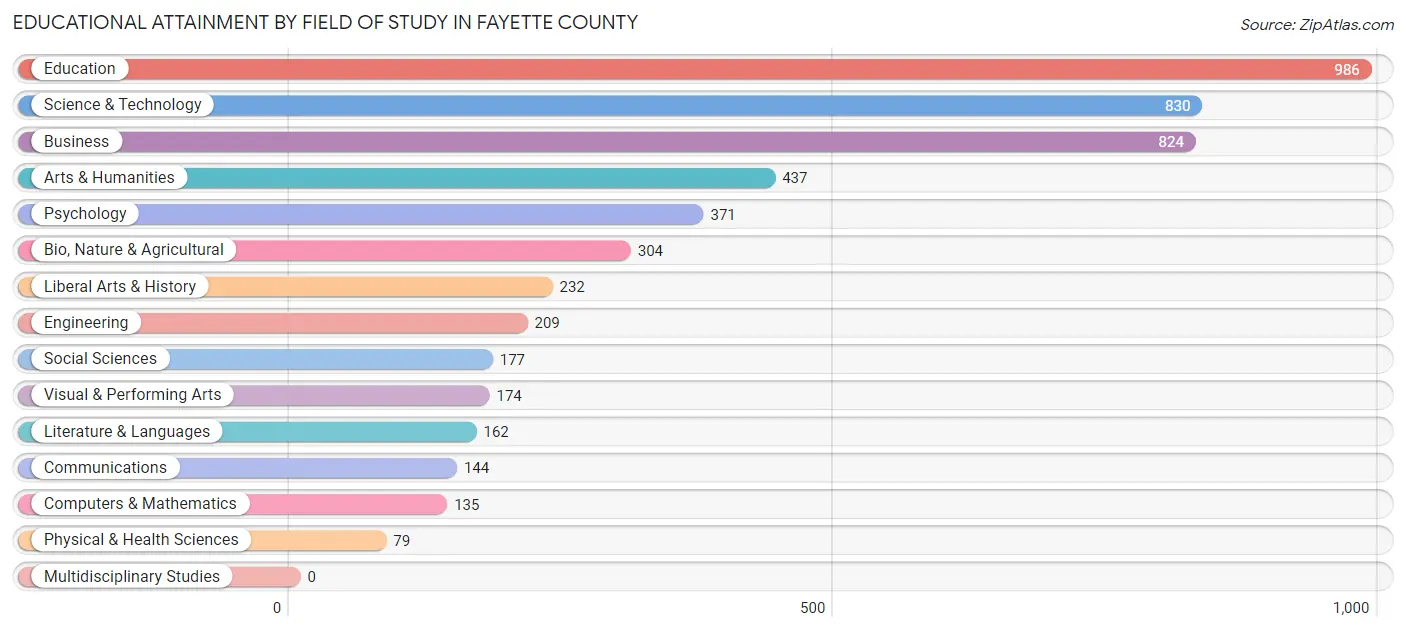
| Field of Study | # Graduates | % Graduates |
| Computers & Mathematics | 135 | 2.7% |
| Bio, Nature & Agricultural | 304 | 6.0% |
| Physical & Health Sciences | 79 | 1.6% |
| Psychology | 371 | 7.3% |
| Social Sciences | 177 | 3.5% |
| Engineering | 209 | 4.1% |
| Multidisciplinary Studies | 0 | 0.0% |
| Science & Technology | 830 | 16.4% |
| Business | 824 | 16.3% |
| Education | 986 | 19.5% |
| Literature & Languages | 162 | 3.2% |
| Liberal Arts & History | 232 | 4.6% |
| Visual & Performing Arts | 174 | 3.4% |
| Communications | 144 | 2.8% |
| Arts & Humanities | 437 | 8.6% |
| Total | 5,064 | 100.0% |
Transportation & Commute in Fayette County
Vehicle Availability by Sex in Fayette County
The most prevalent vehicle ownership categories in Fayette County are males with 2 vehicles (3,230, accounting for 42.6%) and females with 2 vehicles (2,542, making up 52.6%).
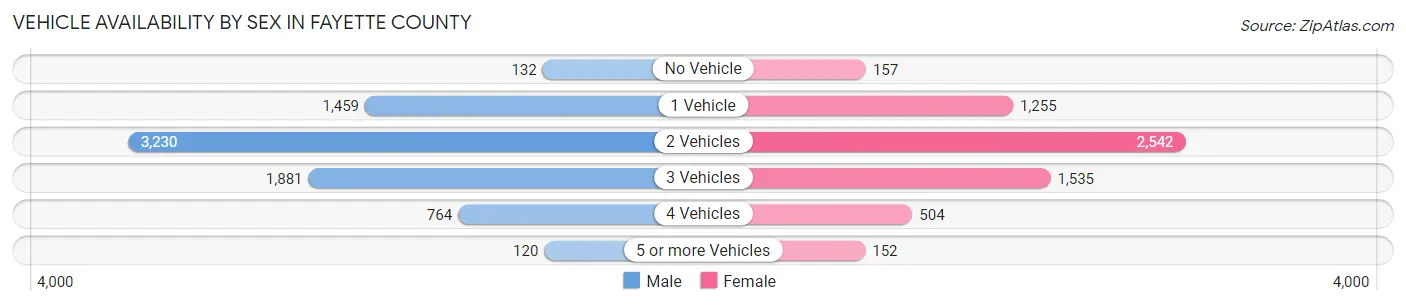
| Vehicles Available | Male | Female |
| No Vehicle | 132 (1.7%) | 157 (2.5%) |
| 1 Vehicle | 1,459 (19.2%) | 1,255 (20.4%) |
| 2 Vehicles | 3,230 (42.6%) | 2,542 (41.4%) |
| 3 Vehicles | 1,881 (24.8%) | 1,535 (25.0%) |
| 4 Vehicles | 764 (10.1%) | 504 (8.2%) |
| 5 or more Vehicles | 120 (1.6%) | 152 (2.5%) |
| Total | 7,586 (100.0%) | 6,145 (100.0%) |
Commute Time in Fayette County
The most frequently occuring commute durations in Fayette County are 30 to 34 minutes (1,626 commuters, 12.4%), 20 to 24 minutes (1,541 commuters, 11.8%), and 10 to 14 minutes (1,518 commuters, 11.6%).
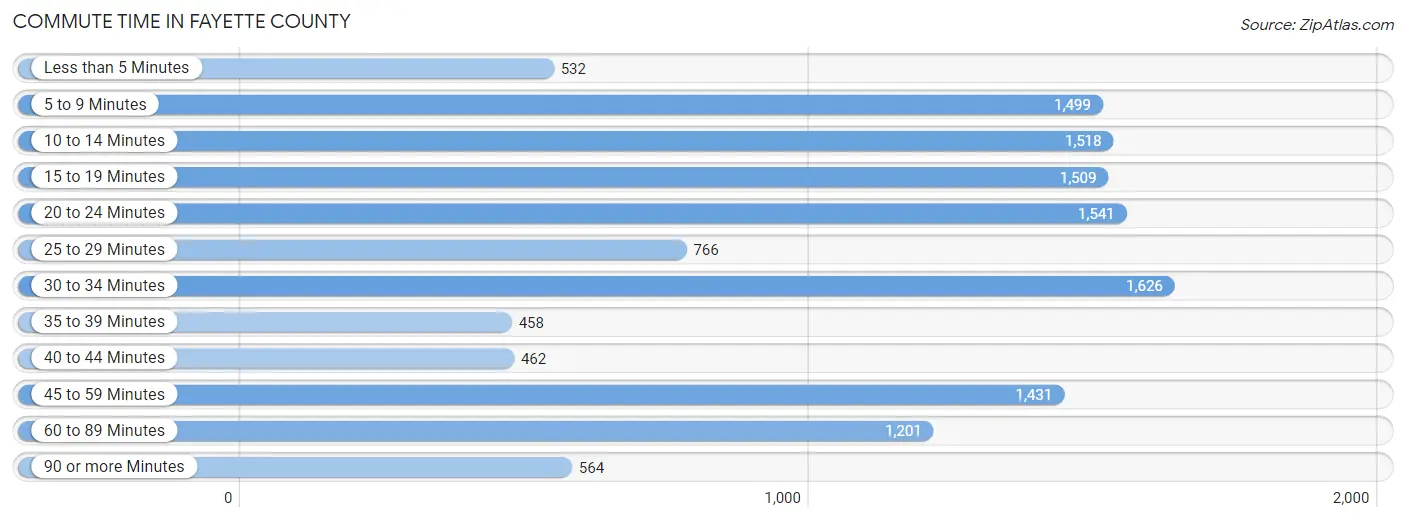
| Commute Time | # Commuters | % Commuters |
| Less than 5 Minutes | 532 | 4.1% |
| 5 to 9 Minutes | 1,499 | 11.4% |
| 10 to 14 Minutes | 1,518 | 11.6% |
| 15 to 19 Minutes | 1,509 | 11.5% |
| 20 to 24 Minutes | 1,541 | 11.8% |
| 25 to 29 Minutes | 766 | 5.8% |
| 30 to 34 Minutes | 1,626 | 12.4% |
| 35 to 39 Minutes | 458 | 3.5% |
| 40 to 44 Minutes | 462 | 3.5% |
| 45 to 59 Minutes | 1,431 | 10.9% |
| 60 to 89 Minutes | 1,201 | 9.2% |
| 90 or more Minutes | 564 | 4.3% |
Commute Time by Sex in Fayette County
The most common commute times in Fayette County are 30 to 34 minutes (978 commuters, 13.4%) for males and 5 to 9 minutes (851 commuters, 14.6%) for females.
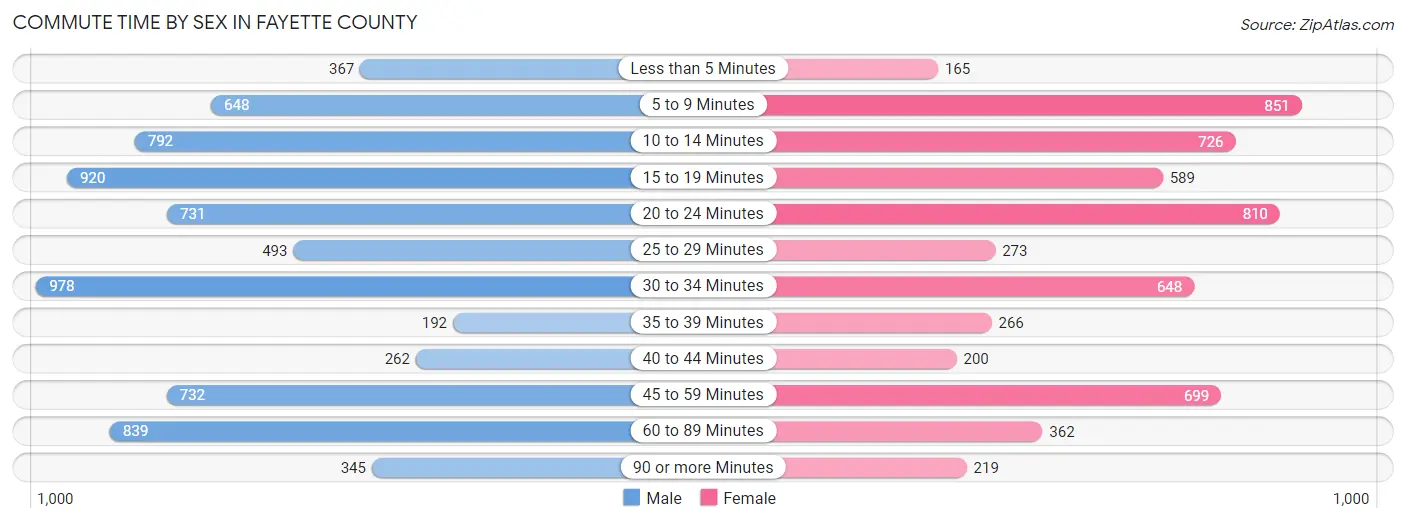
| Commute Time | Male | Female |
| Less than 5 Minutes | 367 (5.0%) | 165 (2.8%) |
| 5 to 9 Minutes | 648 (8.9%) | 851 (14.6%) |
| 10 to 14 Minutes | 792 (10.8%) | 726 (12.5%) |
| 15 to 19 Minutes | 920 (12.6%) | 589 (10.1%) |
| 20 to 24 Minutes | 731 (10.0%) | 810 (14.0%) |
| 25 to 29 Minutes | 493 (6.8%) | 273 (4.7%) |
| 30 to 34 Minutes | 978 (13.4%) | 648 (11.2%) |
| 35 to 39 Minutes | 192 (2.6%) | 266 (4.6%) |
| 40 to 44 Minutes | 262 (3.6%) | 200 (3.4%) |
| 45 to 59 Minutes | 732 (10.0%) | 699 (12.0%) |
| 60 to 89 Minutes | 839 (11.5%) | 362 (6.2%) |
| 90 or more Minutes | 345 (4.7%) | 219 (3.8%) |
Time of Departure to Work by Sex in Fayette County
The most frequent times of departure to work in Fayette County are 7:00 AM to 7:29 AM (1,130, 15.5%) for males and 7:00 AM to 7:29 AM (1,066, 18.3%) for females.
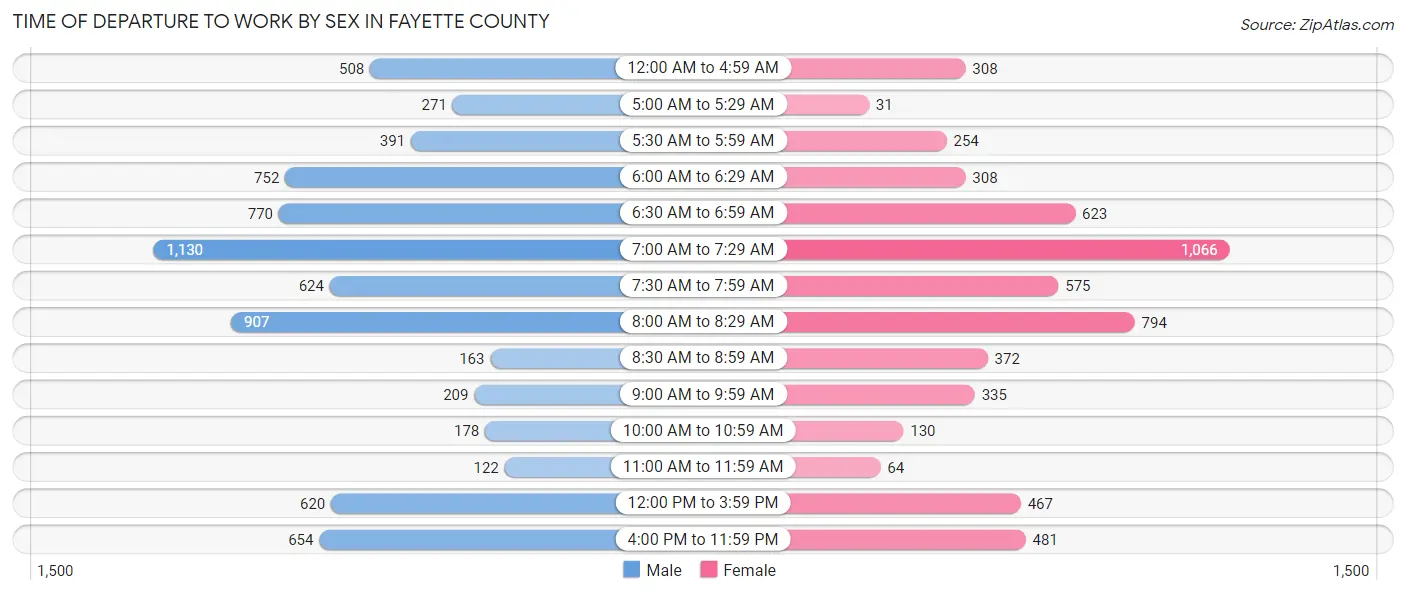
| Time of Departure | Male | Female |
| 12:00 AM to 4:59 AM | 508 (7.0%) | 308 (5.3%) |
| 5:00 AM to 5:29 AM | 271 (3.7%) | 31 (0.5%) |
| 5:30 AM to 5:59 AM | 391 (5.4%) | 254 (4.4%) |
| 6:00 AM to 6:29 AM | 752 (10.3%) | 308 (5.3%) |
| 6:30 AM to 6:59 AM | 770 (10.5%) | 623 (10.7%) |
| 7:00 AM to 7:29 AM | 1,130 (15.5%) | 1,066 (18.3%) |
| 7:30 AM to 7:59 AM | 624 (8.6%) | 575 (9.9%) |
| 8:00 AM to 8:29 AM | 907 (12.4%) | 794 (13.7%) |
| 8:30 AM to 8:59 AM | 163 (2.2%) | 372 (6.4%) |
| 9:00 AM to 9:59 AM | 209 (2.9%) | 335 (5.8%) |
| 10:00 AM to 10:59 AM | 178 (2.4%) | 130 (2.2%) |
| 11:00 AM to 11:59 AM | 122 (1.7%) | 64 (1.1%) |
| 12:00 PM to 3:59 PM | 620 (8.5%) | 467 (8.0%) |
| 4:00 PM to 11:59 PM | 654 (9.0%) | 481 (8.3%) |
| Total | 7,299 (100.0%) | 5,808 (100.0%) |
Housing Occupancy in Fayette County
Occupancy by Ownership in Fayette County
Of the total 15,938 dwellings in Fayette County, owner-occupied units account for 12,063 (75.7%), while renter-occupied units make up 3,875 (24.3%).
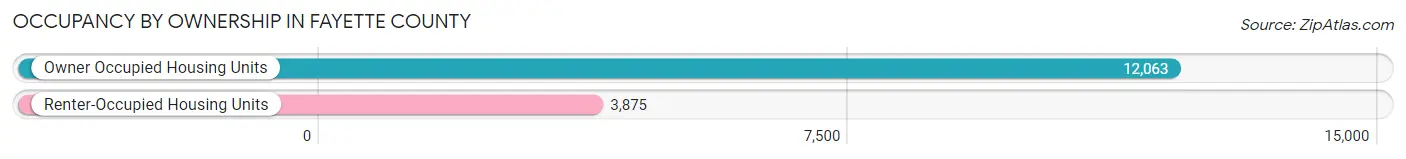
| Occupancy | # Housing Units | % Housing Units |
| Owner Occupied Housing Units | 12,063 | 75.7% |
| Renter-Occupied Housing Units | 3,875 | 24.3% |
| Total Occupied Housing Units | 15,938 | 100.0% |
Occupancy by Household Size in Fayette County
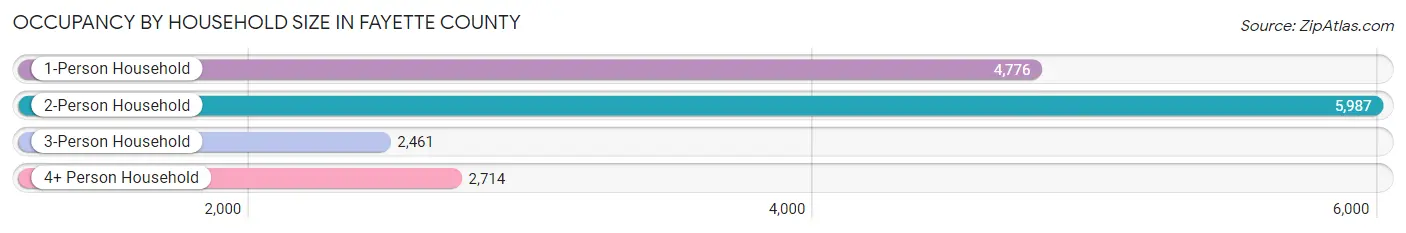
| Household Size | # Housing Units | % Housing Units |
| 1-Person Household | 4,776 | 30.0% |
| 2-Person Household | 5,987 | 37.6% |
| 3-Person Household | 2,461 | 15.4% |
| 4+ Person Household | 2,714 | 17.0% |
| Total Housing Units | 15,938 | 100.0% |
Occupancy by Ownership by Household Size in Fayette County
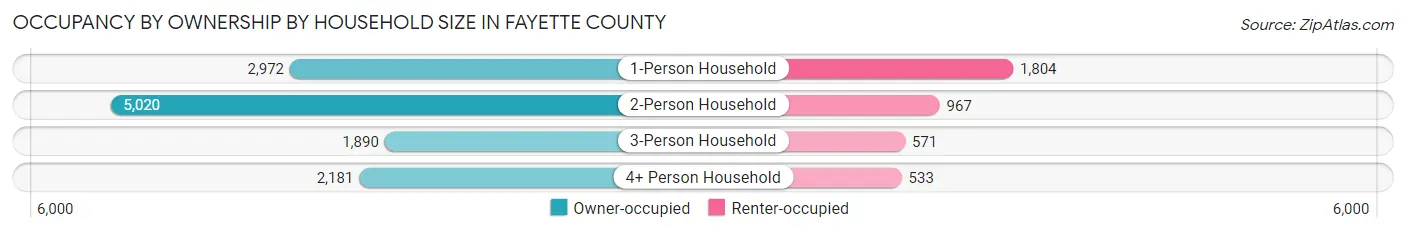
| Household Size | Owner-occupied | Renter-occupied |
| 1-Person Household | 2,972 (62.2%) | 1,804 (37.8%) |
| 2-Person Household | 5,020 (83.9%) | 967 (16.2%) |
| 3-Person Household | 1,890 (76.8%) | 571 (23.2%) |
| 4+ Person Household | 2,181 (80.4%) | 533 (19.6%) |
| Total Housing Units | 12,063 (75.7%) | 3,875 (24.3%) |
Occupancy by Educational Attainment in Fayette County
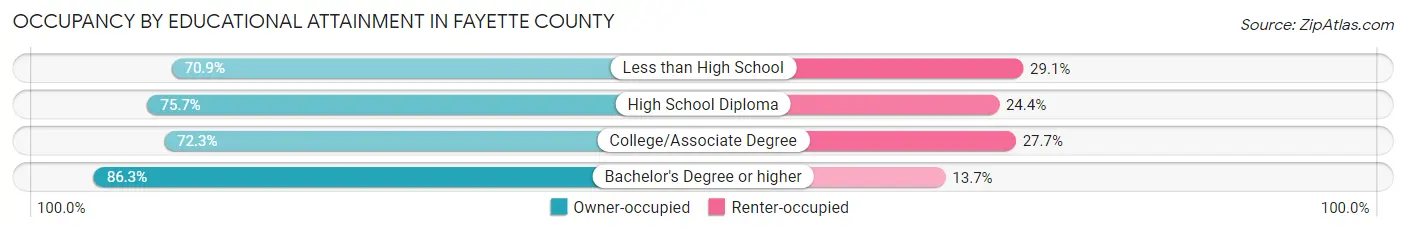
| Household Size | Owner-occupied | Renter-occupied |
| Less than High School | 1,651 (70.9%) | 679 (29.1%) |
| High School Diploma | 4,830 (75.6%) | 1,555 (24.3%) |
| College/Associate Degree | 3,370 (72.3%) | 1,289 (27.7%) |
| Bachelor's Degree or higher | 2,212 (86.3%) | 352 (13.7%) |
Occupancy by Age of Householder in Fayette County
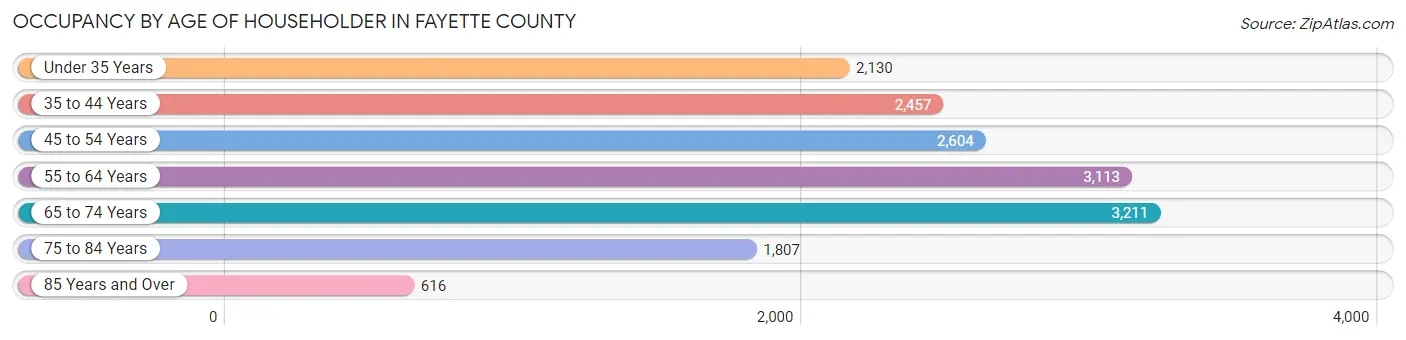
| Age Bracket | # Households | % Households |
| Under 35 Years | 2,130 | 13.4% |
| 35 to 44 Years | 2,457 | 15.4% |
| 45 to 54 Years | 2,604 | 16.3% |
| 55 to 64 Years | 3,113 | 19.5% |
| 65 to 74 Years | 3,211 | 20.2% |
| 75 to 84 Years | 1,807 | 11.3% |
| 85 Years and Over | 616 | 3.9% |
| Total | 15,938 | 100.0% |
Housing Finances in Fayette County
Median Income by Occupancy in Fayette County
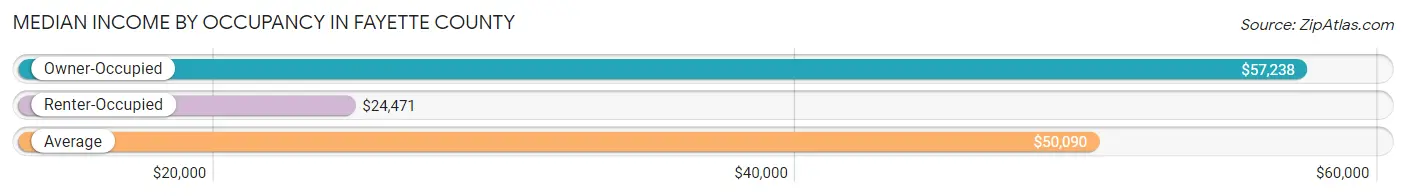
| Occupancy Type | # Households | Median Income |
| Owner-Occupied | 12,063 (75.7%) | $57,238 |
| Renter-Occupied | 3,875 (24.3%) | $24,471 |
| Average | 15,938 (100.0%) | $50,090 |
Occupancy by Householder Income Bracket in Fayette County
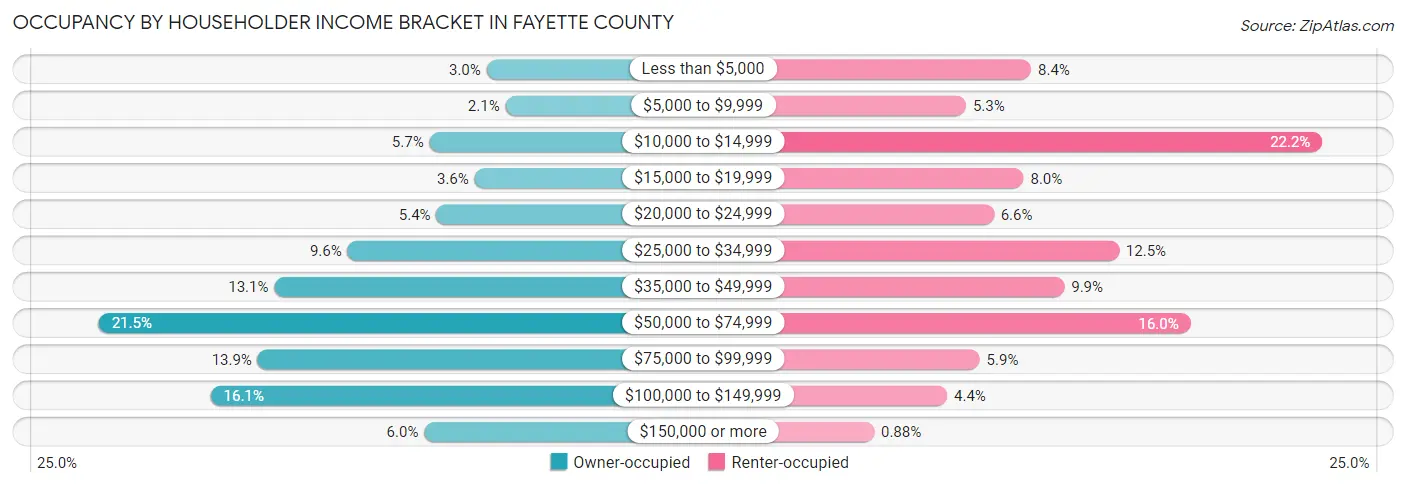
| Income Bracket | Owner-occupied | Renter-occupied |
| Less than $5,000 | 362 (3.0%) | 324 (8.4%) |
| $5,000 to $9,999 | 253 (2.1%) | 204 (5.3%) |
| $10,000 to $14,999 | 690 (5.7%) | 861 (22.2%) |
| $15,000 to $19,999 | 431 (3.6%) | 310 (8.0%) |
| $20,000 to $24,999 | 650 (5.4%) | 255 (6.6%) |
| $25,000 to $34,999 | 1,161 (9.6%) | 486 (12.5%) |
| $35,000 to $49,999 | 1,582 (13.1%) | 385 (9.9%) |
| $50,000 to $74,999 | 2,590 (21.5%) | 618 (16.0%) |
| $75,000 to $99,999 | 1,677 (13.9%) | 229 (5.9%) |
| $100,000 to $149,999 | 1,947 (16.1%) | 169 (4.4%) |
| $150,000 or more | 720 (6.0%) | 34 (0.9%) |
| Total | 12,063 (100.0%) | 3,875 (100.0%) |
Monthly Housing Cost Tiers in Fayette County
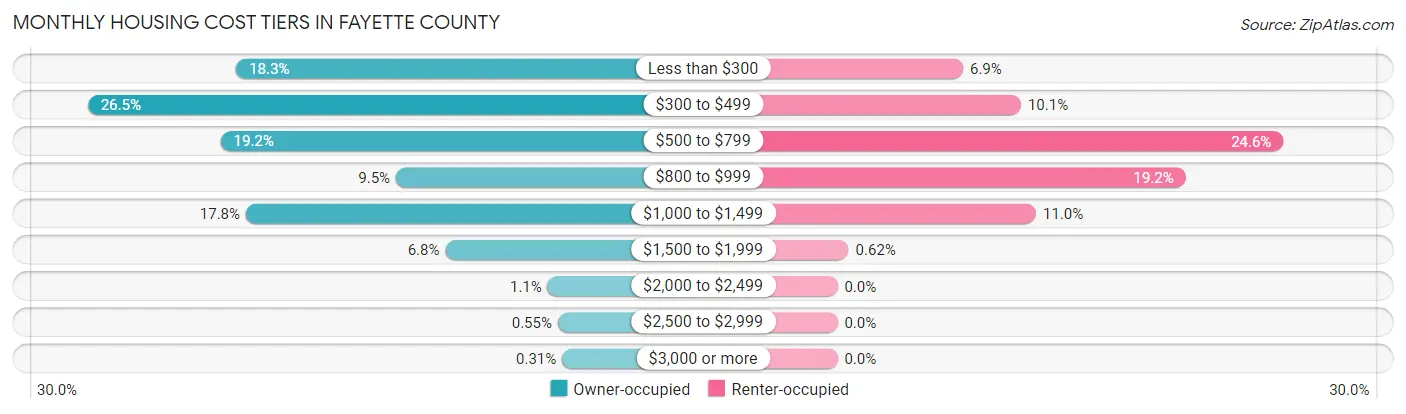
| Monthly Cost | Owner-occupied | Renter-occupied |
| Less than $300 | 2,209 (18.3%) | 269 (6.9%) |
| $300 to $499 | 3,198 (26.5%) | 393 (10.1%) |
| $500 to $799 | 2,313 (19.2%) | 954 (24.6%) |
| $800 to $999 | 1,145 (9.5%) | 745 (19.2%) |
| $1,000 to $1,499 | 2,145 (17.8%) | 425 (11.0%) |
| $1,500 to $1,999 | 816 (6.8%) | 24 (0.6%) |
| $2,000 to $2,499 | 134 (1.1%) | 0 (0.0%) |
| $2,500 to $2,999 | 66 (0.5%) | 0 (0.0%) |
| $3,000 or more | 37 (0.3%) | 0 (0.0%) |
| Total | 12,063 (100.0%) | 3,875 (100.0%) |
Physical Housing Characteristics in Fayette County
Housing Structures in Fayette County
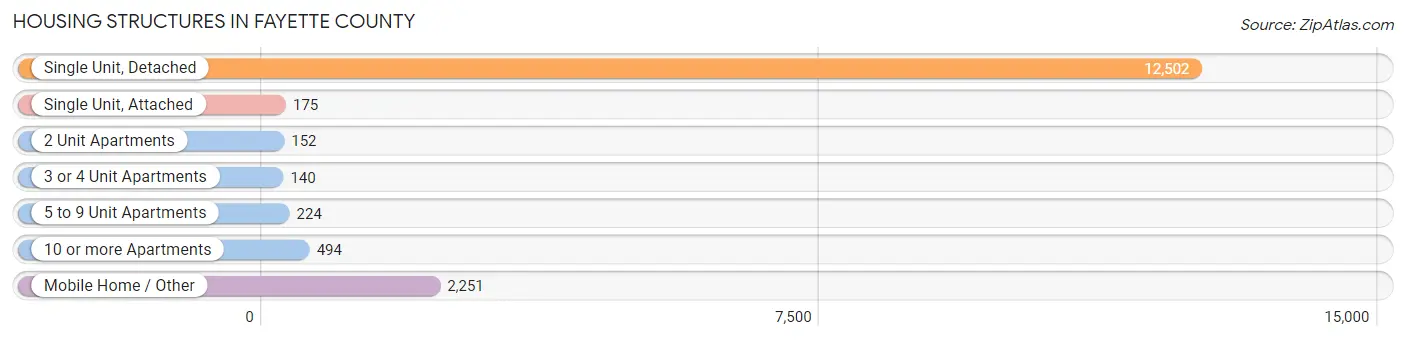
| Structure Type | # Housing Units | % Housing Units |
| Single Unit, Detached | 12,502 | 78.4% |
| Single Unit, Attached | 175 | 1.1% |
| 2 Unit Apartments | 152 | 0.9% |
| 3 or 4 Unit Apartments | 140 | 0.9% |
| 5 to 9 Unit Apartments | 224 | 1.4% |
| 10 or more Apartments | 494 | 3.1% |
| Mobile Home / Other | 2,251 | 14.1% |
| Total | 15,938 | 100.0% |
Housing Structures by Occupancy in Fayette County
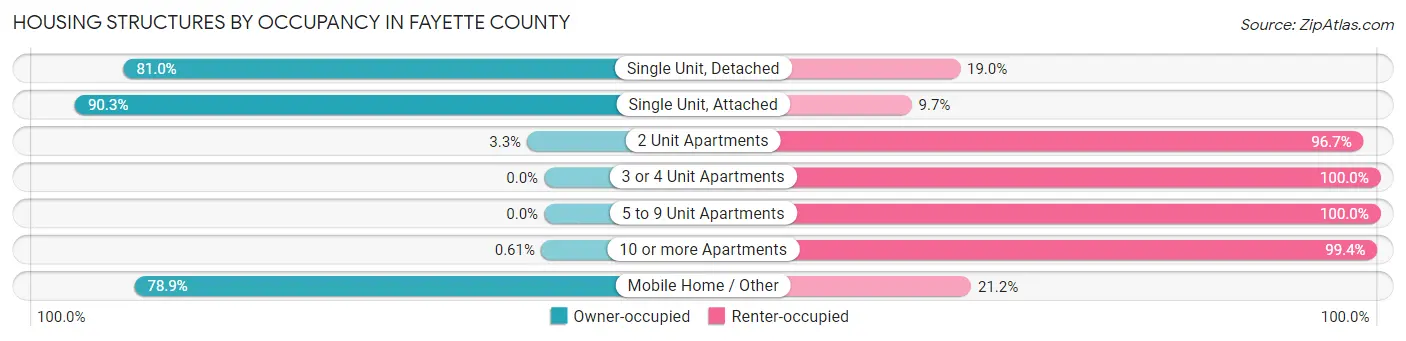
| Structure Type | Owner-occupied | Renter-occupied |
| Single Unit, Detached | 10,122 (81.0%) | 2,380 (19.0%) |
| Single Unit, Attached | 158 (90.3%) | 17 (9.7%) |
| 2 Unit Apartments | 5 (3.3%) | 147 (96.7%) |
| 3 or 4 Unit Apartments | 0 (0.0%) | 140 (100.0%) |
| 5 to 9 Unit Apartments | 0 (0.0%) | 224 (100.0%) |
| 10 or more Apartments | 3 (0.6%) | 491 (99.4%) |
| Mobile Home / Other | 1,775 (78.8%) | 476 (21.1%) |
| Total | 12,063 (75.7%) | 3,875 (24.3%) |
Housing Structures by Number of Rooms in Fayette County
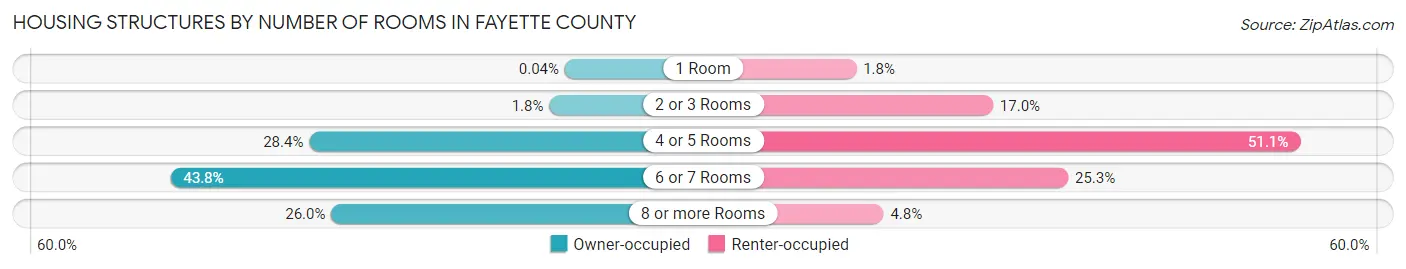
| Number of Rooms | Owner-occupied | Renter-occupied |
| 1 Room | 5 (0.0%) | 70 (1.8%) |
| 2 or 3 Rooms | 213 (1.8%) | 658 (17.0%) |
| 4 or 5 Rooms | 3,427 (28.4%) | 1,979 (51.1%) |
| 6 or 7 Rooms | 5,286 (43.8%) | 981 (25.3%) |
| 8 or more Rooms | 3,132 (26.0%) | 187 (4.8%) |
| Total | 12,063 (100.0%) | 3,875 (100.0%) |
Housing Structure by Heating Type in Fayette County
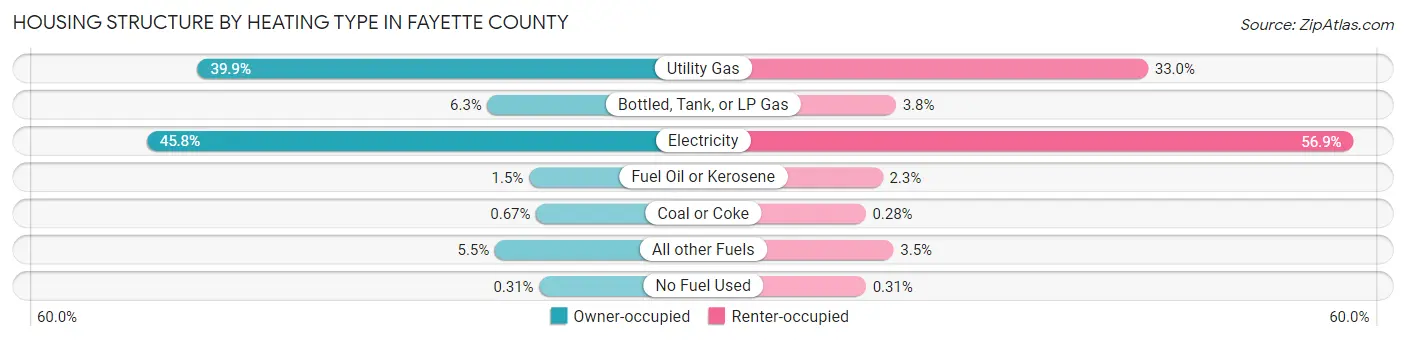
| Heating Type | Owner-occupied | Renter-occupied |
| Utility Gas | 4,818 (39.9%) | 1,279 (33.0%) |
| Bottled, Tank, or LP Gas | 761 (6.3%) | 147 (3.8%) |
| Electricity | 5,528 (45.8%) | 2,203 (56.9%) |
| Fuel Oil or Kerosene | 181 (1.5%) | 87 (2.2%) |
| Coal or Coke | 81 (0.7%) | 11 (0.3%) |
| All other Fuels | 657 (5.4%) | 136 (3.5%) |
| No Fuel Used | 37 (0.3%) | 12 (0.3%) |
| Total | 12,063 (100.0%) | 3,875 (100.0%) |
Household Vehicle Usage in Fayette County
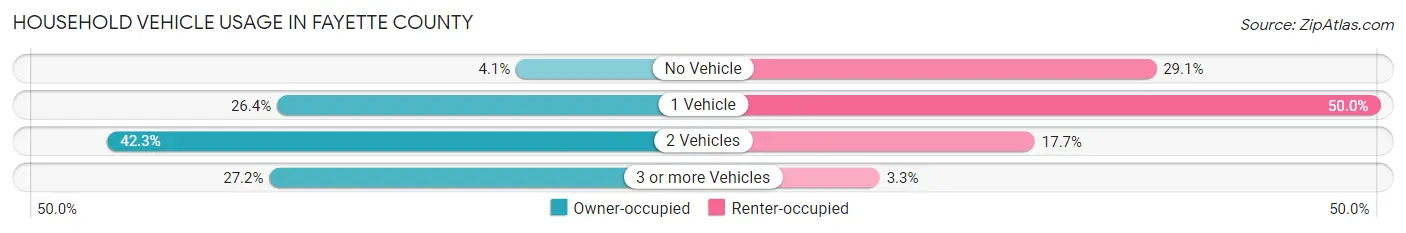
| Vehicles per Household | Owner-occupied | Renter-occupied |
| No Vehicle | 497 (4.1%) | 1,126 (29.1%) |
| 1 Vehicle | 3,190 (26.4%) | 1,936 (50.0%) |
| 2 Vehicles | 5,100 (42.3%) | 687 (17.7%) |
| 3 or more Vehicles | 3,276 (27.2%) | 126 (3.3%) |
| Total | 12,063 (100.0%) | 3,875 (100.0%) |
Real Estate & Mortgages in Fayette County
Real Estate and Mortgage Overview in Fayette County
| Characteristic | Without Mortgage | With Mortgage |
| Housing Units | 6,873 | 5,190 |
| Median Property Value | $89,100 | $118,900 |
| Median Household Income | $45,561 | $453 |
| Monthly Housing Costs | $377 | $37 |
| Real Estate Taxes | $538 | $149 |
Property Value by Mortgage Status in Fayette County
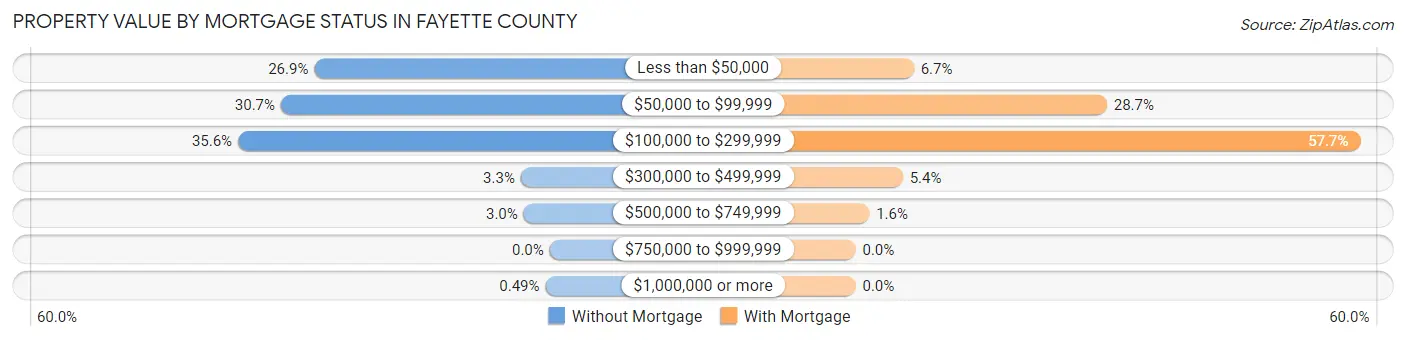
| Property Value | Without Mortgage | With Mortgage |
| Less than $50,000 | 1,849 (26.9%) | 345 (6.7%) |
| $50,000 to $99,999 | 2,111 (30.7%) | 1,490 (28.7%) |
| $100,000 to $299,999 | 2,448 (35.6%) | 2,994 (57.7%) |
| $300,000 to $499,999 | 227 (3.3%) | 280 (5.4%) |
| $500,000 to $749,999 | 204 (3.0%) | 81 (1.6%) |
| $750,000 to $999,999 | 0 (0.0%) | 0 (0.0%) |
| $1,000,000 or more | 34 (0.5%) | 0 (0.0%) |
| Total | 6,873 (100.0%) | 5,190 (100.0%) |
Household Income by Mortgage Status in Fayette County
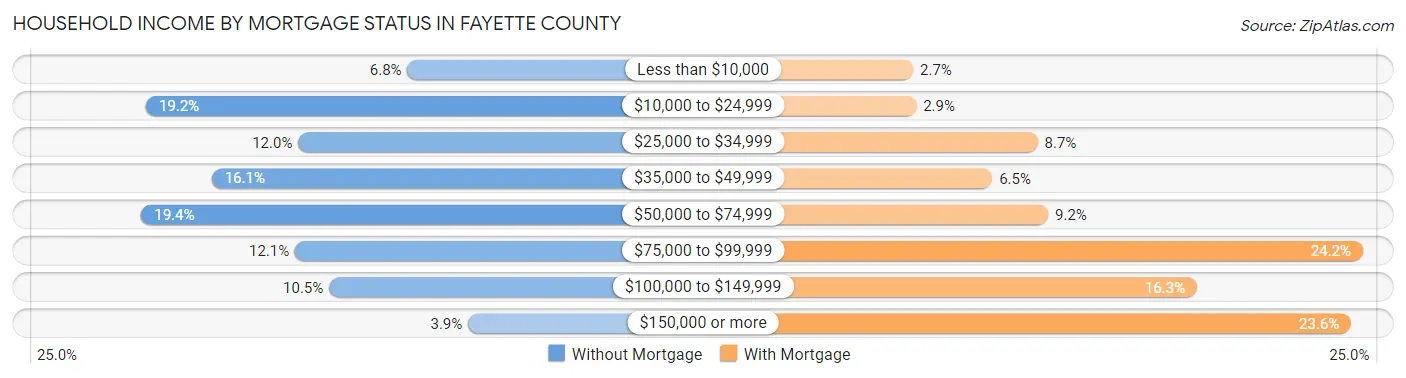
| Household Income | Without Mortgage | With Mortgage |
| Less than $10,000 | 465 (6.8%) | 142 (2.7%) |
| $10,000 to $24,999 | 1,321 (19.2%) | 150 (2.9%) |
| $25,000 to $34,999 | 823 (12.0%) | 450 (8.7%) |
| $35,000 to $49,999 | 1,106 (16.1%) | 338 (6.5%) |
| $50,000 to $74,999 | 1,336 (19.4%) | 476 (9.2%) |
| $75,000 to $99,999 | 833 (12.1%) | 1,254 (24.2%) |
| $100,000 to $149,999 | 722 (10.5%) | 844 (16.3%) |
| $150,000 or more | 267 (3.9%) | 1,225 (23.6%) |
| Total | 6,873 (100.0%) | 5,190 (100.0%) |
Property Value to Household Income Ratio in Fayette County
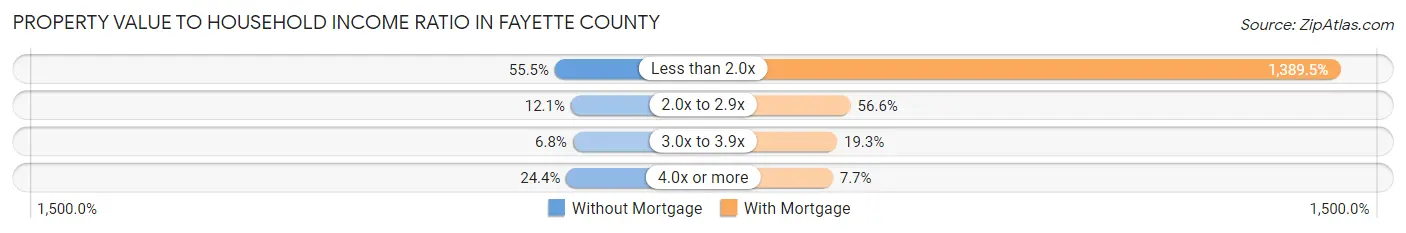
| Value-to-Income Ratio | Without Mortgage | With Mortgage |
| Less than 2.0x | 3,816 (55.5%) | 72,114 (1,389.5%) |
| 2.0x to 2.9x | 830 (12.1%) | 2,935 (56.6%) |
| 3.0x to 3.9x | 470 (6.8%) | 1,003 (19.3%) |
| 4.0x or more | 1,677 (24.4%) | 401 (7.7%) |
| Total | 6,873 (100.0%) | 5,190 (100.0%) |
Real Estate Taxes by Mortgage Status in Fayette County
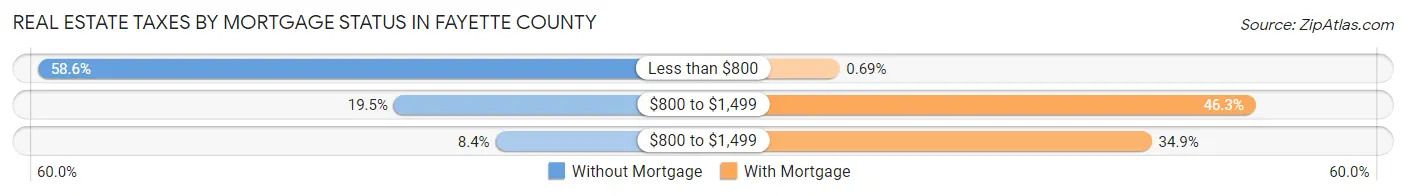
| Property Taxes | Without Mortgage | With Mortgage |
| Less than $800 | 4,025 (58.6%) | 36 (0.7%) |
| $800 to $1,499 | 1,343 (19.5%) | 2,404 (46.3%) |
| $800 to $1,499 | 577 (8.4%) | 1,812 (34.9%) |
| Total | 6,873 (100.0%) | 5,190 (100.0%) |
Health & Disability in Fayette County
Health Insurance Coverage by Age in Fayette County
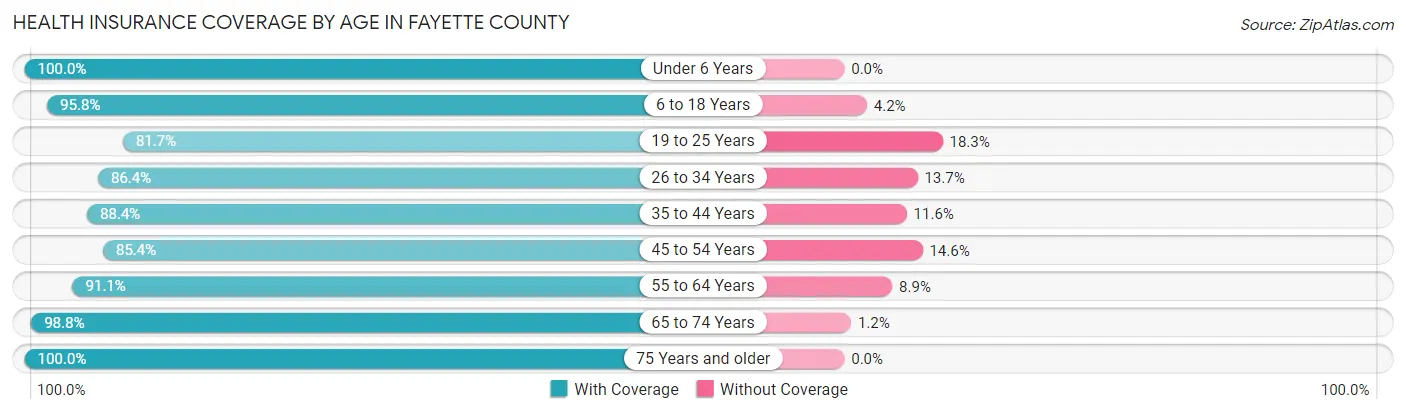
| Age Bracket | With Coverage | Without Coverage |
| Under 6 Years | 2,355 (100.0%) | 0 (0.0%) |
| 6 to 18 Years | 6,066 (95.8%) | 266 (4.2%) |
| 19 to 25 Years | 2,296 (81.7%) | 515 (18.3%) |
| 26 to 34 Years | 3,214 (86.4%) | 508 (13.7%) |
| 35 to 44 Years | 4,186 (88.4%) | 551 (11.6%) |
| 45 to 54 Years | 4,322 (85.4%) | 738 (14.6%) |
| 55 to 64 Years | 5,220 (91.1%) | 512 (8.9%) |
| 65 to 74 Years | 5,171 (98.8%) | 65 (1.2%) |
| 75 Years and older | 3,349 (100.0%) | 0 (0.0%) |
| Total | 36,179 (92.0%) | 3,155 (8.0%) |
Health Insurance Coverage by Citizenship Status in Fayette County
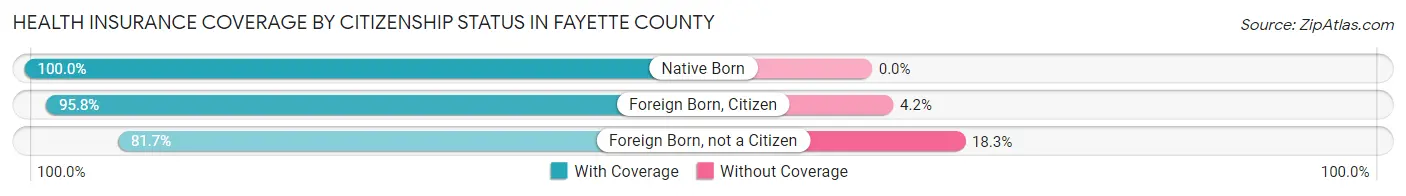
| Citizenship Status | With Coverage | Without Coverage |
| Native Born | 2,355 (100.0%) | 0 (0.0%) |
| Foreign Born, Citizen | 6,066 (95.8%) | 266 (4.2%) |
| Foreign Born, not a Citizen | 2,296 (81.7%) | 515 (18.3%) |
Health Insurance Coverage by Household Income in Fayette County
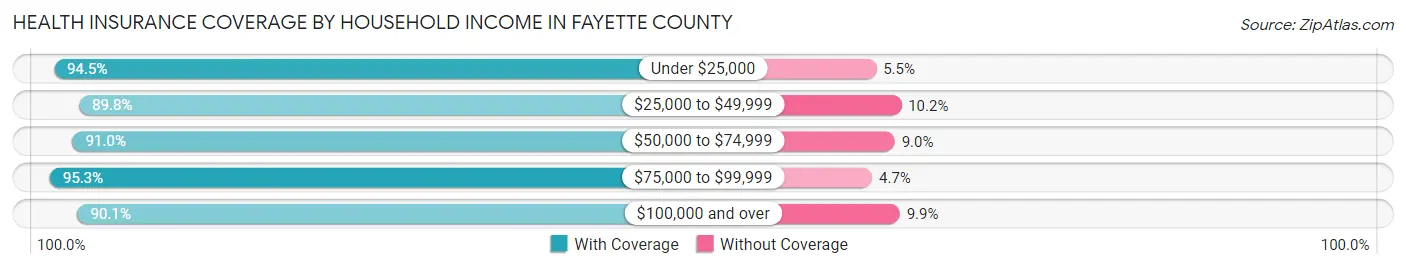
| Household Income | With Coverage | Without Coverage |
| Under $25,000 | 7,404 (94.5%) | 432 (5.5%) |
| $25,000 to $49,999 | 7,160 (89.8%) | 813 (10.2%) |
| $50,000 to $74,999 | 7,482 (91.0%) | 738 (9.0%) |
| $75,000 to $99,999 | 5,789 (95.3%) | 288 (4.7%) |
| $100,000 and over | 8,007 (90.1%) | 882 (9.9%) |
Public vs Private Health Insurance Coverage by Age in Fayette County
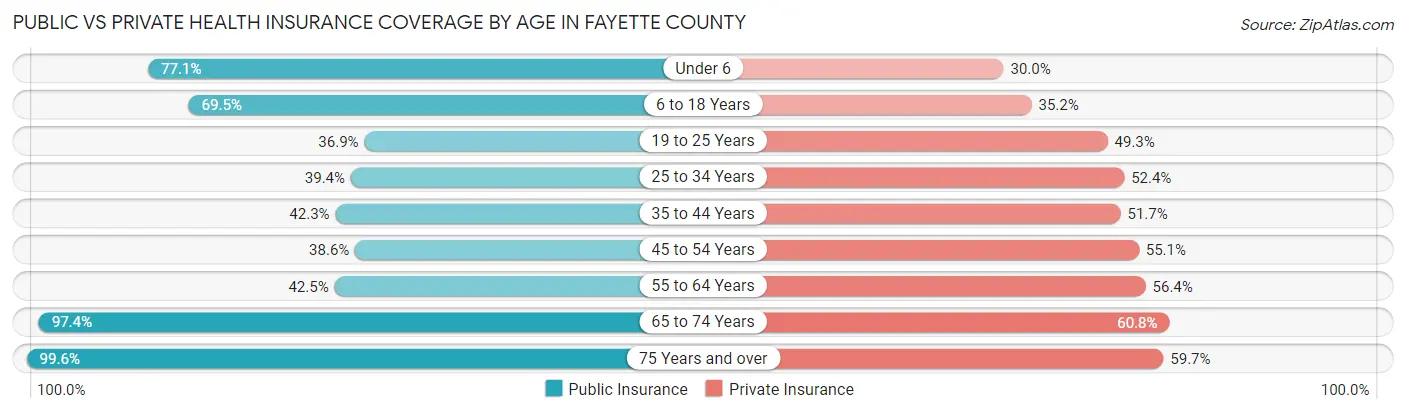
| Age Bracket | Public Insurance | Private Insurance |
| Under 6 | 1,815 (77.1%) | 707 (30.0%) |
| 6 to 18 Years | 4,403 (69.5%) | 2,230 (35.2%) |
| 19 to 25 Years | 1,038 (36.9%) | 1,387 (49.3%) |
| 25 to 34 Years | 1,468 (39.4%) | 1,951 (52.4%) |
| 35 to 44 Years | 2,004 (42.3%) | 2,451 (51.7%) |
| 45 to 54 Years | 1,955 (38.6%) | 2,789 (55.1%) |
| 55 to 64 Years | 2,435 (42.5%) | 3,232 (56.4%) |
| 65 to 74 Years | 5,097 (97.4%) | 3,183 (60.8%) |
| 75 Years and over | 3,336 (99.6%) | 1,999 (59.7%) |
| Total | 23,551 (59.9%) | 19,929 (50.7%) |
Disability Status by Sex by Age in Fayette County
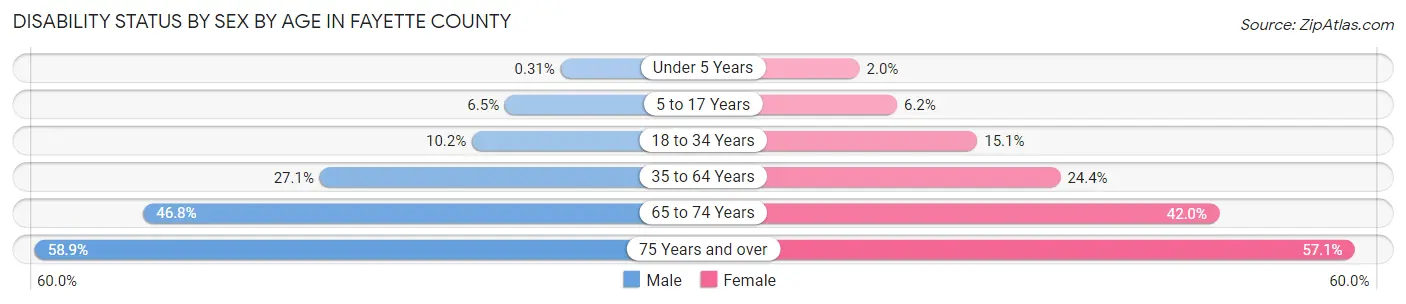
| Age Bracket | Male | Female |
| Under 5 Years | 3 (0.3%) | 20 (2.0%) |
| 5 to 17 Years | 212 (6.5%) | 189 (6.1%) |
| 18 to 34 Years | 363 (10.2%) | 503 (15.1%) |
| 35 to 64 Years | 2,073 (27.1%) | 1,921 (24.3%) |
| 65 to 74 Years | 1,196 (46.8%) | 1,125 (42.0%) |
| 75 Years and over | 797 (58.9%) | 1,139 (57.1%) |
Disability Class by Sex by Age in Fayette County
Disability Class: Hearing Difficulty
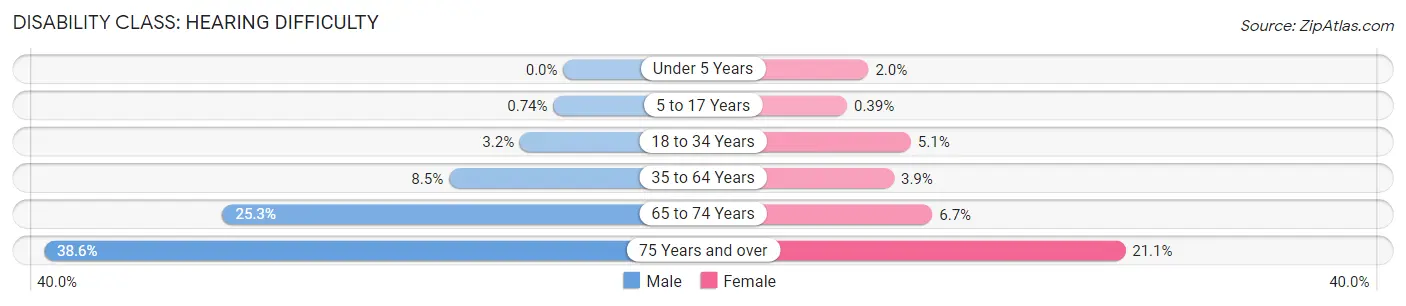
| Age Bracket | Male | Female |
| Under 5 Years | 0 (0.0%) | 20 (2.0%) |
| 5 to 17 Years | 24 (0.7%) | 12 (0.4%) |
| 18 to 34 Years | 115 (3.2%) | 171 (5.1%) |
| 35 to 64 Years | 649 (8.5%) | 306 (3.9%) |
| 65 to 74 Years | 647 (25.3%) | 180 (6.7%) |
| 75 Years and over | 522 (38.6%) | 420 (21.0%) |
Disability Class: Vision Difficulty
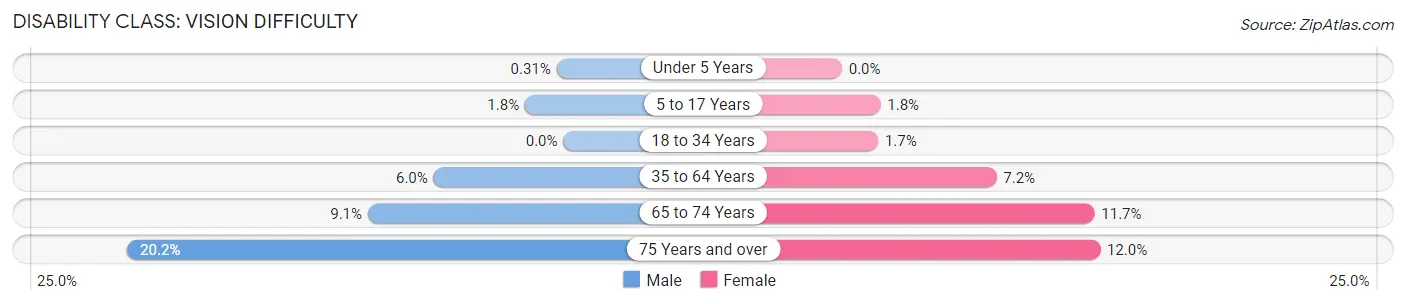
| Age Bracket | Male | Female |
| Under 5 Years | 3 (0.3%) | 0 (0.0%) |
| 5 to 17 Years | 58 (1.8%) | 55 (1.8%) |
| 18 to 34 Years | 0 (0.0%) | 56 (1.7%) |
| 35 to 64 Years | 460 (6.0%) | 566 (7.2%) |
| 65 to 74 Years | 232 (9.1%) | 314 (11.7%) |
| 75 Years and over | 274 (20.2%) | 239 (12.0%) |
Disability Class: Cognitive Difficulty
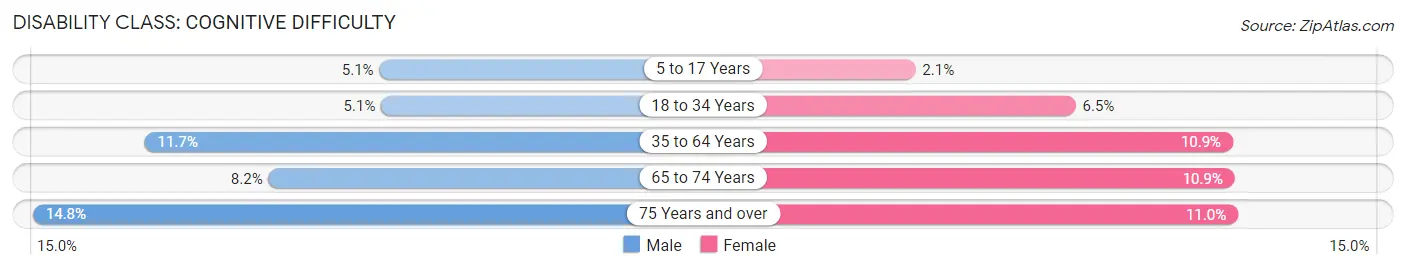
| Age Bracket | Male | Female |
| 5 to 17 Years | 167 (5.1%) | 63 (2.1%) |
| 18 to 34 Years | 181 (5.1%) | 217 (6.5%) |
| 35 to 64 Years | 891 (11.7%) | 859 (10.9%) |
| 65 to 74 Years | 210 (8.2%) | 293 (10.9%) |
| 75 Years and over | 200 (14.8%) | 220 (11.0%) |
Disability Class: Ambulatory Difficulty
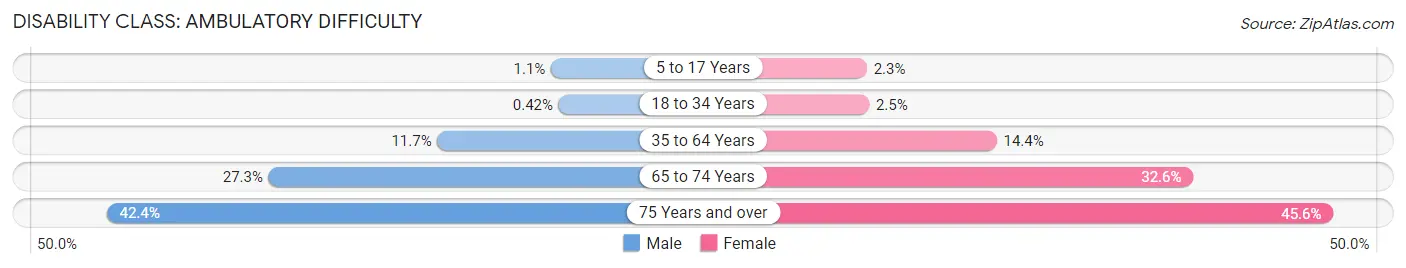
| Age Bracket | Male | Female |
| 5 to 17 Years | 37 (1.1%) | 71 (2.3%) |
| 18 to 34 Years | 15 (0.4%) | 84 (2.5%) |
| 35 to 64 Years | 892 (11.7%) | 1,133 (14.4%) |
| 65 to 74 Years | 699 (27.3%) | 874 (32.6%) |
| 75 Years and over | 574 (42.4%) | 910 (45.6%) |
Disability Class: Self-Care Difficulty
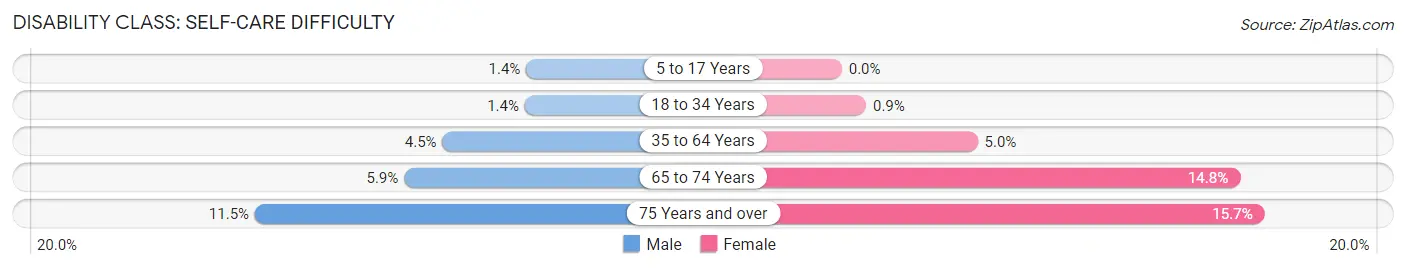
| Age Bracket | Male | Female |
| 5 to 17 Years | 45 (1.4%) | 0 (0.0%) |
| 18 to 34 Years | 51 (1.4%) | 30 (0.9%) |
| 35 to 64 Years | 343 (4.5%) | 398 (5.0%) |
| 65 to 74 Years | 151 (5.9%) | 396 (14.8%) |
| 75 Years and over | 155 (11.5%) | 313 (15.7%) |
Technology Access in Fayette County
Computing Device Access in Fayette County
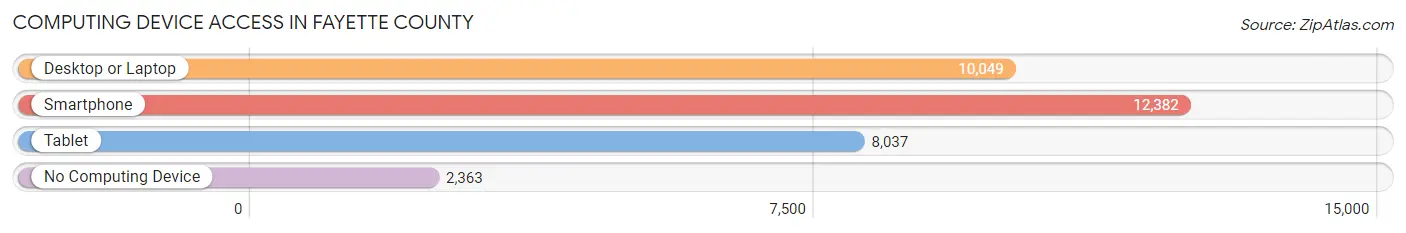
| Device Type | # Households | % Households |
| Desktop or Laptop | 10,049 | 63.0% |
| Smartphone | 12,382 | 77.7% |
| Tablet | 8,037 | 50.4% |
| No Computing Device | 2,363 | 14.8% |
| Total | 15,938 | 100.0% |
Internet Access in Fayette County
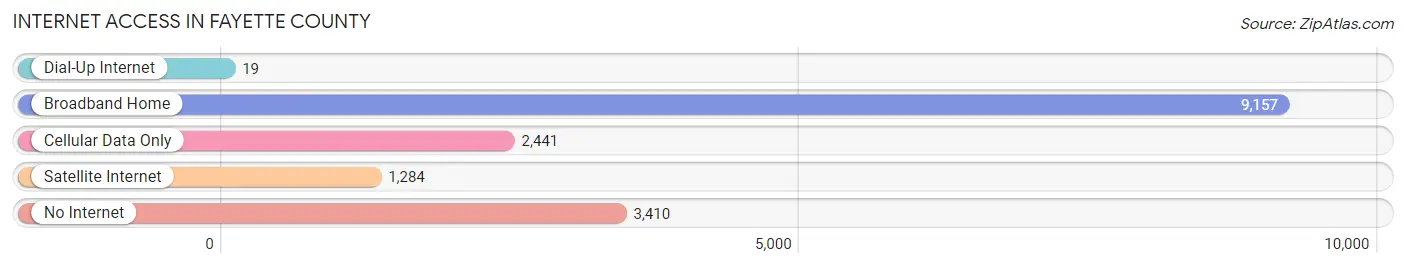
| Internet Type | # Households | % Households |
| Dial-Up Internet | 19 | 0.1% |
| Broadband Home | 9,157 | 57.5% |
| Cellular Data Only | 2,441 | 15.3% |
| Satellite Internet | 1,284 | 8.1% |
| No Internet | 3,410 | 21.4% |
| Total | 15,938 | 100.0% |
Fayette County Summary
Fayette County, West Virginia is located in the south-central part of the state and is part of the Appalachian region. It is bordered by Raleigh County to the north, Summers County to the east, Mercer County to the south, and Nicholas County to the west. The county seat is Fayetteville, and the largest city is Oak Hill. The county was created in 1831 from parts of Kanawha and Nicholas counties and was named for the Marquis de Lafayette, a French military hero who fought in the American Revolutionary War.
Geography
Fayette County is located in the Appalachian Mountains and is part of the Allegheny Plateau. The county is mostly mountainous, with the highest point being Gauley Mountain at 3,912 feet. The New River, the second oldest river in the world, runs through the county and is a popular destination for whitewater rafting and kayaking. The county is also home to several state parks, including Babcock State Park, Hawks Nest State Park, and New River Gorge National River.
Economy
The economy of Fayette County is largely based on coal mining, timber, and tourism. The county is home to several coal mines, including the Kayford Mine, which is the largest surface coal mine in the United States. The timber industry is also important to the county, with several sawmills and wood-processing plants located in the area. Tourism is also a major contributor to the economy, with the New River Gorge National River and several state parks drawing visitors from all over the country.
Demographics
As of the 2010 census, the population of Fayette County was 46,039, making it the fifth most populous county in West Virginia. The population is mostly white (96.2%), with small percentages of African Americans (2.2%), Native Americans (0.3%), Asians (0.2%), and other races (1.1%). The median household income is $37,845, and the median age is 43.7 years.
Conclusion
Fayette County, West Virginia is a rural county located in the Appalachian Mountains. It is home to several coal mines, timber operations, and state parks, and is a popular destination for whitewater rafting and other outdoor activities. The population is mostly white, with a median household income of $37,845 and a median age of 43.7 years. The county is an important part of the West Virginia economy, and its natural beauty and outdoor recreation opportunities make it a popular destination for visitors from all over the country.
Common Questions
What is the Total Population of Fayette County?
Total Population of Fayette County is 40,545.
What is the Total Male Population of Fayette County?
Total Male Population of Fayette County is 20,365.
What is the Total Female Population of Fayette County?
Total Female Population of Fayette County is 20,180.
What is the Ratio of Males per 100 Females in Fayette County?
There are 100.92 Males per 100 Females in Fayette County.
What is the Ratio of Females per 100 Males in Fayette County?
There are 99.09 Females per 100 Males in Fayette County.
What is the Median Population Age in Fayette County?
Median Population Age in Fayette County is 44.7 Years.
What is the Average Family Size in Fayette County
Average Family Size in Fayette County is 3.0 People.
What is the Average Household Size in Fayette County
Average Household Size in Fayette County is 2.5 People.
What is Per Capita Income in Fayette County?
Per Capita income in Fayette County is $24,818.
What is the Median Family Income in Fayette County?
Median Family Income in Fayette County is $61,952.
What is the Median Household income in Fayette County?
Median Household Income in Fayette County is $50,090.
What is Income or Wage Gap in Fayette County?
Income or Wage Gap in Fayette County is 23.5%.
Women in Fayette County earn 76.5 cents for every dollar earned by a man.
What is Family Income Deficit in Fayette County?
Family Income Deficit in Fayette County is $10,449.
Families that are below poverty line in Fayette County earn $10,449 less on average than the poverty threshold level.
What is Inequality or Gini Index in Fayette County?
Inequality or Gini Index in Fayette County is 0.44.
How Large is the Labor Force in Fayette County?
There are 15,359 People in the Labor Forcein in Fayette County.
What is the Percentage of People in the Labor Force in Fayette County?
46.2% of People are in the Labor Force in Fayette County.
What is the Unemployment Rate in Fayette County?
Unemployment Rate in Fayette County is 7.5%.