Calhoun County, WV
Calhoun County Map

Calhoun County Overview
6,279
TOTAL POPULATION
3,004
MALE POPULATION
3,275
FEMALE POPULATION
91.73
MALES / 100 FEMALES
109.02
FEMALES / 100 MALES
48.3
MEDIAN AGE
3.3
AVG FAMILY SIZE
2.6
AVG HOUSEHOLD SIZE
$22,982
PER CAPITA INCOME
$47,735
AVG FAMILY INCOME
$39,031
AVG HOUSEHOLD INCOME
52.6%
WAGE / INCOME GAP [ % ]
47.4¢/ $1
WAGE / INCOME GAP [ $ ]
$13,323
FAMILY INCOME DEFICIT
0.48
INEQUALITY / GINI INDEX
2,195
LABOR FORCE [ PEOPLE ]
42.4%
PERCENT IN LABOR FORCE
12.2%
UNEMPLOYMENT RATE
Race in Calhoun County
The most populous races in Calhoun County are White / Caucasian (6,027 | 96.0%), Two or more Races (242 | 3.8%), and Hispanic or Latino (19 | 0.3%).

| Race | # Population | % Population |
| Asian | 2 | 0.0% |
| Black / African American | 3 | 0.1% |
| Hawaiian / Pacific | 0 | 0.0% |
| Hispanic or Latino | 19 | 0.3% |
| Native / Alaskan | 5 | 0.1% |
| White / Caucasian | 6,027 | 96.0% |
| Two or more Races | 242 | 3.8% |
| Some other Race | 0 | 0.0% |
| Total | 6,279 | 100.0% |
Ancestry in Calhoun County
The most populous ancestries reported in Calhoun County are Irish (1,008 | 16.1%), English (873 | 13.9%), German (689 | 11.0%), American (438 | 7.0%), and Italian (347 | 5.5%), together accounting for 53.4% of all Calhoun County residents.

| Ancestry | # Population | % Population |
| American | 438 | 7.0% |
| Arab | 9 | 0.1% |
| British | 12 | 0.2% |
| Cherokee | 43 | 0.7% |
| Croatian | 5 | 0.1% |
| Czech | 5 | 0.1% |
| Dutch | 96 | 1.5% |
| English | 873 | 13.9% |
| French | 272 | 4.3% |
| German | 689 | 11.0% |
| Hungarian | 25 | 0.4% |
| Indian (Asian) | 2 | 0.0% |
| Iraqi | 9 | 0.1% |
| Irish | 1,008 | 16.1% |
| Italian | 347 | 5.5% |
| Mexican | 5 | 0.1% |
| Navajo | 34 | 0.5% |
| Norwegian | 5 | 0.1% |
| Polish | 27 | 0.4% |
| Potawatomi | 5 | 0.1% |
| Puerto Rican | 6 | 0.1% |
| Russian | 4 | 0.1% |
| Scandinavian | 6 | 0.1% |
| Scotch-Irish | 12 | 0.2% |
| Scottish | 100 | 1.6% |
| Spanish | 8 | 0.1% |
| Swedish | 22 | 0.4% |
| Ukrainian | 10 | 0.2% |
| Welsh | 25 | 0.4% | View All 29 Rows |
Immigrants in Calhoun County
The most numerous immigrant groups reported in Calhoun County came from Asia (11 | 0.2%), Iraq (9 | 0.1%), Western Asia (9 | 0.1%), Singapore (2 | 0.0%), and South Eastern Asia (2 | 0.0%), together accounting for 0.5% of all Calhoun County residents.

| Immigration Origin | # Population | % Population |
| Asia | 11 | 0.2% |
| Iraq | 9 | 0.1% |
| Singapore | 2 | 0.0% |
| South Eastern Asia | 2 | 0.0% |
| Western Asia | 9 | 0.1% | View All 5 Rows |
Sex and Age in Calhoun County
Sex and Age in Calhoun County
The most populous age groups in Calhoun County are 35 to 39 Years (343 | 11.4%) for men and 55 to 59 Years (365 | 11.2%) for women.

| Age Bracket | Male | Female |
| Under 5 Years | 74 (2.5%) | 188 (5.7%) |
| 5 to 9 Years | 222 (7.4%) | 273 (8.3%) |
| 10 to 14 Years | 92 (3.1%) | 141 (4.3%) |
| 15 to 19 Years | 157 (5.2%) | 259 (7.9%) |
| 20 to 24 Years | 70 (2.3%) | 85 (2.6%) |
| 25 to 29 Years | 144 (4.8%) | 133 (4.1%) |
| 30 to 34 Years | 79 (2.6%) | 142 (4.3%) |
| 35 to 39 Years | 343 (11.4%) | 170 (5.2%) |
| 40 to 44 Years | 176 (5.9%) | 159 (4.9%) |
| 45 to 49 Years | 87 (2.9%) | 182 (5.6%) |
| 50 to 54 Years | 205 (6.8%) | 218 (6.7%) |
| 55 to 59 Years | 302 (10.1%) | 365 (11.2%) |
| 60 to 64 Years | 269 (8.9%) | 172 (5.2%) |
| 65 to 69 Years | 338 (11.3%) | 311 (9.5%) |
| 70 to 74 Years | 167 (5.6%) | 153 (4.7%) |
| 75 to 79 Years | 166 (5.5%) | 164 (5.0%) |
| 80 to 84 Years | 62 (2.1%) | 68 (2.1%) |
| 85 Years and over | 51 (1.7%) | 92 (2.8%) |
| Total | 3,004 (100.0%) | 3,275 (100.0%) |
Families and Households in Calhoun County
Median Family Size in Calhoun County
The median family size in Calhoun County is 3.29 persons per family, with single female/mother families (247 | 16.4%) accounting for the largest median family size of 4.14 persons per family. On the other hand, married-couple families (1,183 | 78.8%) represent the smallest median family size with 3.09 persons per family.

| Family Type | # Families | Family Size |
| Married-Couple | 1,183 (78.8%) | 3.09 |
| Single Male/Father | 72 (4.8%) | 3.63 |
| Single Female/Mother | 247 (16.4%) | 4.14 |
| Total Families | 1,502 (100.0%) | 3.29 |
Median Household Size in Calhoun County
The median household size in Calhoun County is 2.59 persons per household, with single female/mother households (247 | 10.2%) accounting for the largest median household size of 4.22 persons per household. non-family households (914 | 37.8%) represent the smallest median household size with 1.24 persons per household.

| Household Type | # Households | Household Size |
| Married-Couple | 1,183 (49.0%) | 3.20 |
| Single Male/Father | 72 (3.0%) | 4.03 |
| Single Female/Mother | 247 (10.2%) | 4.22 |
| Non-family | 914 (37.8%) | 1.24 |
| Total Households | 2,416 (100.0%) | 2.59 |
Household Size by Marriage Status in Calhoun County
Out of a total of 2,416 households in Calhoun County, 1,502 (62.2%) are family households, while 914 (37.8%) are nonfamily households. The most numerous type of family households are 2-person households, comprising 805, and the most common type of nonfamily households are 1-person households, comprising 737.

| Household Size | Family Households | Nonfamily Households |
| 1-Person Households | - | 737 (30.5%) |
| 2-Person Households | 805 (33.3%) | 147 (6.1%) |
| 3-Person Households | 392 (16.2%) | 30 (1.2%) |
| 4-Person Households | 93 (3.8%) | 0 (0.0%) |
| 5-Person Households | 164 (6.8%) | 0 (0.0%) |
| 6-Person Households | 33 (1.4%) | 0 (0.0%) |
| 7+ Person Households | 15 (0.6%) | 0 (0.0%) |
| Total | 1,502 (62.2%) | 914 (37.8%) |
Female Fertility in Calhoun County
Fertility by Age in Calhoun County
Average fertility rate in Calhoun County is 10.0 births per 1,000 women. Women in the age bracket of 20 to 34 years have the highest fertility rate with 25.0 births per 1,000 women. Women in the age bracket of 20 to 34 years acount for 75.0% of all women with births.

| Age Bracket | Women with Births | Births / 1,000 Women |
| 15 to 19 years | 0 (0.0%) | 0.0 |
| 20 to 34 years | 9 (75.0%) | 25.0 |
| 35 to 50 years | 3 (25.0%) | 6.0 |
| Total | 12 (100.0%) | 10.0 |
Fertility by Age by Marriage Status in Calhoun County
25.0% of women with births (12) in Calhoun County are married. The highest percentage of unmarried women with births falls into 20 to 34 years age bracket with 100.0% of them unmarried at the time of birth, while the lowest percentage of unmarried women with births belong to 35 to 50 years age bracket with 0.0% of them unmarried.

| Age Bracket | Married | Unmarried |
| 15 to 19 years | 0 (0.0%) | 0 (0.0%) |
| 20 to 34 years | 0 (0.0%) | 9 (100.0%) |
| 35 to 50 years | 3 (100.0%) | 0 (0.0%) |
| Total | 3 (25.0%) | 9 (75.0%) |
Fertility by Education in Calhoun County

| Educational Attainment | Women with Births | Births / 1,000 Women |
| Less than High School | 0 (0.0%) | 0.0 |
| High School Diploma | 9 (75.0%) | 20.0 |
| College or Associate's Degree | 0 (0.0%) | 0.0 |
| Bachelor's Degree | 3 (25.0%) | 23.0 |
| Graduate Degree | 0 (0.0%) | 0.0 |
| Total | 12 (100.0%) | 10.0 |
Fertility by Education by Marriage Status in Calhoun County
75.0% of women with births in Calhoun County are unmarried. Women with the educational attainment of bachelor's degree are most likely to be married with 100.0% of them married at childbirth, while women with the educational attainment of high school diploma are least likely to be married with 100.0% of them unmarried at childbirth.

| Educational Attainment | Married | Unmarried |
| Less than High School | 0 (0.0%) | 0 (0.0%) |
| High School Diploma | 0 (0.0%) | 9 (100.0%) |
| College or Associate's Degree | 0 (0.0%) | 0 (0.0%) |
| Bachelor's Degree | 3 (100.0%) | 0 (0.0%) |
| Graduate Degree | 0 (0.0%) | 0 (0.0%) |
| Total | 3 (25.0%) | 9 (75.0%) |
Income in Calhoun County
Income Overview in Calhoun County
Per Capita Income in Calhoun County is $22,982, while median incomes of families and households are $47,735 and $39,031 respectively.
| Characteristic | Number | Measure |
| Per Capita Income | 6,279 | $22,982 |
| Median Family Income | 1,502 | $47,735 |
| Mean Family Income | 1,502 | $60,805 |
| Median Household Income | 2,416 | $39,031 |
| Mean Household Income | 2,416 | $52,368 |
| Income Deficit | 1,502 | $13,323 |
| Wage / Income Gap (%) | 6,279 | 52.62% |
| Wage / Income Gap ($) | 6,279 | 47.38¢ per $1 |
| Gini / Inequality Index | 6,279 | 0.48 |
Earnings by Sex in Calhoun County
Average Earnings in Calhoun County are $29,098, $40,074 for men and $18,988 for women, a difference of 52.6%.

| Sex | Number | Average Earnings |
| Male | 1,117 (50.6%) | $40,074 |
| Female | 1,091 (49.4%) | $18,988 |
| Total | 2,208 (100.0%) | $29,098 |
Earnings by Sex by Income Bracket in Calhoun County
The most common earnings brackets in Calhoun County are $45,000 to $49,999 for men (162 | 14.5%) and $2,500 to $4,999 for women (125 | 11.5%).

| Income | Male | Female |
| $2,499 or less | 18 (1.6%) | 42 (3.8%) |
| $2,500 to $4,999 | 20 (1.8%) | 125 (11.5%) |
| $5,000 to $7,499 | 61 (5.5%) | 40 (3.7%) |
| $7,500 to $9,999 | 0 (0.0%) | 98 (9.0%) |
| $10,000 to $12,499 | 28 (2.5%) | 83 (7.6%) |
| $12,500 to $14,999 | 25 (2.2%) | 124 (11.4%) |
| $15,000 to $17,499 | 45 (4.0%) | 21 (1.9%) |
| $17,500 to $19,999 | 10 (0.9%) | 21 (1.9%) |
| $20,000 to $22,499 | 34 (3.0%) | 52 (4.8%) |
| $22,500 to $24,999 | 50 (4.5%) | 65 (6.0%) |
| $25,000 to $29,999 | 106 (9.5%) | 80 (7.3%) |
| $30,000 to $34,999 | 60 (5.4%) | 16 (1.5%) |
| $35,000 to $39,999 | 101 (9.0%) | 6 (0.5%) |
| $40,000 to $44,999 | 30 (2.7%) | 21 (1.9%) |
| $45,000 to $49,999 | 162 (14.5%) | 106 (9.7%) |
| $50,000 to $54,999 | 58 (5.2%) | 4 (0.4%) |
| $55,000 to $64,999 | 28 (2.5%) | 29 (2.7%) |
| $65,000 to $74,999 | 116 (10.4%) | 1 (0.1%) |
| $75,000 to $99,999 | 56 (5.0%) | 57 (5.2%) |
| $100,000+ | 109 (9.8%) | 100 (9.2%) |
| Total | 1,117 (100.0%) | 1,091 (100.0%) |
Earnings by Sex by Educational Attainment in Calhoun County
Average earnings in Calhoun County are $39,583 for men and $22,538 for women, a difference of 43.1%. Men with an educational attainment of bachelor's degree enjoy the highest average annual earnings of $59,375, while those with less than high school education earn the least with $35,000. Women with an educational attainment of bachelor's degree earn the most with the average annual earnings of $128,300, while those with high school diploma education have the smallest earnings of $13,242.

| Educational Attainment | Male Income | Female Income |
| Less than High School | $35,000 | $21,667 |
| High School Diploma | $36,229 | $13,242 |
| College or Associate's Degree | $48,517 | $29,841 |
| Bachelor's Degree | $59,375 | $128,300 |
| Graduate Degree | - | - |
| Total | $39,583 | $22,538 |
Family Income in Calhoun County
Family Income Brackets in Calhoun County
According to the Calhoun County family income data, there are 348 families falling into the $35,000 to $49,999 income range, which is the most common income bracket and makes up 23.2% of all families. Conversely, the $200,000+ income bracket is the least frequent group with only 47 families (3.1%) belonging to this category.

| Income Bracket | # Families | % Families |
| Less than $10,000 | 65 | 4.3% |
| $10,000 to $14,999 | 108 | 7.2% |
| $15,000 to $24,999 | 192 | 12.8% |
| $25,000 to $34,999 | 144 | 9.6% |
| $35,000 to $49,999 | 348 | 23.2% |
| $50,000 to $74,999 | 317 | 21.1% |
| $75,000 to $99,999 | 107 | 7.1% |
| $100,000 to $149,999 | 65 | 4.3% |
| $150,000 to $199,999 | 111 | 7.4% |
| $200,000+ | 47 | 3.1% |
Family Income by Famaliy Size in Calhoun County
3-person families (359 | 23.9%) account for the highest median family income in Calhoun County with $59,750 per family, while 2-person families (843 | 56.1%) have the highest median income of $22,074 per family member.

| Income Bracket | # Families | Median Income |
| 2-Person Families | 843 (56.1%) | $44,148 |
| 3-Person Families | 359 (23.9%) | $59,750 |
| 4-Person Families | 121 (8.1%) | $15,650 |
| 5-Person Families | 167 (11.1%) | $0 |
| 6-Person Families | 1 (0.1%) | $0 |
| 7+ Person Families | 11 (0.7%) | $0 |
| Total | 1,502 (100.0%) | $47,735 |
Family Income by Number of Earners in Calhoun County
The median family income in Calhoun County is $47,735, with families comprising 3+ earners (90) having the highest median family income of $175,833, while families with no earners (579) have the lowest median family income of $35,179, accounting for 6.0% and 38.6% of families, respectively.

| Number of Earners | # Families | Median Income |
| No Earners | 579 (38.6%) | $35,179 |
| 1 Earner | 401 (26.7%) | $39,609 |
| 2 Earners | 432 (28.8%) | $59,545 |
| 3+ Earners | 90 (6.0%) | $175,833 |
| Total | 1,502 (100.0%) | $47,735 |
Household Income in Calhoun County
Household Income Brackets in Calhoun County
With 435 households falling in the category, the $35,000 to $49,999 income range is the most frequent in Calhoun County, accounting for 18.0% of all households. In contrast, only 46 households (1.9%) fall into the $200,000+ income bracket, making it the least populous group.

| Income Bracket | # Households | % Households |
| Less than $10,000 | 215 | 8.9% |
| $10,000 to $14,999 | 232 | 9.6% |
| $15,000 to $24,999 | 430 | 17.8% |
| $25,000 to $34,999 | 232 | 9.6% |
| $35,000 to $49,999 | 435 | 18.0% |
| $50,000 to $74,999 | 418 | 17.3% |
| $75,000 to $99,999 | 174 | 7.2% |
| $100,000 to $149,999 | 63 | 2.6% |
| $150,000 to $199,999 | 169 | 7.0% |
| $200,000+ | 46 | 1.9% |
Household Income by Householder Age in Calhoun County
The median household income in Calhoun County is $39,031, with the highest median household income of $46,000 found in the 15 to 24 years age bracket for the primary householder. A total of 22 households (0.9%) fall into this category. Meanwhile, the 65+ years age bracket for the primary householder has the lowest median household income of $37,121, with 1,068 households (44.2%) in this group.

| Income Bracket | # Households | Median Income |
| 15 to 24 Years | 22 (0.9%) | $46,000 |
| 25 to 44 Years | 462 (19.1%) | $40,500 |
| 45 to 64 Years | 864 (35.8%) | $42,692 |
| 65+ Years | 1,068 (44.2%) | $37,121 |
| Total | 2,416 (100.0%) | $39,031 |
Poverty in Calhoun County
Income Below Poverty by Sex and Age in Calhoun County
With 33.0% poverty level for males and 34.3% for females among the residents of Calhoun County, 5 year old males and 16 and 17 year old females are the most vulnerable to poverty, with 10 males (100.0%) and 51 females (96.2%) in their respective age groups living below the poverty level.

| Age Bracket | Male | Female |
| Under 5 Years | 25 (33.8%) | 50 (26.6%) |
| 5 Years | 10 (100.0%) | 0 (0.0%) |
| 6 to 11 Years | 185 (68.5%) | 224 (66.1%) |
| 12 to 14 Years | 26 (100.0%) | 8 (12.1%) |
| 15 Years | 0 (0.0%) | 45 (43.3%) |
| 16 and 17 Years | 15 (37.5%) | 51 (96.2%) |
| 18 to 24 Years | 92 (51.1%) | 27 (14.4%) |
| 25 to 34 Years | 24 (10.8%) | 57 (20.7%) |
| 35 to 44 Years | 270 (52.0%) | 240 (73.0%) |
| 45 to 54 Years | 88 (30.1%) | 144 (36.0%) |
| 55 to 64 Years | 160 (28.1%) | 104 (19.4%) |
| 65 to 74 Years | 66 (13.2%) | 74 (16.0%) |
| 75 Years and over | 24 (8.8%) | 94 (30.1%) |
| Total | 985 (33.0%) | 1,118 (34.3%) |
Income Above Poverty by Sex and Age in Calhoun County
According to the poverty statistics in Calhoun County, males aged 15 years and females aged 5 years are the age groups that are most secure financially, with 100.0% of males and 100.0% of females in these age groups living above the poverty line.

| Age Bracket | Male | Female |
| Under 5 Years | 49 (66.2%) | 138 (73.4%) |
| 5 Years | 0 (0.0%) | 9 (100.0%) |
| 6 to 11 Years | 85 (31.5%) | 115 (33.9%) |
| 12 to 14 Years | 0 (0.0%) | 58 (87.9%) |
| 15 Years | 7 (100.0%) | 59 (56.7%) |
| 16 and 17 Years | 25 (62.5%) | 2 (3.8%) |
| 18 to 24 Years | 88 (48.9%) | 160 (85.6%) |
| 25 to 34 Years | 199 (89.2%) | 218 (79.3%) |
| 35 to 44 Years | 249 (48.0%) | 89 (27.1%) |
| 45 to 54 Years | 204 (69.9%) | 256 (64.0%) |
| 55 to 64 Years | 409 (71.9%) | 432 (80.6%) |
| 65 to 74 Years | 435 (86.8%) | 390 (84.1%) |
| 75 Years and over | 248 (91.2%) | 218 (69.9%) |
| Total | 1,998 (67.0%) | 2,144 (65.7%) |
Income Below Poverty Among Married-Couple Families in Calhoun County
The poverty statistics for married-couple families in Calhoun County show that 18.4% or 218 of the total 1,183 families live below the poverty line. Families with 3 or 4 children have the highest poverty rate of 57.9%, comprising of 70 families. On the other hand, families with no children have the lowest poverty rate of 8.0%, which includes 64 families.

| Children | Above Poverty | Below Poverty |
| No Children | 736 (92.0%) | 64 (8.0%) |
| 1 or 2 Children | 178 (67.9%) | 84 (32.1%) |
| 3 or 4 Children | 51 (42.1%) | 70 (57.9%) |
| 5 or more Children | 0 (0.0%) | 0 (0.0%) |
| Total | 965 (81.6%) | 218 (18.4%) |
Income Below Poverty Among Single-Parent Households in Calhoun County
According to the poverty data in Calhoun County, 34.7% or 25 single-father households and 30.0% or 74 single-mother households are living below the poverty line. Among single-father households, those with 3 or 4 children have the highest poverty rate, with 4 households (100.0%) experiencing poverty. Likewise, among single-mother households, those with 3 or 4 children have the highest poverty rate, with 44 households (100.0%) falling below the poverty line.

| Children | Single Father | Single Mother |
| No Children | 21 (42.9%) | 18 (21.2%) |
| 1 or 2 Children | 0 (0.0%) | 12 (11.2%) |
| 3 or 4 Children | 4 (100.0%) | 44 (100.0%) |
| 5 or more Children | 0 (0.0%) | 0 (0.0%) |
| Total | 25 (34.7%) | 74 (30.0%) |
Income Below Poverty Among Married-Couple vs Single-Parent Households in Calhoun County
The poverty data for Calhoun County shows that 218 of the married-couple family households (18.4%) and 99 of the single-parent households (31.0%) are living below the poverty level. Within the married-couple family households, those with 3 or 4 children have the highest poverty rate, with 70 households (57.9%) falling below the poverty line. Among the single-parent households, those with 3 or 4 children have the highest poverty rate, with 48 household (100.0%) living below poverty.

| Children | Married-Couple Families | Single-Parent Households |
| No Children | 64 (8.0%) | 39 (29.1%) |
| 1 or 2 Children | 84 (32.1%) | 12 (9.5%) |
| 3 or 4 Children | 70 (57.9%) | 48 (100.0%) |
| 5 or more Children | 0 (0.0%) | 0 (0.0%) |
| Total | 218 (18.4%) | 99 (31.0%) |
Employment Characteristics in Calhoun County
Employment by Class of Employer in Calhoun County
Among the 1,794 employed individuals in Calhoun County, private company employees (1,283 | 71.5%), local government employees (193 | 10.8%), and not-for-profit organizations (70 | 3.9%) make up the most common classes of employment.

| Employer Class | # Employees | % Employees |
| Private Company Employees | 1,283 | 71.5% |
| Self-Employed (Incorporated) | 56 | 3.1% |
| Self-Employed (Not Incorporated) | 60 | 3.3% |
| Not-for-profit Organizations | 70 | 3.9% |
| Local Government Employees | 193 | 10.8% |
| State Government Employees | 57 | 3.2% |
| Federal Government Employees | 70 | 3.9% |
| Unpaid Family Workers | 5 | 0.3% |
| Total | 1,794 | 100.0% |
Employment Status by Age in Calhoun County
According to the labor force statistics for Calhoun County, out of the total population over 16 years of age (5,178), 42.4% or 2,195 individuals are in the labor force, with 12.2% or 268 of them unemployed. The age group with the highest labor force participation rate is 30 to 34 years, with 91.0% or 201 individuals in the labor force. Within the labor force, the 35 to 44 years age range has the highest percentage of unemployed individuals, with 22.4% or 95 of them being unemployed.

| Age Bracket | In Labor Force | Unemployed |
| 16 to 19 Years | 130 (42.6%) | 25 (19.2%) |
| 20 to 24 Years | 87 (56.1%) | 15 (17.2%) |
| 25 to 29 Years | 233 (84.1%) | 1 (0.4%) |
| 30 to 34 Years | 201 (91.0%) | 22 (10.9%) |
| 35 to 44 Years | 424 (50.0%) | 95 (22.4%) |
| 45 to 54 Years | 431 (62.3%) | 65 (15.1%) |
| 55 to 59 Years | 371 (55.6%) | 46 (12.4%) |
| 60 to 64 Years | 156 (35.4%) | 0 (0.0%) |
| 65 to 74 Years | 152 (15.7%) | 0 (0.0%) |
| 75 Years and over | 11 (1.8%) | 0 (0.0%) |
| Total | 2,195 (42.4%) | 268 (12.2%) |
Employment Status by Educational Attainment in Calhoun County
According to labor force statistics for Calhoun County, 57.7% of individuals (1,815) out of the total population between 25 and 64 years of age (3,146) are in the labor force, with 12.6% or 229 of them being unemployed. The group with the highest labor force participation rate are those with the educational attainment of bachelor's degree or higher, with 90.4% or 226 individuals in the labor force. Within the labor force, individuals with high school diploma education have the highest percentage of unemployment, with 17.6% or 163 of them being unemployed.

| Educational Attainment | In Labor Force | Unemployed |
| Less than High School | 92 (31.7%) | 41 (14.1%) |
| High School Diploma | 928 (49.9%) | 327 (17.6%) |
| College / Associate Degree | 571 (76.4%) | 69 (9.3%) |
| Bachelor's Degree or higher | 226 (90.4%) | 0 (0.0%) |
| Total | 1,815 (57.7%) | 396 (12.6%) |
Employment Occupations by Sex in Calhoun County
Management, Business, Science and Arts Occupations
The most common Management, Business, Science and Arts occupations in Calhoun County are Health Diagnosing & Treating (179 | 9.3%), Health Technologists (124 | 6.4%), Management (92 | 4.8%), Community & Social Service (76 | 3.9%), and Education Instruction & Library (59 | 3.1%).

Management, Business, Science and Arts Occupations by Sex
Within the Management, Business, Science and Arts occupations in Calhoun County, the most male-oriented occupations are Computers, Engineering & Science (100.0%), Architecture & Engineering (100.0%), and Education, Arts & Media (100.0%), while the most female-oriented occupations are Health Technologists (100.0%), Education Instruction & Library (89.8%), and Health Diagnosing & Treating (82.7%).

| Occupation | Male | Female |
| Management | 20 (21.7%) | 72 (78.3%) |
| Business & Financial | 14 (27.5%) | 37 (72.6%) |
| Computers, Engineering & Science | 18 (100.0%) | 0 (0.0%) |
| Computers & Mathematics | 0 (0.0%) | 0 (0.0%) |
| Architecture & Engineering | 18 (100.0%) | 0 (0.0%) |
| Life, Physical & Social Science | 0 (0.0%) | 0 (0.0%) |
| Community & Social Service | 21 (27.6%) | 55 (72.4%) |
| Education, Arts & Media | 6 (100.0%) | 0 (0.0%) |
| Legal Services & Support | 0 (0.0%) | 0 (0.0%) |
| Education Instruction & Library | 6 (10.2%) | 53 (89.8%) |
| Arts, Media & Entertainment | 9 (81.8%) | 2 (18.2%) |
| Health Diagnosing & Treating | 31 (17.3%) | 148 (82.7%) |
| Health Technologists | 0 (0.0%) | 124 (100.0%) |
| Total (Category) | 104 (25.0%) | 312 (75.0%) |
| Total (Overall) | 980 (50.9%) | 947 (49.1%) |
Services Occupations
The most common Services occupations in Calhoun County are Healthcare Support (119 | 6.2%), Food Preparation & Serving (83 | 4.3%), Cleaning & Maintenance (36 | 1.9%), Security & Protection (25 | 1.3%), and Law Enforcement (16 | 0.8%).

Services Occupations by Sex
Within the Services occupations in Calhoun County, the most male-oriented occupations are Security & Protection (100.0%), Firefighting & Prevention (100.0%), and Law Enforcement (100.0%), while the most female-oriented occupations are Healthcare Support (100.0%), Personal Care & Service (80.0%), and Food Preparation & Serving (79.5%).

| Occupation | Male | Female |
| Healthcare Support | 0 (0.0%) | 119 (100.0%) |
| Security & Protection | 25 (100.0%) | 0 (0.0%) |
| Firefighting & Prevention | 9 (100.0%) | 0 (0.0%) |
| Law Enforcement | 16 (100.0%) | 0 (0.0%) |
| Food Preparation & Serving | 17 (20.5%) | 66 (79.5%) |
| Cleaning & Maintenance | 27 (75.0%) | 9 (25.0%) |
| Personal Care & Service | 2 (20.0%) | 8 (80.0%) |
| Total (Category) | 71 (26.0%) | 202 (74.0%) |
| Total (Overall) | 980 (50.9%) | 947 (49.1%) |
Sales and Office Occupations
The most common Sales and Office occupations in Calhoun County are Sales & Related (250 | 13.0%), and Office & Administration (246 | 12.8%).

Sales and Office Occupations by Sex

| Occupation | Male | Female |
| Sales & Related | 64 (25.6%) | 186 (74.4%) |
| Office & Administration | 13 (5.3%) | 233 (94.7%) |
| Total (Category) | 77 (15.5%) | 419 (84.5%) |
| Total (Overall) | 980 (50.9%) | 947 (49.1%) |
Natural Resources, Construction and Maintenance Occupations
The most common Natural Resources, Construction and Maintenance occupations in Calhoun County are Construction & Extraction (278 | 14.4%), and Installation, Maintenance & Repair (43 | 2.2%).

Natural Resources, Construction and Maintenance Occupations by Sex

| Occupation | Male | Female |
| Farming, Fishing & Forestry | 0 (0.0%) | 0 (0.0%) |
| Construction & Extraction | 278 (100.0%) | 0 (0.0%) |
| Installation, Maintenance & Repair | 43 (100.0%) | 0 (0.0%) |
| Total (Category) | 321 (100.0%) | 0 (0.0%) |
| Total (Overall) | 980 (50.9%) | 947 (49.1%) |
Production, Transportation and Moving Occupations
The most common Production, Transportation and Moving occupations in Calhoun County are Production (246 | 12.8%), Transportation (100 | 5.2%), and Material Moving (75 | 3.9%).

Production, Transportation and Moving Occupations by Sex

| Occupation | Male | Female |
| Production | 232 (94.3%) | 14 (5.7%) |
| Transportation | 100 (100.0%) | 0 (0.0%) |
| Material Moving | 75 (100.0%) | 0 (0.0%) |
| Total (Category) | 407 (96.7%) | 14 (3.3%) |
| Total (Overall) | 980 (50.9%) | 947 (49.1%) |
Employment Industries by Sex in Calhoun County
Employment Industries in Calhoun County
The major employment industries in Calhoun County include Health Care & Social Assistance (250 | 13.0%), Retail Trade (240 | 12.4%), Mining, Quarrying, & Extraction (219 | 11.4%), Educational Services (192 | 10.0%), and Construction (180 | 9.3%).

Employment Industries by Sex in Calhoun County
The Calhoun County industries that see more men than women are Construction (100.0%), Wholesale Trade (100.0%), and Utilities (100.0%), whereas the industries that tend to have a higher number of women are Agriculture, Fishing & Hunting (100.0%), Health Care & Social Assistance (98.8%), and Finance & Insurance (83.5%).

| Industry | Male | Female |
| Agriculture, Fishing & Hunting | 0 (0.0%) | 25 (100.0%) |
| Mining, Quarrying, & Extraction | 193 (88.1%) | 26 (11.9%) |
| Construction | 180 (100.0%) | 0 (0.0%) |
| Manufacturing | 97 (84.4%) | 18 (15.7%) |
| Wholesale Trade | 70 (100.0%) | 0 (0.0%) |
| Retail Trade | 75 (31.2%) | 165 (68.8%) |
| Transportation & Warehousing | 85 (69.1%) | 38 (30.9%) |
| Utilities | 56 (100.0%) | 0 (0.0%) |
| Information | 11 (100.0%) | 0 (0.0%) |
| Finance & Insurance | 14 (16.5%) | 71 (83.5%) |
| Real Estate, Rental & Leasing | 0 (0.0%) | 0 (0.0%) |
| Professional & Scientific | 24 (22.4%) | 83 (77.6%) |
| Enterprise Management | 0 (0.0%) | 0 (0.0%) |
| Administrative & Support | 46 (90.2%) | 5 (9.8%) |
| Educational Services | 32 (16.7%) | 160 (83.3%) |
| Health Care & Social Assistance | 3 (1.2%) | 247 (98.8%) |
| Arts, Entertainment & Recreation | 8 (42.1%) | 11 (57.9%) |
| Accommodation & Food Services | 17 (21.8%) | 61 (78.2%) |
| Public Administration | 53 (58.9%) | 37 (41.1%) |
| Total | 980 (50.9%) | 947 (49.1%) |
Education in Calhoun County
School Enrollment in Calhoun County
The most common levels of schooling among the 1,171 students in Calhoun County are elementary school (516 | 44.1%), high school (245 | 20.9%), and college / undergraduate (188 | 16.1%).

| School Level | # Students | % Students |
| Nursery / Preschool | 35 | 3.0% |
| Kindergarten | 22 | 1.9% |
| Elementary School | 516 | 44.1% |
| Middle School | 137 | 11.7% |
| High School | 245 | 20.9% |
| College / Undergraduate | 188 | 16.1% |
| Graduate / Professional | 28 | 2.4% |
| Total | 1,171 | 100.0% |
School Enrollment by Age by Funding Source in Calhoun County
Out of a total of 1,171 students who are enrolled in schools in Calhoun County, 2 (0.2%) attend a private institution, while the remaining 1,169 (99.8%) are enrolled in public schools. The age group of 18 to 19 year olds has the highest likelihood of being enrolled in private schools, with 2 (1.3% in the age bracket) enrolled. Conversely, the age group of 3 to 4 year olds has the lowest likelihood of being enrolled in a private school, with 20 (100.0% in the age bracket) attending a public institution.

| Age Bracket | Public School | Private School |
| 3 to 4 Year Olds | 20 (100.0%) | 0 (0.0%) |
| 5 to 9 Year Old | 485 (100.0%) | 0 (0.0%) |
| 10 to 14 Year Olds | 219 (100.0%) | 0 (0.0%) |
| 15 to 17 Year Olds | 202 (100.0%) | 0 (0.0%) |
| 18 to 19 Year Olds | 152 (98.7%) | 2 (1.3%) |
| 20 to 24 Year Olds | 18 (100.0%) | 0 (0.0%) |
| 25 to 34 Year Olds | 8 (100.0%) | 0 (0.0%) |
| 35 Years and over | 65 (100.0%) | 0 (0.0%) |
| Total | 1,169 (99.8%) | 2 (0.2%) |
Educational Attainment by Field of Study in Calhoun County
Science & technology (111 | 25.9%), education (111 | 25.9%), business (46 | 10.7%), social sciences (30 | 7.0%), and arts & humanities (24 | 5.6%) are the most common fields of study among 428 individuals in Calhoun County who have obtained a bachelor's degree or higher.

| Field of Study | # Graduates | % Graduates |
| Computers & Mathematics | 0 | 0.0% |
| Bio, Nature & Agricultural | 23 | 5.4% |
| Physical & Health Sciences | 20 | 4.7% |
| Psychology | 22 | 5.1% |
| Social Sciences | 30 | 7.0% |
| Engineering | 7 | 1.6% |
| Multidisciplinary Studies | 10 | 2.3% |
| Science & Technology | 111 | 25.9% |
| Business | 46 | 10.7% |
| Education | 111 | 25.9% |
| Literature & Languages | 0 | 0.0% |
| Liberal Arts & History | 15 | 3.5% |
| Visual & Performing Arts | 9 | 2.1% |
| Communications | 0 | 0.0% |
| Arts & Humanities | 24 | 5.6% |
| Total | 428 | 100.0% |
Transportation & Commute in Calhoun County
Vehicle Availability by Sex in Calhoun County
The most prevalent vehicle ownership categories in Calhoun County are males with 3 vehicles (449, accounting for 45.8%) and females with 3 vehicles (374, making up 55.2%).

| Vehicles Available | Male | Female |
| No Vehicle | 29 (3.0%) | 27 (3.3%) |
| 1 Vehicle | 119 (12.1%) | 183 (22.5%) |
| 2 Vehicles | 305 (31.1%) | 176 (21.6%) |
| 3 Vehicles | 449 (45.8%) | 374 (46.0%) |
| 4 Vehicles | 63 (6.4%) | 51 (6.3%) |
| 5 or more Vehicles | 15 (1.5%) | 3 (0.4%) |
| Total | 980 (100.0%) | 814 (100.0%) |
Commute Time in Calhoun County
The most frequently occuring commute durations in Calhoun County are 5 to 9 minutes (313 commuters, 17.6%), 90 or more minutes (261 commuters, 14.7%), and 20 to 24 minutes (229 commuters, 12.9%).

| Commute Time | # Commuters | % Commuters |
| Less than 5 Minutes | 115 | 6.5% |
| 5 to 9 Minutes | 313 | 17.6% |
| 10 to 14 Minutes | 67 | 3.8% |
| 15 to 19 Minutes | 111 | 6.2% |
| 20 to 24 Minutes | 229 | 12.9% |
| 25 to 29 Minutes | 87 | 4.9% |
| 30 to 34 Minutes | 205 | 11.5% |
| 35 to 39 Minutes | 63 | 3.5% |
| 40 to 44 Minutes | 29 | 1.6% |
| 45 to 59 Minutes | 151 | 8.5% |
| 60 to 89 Minutes | 147 | 8.3% |
| 90 or more Minutes | 261 | 14.7% |
Commute Time by Sex in Calhoun County
The most common commute times in Calhoun County are 90 or more minutes (253 commuters, 26.2%) for males and 5 to 9 minutes (154 commuters, 18.9%) for females.

| Commute Time | Male | Female |
| Less than 5 Minutes | 33 (3.4%) | 82 (10.1%) |
| 5 to 9 Minutes | 159 (16.5%) | 154 (18.9%) |
| 10 to 14 Minutes | 13 (1.3%) | 54 (6.6%) |
| 15 to 19 Minutes | 17 (1.8%) | 94 (11.6%) |
| 20 to 24 Minutes | 95 (9.9%) | 134 (16.5%) |
| 25 to 29 Minutes | 30 (3.1%) | 57 (7.0%) |
| 30 to 34 Minutes | 141 (14.6%) | 64 (7.9%) |
| 35 to 39 Minutes | 48 (5.0%) | 15 (1.8%) |
| 40 to 44 Minutes | 9 (0.9%) | 20 (2.5%) |
| 45 to 59 Minutes | 110 (11.4%) | 41 (5.0%) |
| 60 to 89 Minutes | 56 (5.8%) | 91 (11.2%) |
| 90 or more Minutes | 253 (26.2%) | 8 (1.0%) |
Time of Departure to Work by Sex in Calhoun County
The most frequent times of departure to work in Calhoun County are 6:30 AM to 6:59 AM (201, 20.8%) for males and 7:30 AM to 7:59 AM (227, 27.9%) for females.

| Time of Departure | Male | Female |
| 12:00 AM to 4:59 AM | 68 (7.0%) | 40 (4.9%) |
| 5:00 AM to 5:29 AM | 174 (18.0%) | 33 (4.1%) |
| 5:30 AM to 5:59 AM | 132 (13.7%) | 160 (19.7%) |
| 6:00 AM to 6:29 AM | 43 (4.5%) | 108 (13.3%) |
| 6:30 AM to 6:59 AM | 201 (20.8%) | 102 (12.5%) |
| 7:00 AM to 7:29 AM | 188 (19.5%) | 88 (10.8%) |
| 7:30 AM to 7:59 AM | 86 (8.9%) | 227 (27.9%) |
| 8:00 AM to 8:29 AM | 27 (2.8%) | 8 (1.0%) |
| 8:30 AM to 8:59 AM | 11 (1.1%) | 12 (1.5%) |
| 9:00 AM to 9:59 AM | 2 (0.2%) | 14 (1.7%) |
| 10:00 AM to 10:59 AM | 3 (0.3%) | 10 (1.2%) |
| 11:00 AM to 11:59 AM | 0 (0.0%) | 0 (0.0%) |
| 12:00 PM to 3:59 PM | 12 (1.2%) | 10 (1.2%) |
| 4:00 PM to 11:59 PM | 17 (1.8%) | 2 (0.3%) |
| Total | 964 (100.0%) | 814 (100.0%) |
Housing Occupancy in Calhoun County
Occupancy by Ownership in Calhoun County
Of the total 2,416 dwellings in Calhoun County, owner-occupied units account for 1,888 (78.1%), while renter-occupied units make up 528 (21.8%).

| Occupancy | # Housing Units | % Housing Units |
| Owner Occupied Housing Units | 1,888 | 78.1% |
| Renter-Occupied Housing Units | 528 | 21.8% |
| Total Occupied Housing Units | 2,416 | 100.0% |
Occupancy by Household Size in Calhoun County

| Household Size | # Housing Units | % Housing Units |
| 1-Person Household | 737 | 30.5% |
| 2-Person Household | 952 | 39.4% |
| 3-Person Household | 422 | 17.5% |
| 4+ Person Household | 305 | 12.6% |
| Total Housing Units | 2,416 | 100.0% |
Occupancy by Ownership by Household Size in Calhoun County

| Household Size | Owner-occupied | Renter-occupied |
| 1-Person Household | 486 (65.9%) | 251 (34.1%) |
| 2-Person Household | 897 (94.2%) | 55 (5.8%) |
| 3-Person Household | 348 (82.5%) | 74 (17.5%) |
| 4+ Person Household | 157 (51.5%) | 148 (48.5%) |
| Total Housing Units | 1,888 (78.1%) | 528 (21.8%) |
Occupancy by Educational Attainment in Calhoun County

| Household Size | Owner-occupied | Renter-occupied |
| Less than High School | 219 (75.0%) | 73 (25.0%) |
| High School Diploma | 874 (69.5%) | 384 (30.5%) |
| College/Associate Degree | 662 (95.0%) | 35 (5.0%) |
| Bachelor's Degree or higher | 133 (78.7%) | 36 (21.3%) |
Occupancy by Age of Householder in Calhoun County

| Age Bracket | # Households | % Households |
| Under 35 Years | 193 | 8.0% |
| 35 to 44 Years | 291 | 12.0% |
| 45 to 54 Years | 356 | 14.7% |
| 55 to 64 Years | 508 | 21.0% |
| 65 to 74 Years | 664 | 27.5% |
| 75 to 84 Years | 286 | 11.8% |
| 85 Years and Over | 118 | 4.9% |
| Total | 2,416 | 100.0% |
Housing Finances in Calhoun County
Median Income by Occupancy in Calhoun County

| Occupancy Type | # Households | Median Income |
| Owner-Occupied | 1,888 (78.1%) | $45,647 |
| Renter-Occupied | 528 (21.8%) | $18,340 |
| Average | 2,416 (100.0%) | $39,031 |
Occupancy by Householder Income Bracket in Calhoun County

| Income Bracket | Owner-occupied | Renter-occupied |
| Less than $5,000 | 74 (3.9%) | 82 (15.5%) |
| $5,000 to $9,999 | 3 (0.2%) | 57 (10.8%) |
| $10,000 to $14,999 | 173 (9.2%) | 59 (11.2%) |
| $15,000 to $19,999 | 120 (6.4%) | 147 (27.8%) |
| $20,000 to $24,999 | 152 (8.1%) | 12 (2.3%) |
| $25,000 to $34,999 | 203 (10.7%) | 29 (5.5%) |
| $35,000 to $49,999 | 404 (21.4%) | 30 (5.7%) |
| $50,000 to $74,999 | 380 (20.1%) | 37 (7.0%) |
| $75,000 to $99,999 | 121 (6.4%) | 54 (10.2%) |
| $100,000 to $149,999 | 64 (3.4%) | 0 (0.0%) |
| $150,000 or more | 194 (10.3%) | 21 (4.0%) |
| Total | 1,888 (100.0%) | 528 (100.0%) |
Monthly Housing Cost Tiers in Calhoun County

| Monthly Cost | Owner-occupied | Renter-occupied |
| Less than $300 | 897 (47.5%) | 59 (11.2%) |
| $300 to $499 | 323 (17.1%) | 113 (21.4%) |
| $500 to $799 | 361 (19.1%) | 107 (20.3%) |
| $800 to $999 | 102 (5.4%) | 32 (6.1%) |
| $1,000 to $1,499 | 165 (8.7%) | 25 (4.7%) |
| $1,500 to $1,999 | 40 (2.1%) | 0 (0.0%) |
| $2,000 to $2,499 | 0 (0.0%) | 0 (0.0%) |
| $2,500 to $2,999 | 0 (0.0%) | 0 (0.0%) |
| $3,000 or more | 0 (0.0%) | 0 (0.0%) |
| Total | 1,888 (100.0%) | 528 (100.0%) |
Physical Housing Characteristics in Calhoun County
Housing Structures in Calhoun County

| Structure Type | # Housing Units | % Housing Units |
| Single Unit, Detached | 1,628 | 67.4% |
| Single Unit, Attached | 8 | 0.3% |
| 2 Unit Apartments | 5 | 0.2% |
| 3 or 4 Unit Apartments | 4 | 0.2% |
| 5 to 9 Unit Apartments | 29 | 1.2% |
| 10 or more Apartments | 19 | 0.8% |
| Mobile Home / Other | 723 | 29.9% |
| Total | 2,416 | 100.0% |
Housing Structures by Occupancy in Calhoun County

| Structure Type | Owner-occupied | Renter-occupied |
| Single Unit, Detached | 1,449 (89.0%) | 179 (11.0%) |
| Single Unit, Attached | 8 (100.0%) | 0 (0.0%) |
| 2 Unit Apartments | 0 (0.0%) | 5 (100.0%) |
| 3 or 4 Unit Apartments | 0 (0.0%) | 4 (100.0%) |
| 5 to 9 Unit Apartments | 0 (0.0%) | 29 (100.0%) |
| 10 or more Apartments | 0 (0.0%) | 19 (100.0%) |
| Mobile Home / Other | 431 (59.6%) | 292 (40.4%) |
| Total | 1,888 (78.1%) | 528 (21.8%) |
Housing Structures by Number of Rooms in Calhoun County

| Number of Rooms | Owner-occupied | Renter-occupied |
| 1 Room | 0 (0.0%) | 12 (2.3%) |
| 2 or 3 Rooms | 51 (2.7%) | 38 (7.2%) |
| 4 or 5 Rooms | 688 (36.4%) | 293 (55.5%) |
| 6 or 7 Rooms | 784 (41.5%) | 169 (32.0%) |
| 8 or more Rooms | 365 (19.3%) | 16 (3.0%) |
| Total | 1,888 (100.0%) | 528 (100.0%) |
Housing Structure by Heating Type in Calhoun County

| Heating Type | Owner-occupied | Renter-occupied |
| Utility Gas | 1,346 (71.3%) | 383 (72.5%) |
| Bottled, Tank, or LP Gas | 76 (4.0%) | 7 (1.3%) |
| Electricity | 331 (17.5%) | 132 (25.0%) |
| Fuel Oil or Kerosene | 0 (0.0%) | 0 (0.0%) |
| Coal or Coke | 0 (0.0%) | 0 (0.0%) |
| All other Fuels | 135 (7.1%) | 6 (1.1%) |
| No Fuel Used | 0 (0.0%) | 0 (0.0%) |
| Total | 1,888 (100.0%) | 528 (100.0%) |
Household Vehicle Usage in Calhoun County

| Vehicles per Household | Owner-occupied | Renter-occupied |
| No Vehicle | 112 (5.9%) | 75 (14.2%) |
| 1 Vehicle | 521 (27.6%) | 340 (64.4%) |
| 2 Vehicles | 592 (31.4%) | 57 (10.8%) |
| 3 or more Vehicles | 663 (35.1%) | 56 (10.6%) |
| Total | 1,888 (100.0%) | 528 (100.0%) |
Real Estate & Mortgages in Calhoun County
Real Estate and Mortgage Overview in Calhoun County
| Characteristic | Without Mortgage | With Mortgage |
| Housing Units | 1,215 | 673 |
| Median Property Value | $104,900 | $119,200 |
| Median Household Income | $35,212 | $164 |
| Monthly Housing Costs | $230 | $0 |
| Real Estate Taxes | $364 | $40 |
Property Value by Mortgage Status in Calhoun County

| Property Value | Without Mortgage | With Mortgage |
| Less than $50,000 | 321 (26.4%) | 38 (5.7%) |
| $50,000 to $99,999 | 257 (21.1%) | 211 (31.4%) |
| $100,000 to $299,999 | 612 (50.4%) | 420 (62.4%) |
| $300,000 to $499,999 | 16 (1.3%) | 0 (0.0%) |
| $500,000 to $749,999 | 9 (0.7%) | 0 (0.0%) |
| $750,000 to $999,999 | 0 (0.0%) | 4 (0.6%) |
| $1,000,000 or more | 0 (0.0%) | 0 (0.0%) |
| Total | 1,215 (100.0%) | 673 (100.0%) |
Household Income by Mortgage Status in Calhoun County

| Household Income | Without Mortgage | With Mortgage |
| Less than $10,000 | 73 (6.0%) | 1 (0.2%) |
| $10,000 to $24,999 | 390 (32.1%) | 4 (0.6%) |
| $25,000 to $34,999 | 140 (11.5%) | 55 (8.2%) |
| $35,000 to $49,999 | 295 (24.3%) | 63 (9.4%) |
| $50,000 to $74,999 | 168 (13.8%) | 109 (16.2%) |
| $75,000 to $99,999 | 74 (6.1%) | 212 (31.5%) |
| $100,000 to $149,999 | 45 (3.7%) | 47 (7.0%) |
| $150,000 or more | 30 (2.5%) | 19 (2.8%) |
| Total | 1,215 (100.0%) | 673 (100.0%) |
Property Value to Household Income Ratio in Calhoun County

| Value-to-Income Ratio | Without Mortgage | With Mortgage |
| Less than 2.0x | 426 (35.1%) | 62,520 (9,289.7%) |
| 2.0x to 2.9x | 189 (15.6%) | 385 (57.2%) |
| 3.0x to 3.9x | 156 (12.8%) | 156 (23.2%) |
| 4.0x or more | 388 (31.9%) | 78 (11.6%) |
| Total | 1,215 (100.0%) | 673 (100.0%) |
Real Estate Taxes by Mortgage Status in Calhoun County

| Property Taxes | Without Mortgage | With Mortgage |
| Less than $800 | 929 (76.5%) | 4 (0.6%) |
| $800 to $1,499 | 44 (3.6%) | 363 (53.9%) |
| $800 to $1,499 | 20 (1.7%) | 196 (29.1%) |
| Total | 1,215 (100.0%) | 673 (100.0%) |
Health & Disability in Calhoun County
Health Insurance Coverage by Age in Calhoun County

| Age Bracket | With Coverage | Without Coverage |
| Under 6 Years | 287 (100.0%) | 0 (0.0%) |
| 6 to 18 Years | 915 (90.9%) | 91 (9.0%) |
| 19 to 25 Years | 236 (84.6%) | 43 (15.4%) |
| 26 to 34 Years | 444 (91.2%) | 43 (8.8%) |
| 35 to 44 Years | 588 (69.3%) | 260 (30.7%) |
| 45 to 54 Years | 656 (94.8%) | 36 (5.2%) |
| 55 to 64 Years | 1,007 (91.1%) | 98 (8.9%) |
| 65 to 74 Years | 965 (100.0%) | 0 (0.0%) |
| 75 Years and older | 584 (100.0%) | 0 (0.0%) |
| Total | 5,682 (90.9%) | 571 (9.1%) |
Health Insurance Coverage by Citizenship Status in Calhoun County

| Citizenship Status | With Coverage | Without Coverage |
| Native Born | 287 (100.0%) | 0 (0.0%) |
| Foreign Born, Citizen | 915 (90.9%) | 91 (9.0%) |
| Foreign Born, not a Citizen | 236 (84.6%) | 43 (15.4%) |
Health Insurance Coverage by Household Income in Calhoun County

| Household Income | With Coverage | Without Coverage |
| Under $25,000 | 1,589 (76.3%) | 494 (23.7%) |
| $25,000 to $49,999 | 1,507 (98.1%) | 29 (1.9%) |
| $50,000 to $74,999 | 876 (96.7%) | 30 (3.3%) |
| $75,000 to $99,999 | 788 (99.6%) | 3 (0.4%) |
| $100,000 and over | 922 (98.4%) | 15 (1.6%) |
Public vs Private Health Insurance Coverage by Age in Calhoun County

| Age Bracket | Public Insurance | Private Insurance |
| Under 6 | 173 (60.3%) | 129 (45.0%) |
| 6 to 18 Years | 801 (79.6%) | 144 (14.3%) |
| 19 to 25 Years | 96 (34.4%) | 146 (52.3%) |
| 25 to 34 Years | 105 (21.6%) | 351 (72.1%) |
| 35 to 44 Years | 388 (45.8%) | 281 (33.1%) |
| 45 to 54 Years | 295 (42.6%) | 387 (55.9%) |
| 55 to 64 Years | 548 (49.6%) | 582 (52.7%) |
| 65 to 74 Years | 965 (100.0%) | 496 (51.4%) |
| 75 Years and over | 580 (99.3%) | 362 (62.0%) |
| Total | 3,951 (63.2%) | 2,878 (46.0%) |
Disability Status by Sex by Age in Calhoun County

| Age Bracket | Male | Female |
| Under 5 Years | 0 (0.0%) | 0 (0.0%) |
| 5 to 17 Years | 66 (18.3%) | 87 (15.2%) |
| 18 to 34 Years | 4 (1.0%) | 14 (3.0%) |
| 35 to 64 Years | 363 (26.3%) | 268 (21.2%) |
| 65 to 74 Years | 226 (45.1%) | 155 (33.4%) |
| 75 Years and over | 136 (50.0%) | 189 (60.6%) |
Disability Class by Sex by Age in Calhoun County
Disability Class: Hearing Difficulty
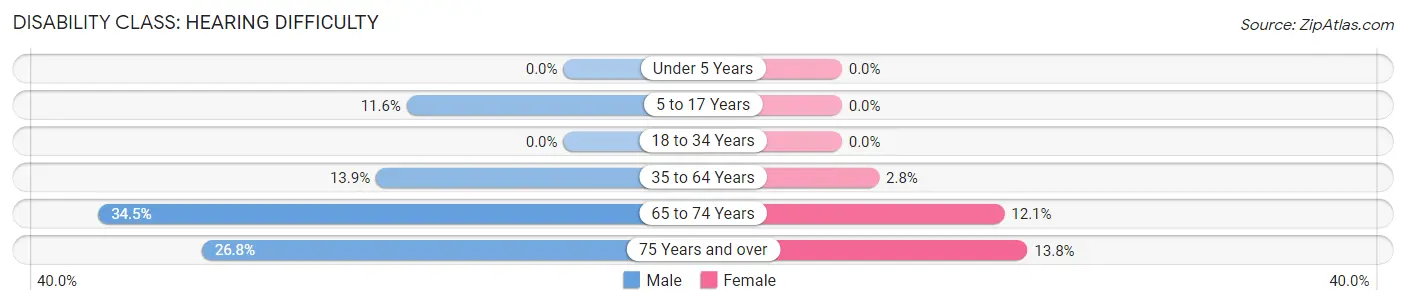
| Age Bracket | Male | Female |
| Under 5 Years | 0 (0.0%) | 0 (0.0%) |
| 5 to 17 Years | 42 (11.6%) | 0 (0.0%) |
| 18 to 34 Years | 0 (0.0%) | 0 (0.0%) |
| 35 to 64 Years | 192 (13.9%) | 35 (2.8%) |
| 65 to 74 Years | 173 (34.5%) | 56 (12.1%) |
| 75 Years and over | 73 (26.8%) | 43 (13.8%) |
Disability Class: Vision Difficulty

| Age Bracket | Male | Female |
| Under 5 Years | 0 (0.0%) | 0 (0.0%) |
| 5 to 17 Years | 1 (0.3%) | 22 (3.8%) |
| 18 to 34 Years | 0 (0.0%) | 0 (0.0%) |
| 35 to 64 Years | 38 (2.8%) | 135 (10.7%) |
| 65 to 74 Years | 73 (14.6%) | 19 (4.1%) |
| 75 Years and over | 33 (12.1%) | 69 (22.1%) |
Disability Class: Cognitive Difficulty

| Age Bracket | Male | Female |
| 5 to 17 Years | 23 (6.4%) | 65 (11.4%) |
| 18 to 34 Years | 0 (0.0%) | 1 (0.2%) |
| 35 to 64 Years | 136 (9.9%) | 43 (3.4%) |
| 65 to 74 Years | 111 (22.2%) | 41 (8.8%) |
| 75 Years and over | 72 (26.5%) | 93 (29.8%) |
Disability Class: Ambulatory Difficulty

| Age Bracket | Male | Female |
| 5 to 17 Years | 0 (0.0%) | 0 (0.0%) |
| 18 to 34 Years | 0 (0.0%) | 13 (2.8%) |
| 35 to 64 Years | 121 (8.8%) | 94 (7.4%) |
| 65 to 74 Years | 94 (18.8%) | 92 (19.8%) |
| 75 Years and over | 73 (26.8%) | 89 (28.5%) |
Disability Class: Self-Care Difficulty

| Age Bracket | Male | Female |
| 5 to 17 Years | 0 (0.0%) | 0 (0.0%) |
| 18 to 34 Years | 4 (1.0%) | 0 (0.0%) |
| 35 to 64 Years | 33 (2.4%) | 44 (3.5%) |
| 65 to 74 Years | 12 (2.4%) | 14 (3.0%) |
| 75 Years and over | 35 (12.9%) | 48 (15.4%) |
Technology Access in Calhoun County
Computing Device Access in Calhoun County

| Device Type | # Households | % Households |
| Desktop or Laptop | 1,590 | 65.8% |
| Smartphone | 1,536 | 63.6% |
| Tablet | 989 | 40.9% |
| No Computing Device | 406 | 16.8% |
| Total | 2,416 | 100.0% |
Internet Access in Calhoun County

| Internet Type | # Households | % Households |
| Dial-Up Internet | 146 | 6.0% |
| Broadband Home | 1,215 | 50.3% |
| Cellular Data Only | 133 | 5.5% |
| Satellite Internet | 338 | 14.0% |
| No Internet | 619 | 25.6% |
| Total | 2,416 | 100.0% |
Calhoun County Summary
Calhoun County, West Virginia is located in the central part of the state, and is bordered by Roane County to the north, Wirt County to the east, Gilmer County to the south, and Jackson County to the west. The county seat is Grantsville, and the county was named for John C. Calhoun, the seventh Vice President of the United States.
Geography
Calhoun County is located in the Appalachian Mountains, and is part of the Appalachian Plateau. The county is mostly mountainous, with the highest point being Big Bend Mountain at an elevation of 2,845 feet. The county is drained by the Little Kanawha River, which flows through the county from north to south. The county is mostly forested, with the majority of the land being used for timber production.
The county has a total area of 437 square miles, of which 435 square miles is land and 2 square miles is water. The county is home to several state parks, including Little Beaver State Park, Cedar Creek State Park, and Stonewall Jackson Lake State Park.
Demographics
As of the 2010 census, the population of Calhoun County was 7,627, making it the second least populous county in West Virginia. The population density was 17.5 people per square mile. The racial makeup of the county was 98.2% White, 0.3% African American, 0.2% Native American, 0.2% Asian, 0.1% from other races, and 0.9% from two or more races. Hispanic or Latino of any race were 0.5% of the population.
The median income for a household in the county was $25,944, and the median income for a family was $31,944. The per capita income for the county was $14,845. About 17.2% of families and 21.2% of the population were below the poverty line, including 28.2% of those under age 18 and 16.2% of those age 65 or over.
Economy
Calhoun County is largely rural, and the economy is largely based on agriculture and timber production. The county is home to several small businesses, including a sawmill, a furniture factory, and a woodworking shop. The county is also home to several small farms, which produce a variety of crops, including corn, soybeans, hay, and wheat.
The county is also home to several tourist attractions, including the Little Beaver State Park, Cedar Creek State Park, and Stonewall Jackson Lake State Park. These parks attract visitors from all over the state and beyond, and provide a boost to the local economy.
Conclusion
Calhoun County, West Virginia is a rural county located in the Appalachian Mountains. The county is mostly mountainous, and is home to several state parks. The population of the county is largely white, and the median income is lower than the state average. The economy of the county is largely based on agriculture and timber production, and the county is home to several small businesses and tourist attractions.
Common Questions
What is the Total Population of Calhoun County?
Total Population of Calhoun County is 6,279.
What is the Total Male Population of Calhoun County?
Total Male Population of Calhoun County is 3,004.
What is the Total Female Population of Calhoun County?
Total Female Population of Calhoun County is 3,275.
What is the Ratio of Males per 100 Females in Calhoun County?
There are 91.73 Males per 100 Females in Calhoun County.
What is the Ratio of Females per 100 Males in Calhoun County?
There are 109.02 Females per 100 Males in Calhoun County.
What is the Median Population Age in Calhoun County?
Median Population Age in Calhoun County is 48.3 Years.
What is the Average Family Size in Calhoun County
Average Family Size in Calhoun County is 3.3 People.
What is the Average Household Size in Calhoun County
Average Household Size in Calhoun County is 2.6 People.
What is Per Capita Income in Calhoun County?
Per Capita income in Calhoun County is $22,982.
What is the Median Family Income in Calhoun County?
Median Family Income in Calhoun County is $47,735.
What is the Median Household income in Calhoun County?
Median Household Income in Calhoun County is $39,031.
What is Income or Wage Gap in Calhoun County?
Income or Wage Gap in Calhoun County is 52.6%.
Women in Calhoun County earn 47.4 cents for every dollar earned by a man.
What is Family Income Deficit in Calhoun County?
Family Income Deficit in Calhoun County is $13,323.
Families that are below poverty line in Calhoun County earn $13,323 less on average than the poverty threshold level.
What is Inequality or Gini Index in Calhoun County?
Inequality or Gini Index in Calhoun County is 0.48.
How Large is the Labor Force in Calhoun County?
There are 2,195 People in the Labor Forcein in Calhoun County.
What is the Percentage of People in the Labor Force in Calhoun County?
42.4% of People are in the Labor Force in Calhoun County.
What is the Unemployment Rate in Calhoun County?
Unemployment Rate in Calhoun County is 12.2%.