Cabell County, WV
Cabell County Map
Cabell County Overview
93,965
TOTAL POPULATION
45,862
MALE POPULATION
48,103
FEMALE POPULATION
95.34
MALES / 100 FEMALES
104.89
FEMALES / 100 MALES
39.1
MEDIAN AGE
3.0
AVG FAMILY SIZE
2.3
AVG HOUSEHOLD SIZE
$30,068
PER CAPITA INCOME
$68,234
AVG FAMILY INCOME
$48,944
AVG HOUSEHOLD INCOME
27.0%
WAGE / INCOME GAP [ % ]
73.0¢/ $1
WAGE / INCOME GAP [ $ ]
$11,873
FAMILY INCOME DEFICIT
0.50
INEQUALITY / GINI INDEX
42,964
LABOR FORCE [ PEOPLE ]
55.5%
PERCENT IN LABOR FORCE
6.1%
UNEMPLOYMENT RATE
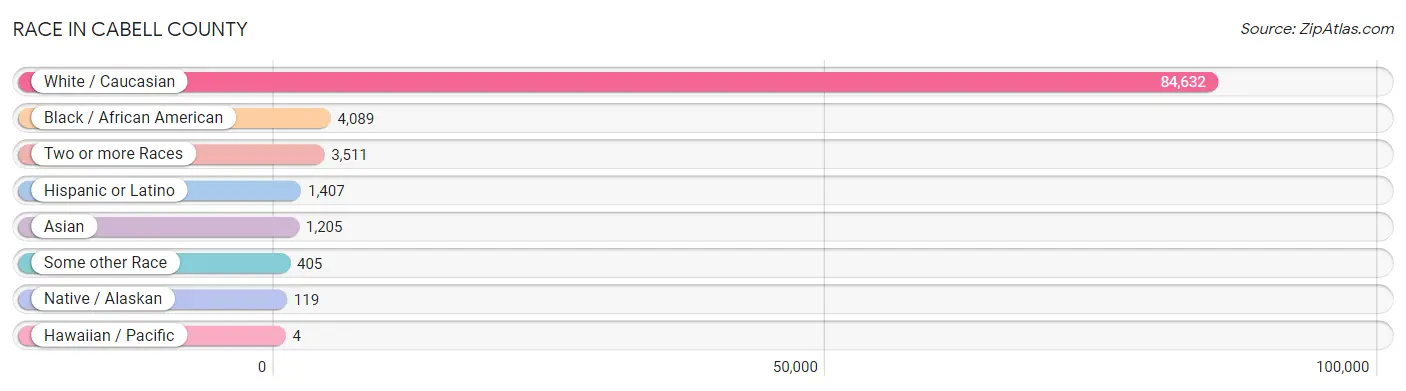
Race in Cabell County
The most populous races in Cabell County are White / Caucasian (84,632 | 90.1%), Black / African American (4,089 | 4.3%), and Two or more Races (3,511 | 3.7%).
| Race | # Population | % Population |
| Asian | 1,205 | 1.3% |
| Black / African American | 4,089 | 4.3% |
| Hawaiian / Pacific | 4 | 0.0% |
| Hispanic or Latino | 1,407 | 1.5% |
| Native / Alaskan | 119 | 0.1% |
| White / Caucasian | 84,632 | 90.1% |
| Two or more Races | 3,511 | 3.7% |
| Some other Race | 405 | 0.4% |
| Total | 93,965 | 100.0% |
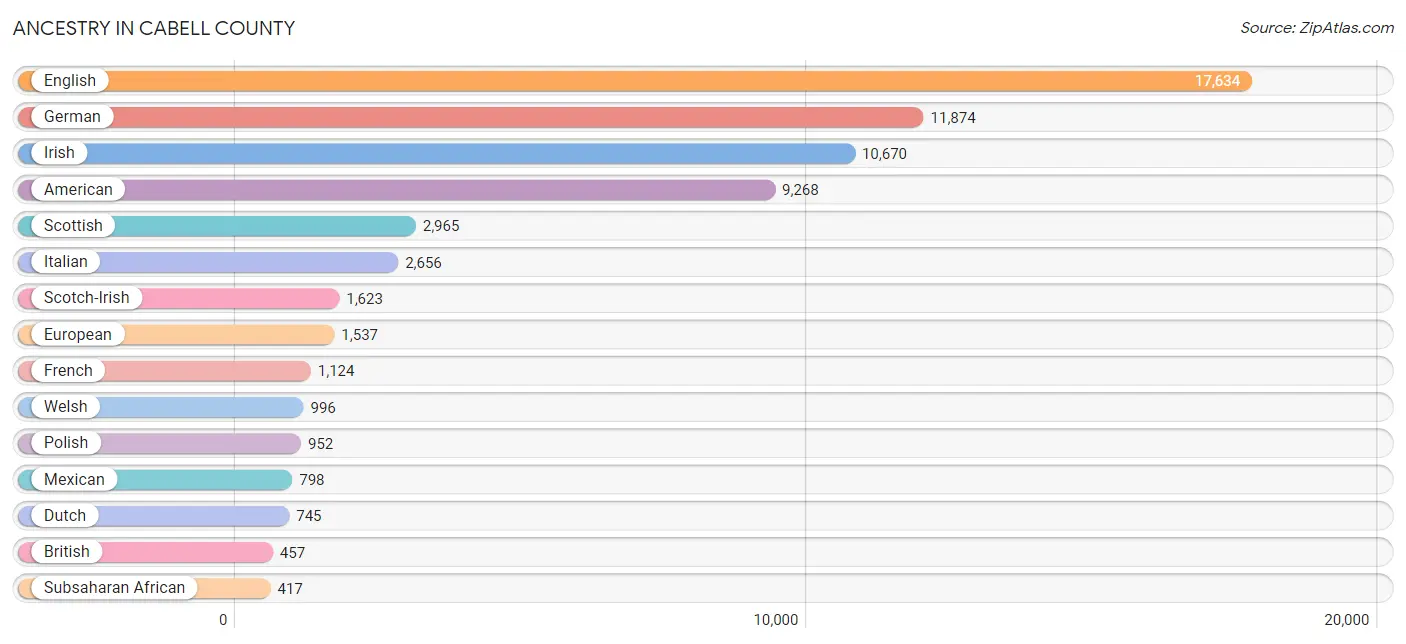
Ancestry in Cabell County
The most populous ancestries reported in Cabell County are English (17,634 | 18.8%), German (11,874 | 12.6%), Irish (10,670 | 11.4%), American (9,268 | 9.9%), and Scottish (2,965 | 3.2%), together accounting for 55.8% of all Cabell County residents.
| Ancestry | # Population | % Population |
| African | 285 | 0.3% |
| American | 9,268 | 9.9% |
| Apache | 12 | 0.0% |
| Arab | 275 | 0.3% |
| Austrian | 48 | 0.1% |
| Basque | 6 | 0.0% |
| Belgian | 24 | 0.0% |
| Belizean | 7 | 0.0% |
| Bhutanese | 125 | 0.1% |
| Blackfeet | 53 | 0.1% |
| Brazilian | 12 | 0.0% |
| British | 457 | 0.5% |
| Burmese | 168 | 0.2% |
| Canadian | 107 | 0.1% |
| Celtic | 73 | 0.1% |
| Central American | 157 | 0.2% |
| Cherokee | 313 | 0.3% |
| Chinese | 26 | 0.0% |
| Chippewa | 21 | 0.0% |
| Choctaw | 23 | 0.0% |
| Croatian | 52 | 0.1% |
| Cuban | 40 | 0.0% |
| Czech | 67 | 0.1% |
| Czechoslovakian | 32 | 0.0% |
| Danish | 55 | 0.1% |
| Dominican | 10 | 0.0% |
| Dutch | 745 | 0.8% |
| Eastern European | 151 | 0.2% |
| English | 17,634 | 18.8% |
| Ethiopian | 86 | 0.1% |
| European | 1,537 | 1.6% |
| Filipino | 27 | 0.0% |
| Finnish | 161 | 0.2% |
| French | 1,124 | 1.2% |
| French Canadian | 21 | 0.0% |
| German | 11,874 | 12.6% |
| German Russian | 2 | 0.0% |
| Ghanaian | 22 | 0.0% |
| Greek | 112 | 0.1% |
| Guamanian / Chamorro | 4 | 0.0% |
| Guatemalan | 14 | 0.0% |
| Haitian | 17 | 0.0% |
| Hungarian | 338 | 0.4% |
| Indian (Asian) | 243 | 0.3% |
| Indonesian | 30 | 0.0% |
| Inupiat | 13 | 0.0% |
| Iranian | 60 | 0.1% |
| Irish | 10,670 | 11.4% |
| Iroquois | 43 | 0.1% |
| Israeli | 19 | 0.0% |
| Italian | 2,656 | 2.8% |
| Jamaican | 63 | 0.1% |
| Jordanian | 25 | 0.0% |
| Korean | 219 | 0.2% |
| Lebanese | 218 | 0.2% |
| Lithuanian | 43 | 0.1% |
| Mexican | 798 | 0.9% |
| Mexican American Indian | 1 | 0.0% |
| Native Hawaiian | 84 | 0.1% |
| Nicaraguan | 23 | 0.0% |
| Nigerian | 10 | 0.0% |
| Northern European | 104 | 0.1% |
| Norwegian | 311 | 0.3% |
| Pakistani | 40 | 0.0% |
| Palestinian | 9 | 0.0% |
| Panamanian | 4 | 0.0% |
| Peruvian | 32 | 0.0% |
| Polish | 952 | 1.0% |
| Portuguese | 51 | 0.1% |
| Puerto Rican | 211 | 0.2% |
| Romanian | 53 | 0.1% |
| Russian | 274 | 0.3% |
| Salvadoran | 116 | 0.1% |
| Scandinavian | 321 | 0.3% |
| Scotch-Irish | 1,623 | 1.7% |
| Scottish | 2,965 | 3.2% |
| Serbian | 27 | 0.0% |
| Sioux | 36 | 0.0% |
| Slovak | 92 | 0.1% |
| Slovene | 12 | 0.0% |
| South American | 52 | 0.1% |
| Spaniard | 47 | 0.1% |
| Spanish | 37 | 0.0% |
| Sri Lankan | 78 | 0.1% |
| Subsaharan African | 417 | 0.4% |
| Swedish | 213 | 0.2% |
| Swiss | 132 | 0.1% |
| Syrian | 57 | 0.1% |
| Thai | 373 | 0.4% |
| Trinidadian and Tobagonian | 16 | 0.0% |
| Turkish | 8 | 0.0% |
| Ukrainian | 140 | 0.2% |
| Venezuelan | 20 | 0.0% |
| Vietnamese | 29 | 0.0% |
| Welsh | 996 | 1.1% |
| West Indian | 12 | 0.0% |
| Yugoslavian | 8 | 0.0% | View All 97 Rows |
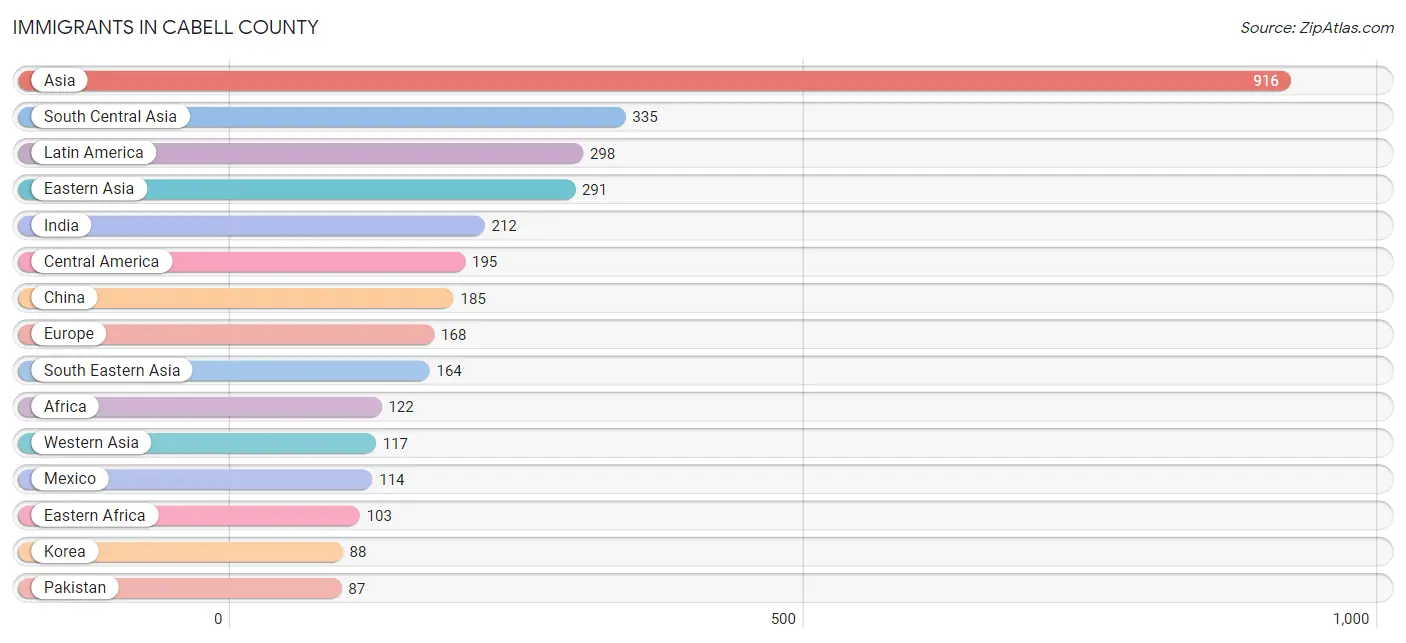
Immigrants in Cabell County
The most numerous immigrant groups reported in Cabell County came from Asia (916 | 1.0%), South Central Asia (335 | 0.4%), Latin America (298 | 0.3%), Eastern Asia (291 | 0.3%), and India (212 | 0.2%), together accounting for 2.2% of all Cabell County residents.
| Immigration Origin | # Population | % Population |
| Africa | 122 | 0.1% |
| Asia | 916 | 1.0% |
| Bangladesh | 20 | 0.0% |
| Brazil | 12 | 0.0% |
| Canada | 18 | 0.0% |
| Caribbean | 76 | 0.1% |
| Central America | 195 | 0.2% |
| China | 185 | 0.2% |
| Croatia | 10 | 0.0% |
| Cuba | 7 | 0.0% |
| Eastern Africa | 103 | 0.1% |
| Eastern Asia | 291 | 0.3% |
| Eastern Europe | 10 | 0.0% |
| El Salvador | 22 | 0.0% |
| Ethiopia | 86 | 0.1% |
| Europe | 168 | 0.2% |
| France | 16 | 0.0% |
| Germany | 34 | 0.0% |
| Guatemala | 10 | 0.0% |
| India | 212 | 0.2% |
| Iran | 16 | 0.0% |
| Israel | 19 | 0.0% |
| Italy | 7 | 0.0% |
| Jamaica | 53 | 0.1% |
| Japan | 18 | 0.0% |
| Jordan | 3 | 0.0% |
| Korea | 88 | 0.1% |
| Kuwait | 4 | 0.0% |
| Latin America | 298 | 0.3% |
| Lebanon | 17 | 0.0% |
| Mexico | 114 | 0.1% |
| Netherlands | 5 | 0.0% |
| Nicaragua | 9 | 0.0% |
| Nigeria | 9 | 0.0% |
| Northern Europe | 63 | 0.1% |
| Oceania | 34 | 0.0% |
| Pakistan | 87 | 0.1% |
| Panama | 40 | 0.0% |
| Peru | 5 | 0.0% |
| Philippines | 43 | 0.1% |
| Portugal | 8 | 0.0% |
| Scotland | 17 | 0.0% |
| South America | 27 | 0.0% |
| South Central Asia | 335 | 0.4% |
| South Eastern Asia | 164 | 0.2% |
| Southern Europe | 29 | 0.0% |
| Spain | 14 | 0.0% |
| Sweden | 9 | 0.0% |
| Switzerland | 11 | 0.0% |
| Syria | 74 | 0.1% |
| Taiwan | 79 | 0.1% |
| Thailand | 26 | 0.0% |
| Trinidad and Tobago | 16 | 0.0% |
| Uganda | 17 | 0.0% |
| Venezuela | 10 | 0.0% |
| Vietnam | 65 | 0.1% |
| Western Africa | 19 | 0.0% |
| Western Asia | 117 | 0.1% |
| Western Europe | 66 | 0.1% | View All 59 Rows |
Sex and Age in Cabell County
Sex and Age in Cabell County
The most populous age groups in Cabell County are 20 to 24 Years (4,509 | 9.8%) for men and 20 to 24 Years (4,929 | 10.2%) for women.
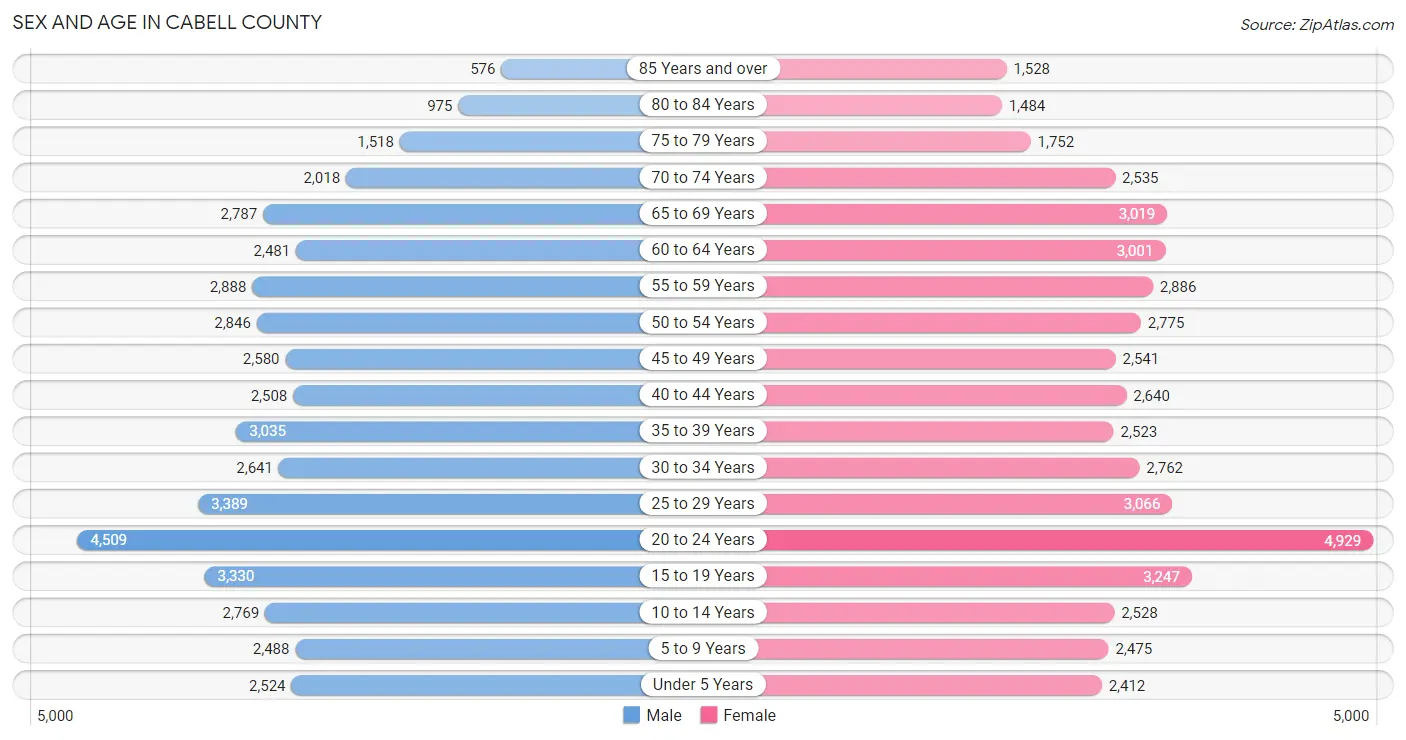
| Age Bracket | Male | Female |
| Under 5 Years | 2,524 (5.5%) | 2,412 (5.0%) |
| 5 to 9 Years | 2,488 (5.4%) | 2,475 (5.1%) |
| 10 to 14 Years | 2,769 (6.0%) | 2,528 (5.3%) |
| 15 to 19 Years | 3,330 (7.3%) | 3,247 (6.8%) |
| 20 to 24 Years | 4,509 (9.8%) | 4,929 (10.2%) |
| 25 to 29 Years | 3,389 (7.4%) | 3,066 (6.4%) |
| 30 to 34 Years | 2,641 (5.8%) | 2,762 (5.7%) |
| 35 to 39 Years | 3,035 (6.6%) | 2,523 (5.2%) |
| 40 to 44 Years | 2,508 (5.5%) | 2,640 (5.5%) |
| 45 to 49 Years | 2,580 (5.6%) | 2,541 (5.3%) |
| 50 to 54 Years | 2,846 (6.2%) | 2,775 (5.8%) |
| 55 to 59 Years | 2,888 (6.3%) | 2,886 (6.0%) |
| 60 to 64 Years | 2,481 (5.4%) | 3,001 (6.2%) |
| 65 to 69 Years | 2,787 (6.1%) | 3,019 (6.3%) |
| 70 to 74 Years | 2,018 (4.4%) | 2,535 (5.3%) |
| 75 to 79 Years | 1,518 (3.3%) | 1,752 (3.6%) |
| 80 to 84 Years | 975 (2.1%) | 1,484 (3.1%) |
| 85 Years and over | 576 (1.3%) | 1,528 (3.2%) |
| Total | 45,862 (100.0%) | 48,103 (100.0%) |
Families and Households in Cabell County
Median Family Size in Cabell County
The median family size in Cabell County is 3.05 persons per family, with married-couple families (15,592 | 72.3%) accounting for the largest median family size of 3.06 persons per family. On the other hand, single female/mother families (4,560 | 21.1%) represent the smallest median family size with 3.02 persons per family.

| Family Type | # Families | Family Size |
| Married-Couple | 15,592 (72.3%) | 3.06 |
| Single Male/Father | 1,421 (6.6%) | 3.06 |
| Single Female/Mother | 4,560 (21.1%) | 3.02 |
| Total Families | 21,573 (100.0%) | 3.05 |
Median Household Size in Cabell County
The median household size in Cabell County is 2.31 persons per household, with single male/father households (1,421 | 3.7%) accounting for the largest median household size of 3.34 persons per household. non-family households (17,281 | 44.5%) represent the smallest median household size with 1.26 persons per household.
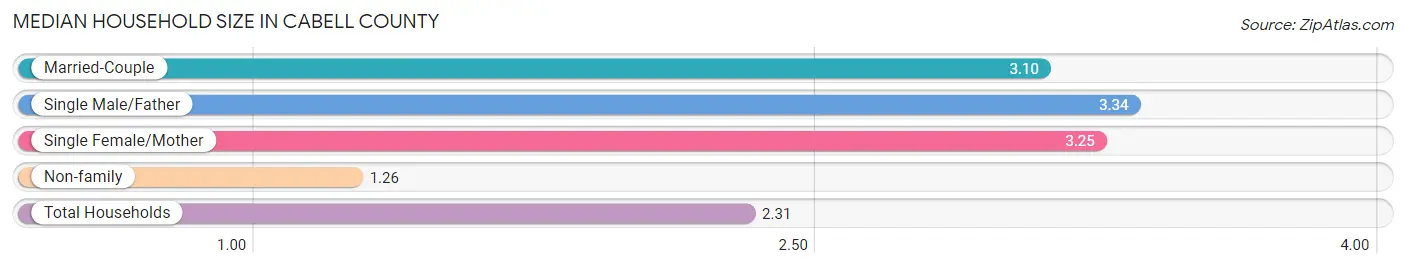
| Household Type | # Households | Household Size |
| Married-Couple | 15,592 (40.1%) | 3.10 |
| Single Male/Father | 1,421 (3.7%) | 3.34 |
| Single Female/Mother | 4,560 (11.7%) | 3.25 |
| Non-family | 17,281 (44.5%) | 1.26 |
| Total Households | 38,854 (100.0%) | 2.31 |
Household Size by Marriage Status in Cabell County
Out of a total of 38,854 households in Cabell County, 21,573 (55.5%) are family households, while 17,281 (44.5%) are nonfamily households. The most numerous type of family households are 2-person households, comprising 10,986, and the most common type of nonfamily households are 1-person households, comprising 14,403.
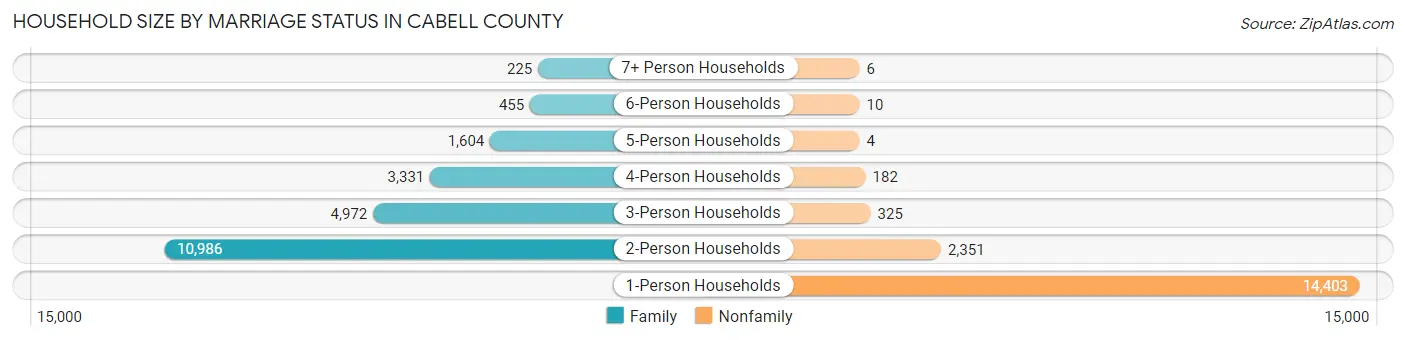
| Household Size | Family Households | Nonfamily Households |
| 1-Person Households | - | 14,403 (37.1%) |
| 2-Person Households | 10,986 (28.3%) | 2,351 (6.0%) |
| 3-Person Households | 4,972 (12.8%) | 325 (0.8%) |
| 4-Person Households | 3,331 (8.6%) | 182 (0.5%) |
| 5-Person Households | 1,604 (4.1%) | 4 (0.0%) |
| 6-Person Households | 455 (1.2%) | 10 (0.0%) |
| 7+ Person Households | 225 (0.6%) | 6 (0.0%) |
| Total | 21,573 (55.5%) | 17,281 (44.5%) |
Female Fertility in Cabell County
Fertility by Age in Cabell County
Average fertility rate in Cabell County is 34.0 births per 1,000 women. Women in the age bracket of 20 to 34 years have the highest fertility rate with 58.0 births per 1,000 women. Women in the age bracket of 20 to 34 years acount for 82.1% of all women with births.
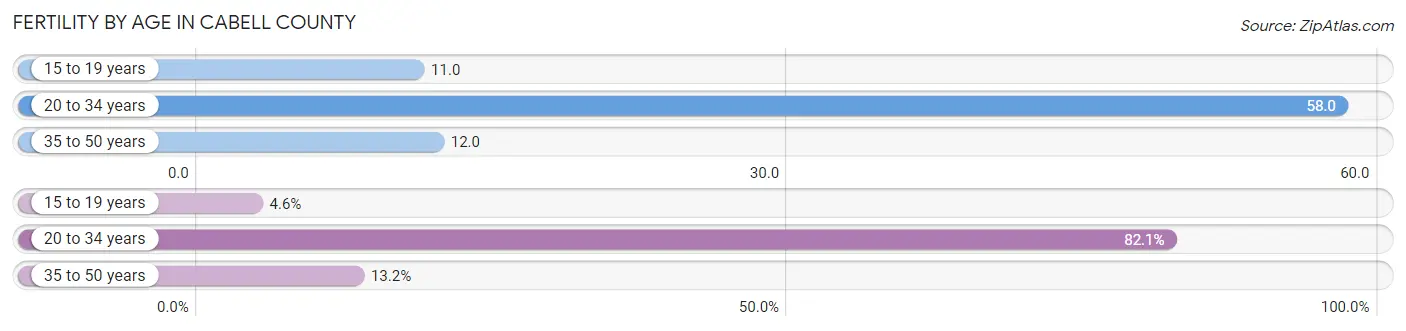
| Age Bracket | Women with Births | Births / 1,000 Women |
| 15 to 19 years | 35 (4.6%) | 11.0 |
| 20 to 34 years | 621 (82.1%) | 58.0 |
| 35 to 50 years | 100 (13.2%) | 12.0 |
| Total | 756 (100.0%) | 34.0 |
Fertility by Age by Marriage Status in Cabell County
74.1% of women with births (756) in Cabell County are married. The highest percentage of unmarried women with births falls into 15 to 19 years age bracket with 71.4% of them unmarried at the time of birth, while the lowest percentage of unmarried women with births belong to 35 to 50 years age bracket with 0.0% of them unmarried.
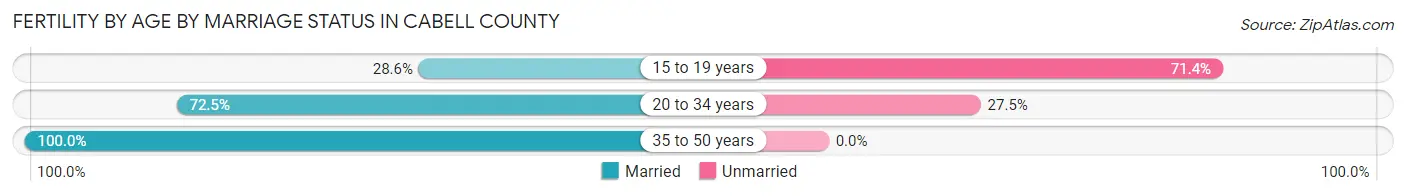
| Age Bracket | Married | Unmarried |
| 15 to 19 years | 10 (28.6%) | 25 (71.4%) |
| 20 to 34 years | 450 (72.5%) | 171 (27.5%) |
| 35 to 50 years | 100 (100.0%) | 0 (0.0%) |
| Total | 560 (74.1%) | 196 (25.9%) |
Fertility by Education in Cabell County
Average fertility rate in Cabell County is 34.0 births per 1,000 women. Women with the education attainment of bachelor's degree have the highest fertility rate of 48.0 births per 1,000 women, while women with the education attainment of high school diploma have the lowest fertility at 27.0 births per 1,000 women. Women with the education attainment of college or associate's degree represent 34.0% of all women with births.
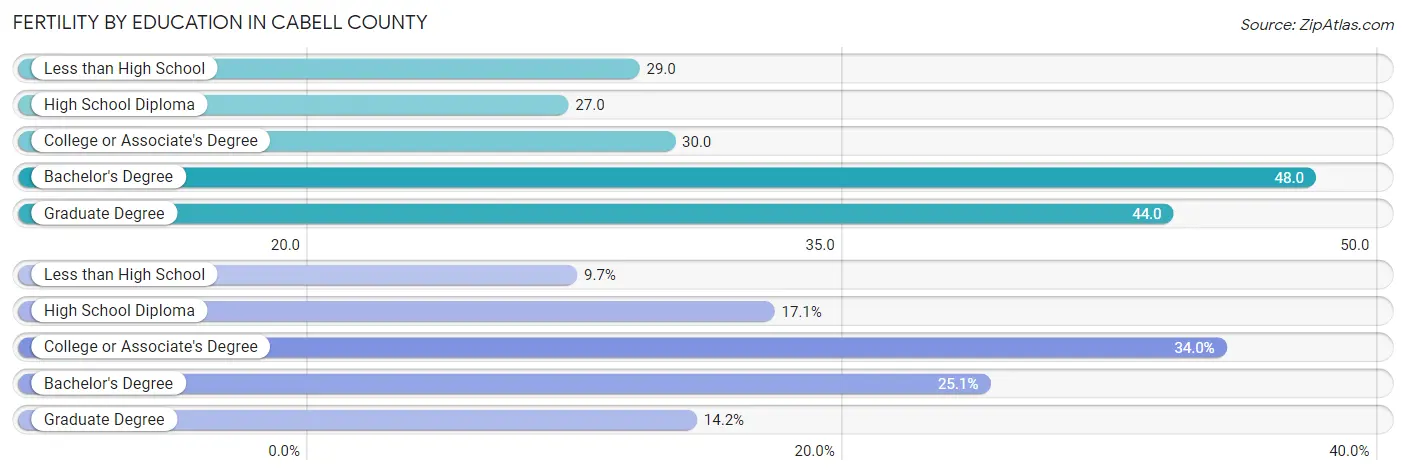
| Educational Attainment | Women with Births | Births / 1,000 Women |
| Less than High School | 73 (9.7%) | 29.0 |
| High School Diploma | 129 (17.1%) | 27.0 |
| College or Associate's Degree | 257 (34.0%) | 30.0 |
| Bachelor's Degree | 190 (25.1%) | 48.0 |
| Graduate Degree | 107 (14.1%) | 44.0 |
| Total | 756 (100.0%) | 34.0 |
Fertility by Education by Marriage Status in Cabell County
25.9% of women with births in Cabell County are unmarried. Women with the educational attainment of graduate degree are most likely to be married with 100.0% of them married at childbirth, while women with the educational attainment of high school diploma are least likely to be married with 48.8% of them unmarried at childbirth.
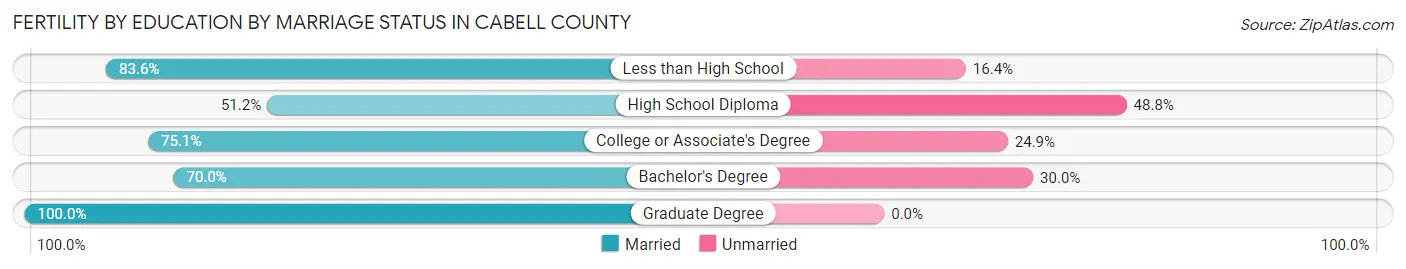
| Educational Attainment | Married | Unmarried |
| Less than High School | 61 (83.6%) | 12 (16.4%) |
| High School Diploma | 66 (51.2%) | 63 (48.8%) |
| College or Associate's Degree | 193 (75.1%) | 64 (24.9%) |
| Bachelor's Degree | 133 (70.0%) | 57 (30.0%) |
| Graduate Degree | 107 (100.0%) | 0 (0.0%) |
| Total | 560 (74.1%) | 196 (25.9%) |
Income in Cabell County
Income Overview in Cabell County
Per Capita Income in Cabell County is $30,068, while median incomes of families and households are $68,234 and $48,944 respectively.
| Characteristic | Number | Measure |
| Per Capita Income | 93,965 | $30,068 |
| Median Family Income | 21,573 | $68,234 |
| Mean Family Income | 21,573 | $91,447 |
| Median Household Income | 38,854 | $48,944 |
| Mean Household Income | 38,854 | $70,233 |
| Income Deficit | 21,573 | $11,873 |
| Wage / Income Gap (%) | 93,965 | 26.96% |
| Wage / Income Gap ($) | 93,965 | 73.04¢ per $1 |
| Gini / Inequality Index | 93,965 | 0.50 |
Earnings by Sex in Cabell County
Average Earnings in Cabell County are $31,142, $36,747 for men and $26,839 for women, a difference of 27.0%.
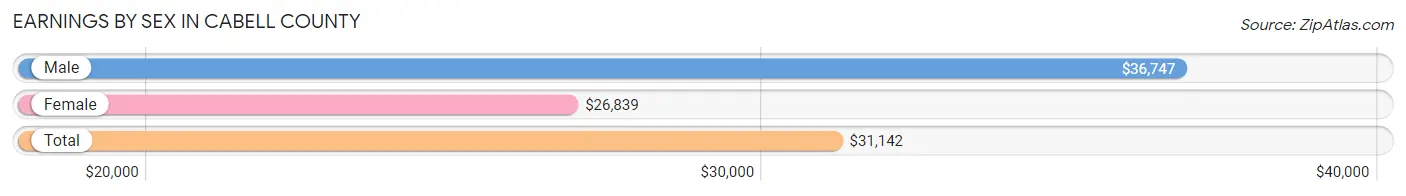
| Sex | Number | Average Earnings |
| Male | 22,459 (50.3%) | $36,747 |
| Female | 22,153 (49.7%) | $26,839 |
| Total | 44,612 (100.0%) | $31,142 |
Earnings by Sex by Income Bracket in Cabell County
The most common earnings brackets in Cabell County are $100,000+ for men (2,684 | 11.9%) and $25,000 to $29,999 for women (1,906 | 8.6%).
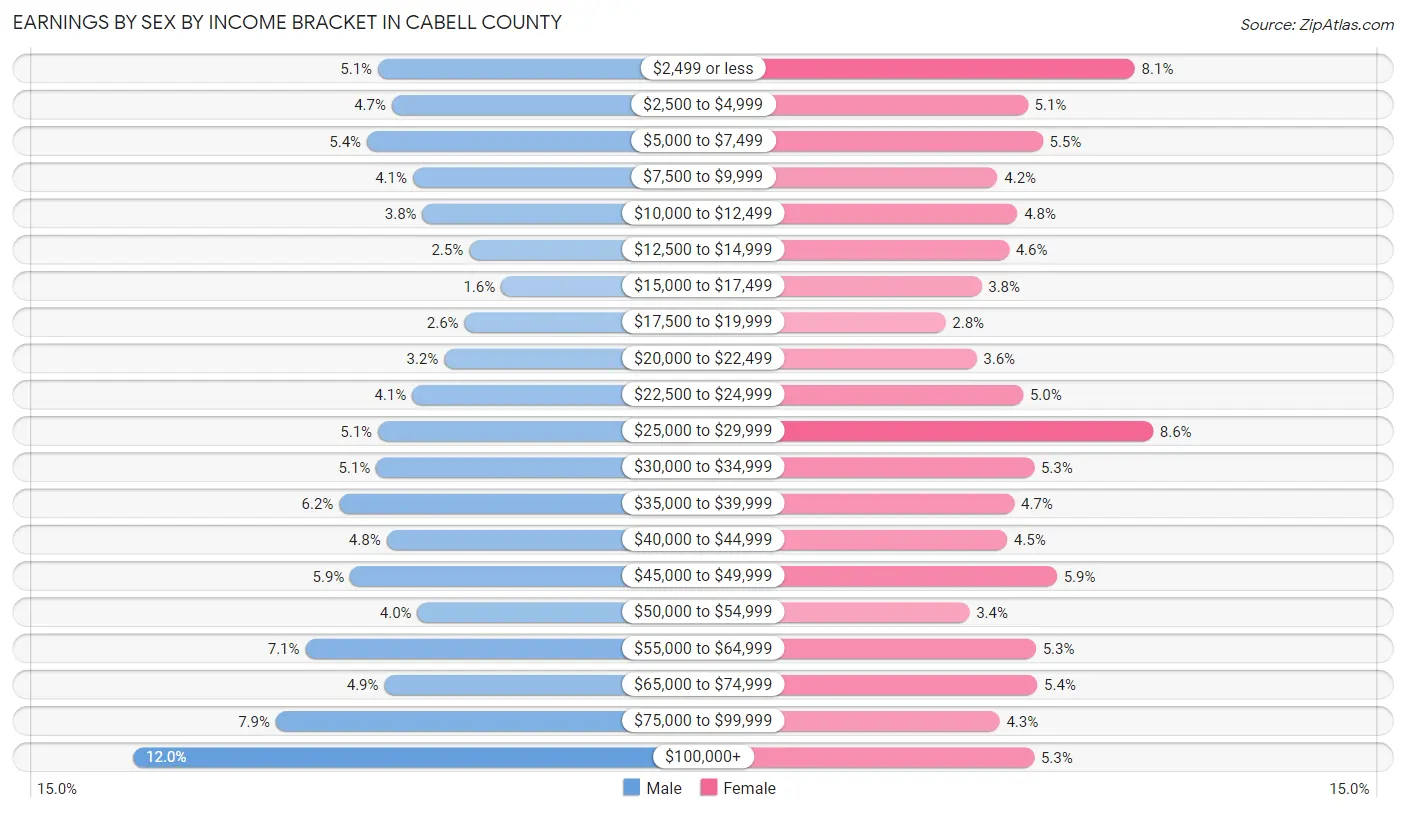
| Income | Male | Female |
| $2,499 or less | 1,139 (5.1%) | 1,793 (8.1%) |
| $2,500 to $4,999 | 1,050 (4.7%) | 1,125 (5.1%) |
| $5,000 to $7,499 | 1,208 (5.4%) | 1,218 (5.5%) |
| $7,500 to $9,999 | 918 (4.1%) | 938 (4.2%) |
| $10,000 to $12,499 | 858 (3.8%) | 1,062 (4.8%) |
| $12,500 to $14,999 | 563 (2.5%) | 1,008 (4.5%) |
| $15,000 to $17,499 | 362 (1.6%) | 838 (3.8%) |
| $17,500 to $19,999 | 592 (2.6%) | 613 (2.8%) |
| $20,000 to $22,499 | 722 (3.2%) | 806 (3.6%) |
| $22,500 to $24,999 | 924 (4.1%) | 1,096 (5.0%) |
| $25,000 to $29,999 | 1,138 (5.1%) | 1,906 (8.6%) |
| $30,000 to $34,999 | 1,151 (5.1%) | 1,165 (5.3%) |
| $35,000 to $39,999 | 1,383 (6.2%) | 1,042 (4.7%) |
| $40,000 to $44,999 | 1,084 (4.8%) | 996 (4.5%) |
| $45,000 to $49,999 | 1,314 (5.9%) | 1,306 (5.9%) |
| $50,000 to $54,999 | 890 (4.0%) | 761 (3.4%) |
| $55,000 to $64,999 | 1,597 (7.1%) | 1,177 (5.3%) |
| $65,000 to $74,999 | 1,099 (4.9%) | 1,186 (5.3%) |
| $75,000 to $99,999 | 1,783 (7.9%) | 951 (4.3%) |
| $100,000+ | 2,684 (11.9%) | 1,166 (5.3%) |
| Total | 22,459 (100.0%) | 22,153 (100.0%) |
Earnings by Sex by Educational Attainment in Cabell County
Average earnings in Cabell County are $45,551 for men and $34,564 for women, a difference of 24.1%. Men with an educational attainment of graduate degree enjoy the highest average annual earnings of $60,029, while those with less than high school education earn the least with $28,596. Women with an educational attainment of graduate degree earn the most with the average annual earnings of $61,642, while those with less than high school education have the smallest earnings of $13,854.
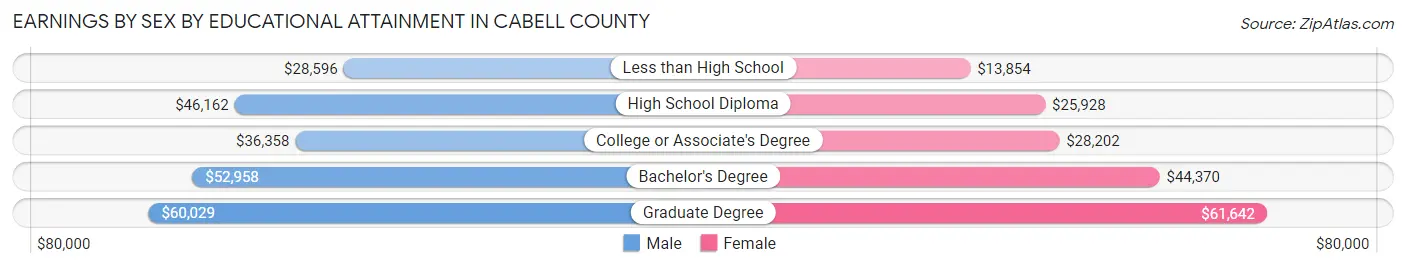
| Educational Attainment | Male Income | Female Income |
| Less than High School | $28,596 | $13,854 |
| High School Diploma | $46,162 | $25,928 |
| College or Associate's Degree | $36,358 | $28,202 |
| Bachelor's Degree | $52,958 | $44,370 |
| Graduate Degree | $60,029 | $61,642 |
| Total | $45,551 | $34,564 |
Family Income in Cabell County
Family Income Brackets in Cabell County
According to the Cabell County family income data, there are 4,250 families falling into the $50,000 to $74,999 income range, which is the most common income bracket and makes up 19.7% of all families. Conversely, the $10,000 to $14,999 income bracket is the least frequent group with only 712 families (3.3%) belonging to this category.
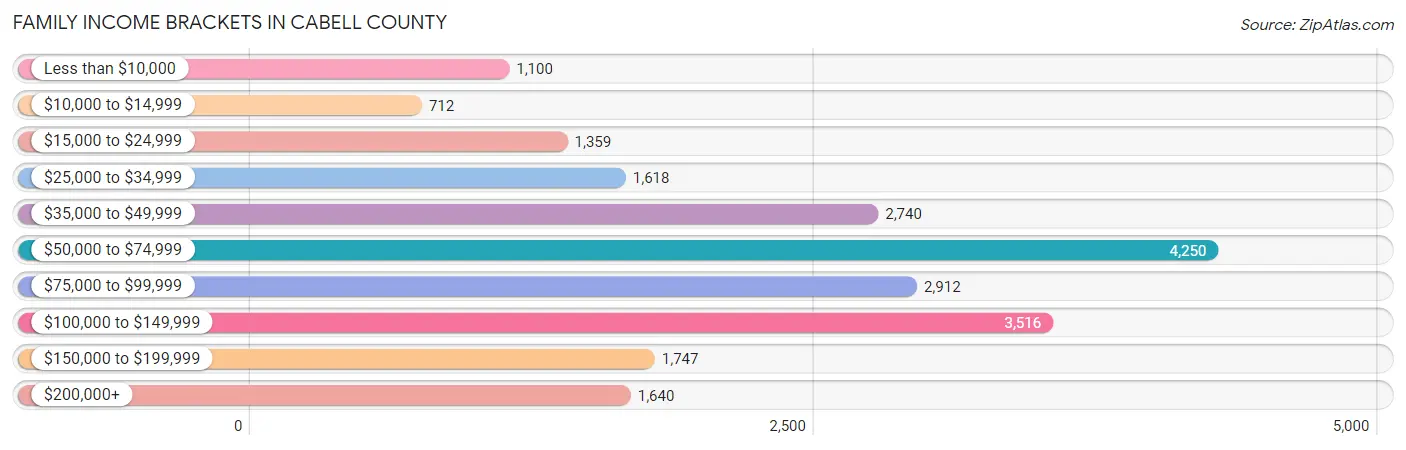
| Income Bracket | # Families | % Families |
| Less than $10,000 | 1,100 | 5.1% |
| $10,000 to $14,999 | 712 | 3.3% |
| $15,000 to $24,999 | 1,359 | 6.3% |
| $25,000 to $34,999 | 1,618 | 7.5% |
| $35,000 to $49,999 | 2,740 | 12.7% |
| $50,000 to $74,999 | 4,250 | 19.7% |
| $75,000 to $99,999 | 2,912 | 13.5% |
| $100,000 to $149,999 | 3,516 | 16.3% |
| $150,000 to $199,999 | 1,747 | 8.1% |
| $200,000+ | 1,640 | 7.6% |
Family Income by Famaliy Size in Cabell County
5-person families (1,230 | 5.7%) account for the highest median family income in Cabell County with $106,786 per family, while 2-person families (11,744 | 54.4%) have the highest median income of $30,416 per family member.
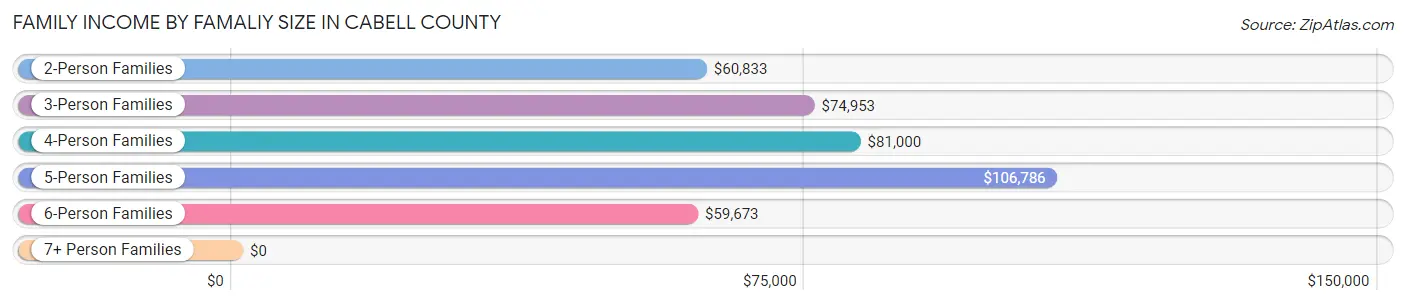
| Income Bracket | # Families | Median Income |
| 2-Person Families | 11,744 (54.4%) | $60,833 |
| 3-Person Families | 4,667 (21.6%) | $74,953 |
| 4-Person Families | 3,378 (15.7%) | $81,000 |
| 5-Person Families | 1,230 (5.7%) | $106,786 |
| 6-Person Families | 413 (1.9%) | $59,673 |
| 7+ Person Families | 141 (0.6%) | $0 |
| Total | 21,573 (100.0%) | $68,234 |
Family Income by Number of Earners in Cabell County
The median family income in Cabell County is $68,234, with families comprising 3+ earners (1,130) having the highest median family income of $123,807, while families with no earners (4,963) have the lowest median family income of $38,241, accounting for 5.2% and 23.0% of families, respectively.
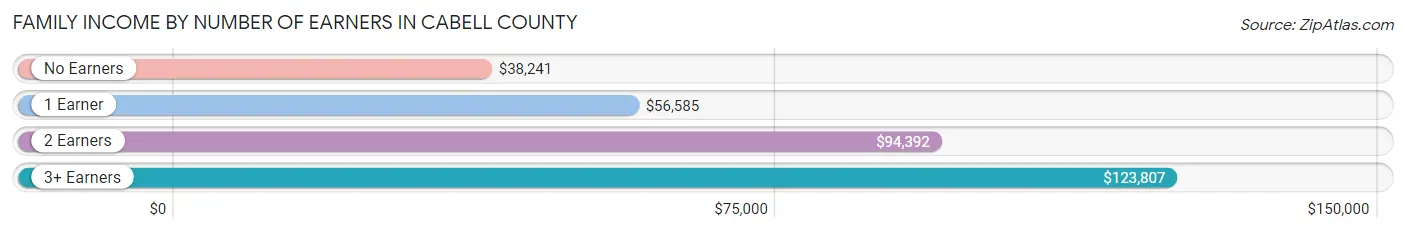
| Number of Earners | # Families | Median Income |
| No Earners | 4,963 (23.0%) | $38,241 |
| 1 Earner | 7,368 (34.2%) | $56,585 |
| 2 Earners | 8,112 (37.6%) | $94,392 |
| 3+ Earners | 1,130 (5.2%) | $123,807 |
| Total | 21,573 (100.0%) | $68,234 |
Household Income in Cabell County
Household Income Brackets in Cabell County
With 6,916 households falling in the category, the $50,000 to $74,999 income range is the most frequent in Cabell County, accounting for 17.8% of all households. In contrast, only 1,904 households (4.9%) fall into the $150,000 to $199,999 income bracket, making it the least populous group.
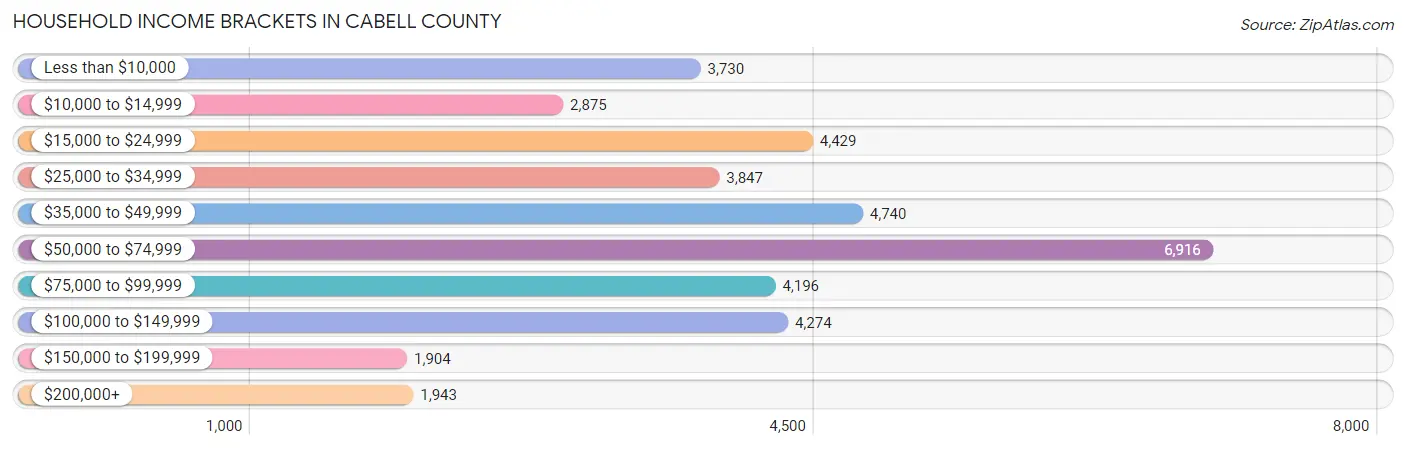
| Income Bracket | # Households | % Households |
| Less than $10,000 | 3,730 | 9.6% |
| $10,000 to $14,999 | 2,875 | 7.4% |
| $15,000 to $24,999 | 4,429 | 11.4% |
| $25,000 to $34,999 | 3,847 | 9.9% |
| $35,000 to $49,999 | 4,740 | 12.2% |
| $50,000 to $74,999 | 6,916 | 17.8% |
| $75,000 to $99,999 | 4,196 | 10.8% |
| $100,000 to $149,999 | 4,274 | 11.0% |
| $150,000 to $199,999 | 1,904 | 4.9% |
| $200,000+ | 1,943 | 5.0% |
Household Income by Householder Age in Cabell County
The median household income in Cabell County is $48,944, with the highest median household income of $56,935 found in the 45 to 64 years age bracket for the primary householder. A total of 12,933 households (33.3%) fall into this category. Meanwhile, the 15 to 24 years age bracket for the primary householder has the lowest median household income of $18,993, with 2,926 households (7.5%) in this group.
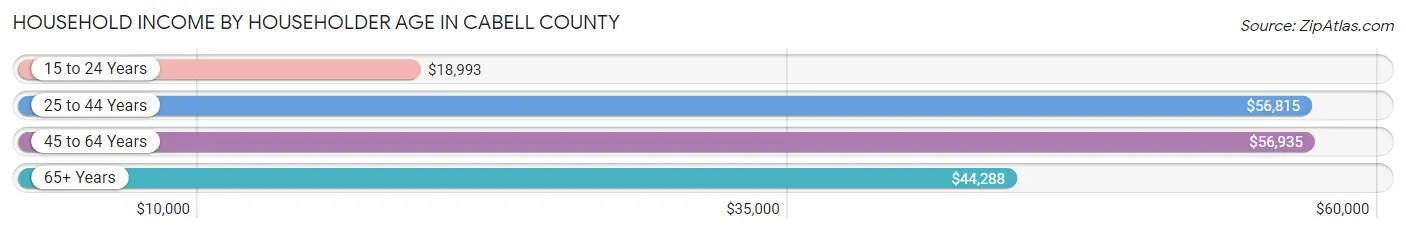
| Income Bracket | # Households | Median Income |
| 15 to 24 Years | 2,926 (7.5%) | $18,993 |
| 25 to 44 Years | 11,623 (29.9%) | $56,815 |
| 45 to 64 Years | 12,933 (33.3%) | $56,935 |
| 65+ Years | 11,372 (29.3%) | $44,288 |
| Total | 38,854 (100.0%) | $48,944 |
Poverty in Cabell County
Income Below Poverty by Sex and Age in Cabell County
With 18.8% poverty level for males and 21.3% for females among the residents of Cabell County, 18 to 24 year old males and 18 to 24 year old females are the most vulnerable to poverty, with 1,810 males (34.7%) and 2,111 females (39.6%) in their respective age groups living below the poverty level.
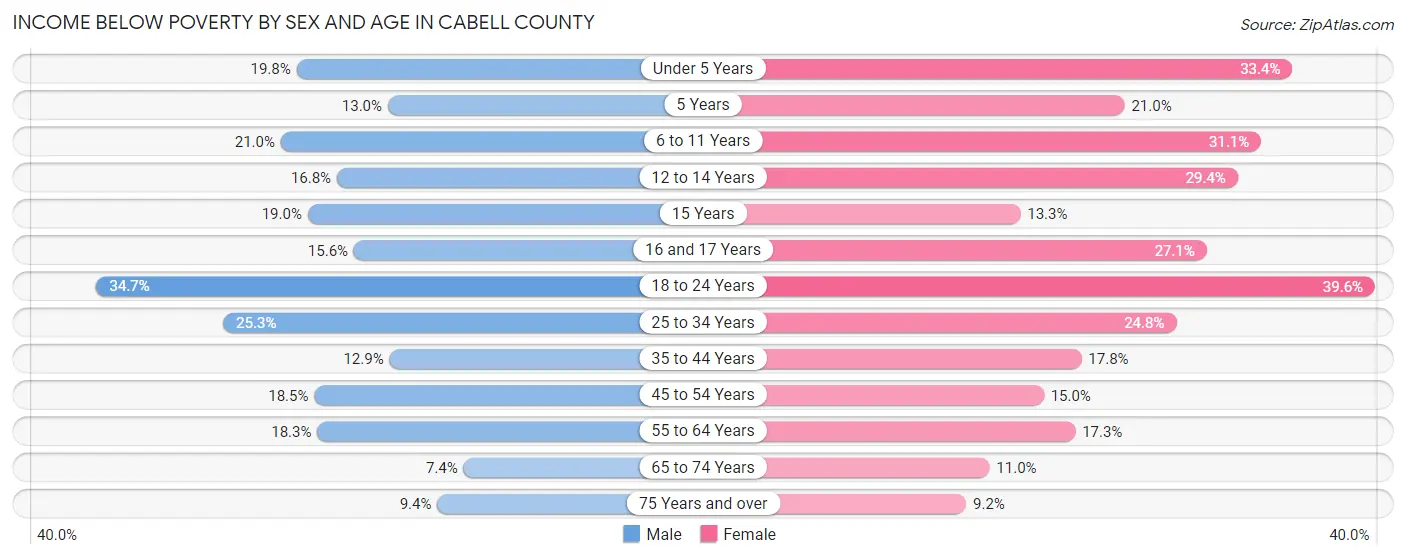
| Age Bracket | Male | Female |
| Under 5 Years | 486 (19.8%) | 799 (33.4%) |
| 5 Years | 104 (13.0%) | 98 (21.0%) |
| 6 to 11 Years | 596 (21.0%) | 941 (31.1%) |
| 12 to 14 Years | 255 (16.8%) | 408 (29.4%) |
| 15 Years | 126 (19.0%) | 91 (13.3%) |
| 16 and 17 Years | 164 (15.5%) | 201 (27.1%) |
| 18 to 24 Years | 1,810 (34.7%) | 2,111 (39.6%) |
| 25 to 34 Years | 1,460 (25.3%) | 1,434 (24.8%) |
| 35 to 44 Years | 687 (12.9%) | 908 (17.8%) |
| 45 to 54 Years | 981 (18.5%) | 797 (15.0%) |
| 55 to 64 Years | 964 (18.3%) | 1,012 (17.3%) |
| 65 to 74 Years | 347 (7.4%) | 603 (11.0%) |
| 75 Years and over | 271 (9.4%) | 409 (9.2%) |
| Total | 8,251 (18.8%) | 9,812 (21.3%) |
Income Above Poverty by Sex and Age in Cabell County
According to the poverty statistics in Cabell County, males aged 65 to 74 years and females aged 75 years and over are the age groups that are most secure financially, with 92.6% of males and 90.8% of females in these age groups living above the poverty line.
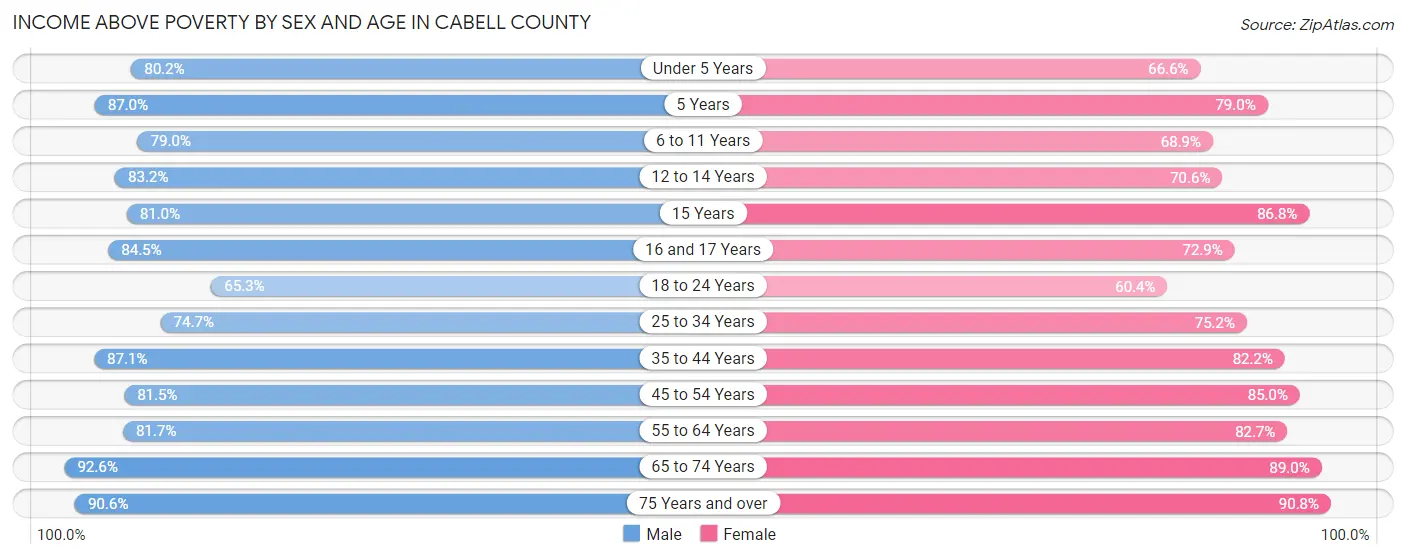
| Age Bracket | Male | Female |
| Under 5 Years | 1,967 (80.2%) | 1,590 (66.6%) |
| 5 Years | 694 (87.0%) | 369 (79.0%) |
| 6 to 11 Years | 2,245 (79.0%) | 2,082 (68.9%) |
| 12 to 14 Years | 1,262 (83.2%) | 980 (70.6%) |
| 15 Years | 538 (81.0%) | 596 (86.8%) |
| 16 and 17 Years | 891 (84.5%) | 541 (72.9%) |
| 18 to 24 Years | 3,411 (65.3%) | 3,222 (60.4%) |
| 25 to 34 Years | 4,319 (74.7%) | 4,342 (75.2%) |
| 35 to 44 Years | 4,634 (87.1%) | 4,195 (82.2%) |
| 45 to 54 Years | 4,325 (81.5%) | 4,519 (85.0%) |
| 55 to 64 Years | 4,312 (81.7%) | 4,827 (82.7%) |
| 65 to 74 Years | 4,339 (92.6%) | 4,897 (89.0%) |
| 75 Years and over | 2,625 (90.6%) | 4,021 (90.8%) |
| Total | 35,562 (81.2%) | 36,181 (78.7%) |
Income Below Poverty Among Married-Couple Families in Cabell County
The poverty statistics for married-couple families in Cabell County show that 5.0% or 782 of the total 15,592 families live below the poverty line. Families with 5 or more children have the highest poverty rate of 29.1%, comprising of 23 families. On the other hand, families with no children have the lowest poverty rate of 3.5%, which includes 349 families.
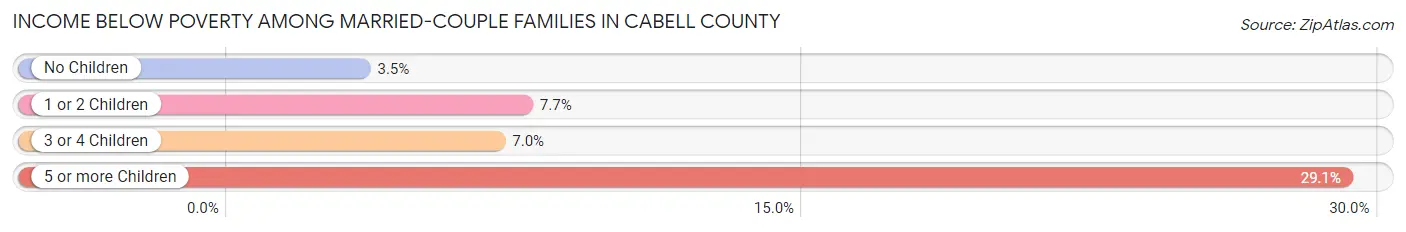
| Children | Above Poverty | Below Poverty |
| No Children | 9,745 (96.5%) | 349 (3.5%) |
| 1 or 2 Children | 4,050 (92.3%) | 338 (7.7%) |
| 3 or 4 Children | 959 (93.0%) | 72 (7.0%) |
| 5 or more Children | 56 (70.9%) | 23 (29.1%) |
| Total | 14,810 (95.0%) | 782 (5.0%) |
Income Below Poverty Among Single-Parent Households in Cabell County
According to the poverty data in Cabell County, 24.8% or 352 single-father households and 34.5% or 1,575 single-mother households are living below the poverty line. Among single-father households, those with 3 or 4 children have the highest poverty rate, with 32 households (50.0%) experiencing poverty. Likewise, among single-mother households, those with 5 or more children have the highest poverty rate, with 6 households (85.7%) falling below the poverty line.
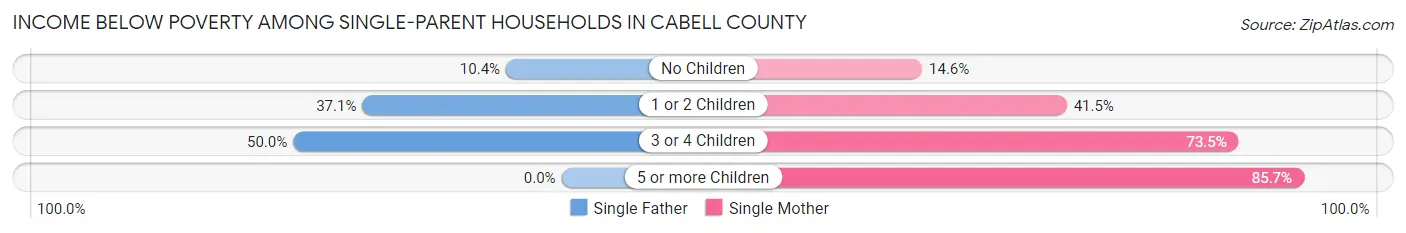
| Children | Single Father | Single Mother |
| No Children | 71 (10.3%) | 249 (14.6%) |
| 1 or 2 Children | 249 (37.1%) | 1,006 (41.5%) |
| 3 or 4 Children | 32 (50.0%) | 314 (73.5%) |
| 5 or more Children | 0 (0.0%) | 6 (85.7%) |
| Total | 352 (24.8%) | 1,575 (34.5%) |
Income Below Poverty Among Married-Couple vs Single-Parent Households in Cabell County
The poverty data for Cabell County shows that 782 of the married-couple family households (5.0%) and 1,927 of the single-parent households (32.2%) are living below the poverty level. Within the married-couple family households, those with 5 or more children have the highest poverty rate, with 23 households (29.1%) falling below the poverty line. Among the single-parent households, those with 5 or more children have the highest poverty rate, with 6 household (85.7%) living below poverty.
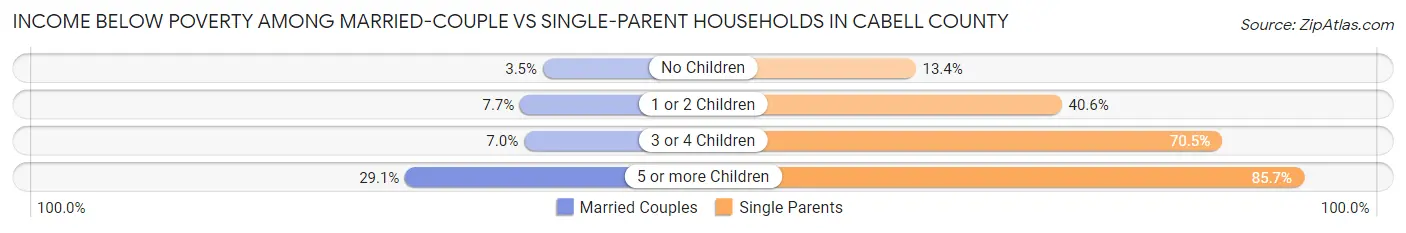
| Children | Married-Couple Families | Single-Parent Households |
| No Children | 349 (3.5%) | 320 (13.4%) |
| 1 or 2 Children | 338 (7.7%) | 1,255 (40.6%) |
| 3 or 4 Children | 72 (7.0%) | 346 (70.5%) |
| 5 or more Children | 23 (29.1%) | 6 (85.7%) |
| Total | 782 (5.0%) | 1,927 (32.2%) |
Employment Characteristics in Cabell County
Employment by Class of Employer in Cabell County
Among the 39,546 employed individuals in Cabell County, private company employees (24,987 | 63.2%), state government employees (3,945 | 10.0%), and not-for-profit organizations (3,857 | 9.8%) make up the most common classes of employment.
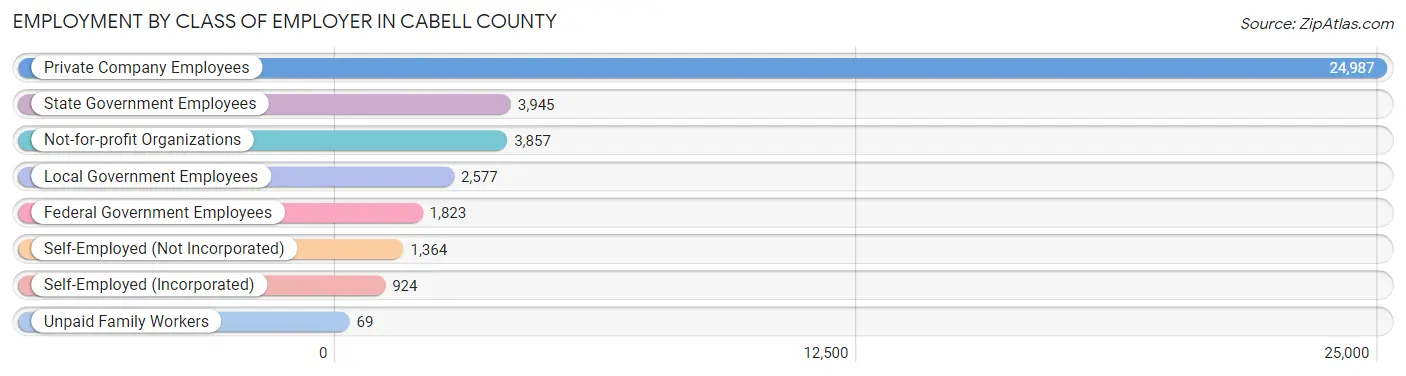
| Employer Class | # Employees | % Employees |
| Private Company Employees | 24,987 | 63.2% |
| Self-Employed (Incorporated) | 924 | 2.3% |
| Self-Employed (Not Incorporated) | 1,364 | 3.5% |
| Not-for-profit Organizations | 3,857 | 9.8% |
| Local Government Employees | 2,577 | 6.5% |
| State Government Employees | 3,945 | 10.0% |
| Federal Government Employees | 1,823 | 4.6% |
| Unpaid Family Workers | 69 | 0.2% |
| Total | 39,546 | 100.0% |
Employment Status by Age in Cabell County
According to the labor force statistics for Cabell County, out of the total population over 16 years of age (77,413), 55.5% or 42,964 individuals are in the labor force, with 6.1% or 2,621 of them unemployed. The age group with the highest labor force participation rate is 35 to 44 years, with 78.4% or 8,394 individuals in the labor force. Within the labor force, the 16 to 19 years age range has the highest percentage of unemployed individuals, with 18.0% or 384 of them being unemployed.
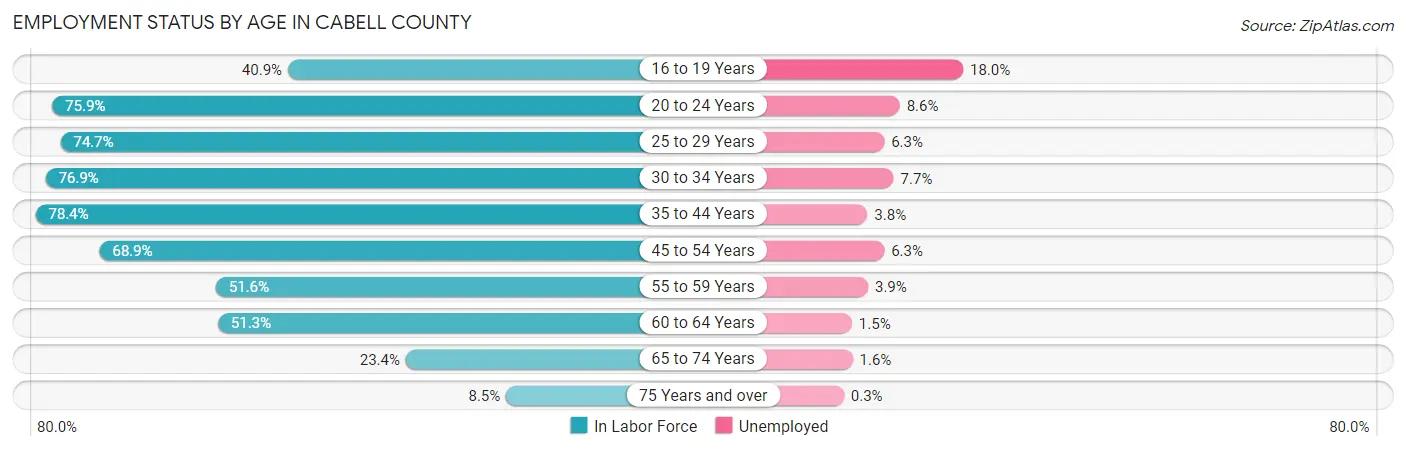
| Age Bracket | In Labor Force | Unemployed |
| 16 to 19 Years | 2,135 (40.9%) | 384 (18.0%) |
| 20 to 24 Years | 7,163 (75.9%) | 616 (8.6%) |
| 25 to 29 Years | 4,822 (74.7%) | 304 (6.3%) |
| 30 to 34 Years | 4,155 (76.9%) | 320 (7.7%) |
| 35 to 44 Years | 8,394 (78.4%) | 319 (3.8%) |
| 45 to 54 Years | 7,401 (68.9%) | 466 (6.3%) |
| 55 to 59 Years | 2,979 (51.6%) | 116 (3.9%) |
| 60 to 64 Years | 2,812 (51.3%) | 42 (1.5%) |
| 65 to 74 Years | 2,424 (23.4%) | 39 (1.6%) |
| 75 Years and over | 666 (8.5%) | 2 (0.3%) |
| Total | 42,964 (55.5%) | 2,621 (6.1%) |
Employment Status by Educational Attainment in Cabell County
According to labor force statistics for Cabell County, 68.6% of individuals (30,570) out of the total population between 25 and 64 years of age (44,562) are in the labor force, with 5.1% or 1,559 of them being unemployed. The group with the highest labor force participation rate are those with the educational attainment of bachelor's degree or higher, with 84.8% or 11,939 individuals in the labor force. Within the labor force, individuals with less than high school education have the highest percentage of unemployment, with 14.8% or 202 of them being unemployed.
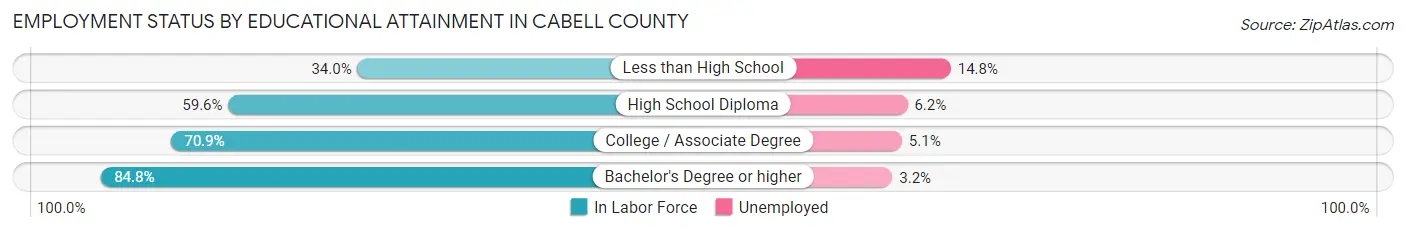
| Educational Attainment | In Labor Force | Unemployed |
| Less than High School | 1,368 (34.0%) | 596 (14.8%) |
| High School Diploma | 7,902 (59.6%) | 822 (6.2%) |
| College / Associate Degree | 9,359 (70.9%) | 673 (5.1%) |
| Bachelor's Degree or higher | 11,939 (84.8%) | 451 (3.2%) |
| Total | 30,570 (68.6%) | 2,273 (5.1%) |
Employment Occupations by Sex in Cabell County
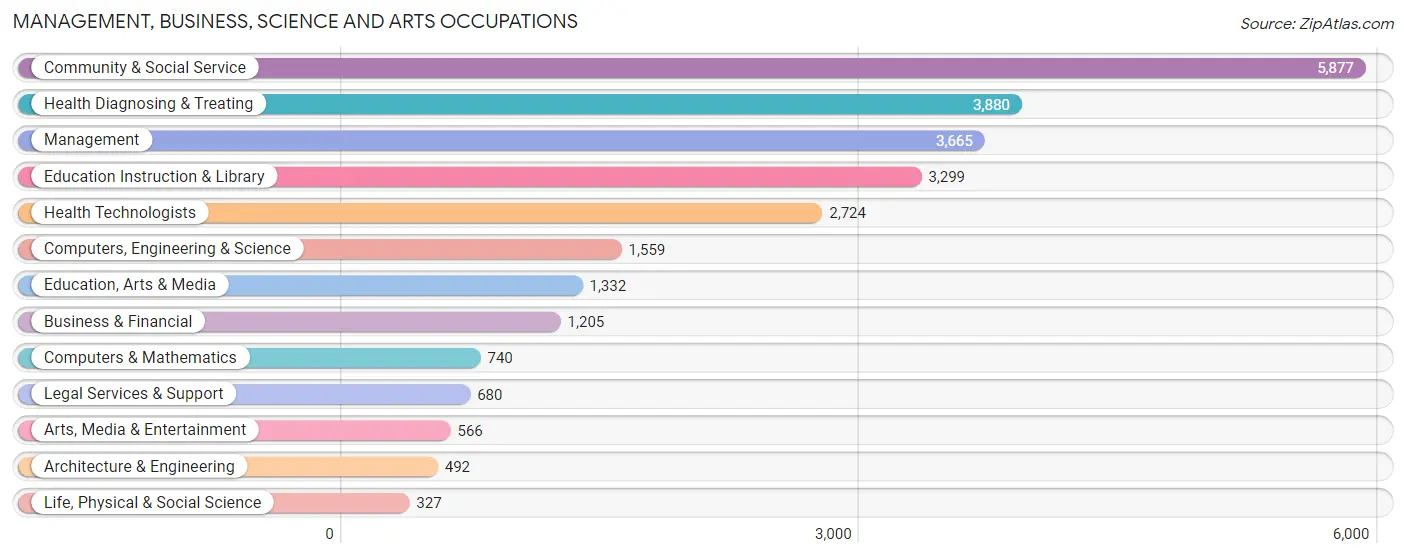
Management, Business, Science and Arts Occupations
The most common Management, Business, Science and Arts occupations in Cabell County are Community & Social Service (5,877 | 14.6%), Health Diagnosing & Treating (3,880 | 9.7%), Management (3,665 | 9.1%), Education Instruction & Library (3,299 | 8.2%), and Health Technologists (2,724 | 6.8%).
Management, Business, Science and Arts Occupations by Sex
Within the Management, Business, Science and Arts occupations in Cabell County, the most male-oriented occupations are Architecture & Engineering (89.2%), Computers & Mathematics (84.7%), and Computers, Engineering & Science (79.1%), while the most female-oriented occupations are Health Diagnosing & Treating (77.6%), Health Technologists (74.5%), and Education Instruction & Library (69.1%).
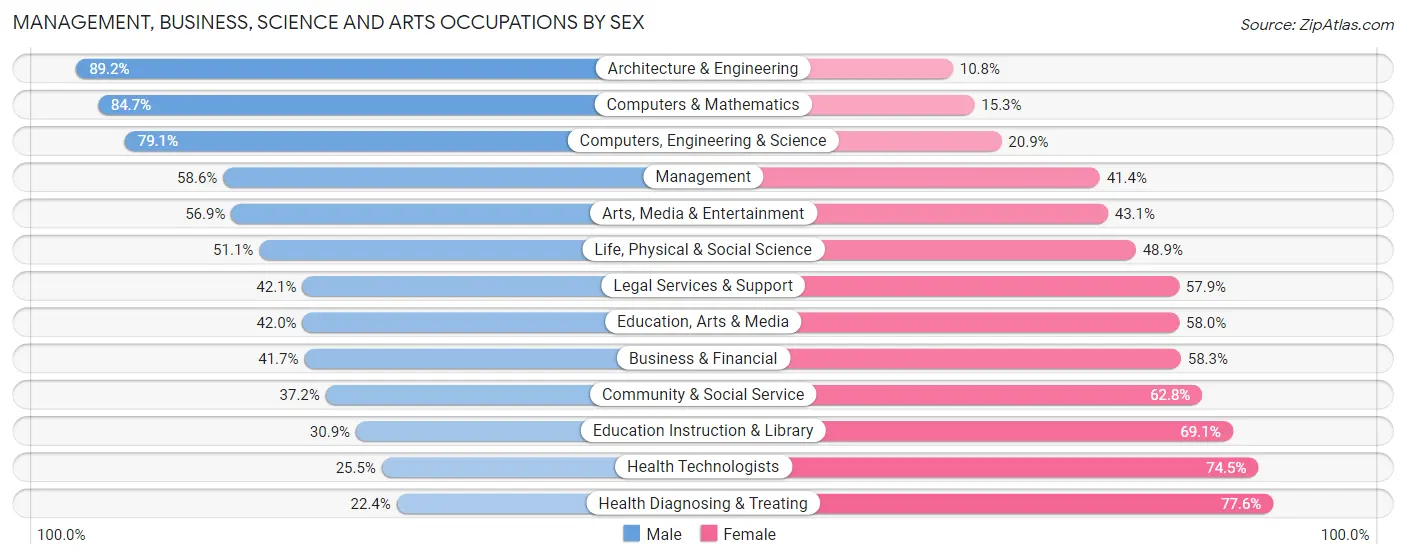
| Occupation | Male | Female |
| Management | 2,147 (58.6%) | 1,518 (41.4%) |
| Business & Financial | 502 (41.7%) | 703 (58.3%) |
| Computers, Engineering & Science | 1,233 (79.1%) | 326 (20.9%) |
| Computers & Mathematics | 627 (84.7%) | 113 (15.3%) |
| Architecture & Engineering | 439 (89.2%) | 53 (10.8%) |
| Life, Physical & Social Science | 167 (51.1%) | 160 (48.9%) |
| Community & Social Service | 2,187 (37.2%) | 3,690 (62.8%) |
| Education, Arts & Media | 560 (42.0%) | 772 (58.0%) |
| Legal Services & Support | 286 (42.1%) | 394 (57.9%) |
| Education Instruction & Library | 1,019 (30.9%) | 2,280 (69.1%) |
| Arts, Media & Entertainment | 322 (56.9%) | 244 (43.1%) |
| Health Diagnosing & Treating | 869 (22.4%) | 3,011 (77.6%) |
| Health Technologists | 695 (25.5%) | 2,029 (74.5%) |
| Total (Category) | 6,938 (42.9%) | 9,248 (57.1%) |
| Total (Overall) | 19,967 (49.7%) | 20,179 (50.3%) |
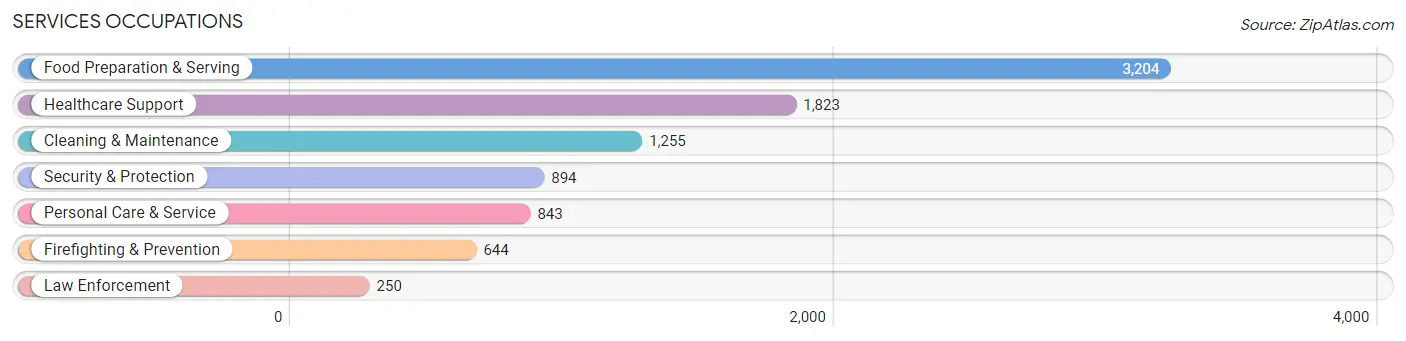
Services Occupations
The most common Services occupations in Cabell County are Food Preparation & Serving (3,204 | 8.0%), Healthcare Support (1,823 | 4.5%), Cleaning & Maintenance (1,255 | 3.1%), Security & Protection (894 | 2.2%), and Personal Care & Service (843 | 2.1%).
Services Occupations by Sex
Within the Services occupations in Cabell County, the most male-oriented occupations are Law Enforcement (96.8%), Security & Protection (83.6%), and Firefighting & Prevention (78.4%), while the most female-oriented occupations are Healthcare Support (72.0%), Personal Care & Service (66.5%), and Food Preparation & Serving (65.0%).
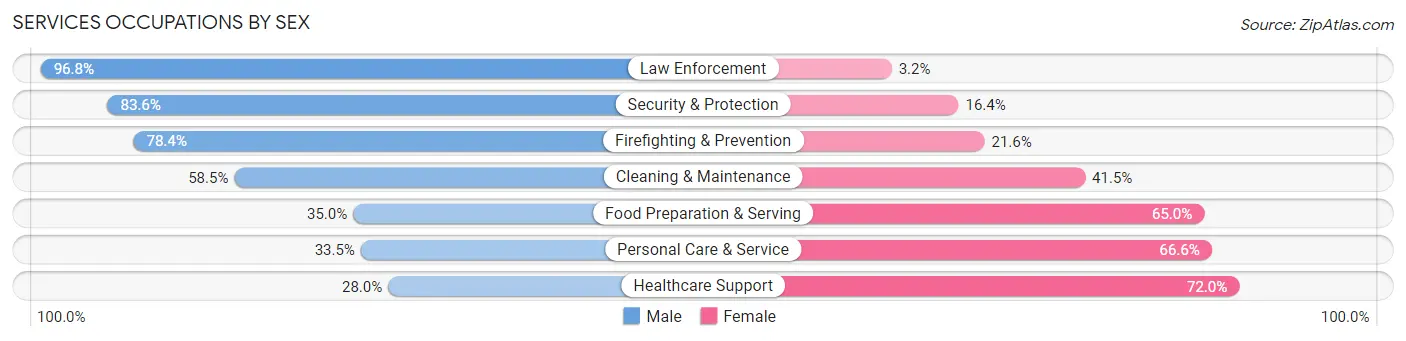
| Occupation | Male | Female |
| Healthcare Support | 511 (28.0%) | 1,312 (72.0%) |
| Security & Protection | 747 (83.6%) | 147 (16.4%) |
| Firefighting & Prevention | 505 (78.4%) | 139 (21.6%) |
| Law Enforcement | 242 (96.8%) | 8 (3.2%) |
| Food Preparation & Serving | 1,120 (35.0%) | 2,084 (65.0%) |
| Cleaning & Maintenance | 734 (58.5%) | 521 (41.5%) |
| Personal Care & Service | 282 (33.5%) | 561 (66.5%) |
| Total (Category) | 3,394 (42.3%) | 4,625 (57.7%) |
| Total (Overall) | 19,967 (49.7%) | 20,179 (50.3%) |
Sales and Office Occupations
The most common Sales and Office occupations in Cabell County are Sales & Related (4,780 | 11.9%), and Office & Administration (4,475 | 11.2%).

Sales and Office Occupations by Sex
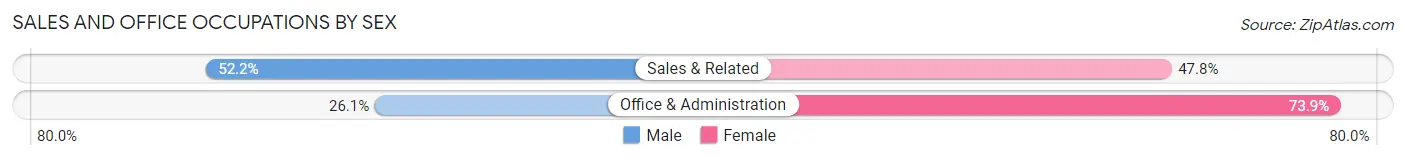
| Occupation | Male | Female |
| Sales & Related | 2,495 (52.2%) | 2,285 (47.8%) |
| Office & Administration | 1,167 (26.1%) | 3,308 (73.9%) |
| Total (Category) | 3,662 (39.6%) | 5,593 (60.4%) |
| Total (Overall) | 19,967 (49.7%) | 20,179 (50.3%) |
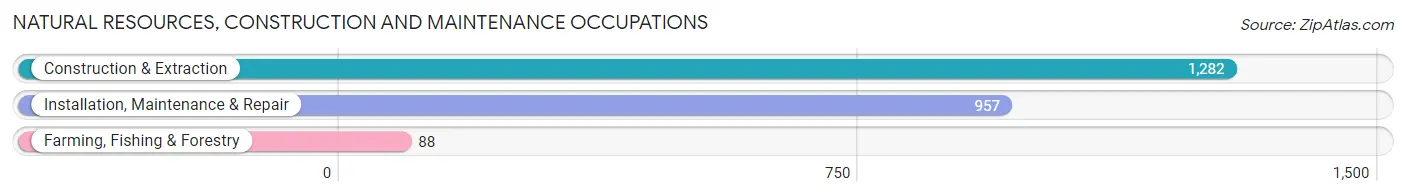
Natural Resources, Construction and Maintenance Occupations
The most common Natural Resources, Construction and Maintenance occupations in Cabell County are Construction & Extraction (1,282 | 3.2%), Installation, Maintenance & Repair (957 | 2.4%), and Farming, Fishing & Forestry (88 | 0.2%).
Natural Resources, Construction and Maintenance Occupations by Sex
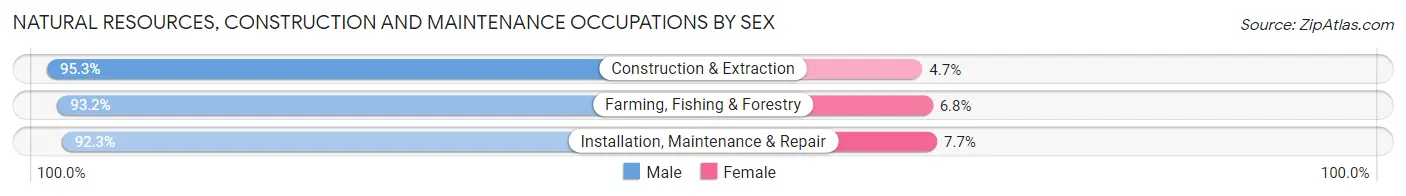
| Occupation | Male | Female |
| Farming, Fishing & Forestry | 82 (93.2%) | 6 (6.8%) |
| Construction & Extraction | 1,222 (95.3%) | 60 (4.7%) |
| Installation, Maintenance & Repair | 883 (92.3%) | 74 (7.7%) |
| Total (Category) | 2,187 (94.0%) | 140 (6.0%) |
| Total (Overall) | 19,967 (49.7%) | 20,179 (50.3%) |
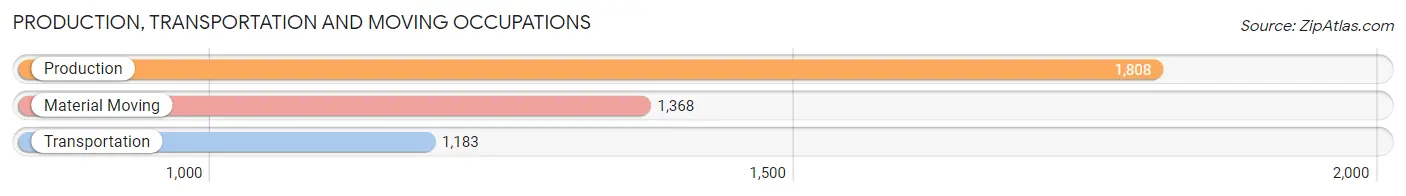
Production, Transportation and Moving Occupations
The most common Production, Transportation and Moving occupations in Cabell County are Production (1,808 | 4.5%), Material Moving (1,368 | 3.4%), and Transportation (1,183 | 2.9%).
Production, Transportation and Moving Occupations by Sex
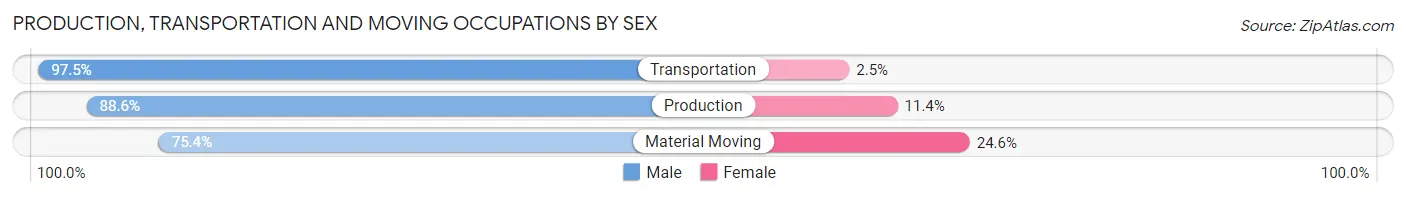
| Occupation | Male | Female |
| Production | 1,602 (88.6%) | 206 (11.4%) |
| Transportation | 1,153 (97.5%) | 30 (2.5%) |
| Material Moving | 1,031 (75.4%) | 337 (24.6%) |
| Total (Category) | 3,786 (86.9%) | 573 (13.2%) |
| Total (Overall) | 19,967 (49.7%) | 20,179 (50.3%) |
Employment Industries by Sex in Cabell County
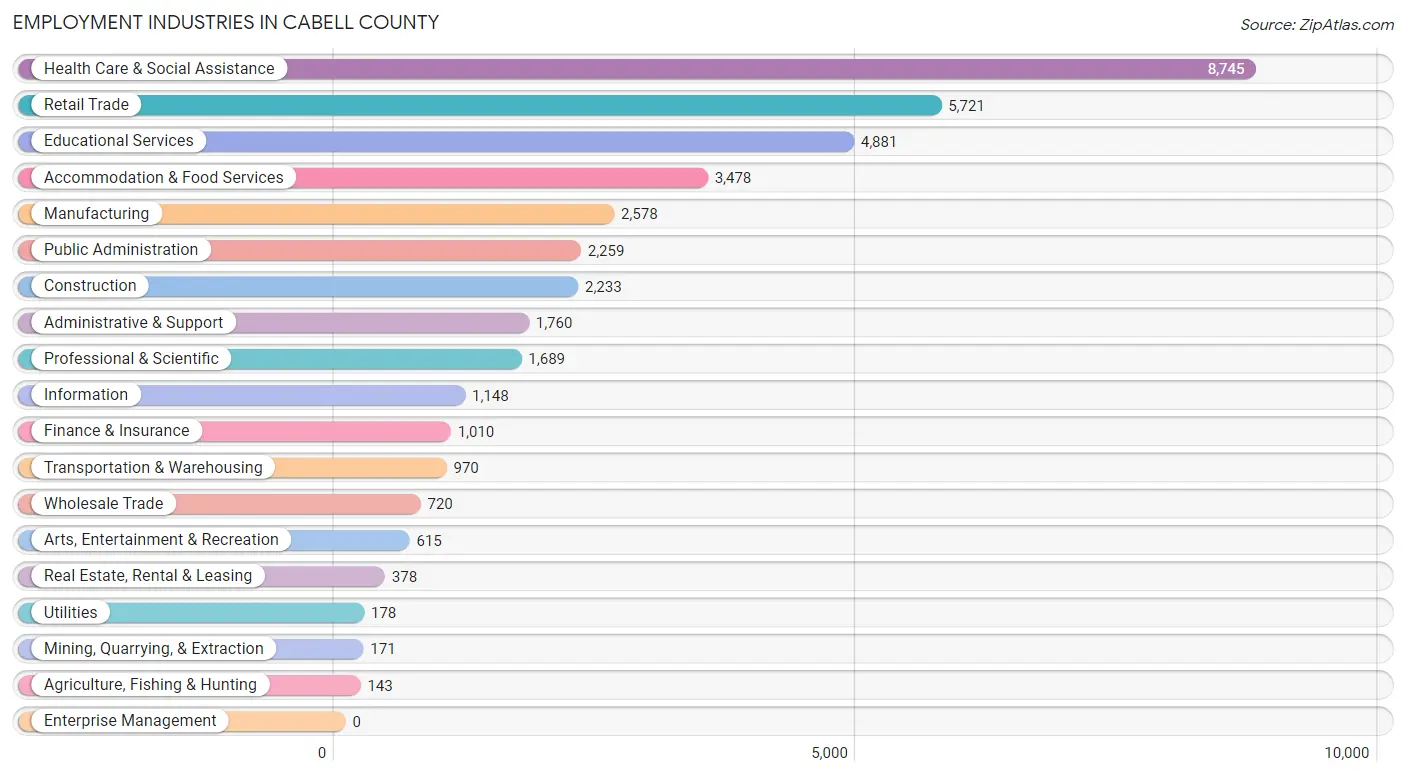
Employment Industries in Cabell County
The major employment industries in Cabell County include Health Care & Social Assistance (8,745 | 21.8%), Retail Trade (5,721 | 14.2%), Educational Services (4,881 | 12.2%), Accommodation & Food Services (3,478 | 8.7%), and Manufacturing (2,578 | 6.4%).
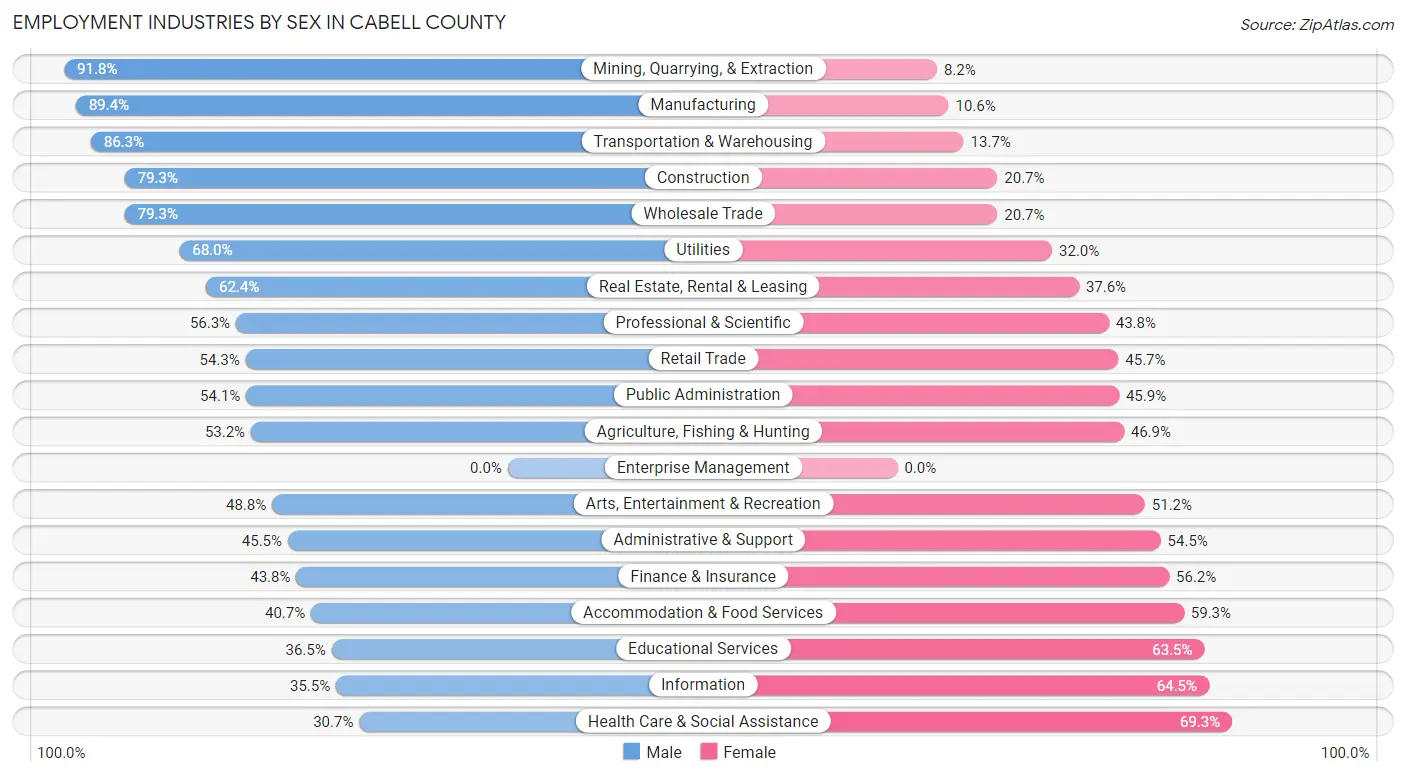
Employment Industries by Sex in Cabell County
The Cabell County industries that see more men than women are Mining, Quarrying, & Extraction (91.8%), Manufacturing (89.4%), and Transportation & Warehousing (86.3%), whereas the industries that tend to have a higher number of women are Health Care & Social Assistance (69.3%), Information (64.5%), and Educational Services (63.5%).
| Industry | Male | Female |
| Agriculture, Fishing & Hunting | 76 (53.1%) | 67 (46.9%) |
| Mining, Quarrying, & Extraction | 157 (91.8%) | 14 (8.2%) |
| Construction | 1,771 (79.3%) | 462 (20.7%) |
| Manufacturing | 2,305 (89.4%) | 273 (10.6%) |
| Wholesale Trade | 571 (79.3%) | 149 (20.7%) |
| Retail Trade | 3,105 (54.3%) | 2,616 (45.7%) |
| Transportation & Warehousing | 837 (86.3%) | 133 (13.7%) |
| Utilities | 121 (68.0%) | 57 (32.0%) |
| Information | 408 (35.5%) | 740 (64.5%) |
| Finance & Insurance | 442 (43.8%) | 568 (56.2%) |
| Real Estate, Rental & Leasing | 236 (62.4%) | 142 (37.6%) |
| Professional & Scientific | 950 (56.2%) | 739 (43.8%) |
| Enterprise Management | 0 (0.0%) | 0 (0.0%) |
| Administrative & Support | 801 (45.5%) | 959 (54.5%) |
| Educational Services | 1,780 (36.5%) | 3,101 (63.5%) |
| Health Care & Social Assistance | 2,688 (30.7%) | 6,057 (69.3%) |
| Arts, Entertainment & Recreation | 300 (48.8%) | 315 (51.2%) |
| Accommodation & Food Services | 1,416 (40.7%) | 2,062 (59.3%) |
| Public Administration | 1,223 (54.1%) | 1,036 (45.9%) |
| Total | 19,967 (49.7%) | 20,179 (50.3%) |
Education in Cabell County
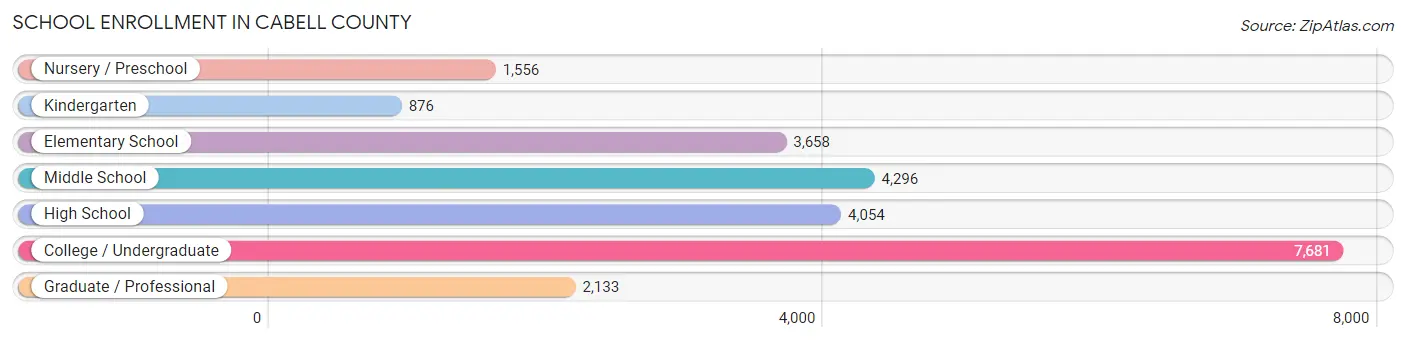
School Enrollment in Cabell County
The most common levels of schooling among the 24,254 students in Cabell County are college / undergraduate (7,681 | 31.7%), middle school (4,296 | 17.7%), and high school (4,054 | 16.7%).
| School Level | # Students | % Students |
| Nursery / Preschool | 1,556 | 6.4% |
| Kindergarten | 876 | 3.6% |
| Elementary School | 3,658 | 15.1% |
| Middle School | 4,296 | 17.7% |
| High School | 4,054 | 16.7% |
| College / Undergraduate | 7,681 | 31.7% |
| Graduate / Professional | 2,133 | 8.8% |
| Total | 24,254 | 100.0% |
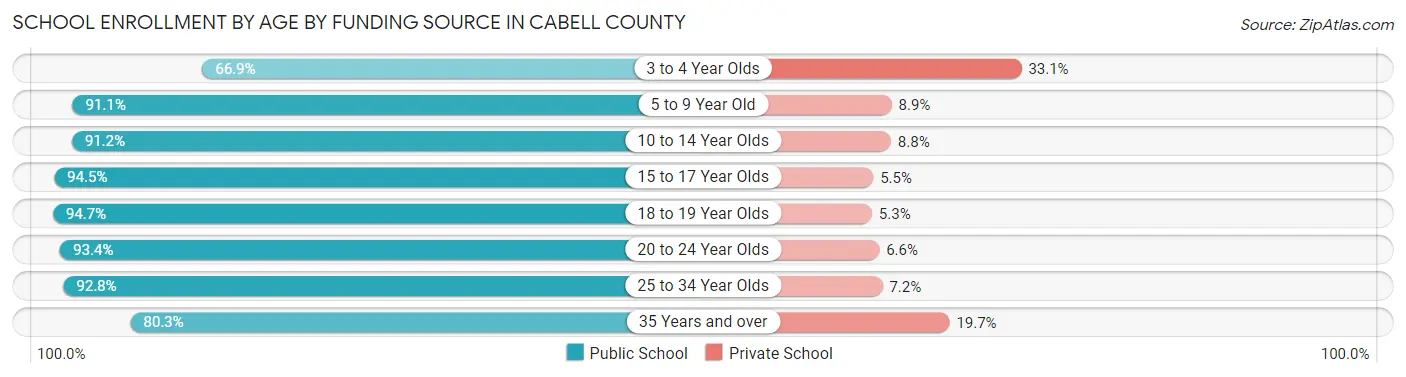
School Enrollment by Age by Funding Source in Cabell County
Out of a total of 24,254 students who are enrolled in schools in Cabell County, 2,134 (8.8%) attend a private institution, while the remaining 22,120 (91.2%) are enrolled in public schools. The age group of 3 to 4 year olds has the highest likelihood of being enrolled in private schools, with 290 (33.1% in the age bracket) enrolled. Conversely, the age group of 18 to 19 year olds has the lowest likelihood of being enrolled in a private school, with 2,596 (94.7% in the age bracket) attending a public institution.
| Age Bracket | Public School | Private School |
| 3 to 4 Year Olds | 586 (66.9%) | 290 (33.1%) |
| 5 to 9 Year Old | 4,255 (91.1%) | 417 (8.9%) |
| 10 to 14 Year Olds | 4,613 (91.2%) | 445 (8.8%) |
| 15 to 17 Year Olds | 2,782 (94.5%) | 162 (5.5%) |
| 18 to 19 Year Olds | 2,596 (94.7%) | 144 (5.3%) |
| 20 to 24 Year Olds | 4,757 (93.4%) | 337 (6.6%) |
| 25 to 34 Year Olds | 1,617 (92.8%) | 126 (7.2%) |
| 35 Years and over | 905 (80.3%) | 222 (19.7%) |
| Total | 22,120 (91.2%) | 2,134 (8.8%) |
Educational Attainment by Field of Study in Cabell County
Education (4,276 | 21.1%), business (3,353 | 16.6%), science & technology (2,591 | 12.8%), bio, nature & agricultural (1,558 | 7.7%), and psychology (1,346 | 6.7%) are the most common fields of study among 20,238 individuals in Cabell County who have obtained a bachelor's degree or higher.
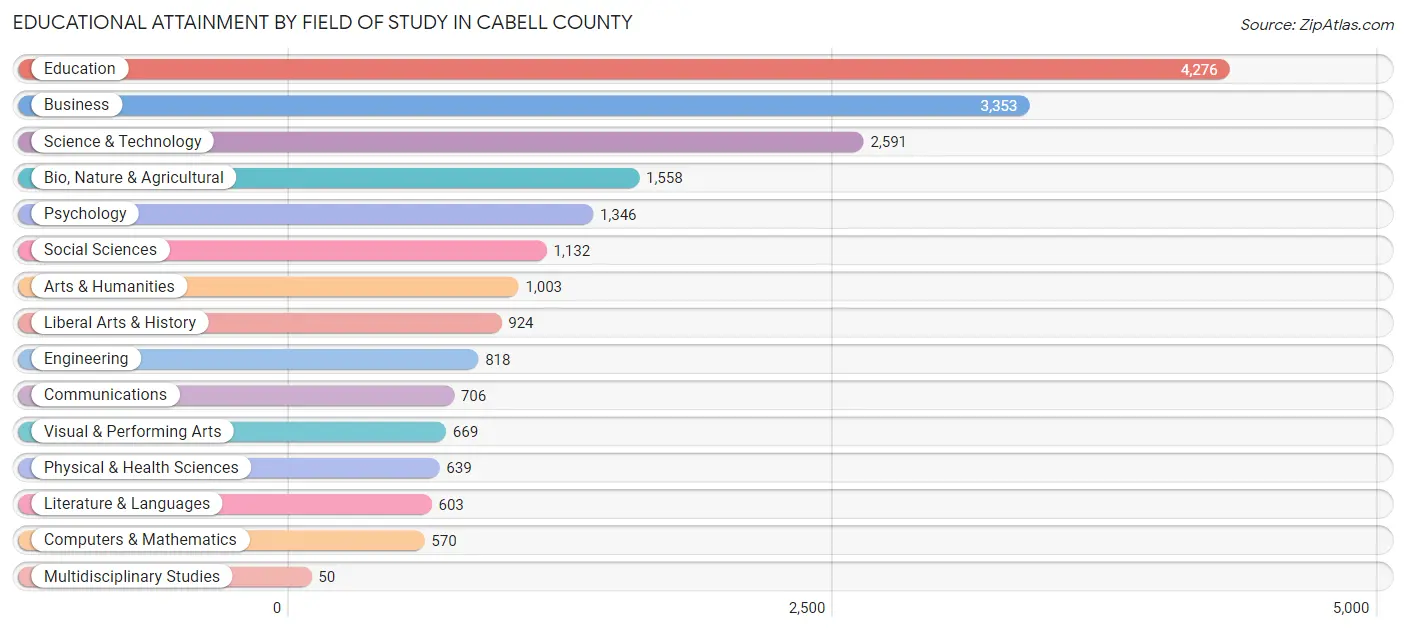
| Field of Study | # Graduates | % Graduates |
| Computers & Mathematics | 570 | 2.8% |
| Bio, Nature & Agricultural | 1,558 | 7.7% |
| Physical & Health Sciences | 639 | 3.2% |
| Psychology | 1,346 | 6.7% |
| Social Sciences | 1,132 | 5.6% |
| Engineering | 818 | 4.0% |
| Multidisciplinary Studies | 50 | 0.3% |
| Science & Technology | 2,591 | 12.8% |
| Business | 3,353 | 16.6% |
| Education | 4,276 | 21.1% |
| Literature & Languages | 603 | 3.0% |
| Liberal Arts & History | 924 | 4.6% |
| Visual & Performing Arts | 669 | 3.3% |
| Communications | 706 | 3.5% |
| Arts & Humanities | 1,003 | 5.0% |
| Total | 20,238 | 100.0% |
Transportation & Commute in Cabell County
Vehicle Availability by Sex in Cabell County
The most prevalent vehicle ownership categories in Cabell County are males with 2 vehicles (8,362, accounting for 42.8%) and females with 2 vehicles (7,837, making up 43.5%).
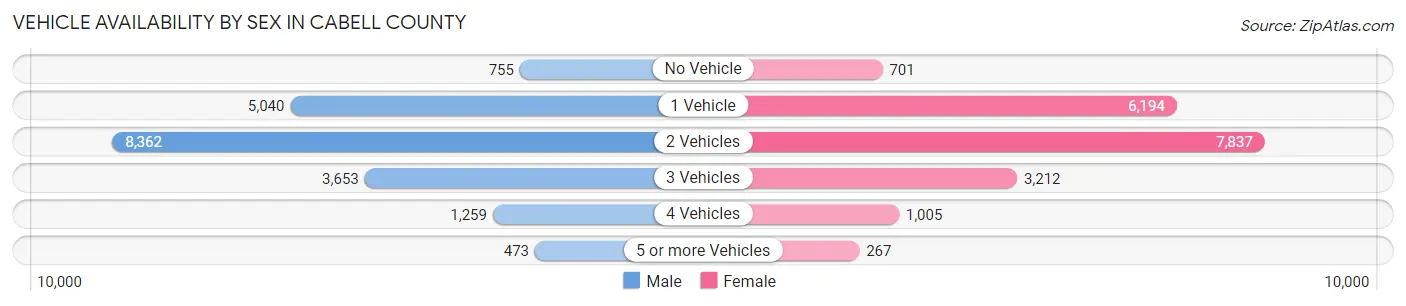
| Vehicles Available | Male | Female |
| No Vehicle | 755 (3.9%) | 701 (3.6%) |
| 1 Vehicle | 5,040 (25.8%) | 6,194 (32.2%) |
| 2 Vehicles | 8,362 (42.8%) | 7,837 (40.8%) |
| 3 Vehicles | 3,653 (18.7%) | 3,212 (16.7%) |
| 4 Vehicles | 1,259 (6.4%) | 1,005 (5.2%) |
| 5 or more Vehicles | 473 (2.4%) | 267 (1.4%) |
| Total | 19,542 (100.0%) | 19,216 (100.0%) |
Commute Time in Cabell County
The most frequently occuring commute durations in Cabell County are 10 to 14 minutes (6,645 commuters, 18.0%), 15 to 19 minutes (6,606 commuters, 17.8%), and 20 to 24 minutes (5,959 commuters, 16.1%).
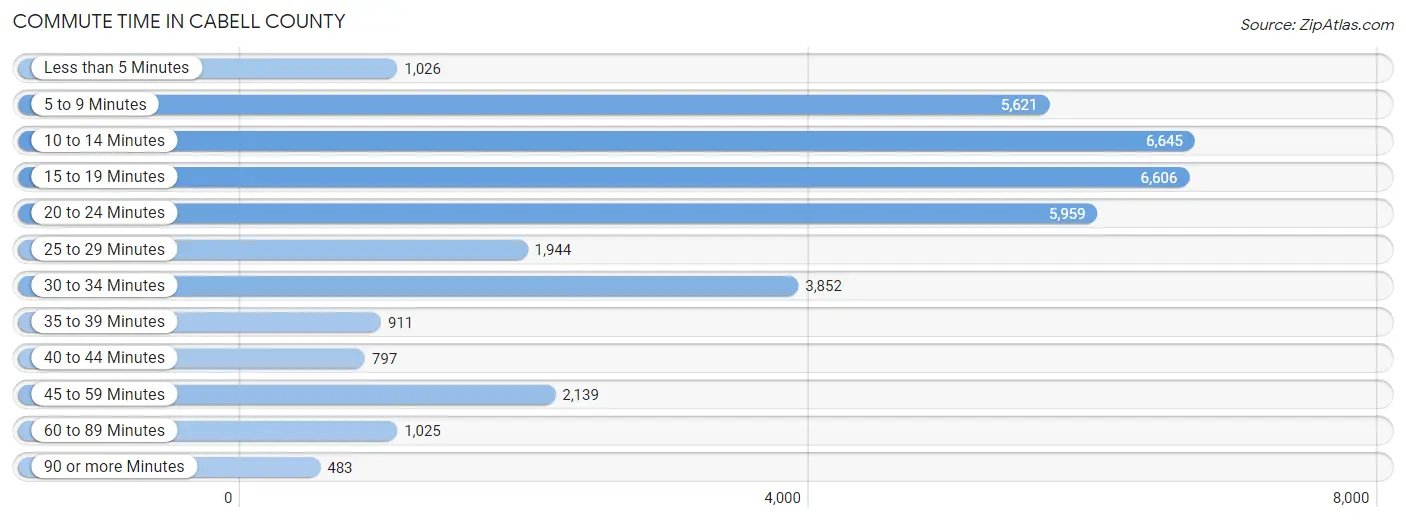
| Commute Time | # Commuters | % Commuters |
| Less than 5 Minutes | 1,026 | 2.8% |
| 5 to 9 Minutes | 5,621 | 15.2% |
| 10 to 14 Minutes | 6,645 | 18.0% |
| 15 to 19 Minutes | 6,606 | 17.8% |
| 20 to 24 Minutes | 5,959 | 16.1% |
| 25 to 29 Minutes | 1,944 | 5.2% |
| 30 to 34 Minutes | 3,852 | 10.4% |
| 35 to 39 Minutes | 911 | 2.5% |
| 40 to 44 Minutes | 797 | 2.1% |
| 45 to 59 Minutes | 2,139 | 5.8% |
| 60 to 89 Minutes | 1,025 | 2.8% |
| 90 or more Minutes | 483 | 1.3% |
Commute Time by Sex in Cabell County
The most common commute times in Cabell County are 15 to 19 minutes (3,327 commuters, 17.8%) for males and 10 to 14 minutes (3,388 commuters, 18.5%) for females.
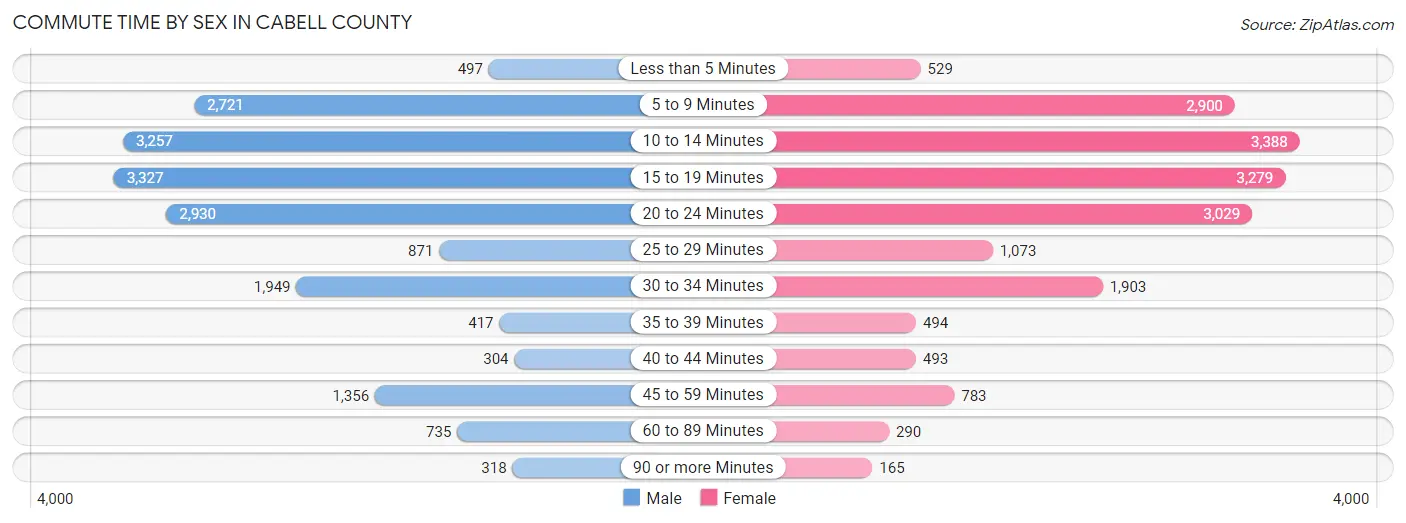
| Commute Time | Male | Female |
| Less than 5 Minutes | 497 (2.7%) | 529 (2.9%) |
| 5 to 9 Minutes | 2,721 (14.6%) | 2,900 (15.8%) |
| 10 to 14 Minutes | 3,257 (17.4%) | 3,388 (18.5%) |
| 15 to 19 Minutes | 3,327 (17.8%) | 3,279 (17.9%) |
| 20 to 24 Minutes | 2,930 (15.7%) | 3,029 (16.5%) |
| 25 to 29 Minutes | 871 (4.7%) | 1,073 (5.9%) |
| 30 to 34 Minutes | 1,949 (10.4%) | 1,903 (10.4%) |
| 35 to 39 Minutes | 417 (2.2%) | 494 (2.7%) |
| 40 to 44 Minutes | 304 (1.6%) | 493 (2.7%) |
| 45 to 59 Minutes | 1,356 (7.3%) | 783 (4.3%) |
| 60 to 89 Minutes | 735 (3.9%) | 290 (1.6%) |
| 90 or more Minutes | 318 (1.7%) | 165 (0.9%) |
Time of Departure to Work by Sex in Cabell County
The most frequent times of departure to work in Cabell County are 7:30 AM to 7:59 AM (2,238, 12.0%) for males and 7:00 AM to 7:29 AM (3,178, 17.3%) for females.
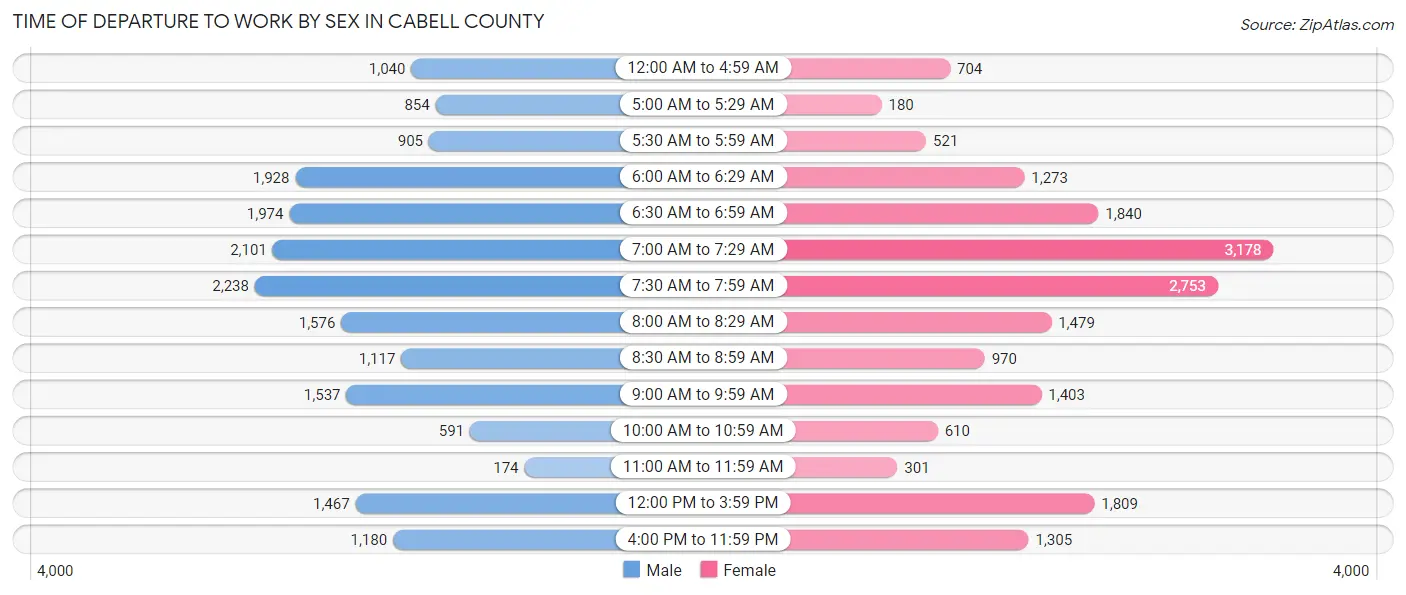
| Time of Departure | Male | Female |
| 12:00 AM to 4:59 AM | 1,040 (5.6%) | 704 (3.8%) |
| 5:00 AM to 5:29 AM | 854 (4.6%) | 180 (1.0%) |
| 5:30 AM to 5:59 AM | 905 (4.8%) | 521 (2.8%) |
| 6:00 AM to 6:29 AM | 1,928 (10.3%) | 1,273 (7.0%) |
| 6:30 AM to 6:59 AM | 1,974 (10.6%) | 1,840 (10.0%) |
| 7:00 AM to 7:29 AM | 2,101 (11.3%) | 3,178 (17.3%) |
| 7:30 AM to 7:59 AM | 2,238 (12.0%) | 2,753 (15.0%) |
| 8:00 AM to 8:29 AM | 1,576 (8.4%) | 1,479 (8.1%) |
| 8:30 AM to 8:59 AM | 1,117 (6.0%) | 970 (5.3%) |
| 9:00 AM to 9:59 AM | 1,537 (8.2%) | 1,403 (7.7%) |
| 10:00 AM to 10:59 AM | 591 (3.2%) | 610 (3.3%) |
| 11:00 AM to 11:59 AM | 174 (0.9%) | 301 (1.6%) |
| 12:00 PM to 3:59 PM | 1,467 (7.9%) | 1,809 (9.9%) |
| 4:00 PM to 11:59 PM | 1,180 (6.3%) | 1,305 (7.1%) |
| Total | 18,682 (100.0%) | 18,326 (100.0%) |
Housing Occupancy in Cabell County
Occupancy by Ownership in Cabell County
Of the total 38,854 dwellings in Cabell County, owner-occupied units account for 25,110 (64.6%), while renter-occupied units make up 13,744 (35.4%).
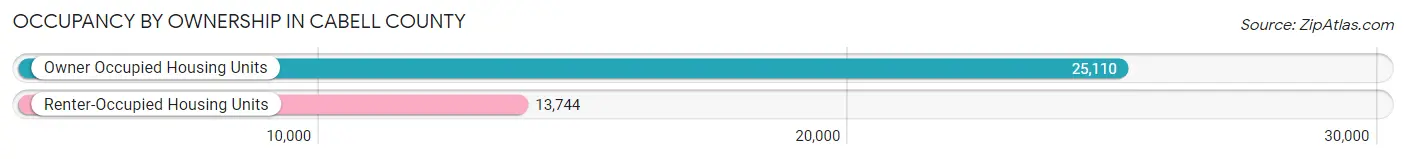
| Occupancy | # Housing Units | % Housing Units |
| Owner Occupied Housing Units | 25,110 | 64.6% |
| Renter-Occupied Housing Units | 13,744 | 35.4% |
| Total Occupied Housing Units | 38,854 | 100.0% |
Occupancy by Household Size in Cabell County
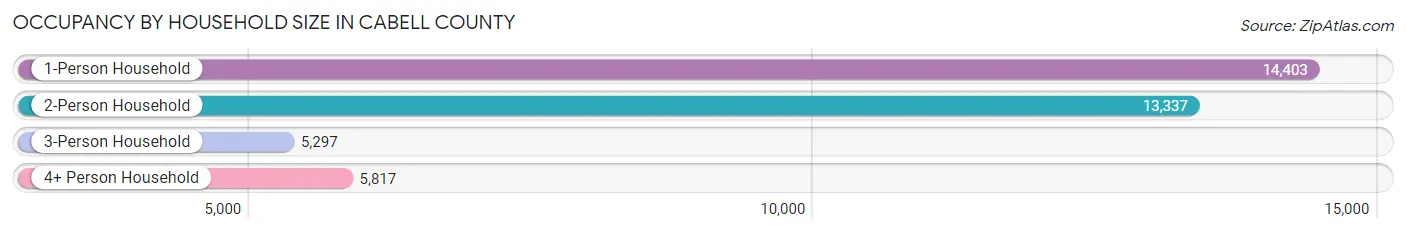
| Household Size | # Housing Units | % Housing Units |
| 1-Person Household | 14,403 | 37.1% |
| 2-Person Household | 13,337 | 34.3% |
| 3-Person Household | 5,297 | 13.6% |
| 4+ Person Household | 5,817 | 15.0% |
| Total Housing Units | 38,854 | 100.0% |
Occupancy by Ownership by Household Size in Cabell County
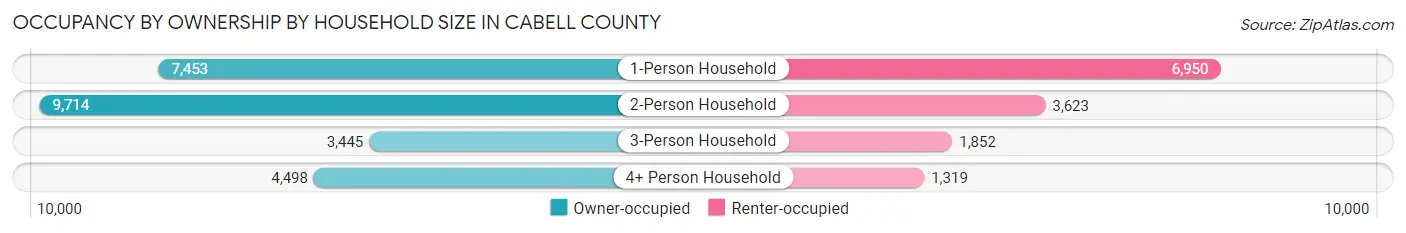
| Household Size | Owner-occupied | Renter-occupied |
| 1-Person Household | 7,453 (51.7%) | 6,950 (48.2%) |
| 2-Person Household | 9,714 (72.8%) | 3,623 (27.2%) |
| 3-Person Household | 3,445 (65.0%) | 1,852 (35.0%) |
| 4+ Person Household | 4,498 (77.3%) | 1,319 (22.7%) |
| Total Housing Units | 25,110 (64.6%) | 13,744 (35.4%) |
Occupancy by Educational Attainment in Cabell County
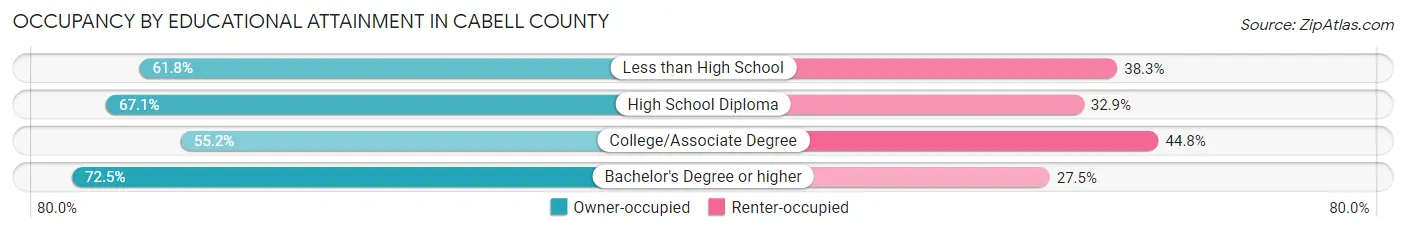
| Household Size | Owner-occupied | Renter-occupied |
| Less than High School | 1,995 (61.8%) | 1,236 (38.3%) |
| High School Diploma | 7,114 (67.1%) | 3,494 (32.9%) |
| College/Associate Degree | 6,793 (55.2%) | 5,514 (44.8%) |
| Bachelor's Degree or higher | 9,208 (72.5%) | 3,500 (27.5%) |
Occupancy by Age of Householder in Cabell County
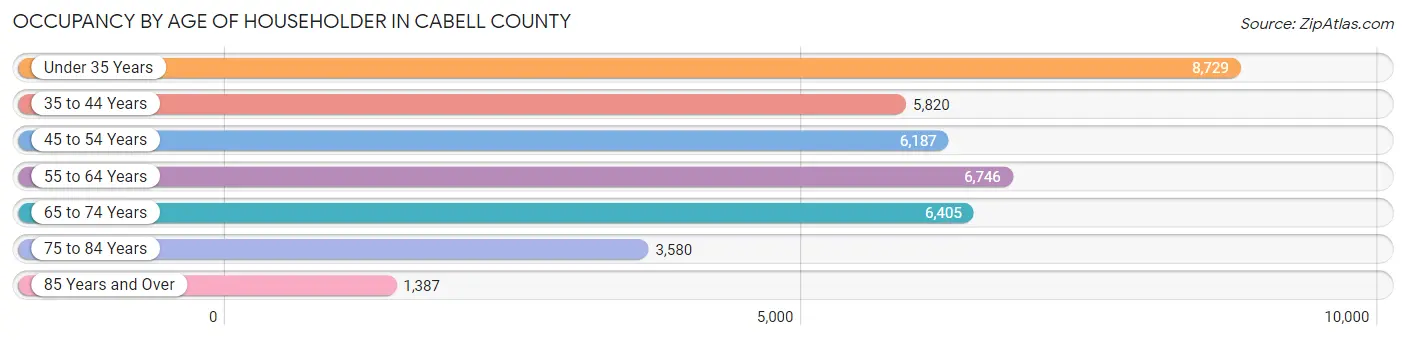
| Age Bracket | # Households | % Households |
| Under 35 Years | 8,729 | 22.5% |
| 35 to 44 Years | 5,820 | 15.0% |
| 45 to 54 Years | 6,187 | 15.9% |
| 55 to 64 Years | 6,746 | 17.4% |
| 65 to 74 Years | 6,405 | 16.5% |
| 75 to 84 Years | 3,580 | 9.2% |
| 85 Years and Over | 1,387 | 3.6% |
| Total | 38,854 | 100.0% |
Housing Finances in Cabell County
Median Income by Occupancy in Cabell County
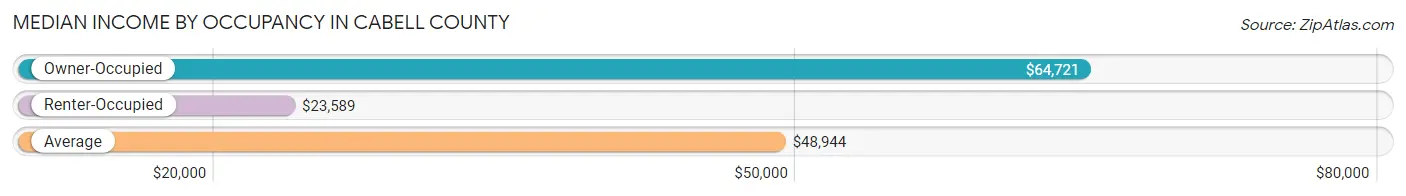
| Occupancy Type | # Households | Median Income |
| Owner-Occupied | 25,110 (64.6%) | $64,721 |
| Renter-Occupied | 13,744 (35.4%) | $23,589 |
| Average | 38,854 (100.0%) | $48,944 |
Occupancy by Householder Income Bracket in Cabell County
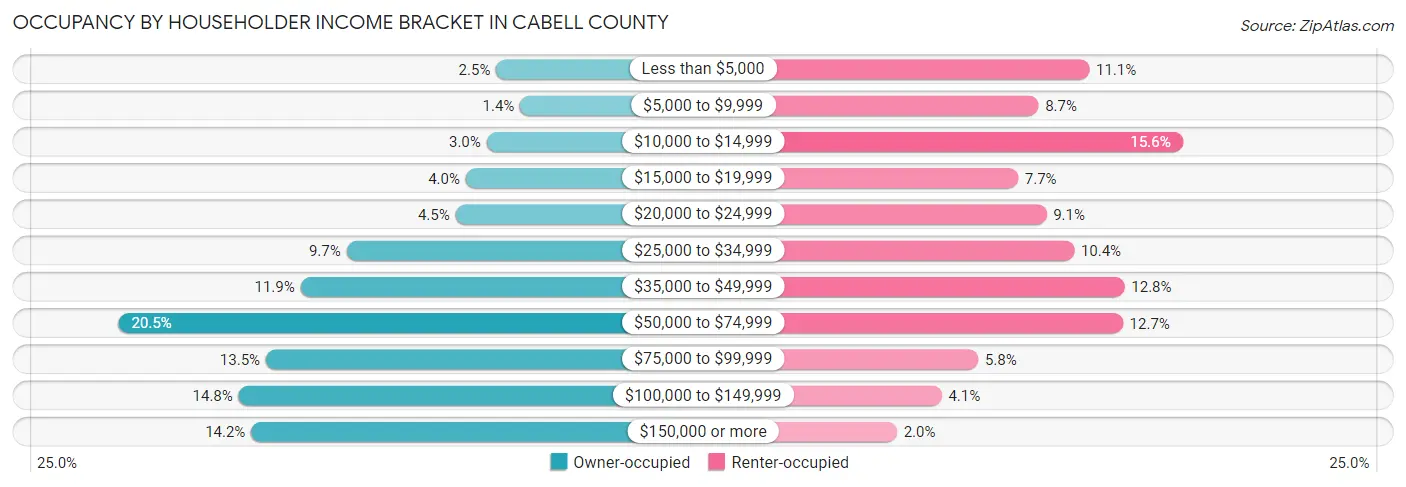
| Income Bracket | Owner-occupied | Renter-occupied |
| Less than $5,000 | 637 (2.5%) | 1,528 (11.1%) |
| $5,000 to $9,999 | 352 (1.4%) | 1,196 (8.7%) |
| $10,000 to $14,999 | 753 (3.0%) | 2,140 (15.6%) |
| $15,000 to $19,999 | 1,002 (4.0%) | 1,063 (7.7%) |
| $20,000 to $24,999 | 1,125 (4.5%) | 1,248 (9.1%) |
| $25,000 to $34,999 | 2,427 (9.7%) | 1,429 (10.4%) |
| $35,000 to $49,999 | 2,977 (11.9%) | 1,759 (12.8%) |
| $50,000 to $74,999 | 5,156 (20.5%) | 1,748 (12.7%) |
| $75,000 to $99,999 | 3,392 (13.5%) | 801 (5.8%) |
| $100,000 to $149,999 | 3,720 (14.8%) | 562 (4.1%) |
| $150,000 or more | 3,569 (14.2%) | 270 (2.0%) |
| Total | 25,110 (100.0%) | 13,744 (100.0%) |
Monthly Housing Cost Tiers in Cabell County
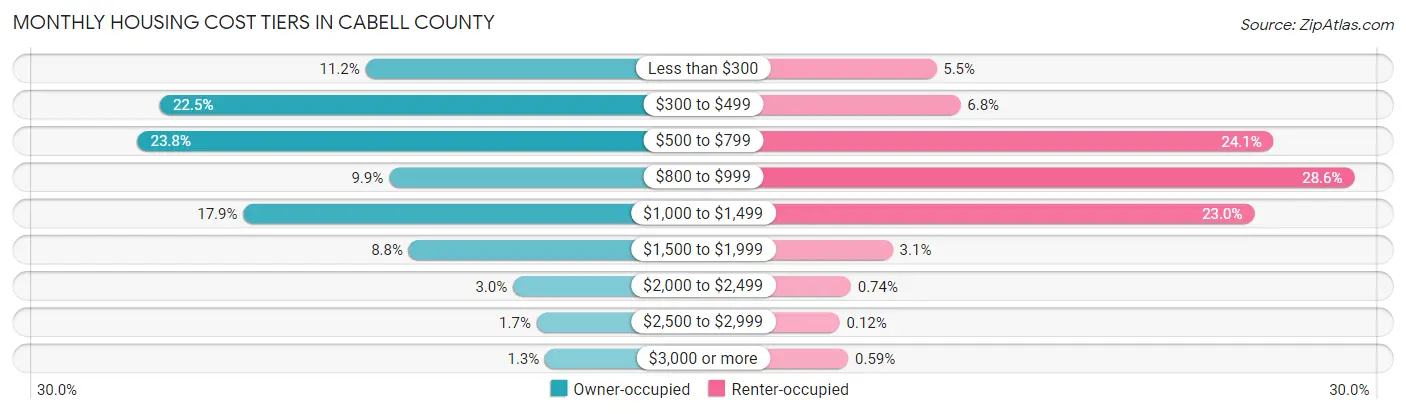
| Monthly Cost | Owner-occupied | Renter-occupied |
| Less than $300 | 2,806 (11.2%) | 751 (5.5%) |
| $300 to $499 | 5,654 (22.5%) | 933 (6.8%) |
| $500 to $799 | 5,966 (23.8%) | 3,311 (24.1%) |
| $800 to $999 | 2,479 (9.9%) | 3,924 (28.5%) |
| $1,000 to $1,499 | 4,499 (17.9%) | 3,164 (23.0%) |
| $1,500 to $1,999 | 2,205 (8.8%) | 419 (3.0%) |
| $2,000 to $2,499 | 759 (3.0%) | 102 (0.7%) |
| $2,500 to $2,999 | 429 (1.7%) | 17 (0.1%) |
| $3,000 or more | 313 (1.3%) | 81 (0.6%) |
| Total | 25,110 (100.0%) | 13,744 (100.0%) |
Physical Housing Characteristics in Cabell County
Housing Structures in Cabell County
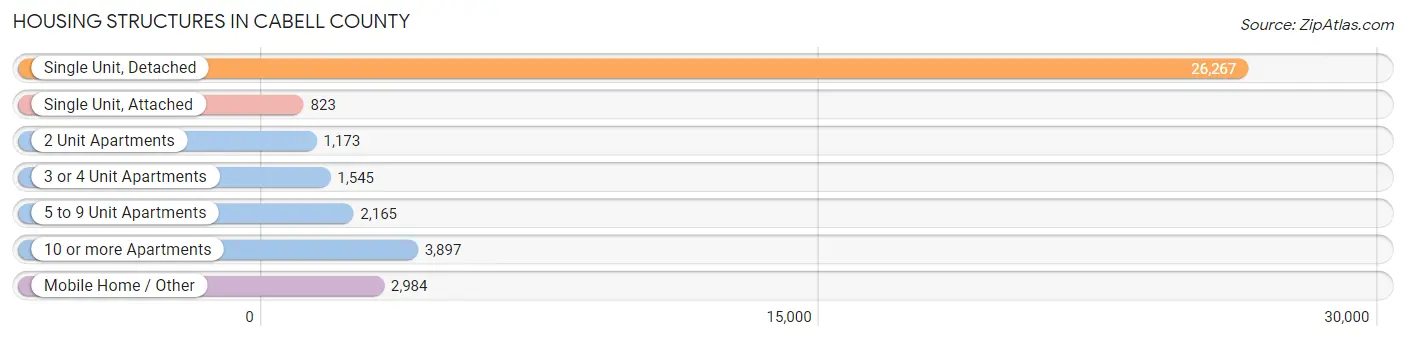
| Structure Type | # Housing Units | % Housing Units |
| Single Unit, Detached | 26,267 | 67.6% |
| Single Unit, Attached | 823 | 2.1% |
| 2 Unit Apartments | 1,173 | 3.0% |
| 3 or 4 Unit Apartments | 1,545 | 4.0% |
| 5 to 9 Unit Apartments | 2,165 | 5.6% |
| 10 or more Apartments | 3,897 | 10.0% |
| Mobile Home / Other | 2,984 | 7.7% |
| Total | 38,854 | 100.0% |
Housing Structures by Occupancy in Cabell County
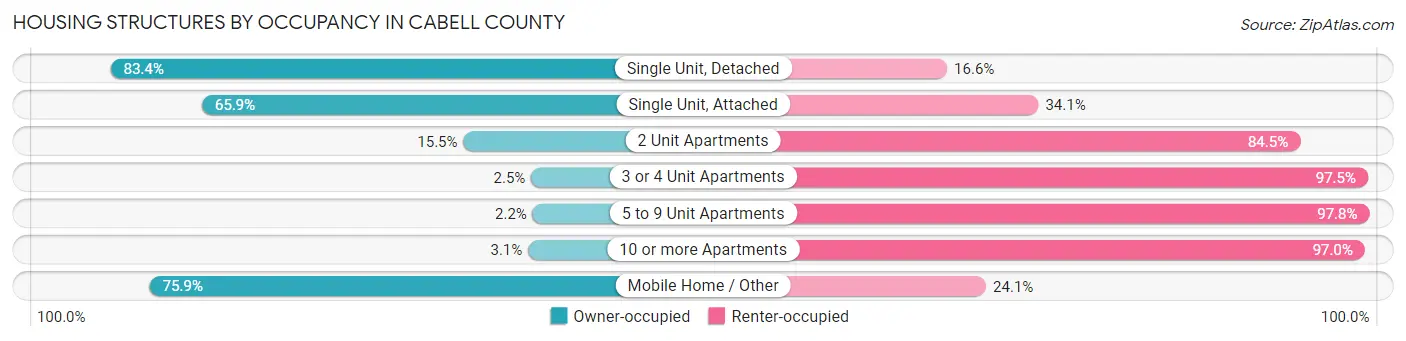
| Structure Type | Owner-occupied | Renter-occupied |
| Single Unit, Detached | 21,916 (83.4%) | 4,351 (16.6%) |
| Single Unit, Attached | 542 (65.9%) | 281 (34.1%) |
| 2 Unit Apartments | 182 (15.5%) | 991 (84.5%) |
| 3 or 4 Unit Apartments | 38 (2.5%) | 1,507 (97.5%) |
| 5 to 9 Unit Apartments | 47 (2.2%) | 2,118 (97.8%) |
| 10 or more Apartments | 119 (3.0%) | 3,778 (97.0%) |
| Mobile Home / Other | 2,266 (75.9%) | 718 (24.1%) |
| Total | 25,110 (64.6%) | 13,744 (35.4%) |
Housing Structures by Number of Rooms in Cabell County
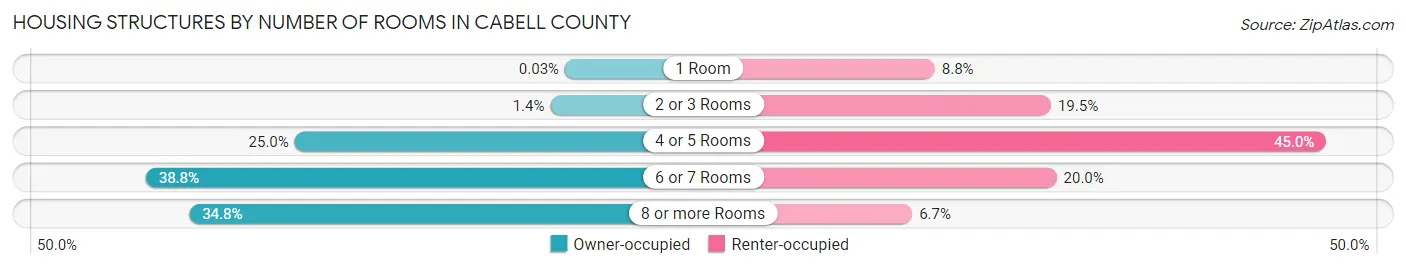
| Number of Rooms | Owner-occupied | Renter-occupied |
| 1 Room | 7 (0.0%) | 1,207 (8.8%) |
| 2 or 3 Rooms | 346 (1.4%) | 2,683 (19.5%) |
| 4 or 5 Rooms | 6,284 (25.0%) | 6,180 (45.0%) |
| 6 or 7 Rooms | 9,741 (38.8%) | 2,754 (20.0%) |
| 8 or more Rooms | 8,732 (34.8%) | 920 (6.7%) |
| Total | 25,110 (100.0%) | 13,744 (100.0%) |
Housing Structure by Heating Type in Cabell County
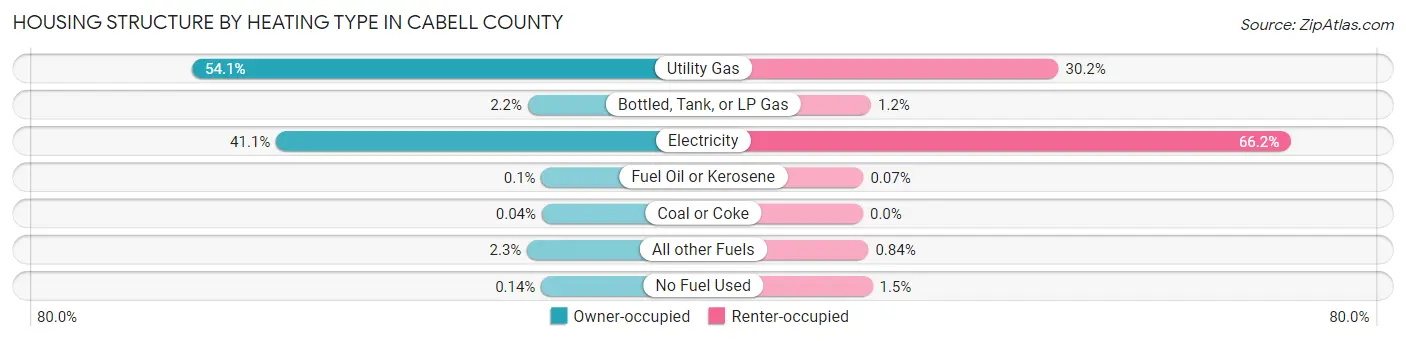
| Heating Type | Owner-occupied | Renter-occupied |
| Utility Gas | 13,583 (54.1%) | 4,155 (30.2%) |
| Bottled, Tank, or LP Gas | 556 (2.2%) | 171 (1.2%) |
| Electricity | 10,323 (41.1%) | 9,092 (66.1%) |
| Fuel Oil or Kerosene | 26 (0.1%) | 9 (0.1%) |
| Coal or Coke | 9 (0.0%) | 0 (0.0%) |
| All other Fuels | 579 (2.3%) | 115 (0.8%) |
| No Fuel Used | 34 (0.1%) | 202 (1.5%) |
| Total | 25,110 (100.0%) | 13,744 (100.0%) |
Household Vehicle Usage in Cabell County
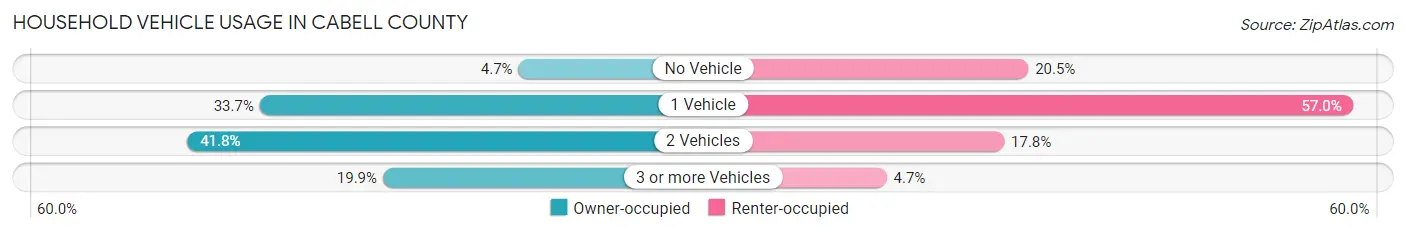
| Vehicles per Household | Owner-occupied | Renter-occupied |
| No Vehicle | 1,176 (4.7%) | 2,821 (20.5%) |
| 1 Vehicle | 8,452 (33.7%) | 7,831 (57.0%) |
| 2 Vehicles | 10,492 (41.8%) | 2,450 (17.8%) |
| 3 or more Vehicles | 4,990 (19.9%) | 642 (4.7%) |
| Total | 25,110 (100.0%) | 13,744 (100.0%) |
Real Estate & Mortgages in Cabell County
Real Estate and Mortgage Overview in Cabell County
| Characteristic | Without Mortgage | With Mortgage |
| Housing Units | 12,642 | 12,468 |
| Median Property Value | $123,900 | $158,800 |
| Median Household Income | $50,071 | $2,201 |
| Monthly Housing Costs | $419 | $313 |
| Real Estate Taxes | $775 | $298 |
Property Value by Mortgage Status in Cabell County
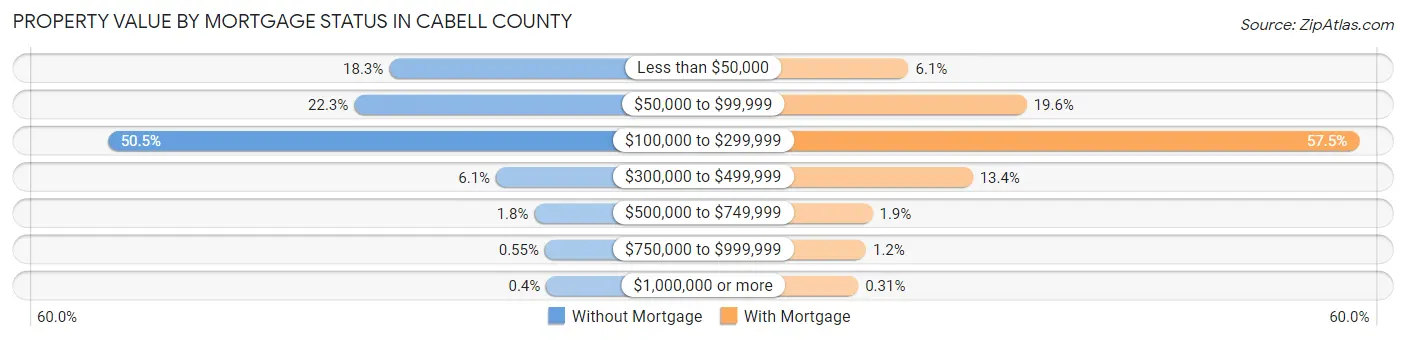
| Property Value | Without Mortgage | With Mortgage |
| Less than $50,000 | 2,318 (18.3%) | 755 (6.1%) |
| $50,000 to $99,999 | 2,824 (22.3%) | 2,439 (19.6%) |
| $100,000 to $299,999 | 6,384 (50.5%) | 7,174 (57.5%) |
| $300,000 to $499,999 | 775 (6.1%) | 1,669 (13.4%) |
| $500,000 to $749,999 | 221 (1.8%) | 242 (1.9%) |
| $750,000 to $999,999 | 70 (0.5%) | 150 (1.2%) |
| $1,000,000 or more | 50 (0.4%) | 39 (0.3%) |
| Total | 12,642 (100.0%) | 12,468 (100.0%) |
Household Income by Mortgage Status in Cabell County
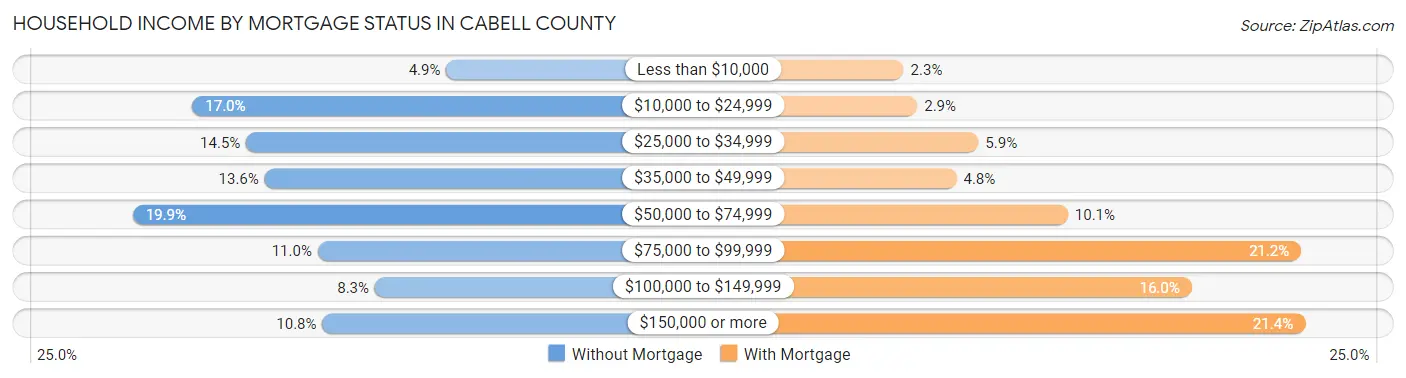
| Household Income | Without Mortgage | With Mortgage |
| Less than $10,000 | 622 (4.9%) | 285 (2.3%) |
| $10,000 to $24,999 | 2,151 (17.0%) | 367 (2.9%) |
| $25,000 to $34,999 | 1,827 (14.4%) | 729 (5.9%) |
| $35,000 to $49,999 | 1,716 (13.6%) | 600 (4.8%) |
| $50,000 to $74,999 | 2,510 (19.9%) | 1,261 (10.1%) |
| $75,000 to $99,999 | 1,396 (11.0%) | 2,646 (21.2%) |
| $100,000 to $149,999 | 1,052 (8.3%) | 1,996 (16.0%) |
| $150,000 or more | 1,368 (10.8%) | 2,668 (21.4%) |
| Total | 12,642 (100.0%) | 12,468 (100.0%) |
Property Value to Household Income Ratio in Cabell County
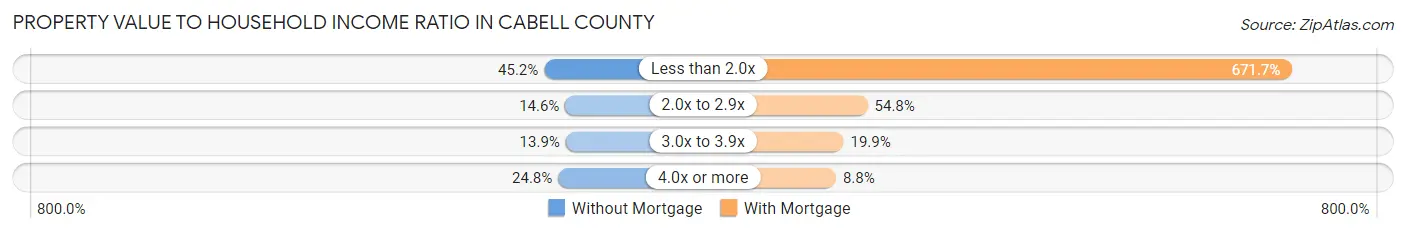
| Value-to-Income Ratio | Without Mortgage | With Mortgage |
| Less than 2.0x | 5,714 (45.2%) | 83,744 (671.7%) |
| 2.0x to 2.9x | 1,841 (14.6%) | 6,826 (54.7%) |
| 3.0x to 3.9x | 1,761 (13.9%) | 2,476 (19.9%) |
| 4.0x or more | 3,140 (24.8%) | 1,098 (8.8%) |
| Total | 12,642 (100.0%) | 12,468 (100.0%) |
Real Estate Taxes by Mortgage Status in Cabell County
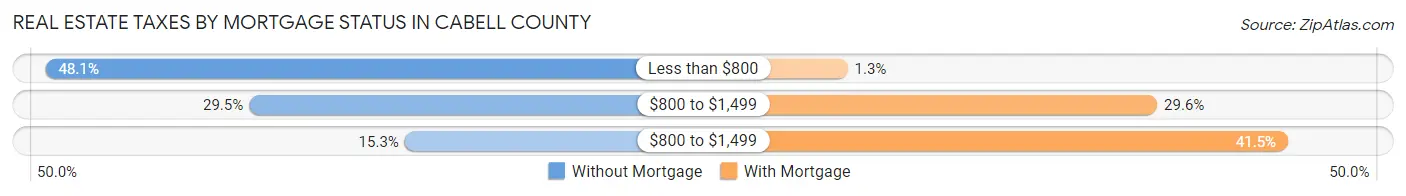
| Property Taxes | Without Mortgage | With Mortgage |
| Less than $800 | 6,079 (48.1%) | 166 (1.3%) |
| $800 to $1,499 | 3,729 (29.5%) | 3,690 (29.6%) |
| $800 to $1,499 | 1,933 (15.3%) | 5,179 (41.5%) |
| Total | 12,642 (100.0%) | 12,468 (100.0%) |
Health & Disability in Cabell County
Health Insurance Coverage by Age in Cabell County
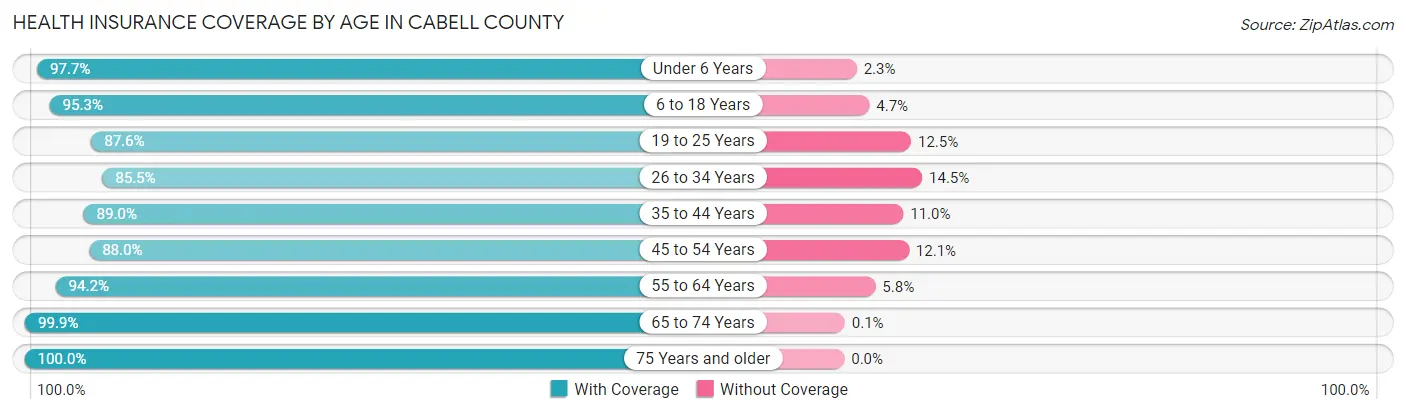
| Age Bracket | With Coverage | Without Coverage |
| Under 6 Years | 6,057 (97.7%) | 144 (2.3%) |
| 6 to 18 Years | 13,076 (95.3%) | 641 (4.7%) |
| 19 to 25 Years | 11,069 (87.5%) | 1,574 (12.4%) |
| 26 to 34 Years | 8,496 (85.5%) | 1,442 (14.5%) |
| 35 to 44 Years | 9,232 (89.0%) | 1,142 (11.0%) |
| 45 to 54 Years | 9,322 (87.9%) | 1,277 (12.0%) |
| 55 to 64 Years | 10,470 (94.2%) | 645 (5.8%) |
| 65 to 74 Years | 10,176 (99.9%) | 10 (0.1%) |
| 75 Years and older | 7,326 (100.0%) | 0 (0.0%) |
| Total | 85,224 (92.5%) | 6,875 (7.5%) |
Health Insurance Coverage by Citizenship Status in Cabell County
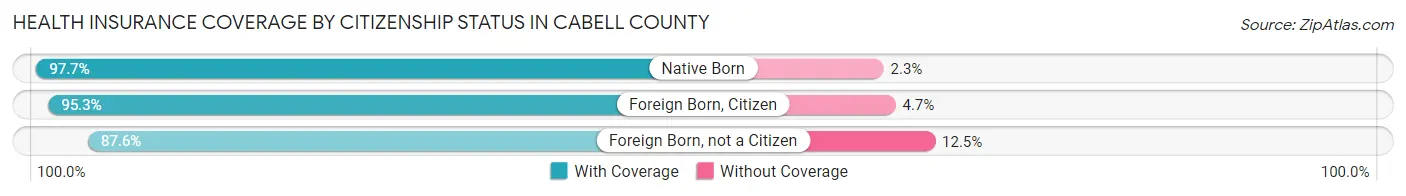
| Citizenship Status | With Coverage | Without Coverage |
| Native Born | 6,057 (97.7%) | 144 (2.3%) |
| Foreign Born, Citizen | 13,076 (95.3%) | 641 (4.7%) |
| Foreign Born, not a Citizen | 11,069 (87.5%) | 1,574 (12.4%) |
Health Insurance Coverage by Household Income in Cabell County
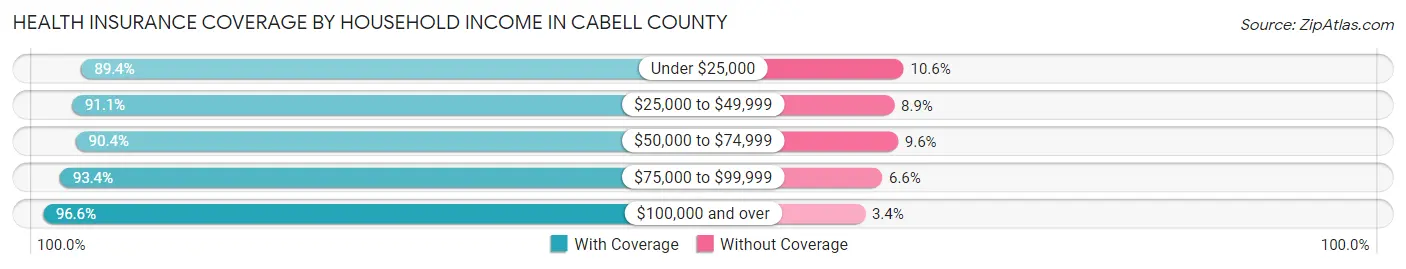
| Household Income | With Coverage | Without Coverage |
| Under $25,000 | 16,931 (89.4%) | 2,015 (10.6%) |
| $25,000 to $49,999 | 15,202 (91.1%) | 1,480 (8.9%) |
| $50,000 to $74,999 | 15,420 (90.4%) | 1,632 (9.6%) |
| $75,000 to $99,999 | 10,580 (93.4%) | 748 (6.6%) |
| $100,000 and over | 24,552 (96.6%) | 867 (3.4%) |
Public vs Private Health Insurance Coverage by Age in Cabell County
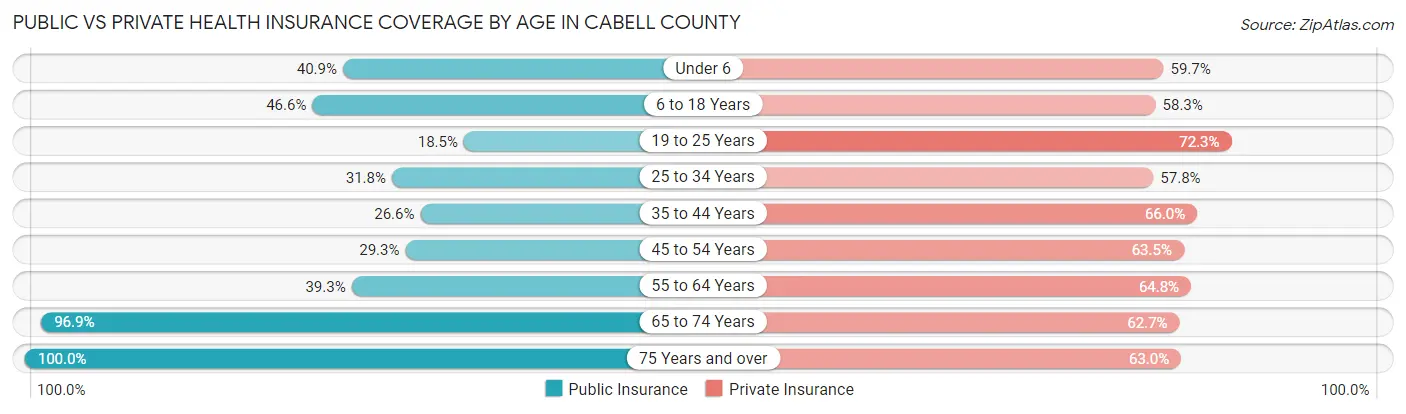
| Age Bracket | Public Insurance | Private Insurance |
| Under 6 | 2,538 (40.9%) | 3,703 (59.7%) |
| 6 to 18 Years | 6,393 (46.6%) | 7,990 (58.3%) |
| 19 to 25 Years | 2,336 (18.5%) | 9,141 (72.3%) |
| 25 to 34 Years | 3,164 (31.8%) | 5,748 (57.8%) |
| 35 to 44 Years | 2,754 (26.6%) | 6,842 (65.9%) |
| 45 to 54 Years | 3,110 (29.3%) | 6,726 (63.5%) |
| 55 to 64 Years | 4,370 (39.3%) | 7,203 (64.8%) |
| 65 to 74 Years | 9,871 (96.9%) | 6,384 (62.7%) |
| 75 Years and over | 7,323 (100.0%) | 4,613 (63.0%) |
| Total | 41,859 (45.5%) | 58,350 (63.4%) |
Disability Status by Sex by Age in Cabell County
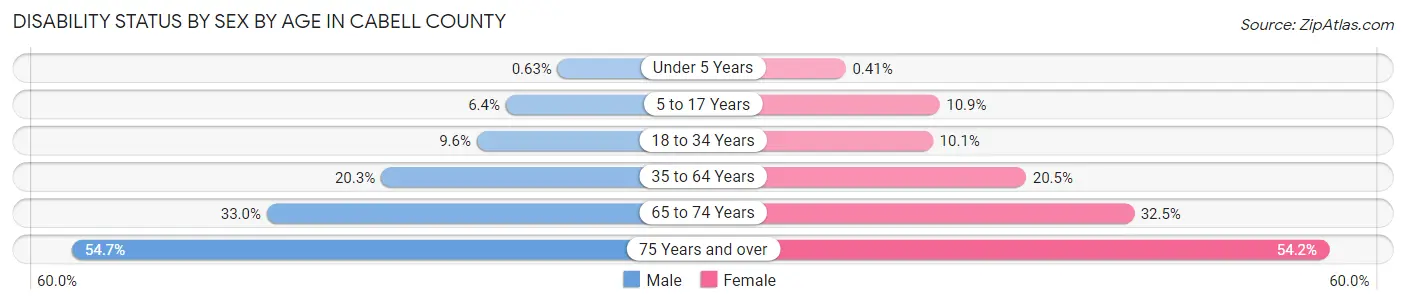
| Age Bracket | Male | Female |
| Under 5 Years | 16 (0.6%) | 10 (0.4%) |
| 5 to 17 Years | 447 (6.4%) | 697 (10.9%) |
| 18 to 34 Years | 1,127 (9.6%) | 1,263 (10.1%) |
| 35 to 64 Years | 3,217 (20.3%) | 3,330 (20.5%) |
| 65 to 74 Years | 1,548 (33.0%) | 1,788 (32.5%) |
| 75 Years and over | 1,585 (54.7%) | 2,403 (54.2%) |
Disability Class by Sex by Age in Cabell County
Disability Class: Hearing Difficulty
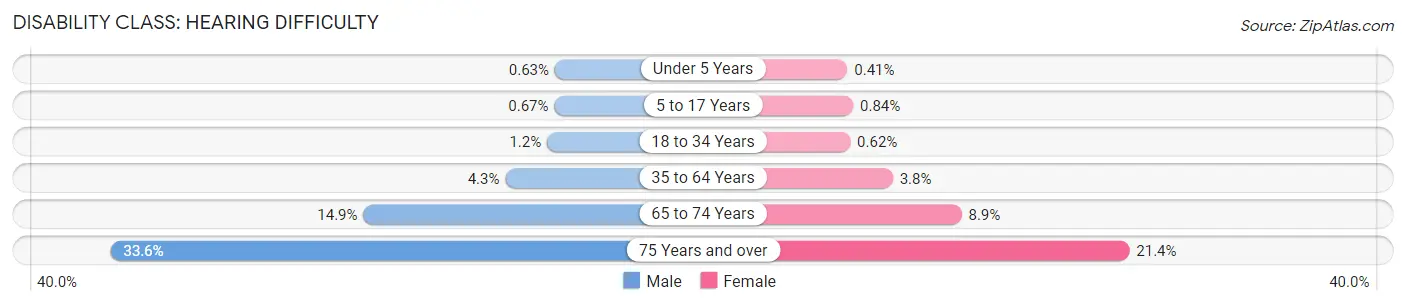
| Age Bracket | Male | Female |
| Under 5 Years | 16 (0.6%) | 10 (0.4%) |
| 5 to 17 Years | 47 (0.7%) | 54 (0.8%) |
| 18 to 34 Years | 142 (1.2%) | 77 (0.6%) |
| 35 to 64 Years | 682 (4.3%) | 614 (3.8%) |
| 65 to 74 Years | 696 (14.8%) | 489 (8.9%) |
| 75 Years and over | 974 (33.6%) | 946 (21.3%) |
Disability Class: Vision Difficulty
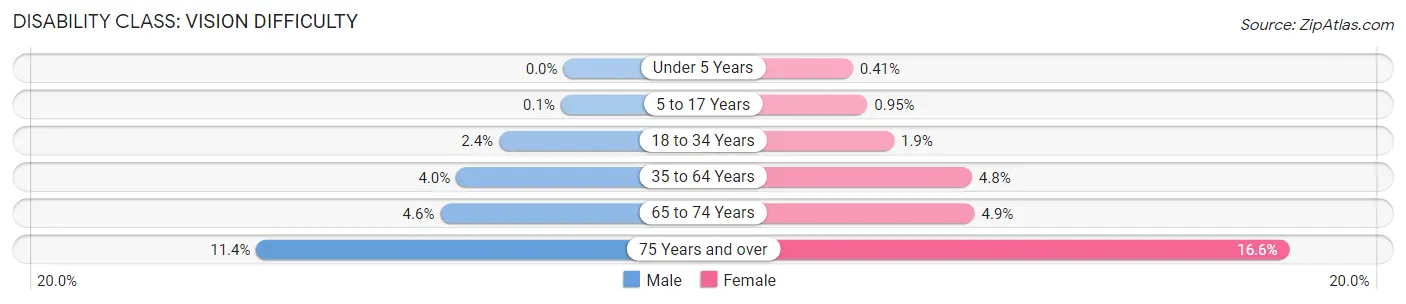
| Age Bracket | Male | Female |
| Under 5 Years | 0 (0.0%) | 10 (0.4%) |
| 5 to 17 Years | 7 (0.1%) | 61 (0.9%) |
| 18 to 34 Years | 279 (2.4%) | 242 (1.9%) |
| 35 to 64 Years | 631 (4.0%) | 785 (4.8%) |
| 65 to 74 Years | 214 (4.6%) | 271 (4.9%) |
| 75 Years and over | 330 (11.4%) | 736 (16.6%) |
Disability Class: Cognitive Difficulty
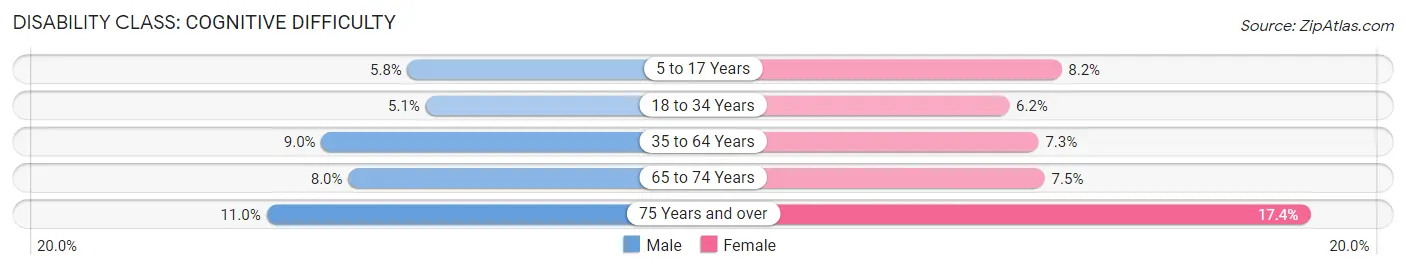
| Age Bracket | Male | Female |
| 5 to 17 Years | 403 (5.8%) | 523 (8.2%) |
| 18 to 34 Years | 597 (5.1%) | 775 (6.2%) |
| 35 to 64 Years | 1,423 (9.0%) | 1,186 (7.3%) |
| 65 to 74 Years | 374 (8.0%) | 414 (7.5%) |
| 75 Years and over | 319 (11.0%) | 770 (17.4%) |
Disability Class: Ambulatory Difficulty
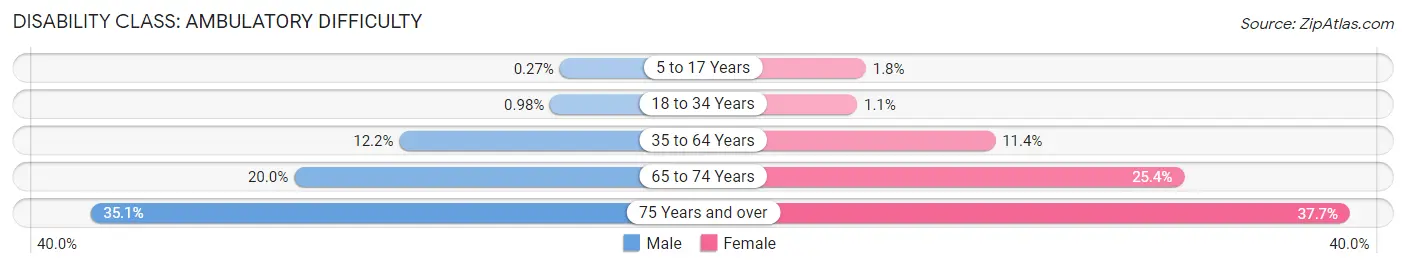
| Age Bracket | Male | Female |
| 5 to 17 Years | 19 (0.3%) | 114 (1.8%) |
| 18 to 34 Years | 115 (1.0%) | 141 (1.1%) |
| 35 to 64 Years | 1,929 (12.2%) | 1,851 (11.4%) |
| 65 to 74 Years | 937 (20.0%) | 1,398 (25.4%) |
| 75 Years and over | 1,017 (35.1%) | 1,671 (37.7%) |
Disability Class: Self-Care Difficulty
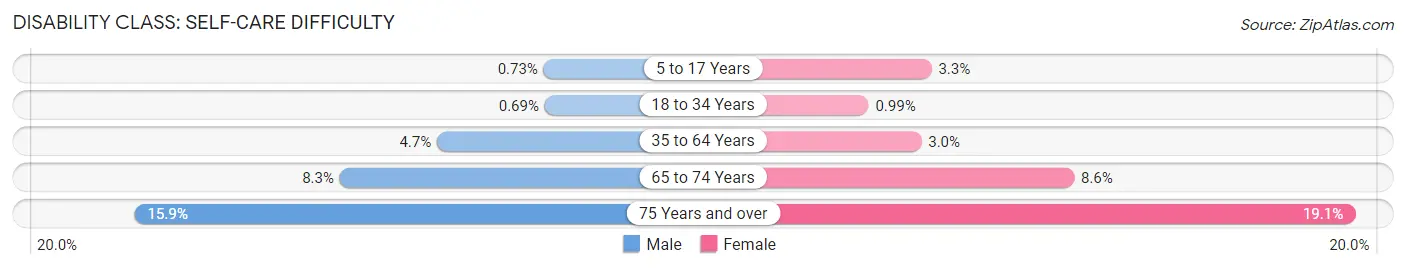
| Age Bracket | Male | Female |
| 5 to 17 Years | 51 (0.7%) | 214 (3.3%) |
| 18 to 34 Years | 81 (0.7%) | 124 (1.0%) |
| 35 to 64 Years | 743 (4.7%) | 480 (2.9%) |
| 65 to 74 Years | 389 (8.3%) | 474 (8.6%) |
| 75 Years and over | 461 (15.9%) | 844 (19.1%) |
Technology Access in Cabell County
Computing Device Access in Cabell County
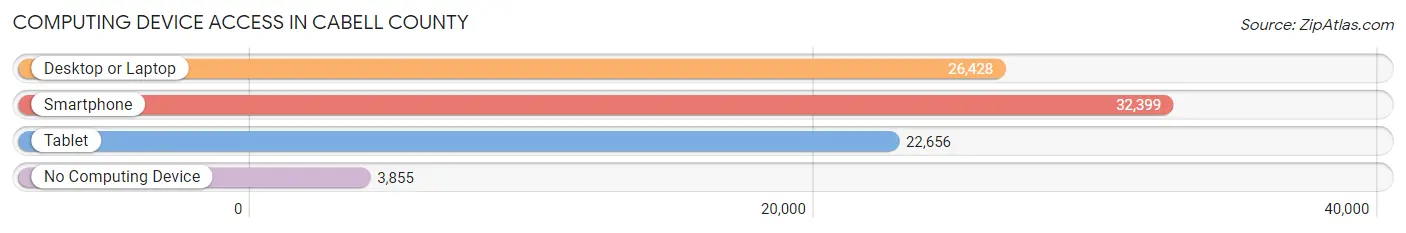
| Device Type | # Households | % Households |
| Desktop or Laptop | 26,428 | 68.0% |
| Smartphone | 32,399 | 83.4% |
| Tablet | 22,656 | 58.3% |
| No Computing Device | 3,855 | 9.9% |
| Total | 38,854 | 100.0% |
Internet Access in Cabell County
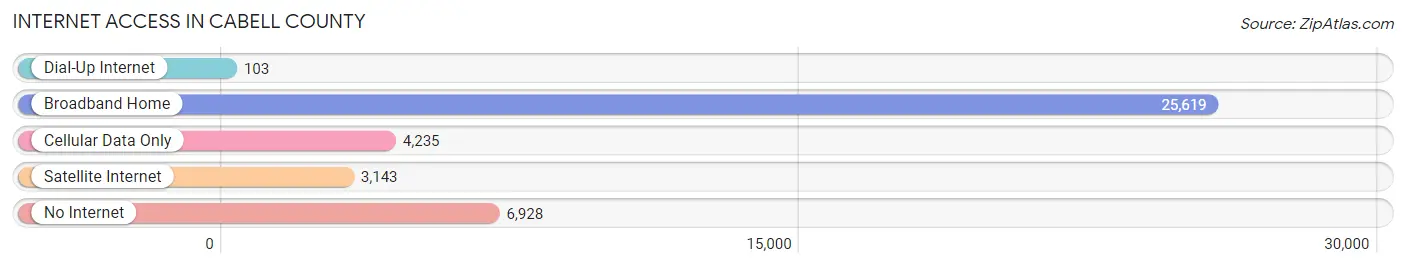
| Internet Type | # Households | % Households |
| Dial-Up Internet | 103 | 0.3% |
| Broadband Home | 25,619 | 65.9% |
| Cellular Data Only | 4,235 | 10.9% |
| Satellite Internet | 3,143 | 8.1% |
| No Internet | 6,928 | 17.8% |
| Total | 38,854 | 100.0% |
Cabell County Summary
Cabell County, West Virginia is located in the southwestern part of the state and is part of the Huntington-Ashland Metropolitan Statistical Area. It is bordered by Wayne County to the north, Putnam County to the east, Lincoln County to the south, and Mason County to the west. The county seat is Huntington, which is the largest city in the county and the second largest city in the state.
Cabell County was created in 1809 from part of Kanawha County and named for William H. Cabell, the Governor of Virginia from 1805 to 1808. The county was originally part of the Virginia Colony and was part of the state of Virginia until 1863 when it became part of the new state of West Virginia.
The county has a total area of 437 square miles, of which 433 square miles is land and 4.2 square miles is water. The terrain is mostly rolling hills and valleys, with the Ohio River forming the western border of the county. The county is home to several state parks, including Beech Fork State Park, Chief Cornstalk State Park, and Little Beaver State Park.
As of the 2010 census, the population of Cabell County was 96,319, making it the fifth most populous county in West Virginia. The population has grown steadily since the 2000 census, when it was 87,902. The population is spread out with a median age of 38.7 years. The racial makeup of the county is 90.2% White, 6.2% African American, 0.5% Native American, 1.2% Asian, 0.1% Pacific Islander, 0.7% from other races, and 1.1% from two or more races.
The economy of Cabell County is largely based on healthcare, education, and retail. The largest employers in the county are Cabell Huntington Hospital, Marshall University, St. Mary's Medical Center, and Walmart. The median household income in the county is $41,845, and the median family income is $50,845. The poverty rate is 17.2%, which is higher than the state average of 16.2%.
Cabell County is served by the Cabell County School District, which consists of 24 elementary schools, 8 middle schools, and 5 high schools. The county is also home to Marshall University, which is a public research university with an enrollment of over 13,000 students.
Cabell County is a great place to live, work, and play. It has a rich history, beautiful scenery, and a strong economy. With its diverse population, excellent schools, and numerous recreational opportunities, Cabell County is a great place to call home.
Common Questions
What is the Total Population of Cabell County?
Total Population of Cabell County is 93,965.
What is the Total Male Population of Cabell County?
Total Male Population of Cabell County is 45,862.
What is the Total Female Population of Cabell County?
Total Female Population of Cabell County is 48,103.
What is the Ratio of Males per 100 Females in Cabell County?
There are 95.34 Males per 100 Females in Cabell County.
What is the Ratio of Females per 100 Males in Cabell County?
There are 104.89 Females per 100 Males in Cabell County.
What is the Median Population Age in Cabell County?
Median Population Age in Cabell County is 39.1 Years.
What is the Average Family Size in Cabell County
Average Family Size in Cabell County is 3.0 People.
What is the Average Household Size in Cabell County
Average Household Size in Cabell County is 2.3 People.
What is Per Capita Income in Cabell County?
Per Capita income in Cabell County is $30,068.
What is the Median Family Income in Cabell County?
Median Family Income in Cabell County is $68,234.
What is the Median Household income in Cabell County?
Median Household Income in Cabell County is $48,944.
What is Income or Wage Gap in Cabell County?
Income or Wage Gap in Cabell County is 27.0%.
Women in Cabell County earn 73.0 cents for every dollar earned by a man.
What is Family Income Deficit in Cabell County?
Family Income Deficit in Cabell County is $11,873.
Families that are below poverty line in Cabell County earn $11,873 less on average than the poverty threshold level.
What is Inequality or Gini Index in Cabell County?
Inequality or Gini Index in Cabell County is 0.50.
How Large is the Labor Force in Cabell County?
There are 42,964 People in the Labor Forcein in Cabell County.
What is the Percentage of People in the Labor Force in Cabell County?
55.5% of People are in the Labor Force in Cabell County.
What is the Unemployment Rate in Cabell County?
Unemployment Rate in Cabell County is 6.1%.