Brooke County, WV
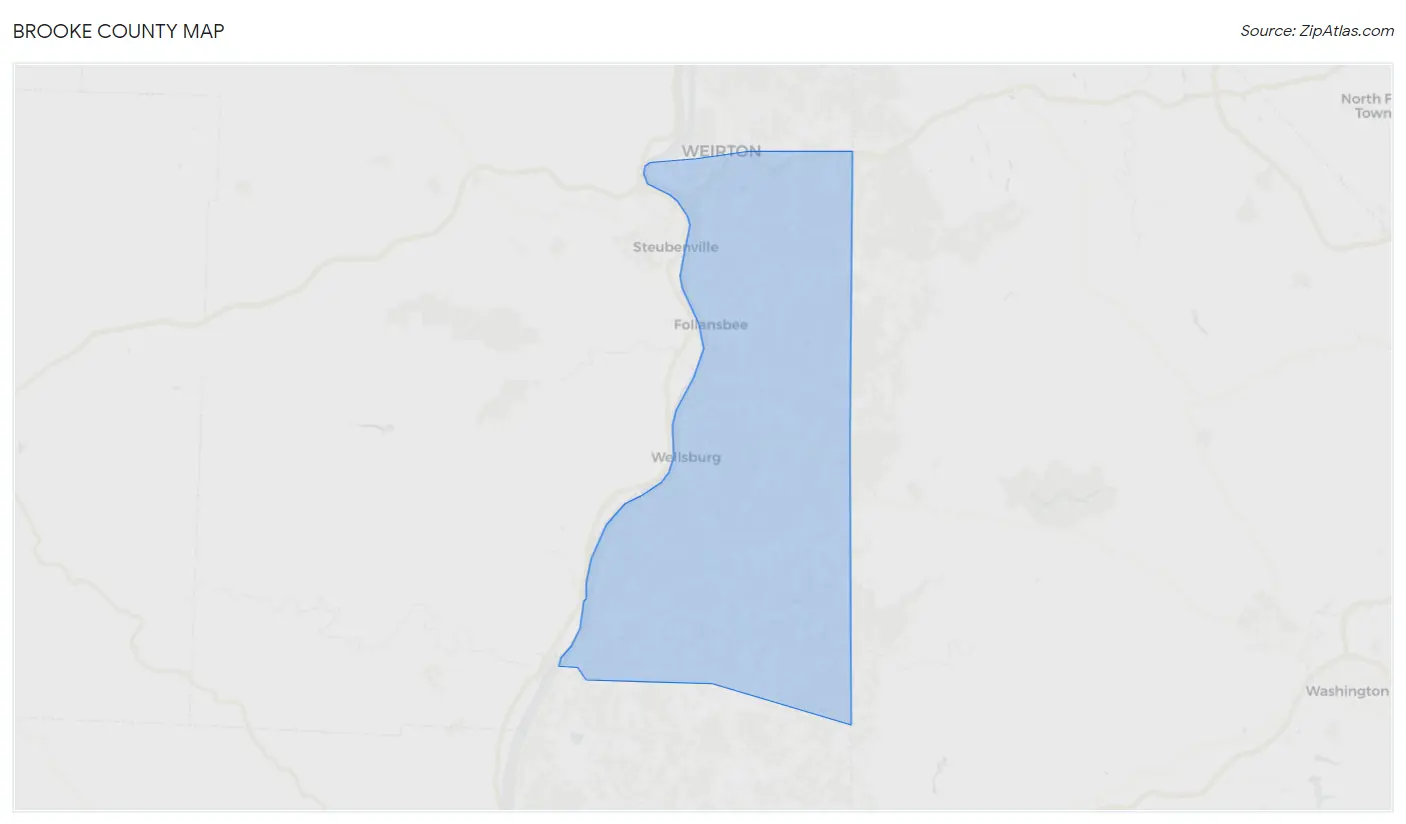
Brooke County Map
Brooke County Overview
22,349
TOTAL POPULATION
11,092
MALE POPULATION
11,257
FEMALE POPULATION
98.53
MALES / 100 FEMALES
101.49
FEMALES / 100 MALES
46.4
MEDIAN AGE
2.9
AVG FAMILY SIZE
2.2
AVG HOUSEHOLD SIZE
$30,400
PER CAPITA INCOME
$73,380
AVG FAMILY INCOME
$51,963
AVG HOUSEHOLD INCOME
30.4%
WAGE / INCOME GAP [ % ]
69.6¢/ $1
WAGE / INCOME GAP [ $ ]
$10,259
FAMILY INCOME DEFICIT
0.41
INEQUALITY / GINI INDEX
10,215
LABOR FORCE [ PEOPLE ]
54.0%
PERCENT IN LABOR FORCE
5.7%
UNEMPLOYMENT RATE
Brooke County Area Codes
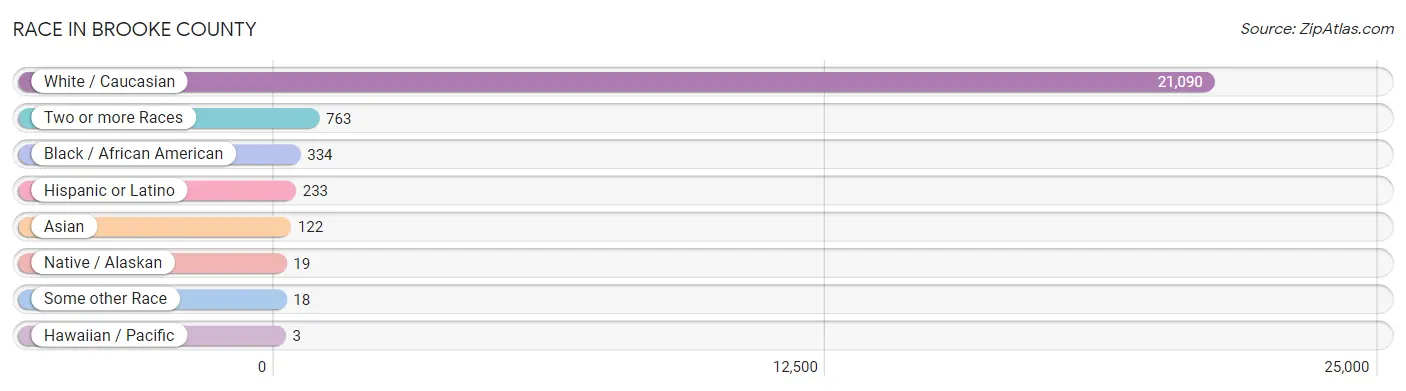
Race in Brooke County
The most populous races in Brooke County are White / Caucasian (21,090 | 94.4%), Two or more Races (763 | 3.4%), and Black / African American (334 | 1.5%).
| Race | # Population | % Population |
| Asian | 122 | 0.5% |
| Black / African American | 334 | 1.5% |
| Hawaiian / Pacific | 3 | 0.0% |
| Hispanic or Latino | 233 | 1.0% |
| Native / Alaskan | 19 | 0.1% |
| White / Caucasian | 21,090 | 94.4% |
| Two or more Races | 763 | 3.4% |
| Some other Race | 18 | 0.1% |
| Total | 22,349 | 100.0% |
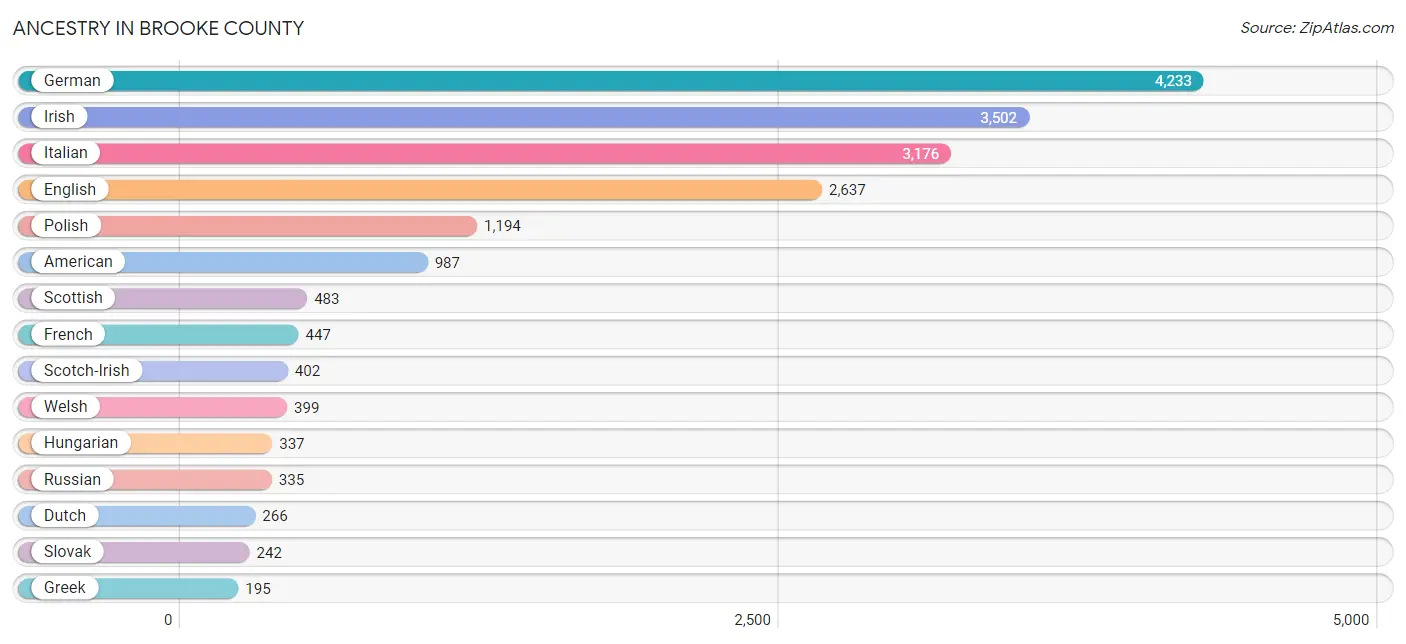
Ancestry in Brooke County
The most populous ancestries reported in Brooke County are German (4,233 | 18.9%), Irish (3,502 | 15.7%), Italian (3,176 | 14.2%), English (2,637 | 11.8%), and Polish (1,194 | 5.3%), together accounting for 66.0% of all Brooke County residents.
| Ancestry | # Population | % Population |
| American | 987 | 4.4% |
| Arab | 79 | 0.4% |
| Armenian | 1 | 0.0% |
| Australian | 5 | 0.0% |
| Austrian | 50 | 0.2% |
| Belgian | 52 | 0.2% |
| Bhutanese | 3 | 0.0% |
| Blackfeet | 2 | 0.0% |
| British | 63 | 0.3% |
| British West Indian | 19 | 0.1% |
| Celtic | 2 | 0.0% |
| Central American | 22 | 0.1% |
| Cherokee | 75 | 0.3% |
| Costa Rican | 8 | 0.0% |
| Croatian | 101 | 0.4% |
| Cuban | 16 | 0.1% |
| Czech | 138 | 0.6% |
| Czechoslovakian | 27 | 0.1% |
| Danish | 13 | 0.1% |
| Dominican | 1 | 0.0% |
| Dutch | 266 | 1.2% |
| Eastern European | 129 | 0.6% |
| Egyptian | 34 | 0.2% |
| English | 2,637 | 11.8% |
| European | 77 | 0.3% |
| Fijian | 10 | 0.0% |
| Filipino | 2 | 0.0% |
| Finnish | 27 | 0.1% |
| French | 447 | 2.0% |
| French American Indian | 1 | 0.0% |
| French Canadian | 8 | 0.0% |
| German | 4,233 | 18.9% |
| Ghanaian | 3 | 0.0% |
| Greek | 195 | 0.9% |
| Guamanian / Chamorro | 3 | 0.0% |
| Guatemalan | 14 | 0.1% |
| Guyanese | 4 | 0.0% |
| Hungarian | 337 | 1.5% |
| Icelander | 89 | 0.4% |
| Indian (Asian) | 13 | 0.1% |
| Irish | 3,502 | 15.7% |
| Italian | 3,176 | 14.2% |
| Korean | 31 | 0.1% |
| Lebanese | 3 | 0.0% |
| Lithuanian | 29 | 0.1% |
| Luxembourger | 61 | 0.3% |
| Mexican | 131 | 0.6% |
| Moroccan | 41 | 0.2% |
| Northern European | 11 | 0.1% |
| Norwegian | 102 | 0.5% |
| Palestinian | 1 | 0.0% |
| Pennsylvania German | 49 | 0.2% |
| Pima | 10 | 0.0% |
| Polish | 1,194 | 5.3% |
| Portuguese | 13 | 0.1% |
| Puerto Rican | 13 | 0.1% |
| Romanian | 34 | 0.2% |
| Russian | 335 | 1.5% |
| Scandinavian | 44 | 0.2% |
| Scotch-Irish | 402 | 1.8% |
| Scottish | 483 | 2.2% |
| Serbian | 192 | 0.9% |
| Sioux | 13 | 0.1% |
| Slavic | 14 | 0.1% |
| Slovak | 242 | 1.1% |
| Slovene | 21 | 0.1% |
| Spaniard | 15 | 0.1% |
| Spanish | 35 | 0.2% |
| Sri Lankan | 109 | 0.5% |
| Subsaharan African | 19 | 0.1% |
| Swedish | 41 | 0.2% |
| Swiss | 33 | 0.2% |
| Thai | 1 | 0.0% |
| Ukrainian | 29 | 0.1% |
| Welsh | 399 | 1.8% | View All 75 Rows |
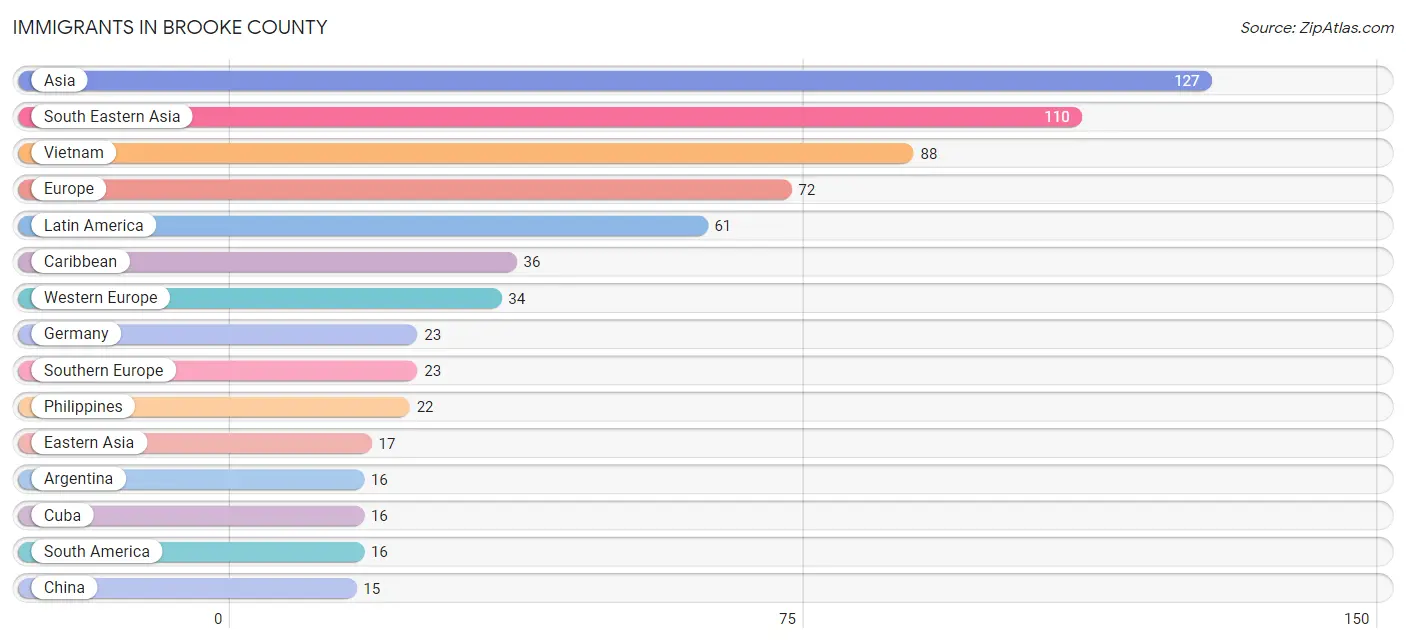
Immigrants in Brooke County
The most numerous immigrant groups reported in Brooke County came from Asia (127 | 0.6%), South Eastern Asia (110 | 0.5%), Vietnam (88 | 0.4%), Europe (72 | 0.3%), and Latin America (61 | 0.3%), together accounting for 2.0% of all Brooke County residents.
| Immigration Origin | # Population | % Population |
| Africa | 13 | 0.1% |
| Argentina | 16 | 0.1% |
| Asia | 127 | 0.6% |
| Belgium | 11 | 0.1% |
| Canada | 13 | 0.1% |
| Caribbean | 36 | 0.2% |
| Central America | 9 | 0.0% |
| China | 15 | 0.1% |
| Costa Rica | 8 | 0.0% |
| Cuba | 16 | 0.1% |
| Dominican Republic | 1 | 0.0% |
| Eastern Asia | 17 | 0.1% |
| Europe | 72 | 0.3% |
| Germany | 23 | 0.1% |
| Greece | 9 | 0.0% |
| Italy | 14 | 0.1% |
| Japan | 2 | 0.0% |
| Latin America | 61 | 0.3% |
| Mexico | 1 | 0.0% |
| Morocco | 13 | 0.1% |
| Northern Africa | 13 | 0.1% |
| Northern Europe | 15 | 0.1% |
| Philippines | 22 | 0.1% |
| South America | 16 | 0.1% |
| South Eastern Asia | 110 | 0.5% |
| Southern Europe | 23 | 0.1% |
| Taiwan | 2 | 0.0% |
| Vietnam | 88 | 0.4% |
| Western Europe | 34 | 0.2% | View All 29 Rows |
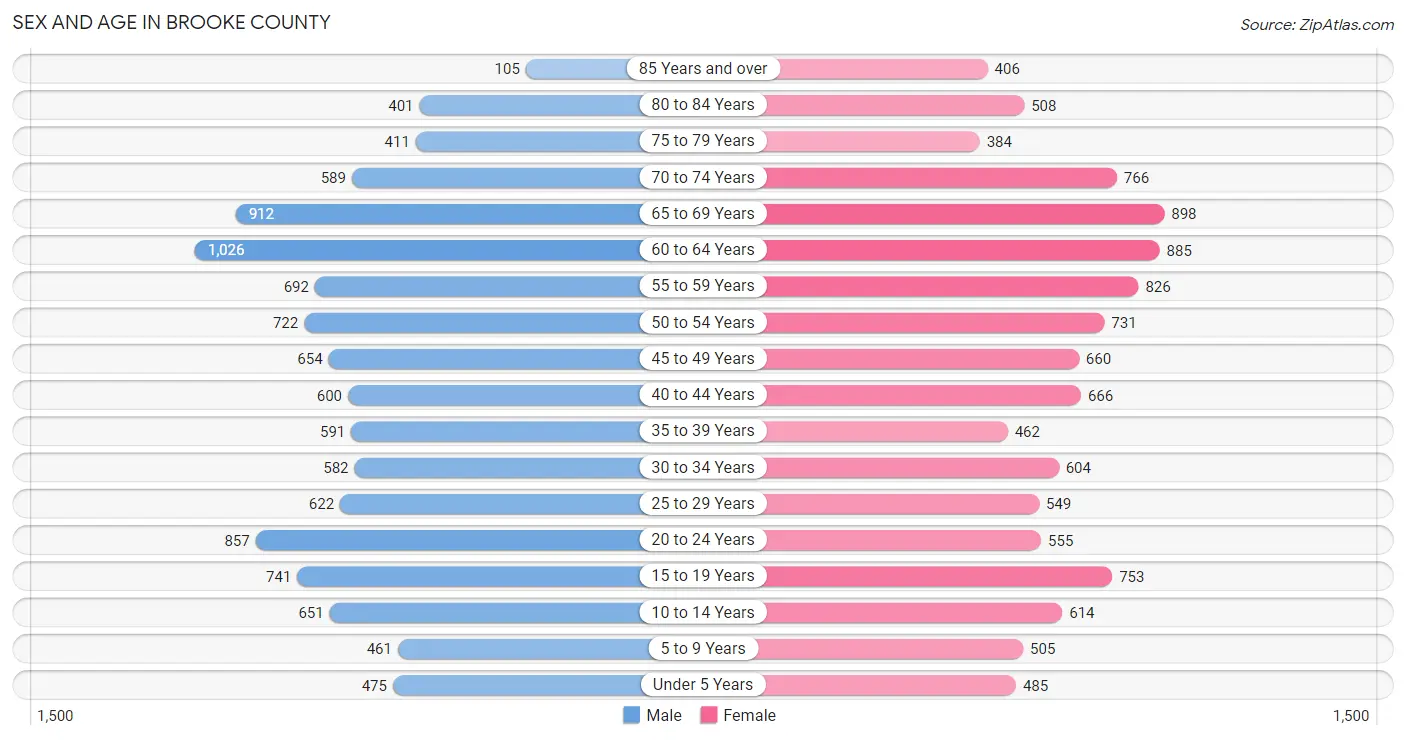
Sex and Age in Brooke County
Sex and Age in Brooke County
The most populous age groups in Brooke County are 60 to 64 Years (1,026 | 9.2%) for men and 65 to 69 Years (898 | 8.0%) for women.
| Age Bracket | Male | Female |
| Under 5 Years | 475 (4.3%) | 485 (4.3%) |
| 5 to 9 Years | 461 (4.2%) | 505 (4.5%) |
| 10 to 14 Years | 651 (5.9%) | 614 (5.4%) |
| 15 to 19 Years | 741 (6.7%) | 753 (6.7%) |
| 20 to 24 Years | 857 (7.7%) | 555 (4.9%) |
| 25 to 29 Years | 622 (5.6%) | 549 (4.9%) |
| 30 to 34 Years | 582 (5.2%) | 604 (5.4%) |
| 35 to 39 Years | 591 (5.3%) | 462 (4.1%) |
| 40 to 44 Years | 600 (5.4%) | 666 (5.9%) |
| 45 to 49 Years | 654 (5.9%) | 660 (5.9%) |
| 50 to 54 Years | 722 (6.5%) | 731 (6.5%) |
| 55 to 59 Years | 692 (6.2%) | 826 (7.3%) |
| 60 to 64 Years | 1,026 (9.2%) | 885 (7.9%) |
| 65 to 69 Years | 912 (8.2%) | 898 (8.0%) |
| 70 to 74 Years | 589 (5.3%) | 766 (6.8%) |
| 75 to 79 Years | 411 (3.7%) | 384 (3.4%) |
| 80 to 84 Years | 401 (3.6%) | 508 (4.5%) |
| 85 Years and over | 105 (0.9%) | 406 (3.6%) |
| Total | 11,092 (100.0%) | 11,257 (100.0%) |
Families and Households in Brooke County
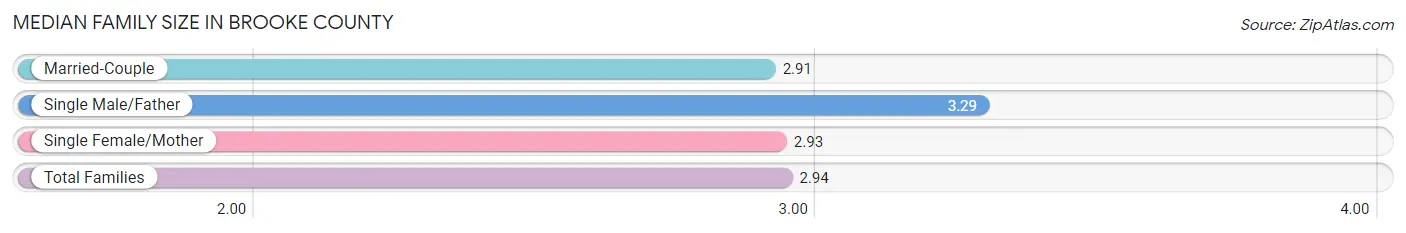
Median Family Size in Brooke County
The median family size in Brooke County is 2.94 persons per family, with single male/father families (381 | 6.9%) accounting for the largest median family size of 3.29 persons per family. On the other hand, married-couple families (4,008 | 72.9%) represent the smallest median family size with 2.91 persons per family.
| Family Type | # Families | Family Size |
| Married-Couple | 4,008 (72.9%) | 2.91 |
| Single Male/Father | 381 (6.9%) | 3.29 |
| Single Female/Mother | 1,107 (20.1%) | 2.93 |
| Total Families | 5,496 (100.0%) | 2.94 |
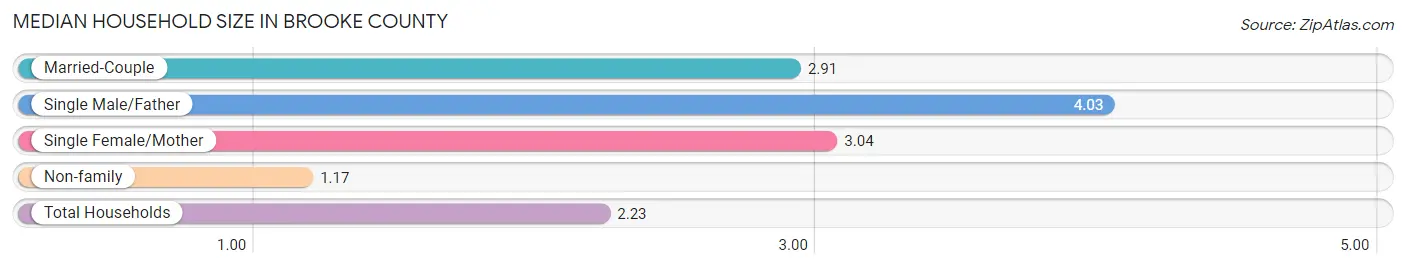
Median Household Size in Brooke County
The median household size in Brooke County is 2.23 persons per household, with single male/father households (381 | 4.0%) accounting for the largest median household size of 4.03 persons per household. non-family households (4,097 | 42.7%) represent the smallest median household size with 1.17 persons per household.
| Household Type | # Households | Household Size |
| Married-Couple | 4,008 (41.8%) | 2.91 |
| Single Male/Father | 381 (4.0%) | 4.03 |
| Single Female/Mother | 1,107 (11.5%) | 3.04 |
| Non-family | 4,097 (42.7%) | 1.17 |
| Total Households | 9,593 (100.0%) | 2.23 |
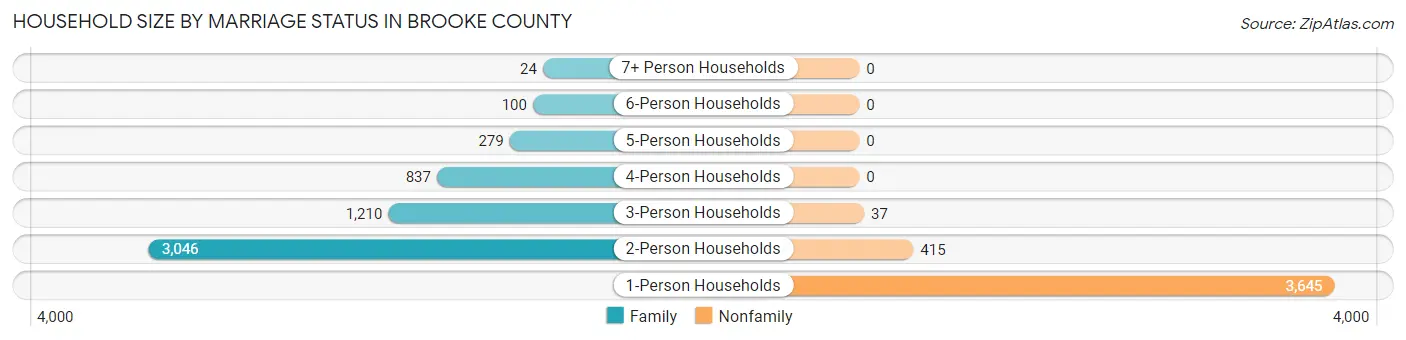
Household Size by Marriage Status in Brooke County
Out of a total of 9,593 households in Brooke County, 5,496 (57.3%) are family households, while 4,097 (42.7%) are nonfamily households. The most numerous type of family households are 2-person households, comprising 3,046, and the most common type of nonfamily households are 1-person households, comprising 3,645.
| Household Size | Family Households | Nonfamily Households |
| 1-Person Households | - | 3,645 (38.0%) |
| 2-Person Households | 3,046 (31.8%) | 415 (4.3%) |
| 3-Person Households | 1,210 (12.6%) | 37 (0.4%) |
| 4-Person Households | 837 (8.7%) | 0 (0.0%) |
| 5-Person Households | 279 (2.9%) | 0 (0.0%) |
| 6-Person Households | 100 (1.0%) | 0 (0.0%) |
| 7+ Person Households | 24 (0.3%) | 0 (0.0%) |
| Total | 5,496 (57.3%) | 4,097 (42.7%) |
Female Fertility in Brooke County
Fertility by Age in Brooke County
Average fertility rate in Brooke County is 43.0 births per 1,000 women. Women in the age bracket of 20 to 34 years have the highest fertility rate with 94.0 births per 1,000 women. Women in the age bracket of 20 to 34 years acount for 86.0% of all women with births.
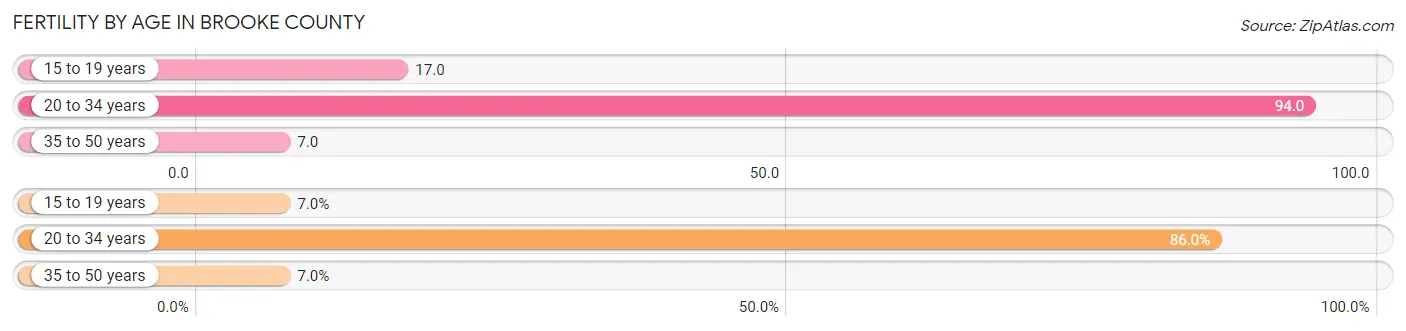
| Age Bracket | Women with Births | Births / 1,000 Women |
| 15 to 19 years | 13 (7.0%) | 17.0 |
| 20 to 34 years | 160 (86.0%) | 94.0 |
| 35 to 50 years | 13 (7.0%) | 7.0 |
| Total | 186 (100.0%) | 43.0 |
Fertility by Age by Marriage Status in Brooke County
77.4% of women with births (186) in Brooke County are married. The highest percentage of unmarried women with births falls into 15 to 19 years age bracket with 53.8% of them unmarried at the time of birth, while the lowest percentage of unmarried women with births belong to 35 to 50 years age bracket with 0.0% of them unmarried.
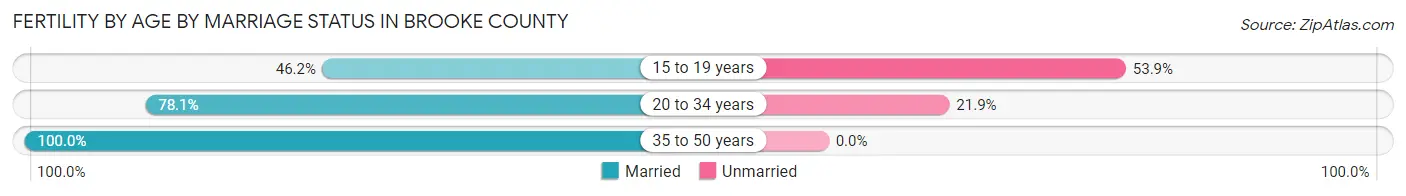
| Age Bracket | Married | Unmarried |
| 15 to 19 years | 6 (46.2%) | 7 (53.8%) |
| 20 to 34 years | 125 (78.1%) | 35 (21.9%) |
| 35 to 50 years | 13 (100.0%) | 0 (0.0%) |
| Total | 144 (77.4%) | 42 (22.6%) |
Fertility by Education in Brooke County
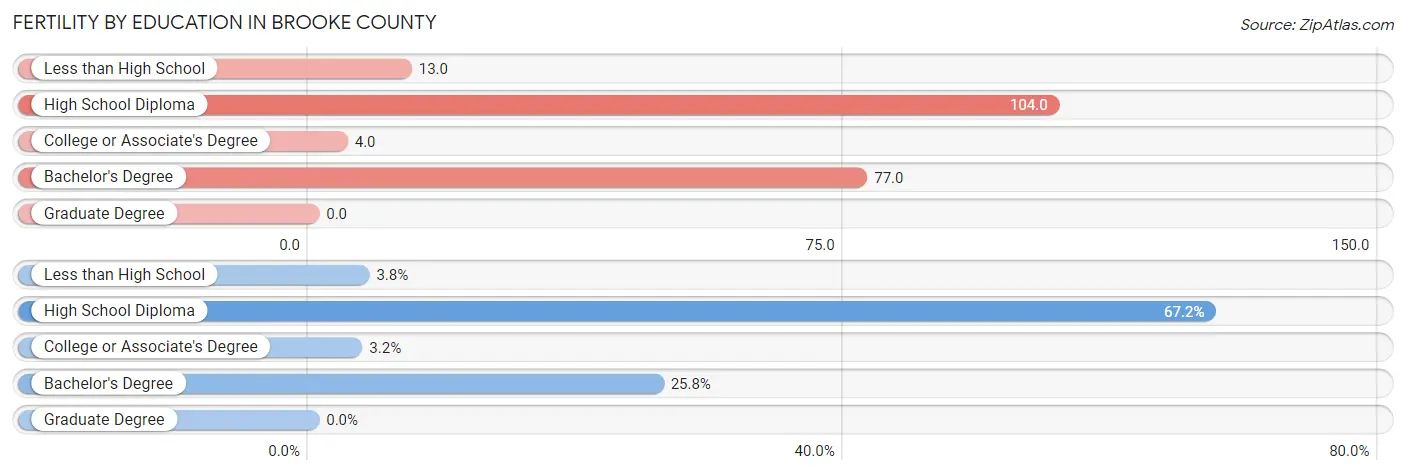
| Educational Attainment | Women with Births | Births / 1,000 Women |
| Less than High School | 7 (3.8%) | 13.0 |
| High School Diploma | 125 (67.2%) | 104.0 |
| College or Associate's Degree | 6 (3.2%) | 4.0 |
| Bachelor's Degree | 48 (25.8%) | 77.0 |
| Graduate Degree | 0 (0.0%) | 0.0 |
| Total | 186 (100.0%) | 43.0 |
Fertility by Education by Marriage Status in Brooke County
22.6% of women with births in Brooke County are unmarried. Women with the educational attainment of bachelor's degree are most likely to be married with 100.0% of them married at childbirth, while women with the educational attainment of less than high school are least likely to be married with 100.0% of them unmarried at childbirth.
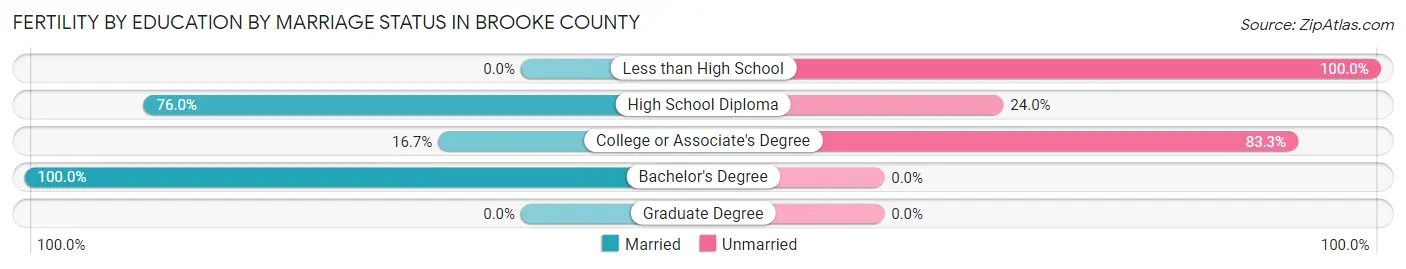
| Educational Attainment | Married | Unmarried |
| Less than High School | 0 (0.0%) | 7 (100.0%) |
| High School Diploma | 95 (76.0%) | 30 (24.0%) |
| College or Associate's Degree | 1 (16.7%) | 5 (83.3%) |
| Bachelor's Degree | 48 (100.0%) | 0 (0.0%) |
| Graduate Degree | 0 (0.0%) | 0 (0.0%) |
| Total | 144 (77.4%) | 42 (22.6%) |
Income in Brooke County
Income Overview in Brooke County
Per Capita Income in Brooke County is $30,400, while median incomes of families and households are $73,380 and $51,963 respectively.
| Characteristic | Number | Measure |
| Per Capita Income | 22,349 | $30,400 |
| Median Family Income | 5,496 | $73,380 |
| Mean Family Income | 5,496 | $84,489 |
| Median Household Income | 9,593 | $51,963 |
| Mean Household Income | 9,593 | $67,088 |
| Income Deficit | 5,496 | $10,259 |
| Wage / Income Gap (%) | 22,349 | 30.37% |
| Wage / Income Gap ($) | 22,349 | 69.63¢ per $1 |
| Gini / Inequality Index | 22,349 | 0.41 |
Earnings by Sex in Brooke County
Average Earnings in Brooke County are $34,376, $41,798 for men and $29,104 for women, a difference of 30.4%.
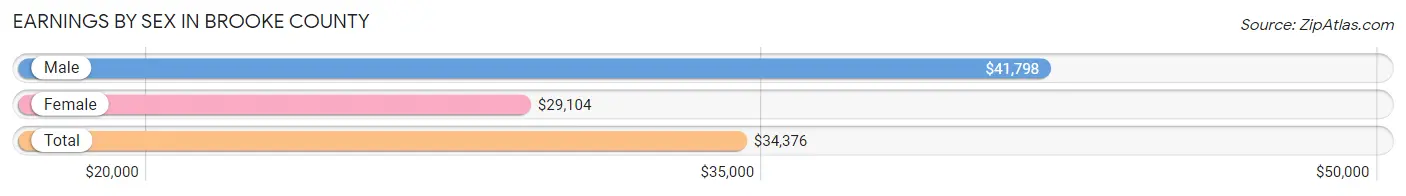
| Sex | Number | Average Earnings |
| Male | 5,771 (52.8%) | $41,798 |
| Female | 5,148 (47.1%) | $29,104 |
| Total | 10,919 (100.0%) | $34,376 |
Earnings by Sex by Income Bracket in Brooke County
The most common earnings brackets in Brooke County are $45,000 to $49,999 for men (629 | 10.9%) and $30,000 to $34,999 for women (466 | 9.0%).
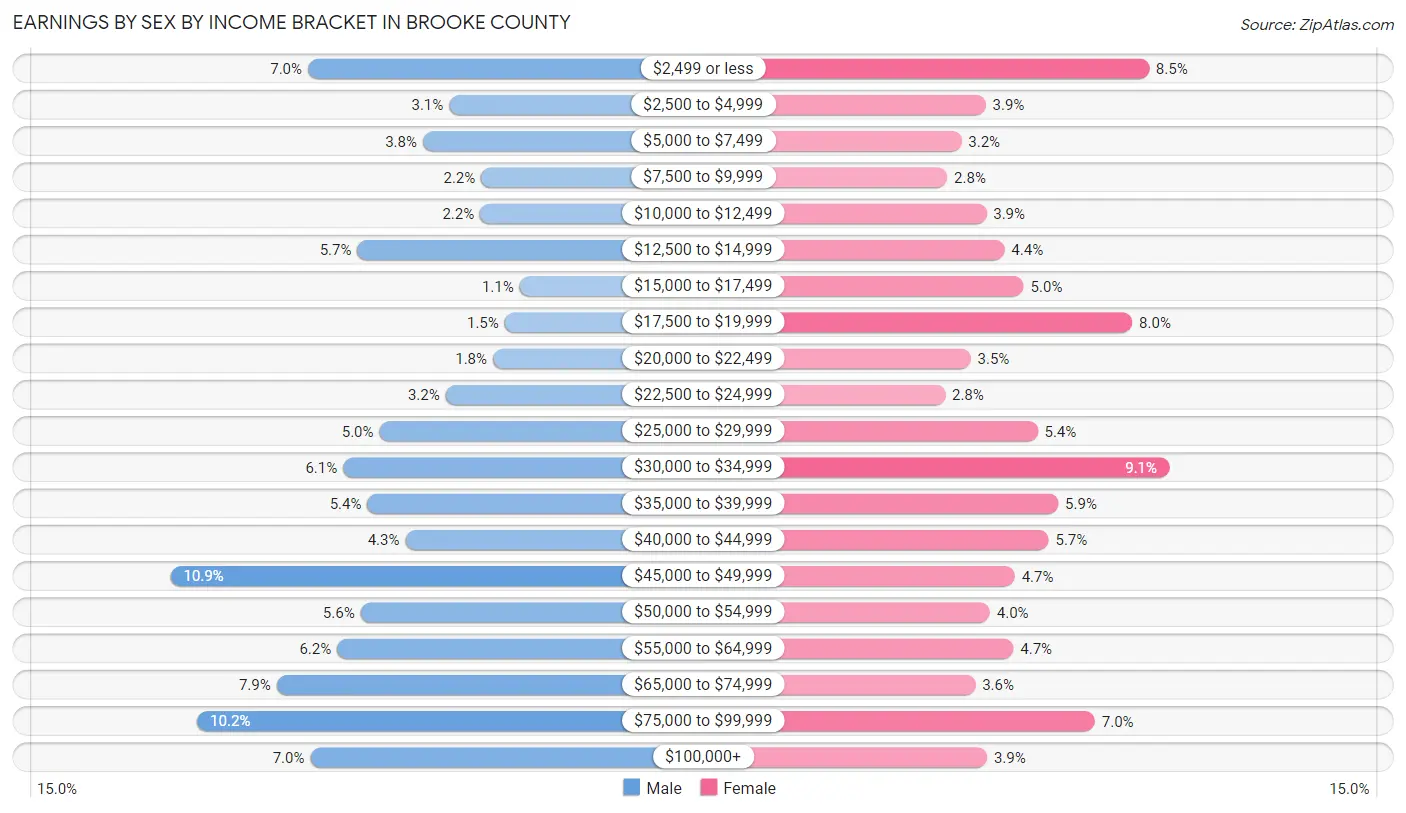
| Income | Male | Female |
| $2,499 or less | 406 (7.0%) | 437 (8.5%) |
| $2,500 to $4,999 | 177 (3.1%) | 201 (3.9%) |
| $5,000 to $7,499 | 220 (3.8%) | 166 (3.2%) |
| $7,500 to $9,999 | 125 (2.2%) | 145 (2.8%) |
| $10,000 to $12,499 | 127 (2.2%) | 202 (3.9%) |
| $12,500 to $14,999 | 326 (5.7%) | 228 (4.4%) |
| $15,000 to $17,499 | 63 (1.1%) | 256 (5.0%) |
| $17,500 to $19,999 | 87 (1.5%) | 413 (8.0%) |
| $20,000 to $22,499 | 106 (1.8%) | 179 (3.5%) |
| $22,500 to $24,999 | 183 (3.2%) | 142 (2.8%) |
| $25,000 to $29,999 | 290 (5.0%) | 276 (5.4%) |
| $30,000 to $34,999 | 349 (6.0%) | 466 (9.0%) |
| $35,000 to $39,999 | 310 (5.4%) | 306 (5.9%) |
| $40,000 to $44,999 | 248 (4.3%) | 292 (5.7%) |
| $45,000 to $49,999 | 629 (10.9%) | 243 (4.7%) |
| $50,000 to $54,999 | 321 (5.6%) | 207 (4.0%) |
| $55,000 to $64,999 | 359 (6.2%) | 241 (4.7%) |
| $65,000 to $74,999 | 457 (7.9%) | 186 (3.6%) |
| $75,000 to $99,999 | 586 (10.2%) | 359 (7.0%) |
| $100,000+ | 402 (7.0%) | 203 (3.9%) |
| Total | 5,771 (100.0%) | 5,148 (100.0%) |
Earnings by Sex by Educational Attainment in Brooke County
Average earnings in Brooke County are $46,456 for men and $32,728 for women, a difference of 29.5%. Men with an educational attainment of graduate degree enjoy the highest average annual earnings of $66,912, while those with less than high school education earn the least with $39,940. Women with an educational attainment of graduate degree earn the most with the average annual earnings of $46,205, while those with high school diploma education have the smallest earnings of $20,417.
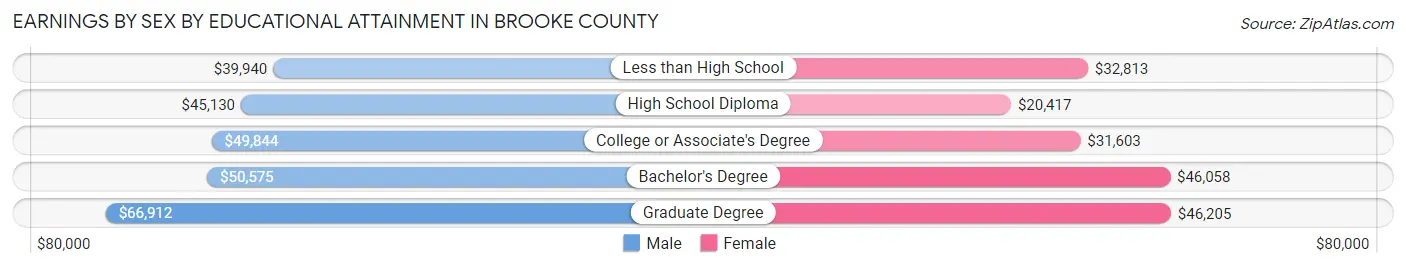
| Educational Attainment | Male Income | Female Income |
| Less than High School | $39,940 | $32,813 |
| High School Diploma | $45,130 | $20,417 |
| College or Associate's Degree | $49,844 | $31,603 |
| Bachelor's Degree | $50,575 | $46,058 |
| Graduate Degree | $66,912 | $46,205 |
| Total | $46,456 | $32,728 |
Family Income in Brooke County
Family Income Brackets in Brooke County
According to the Brooke County family income data, there are 1,110 families falling into the $50,000 to $74,999 income range, which is the most common income bracket and makes up 20.2% of all families. Conversely, the $10,000 to $14,999 income bracket is the least frequent group with only 93 families (1.7%) belonging to this category.
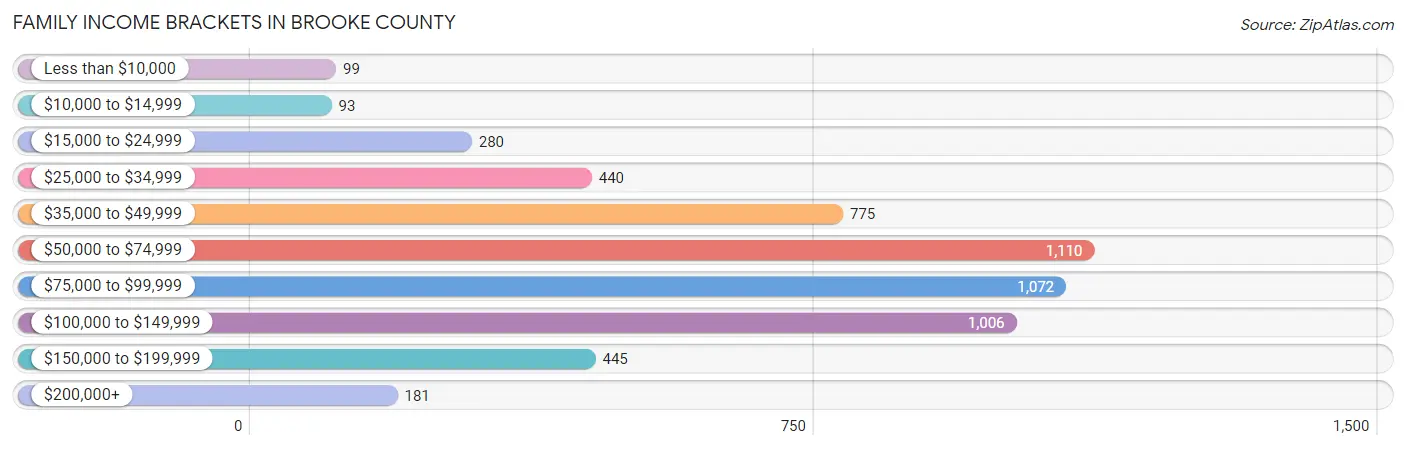
| Income Bracket | # Families | % Families |
| Less than $10,000 | 99 | 1.8% |
| $10,000 to $14,999 | 93 | 1.7% |
| $15,000 to $24,999 | 280 | 5.1% |
| $25,000 to $34,999 | 440 | 8.0% |
| $35,000 to $49,999 | 775 | 14.1% |
| $50,000 to $74,999 | 1,110 | 20.2% |
| $75,000 to $99,999 | 1,072 | 19.5% |
| $100,000 to $149,999 | 1,006 | 18.3% |
| $150,000 to $199,999 | 445 | 8.1% |
| $200,000+ | 181 | 3.3% |
Family Income by Famaliy Size in Brooke County
6-person families (98 | 1.8%) account for the highest median family income in Brooke County with $101,700 per family, while 2-person families (3,180 | 57.9%) have the highest median income of $35,669 per family member.
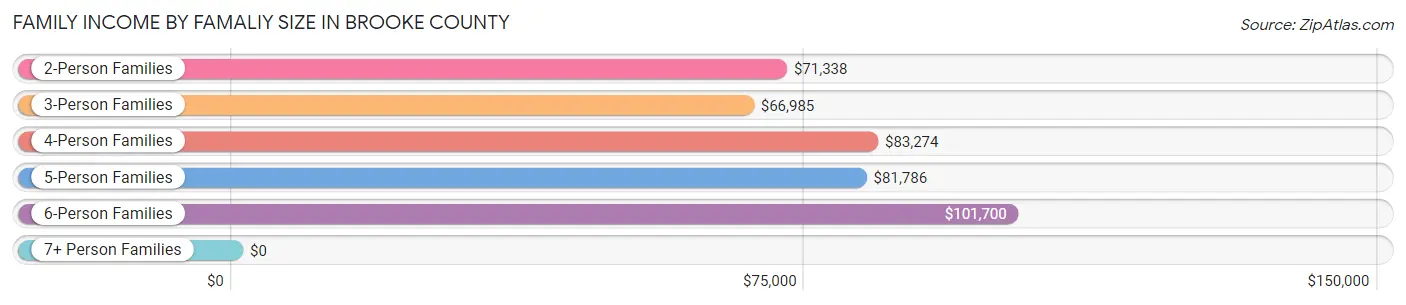
| Income Bracket | # Families | Median Income |
| 2-Person Families | 3,180 (57.9%) | $71,338 |
| 3-Person Families | 1,195 (21.7%) | $66,985 |
| 4-Person Families | 777 (14.1%) | $83,274 |
| 5-Person Families | 236 (4.3%) | $81,786 |
| 6-Person Families | 98 (1.8%) | $101,700 |
| 7+ Person Families | 10 (0.2%) | $0 |
| Total | 5,496 (100.0%) | $73,380 |
Family Income by Number of Earners in Brooke County
The median family income in Brooke County is $73,380, with families comprising 3+ earners (378) having the highest median family income of $123,864, while families with 1 earner (2,026) have the lowest median family income of $56,280, accounting for 6.9% and 36.9% of families, respectively.
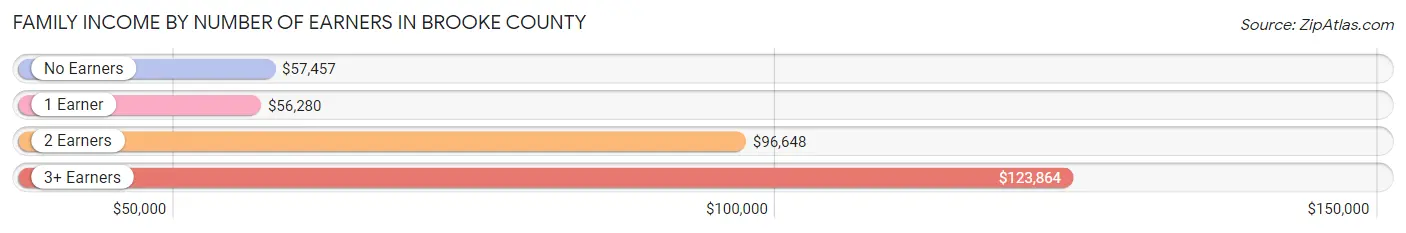
| Number of Earners | # Families | Median Income |
| No Earners | 1,255 (22.8%) | $57,457 |
| 1 Earner | 2,026 (36.9%) | $56,280 |
| 2 Earners | 1,837 (33.4%) | $96,648 |
| 3+ Earners | 378 (6.9%) | $123,864 |
| Total | 5,496 (100.0%) | $73,380 |
Household Income in Brooke County
Household Income Brackets in Brooke County
With 1,736 households falling in the category, the $35,000 to $49,999 income range is the most frequent in Brooke County, accounting for 18.1% of all households. In contrast, only 211 households (2.2%) fall into the $200,000+ income bracket, making it the least populous group.
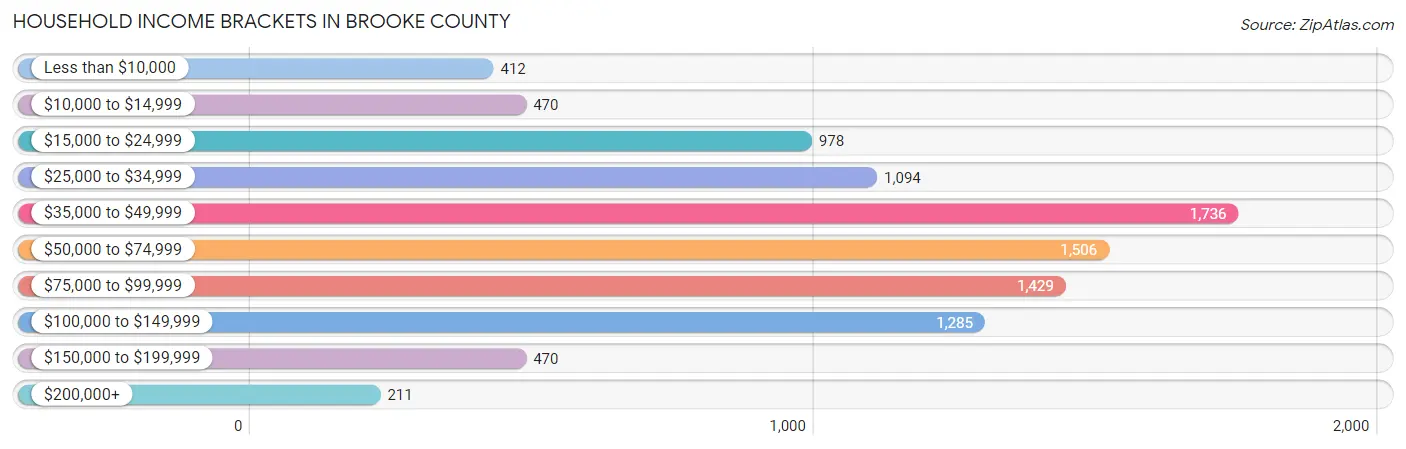
| Income Bracket | # Households | % Households |
| Less than $10,000 | 412 | 4.3% |
| $10,000 to $14,999 | 470 | 4.9% |
| $15,000 to $24,999 | 978 | 10.2% |
| $25,000 to $34,999 | 1,094 | 11.4% |
| $35,000 to $49,999 | 1,736 | 18.1% |
| $50,000 to $74,999 | 1,506 | 15.7% |
| $75,000 to $99,999 | 1,429 | 14.9% |
| $100,000 to $149,999 | 1,285 | 13.4% |
| $150,000 to $199,999 | 470 | 4.9% |
| $200,000+ | 211 | 2.2% |
Household Income by Householder Age in Brooke County
The median household income in Brooke County is $51,963, with the highest median household income of $62,826 found in the 25 to 44 years age bracket for the primary householder. A total of 1,988 households (20.7%) fall into this category. Meanwhile, the 15 to 24 years age bracket for the primary householder has the lowest median household income of $38,551, with 348 households (3.6%) in this group.
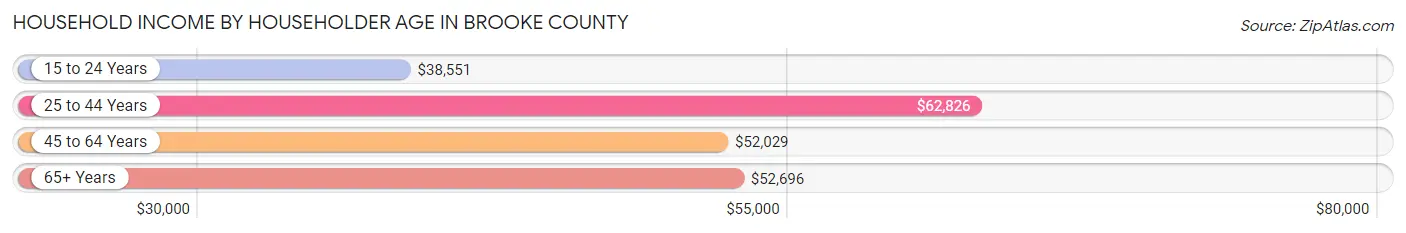
| Income Bracket | # Households | Median Income |
| 15 to 24 Years | 348 (3.6%) | $38,551 |
| 25 to 44 Years | 1,988 (20.7%) | $62,826 |
| 45 to 64 Years | 3,723 (38.8%) | $52,029 |
| 65+ Years | 3,534 (36.8%) | $52,696 |
| Total | 9,593 (100.0%) | $51,963 |
Poverty in Brooke County
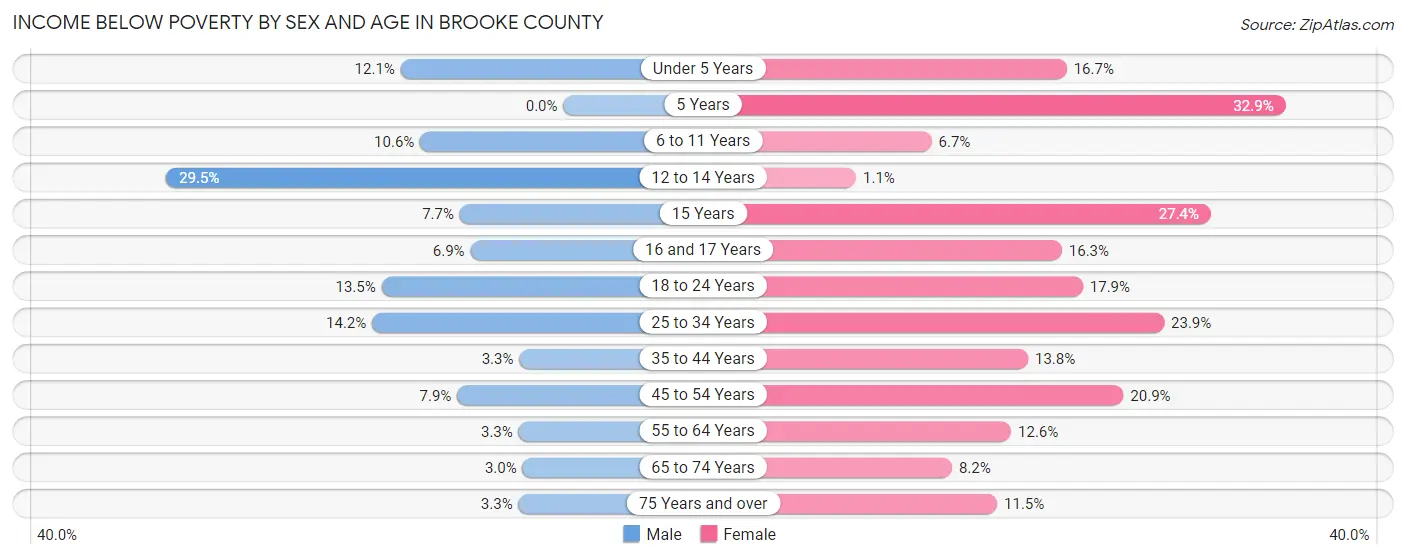
Income Below Poverty by Sex and Age in Brooke County
With 7.5% poverty level for males and 14.5% for females among the residents of Brooke County, 12 to 14 year old males and 5 year old females are the most vulnerable to poverty, with 92 males (29.5%) and 28 females (32.9%) in their respective age groups living below the poverty level.
| Age Bracket | Male | Female |
| Under 5 Years | 57 (12.1%) | 81 (16.7%) |
| 5 Years | 0 (0.0%) | 28 (32.9%) |
| 6 to 11 Years | 64 (10.6%) | 54 (6.7%) |
| 12 to 14 Years | 92 (29.5%) | 2 (1.1%) |
| 15 Years | 7 (7.7%) | 40 (27.4%) |
| 16 and 17 Years | 20 (6.9%) | 33 (16.3%) |
| 18 to 24 Years | 105 (13.5%) | 114 (17.9%) |
| 25 to 34 Years | 171 (14.2%) | 275 (23.9%) |
| 35 to 44 Years | 39 (3.3%) | 156 (13.8%) |
| 45 to 54 Years | 108 (7.9%) | 290 (20.9%) |
| 55 to 64 Years | 57 (3.3%) | 215 (12.6%) |
| 65 to 74 Years | 45 (3.0%) | 134 (8.2%) |
| 75 Years and over | 30 (3.3%) | 136 (11.5%) |
| Total | 795 (7.5%) | 1,558 (14.5%) |
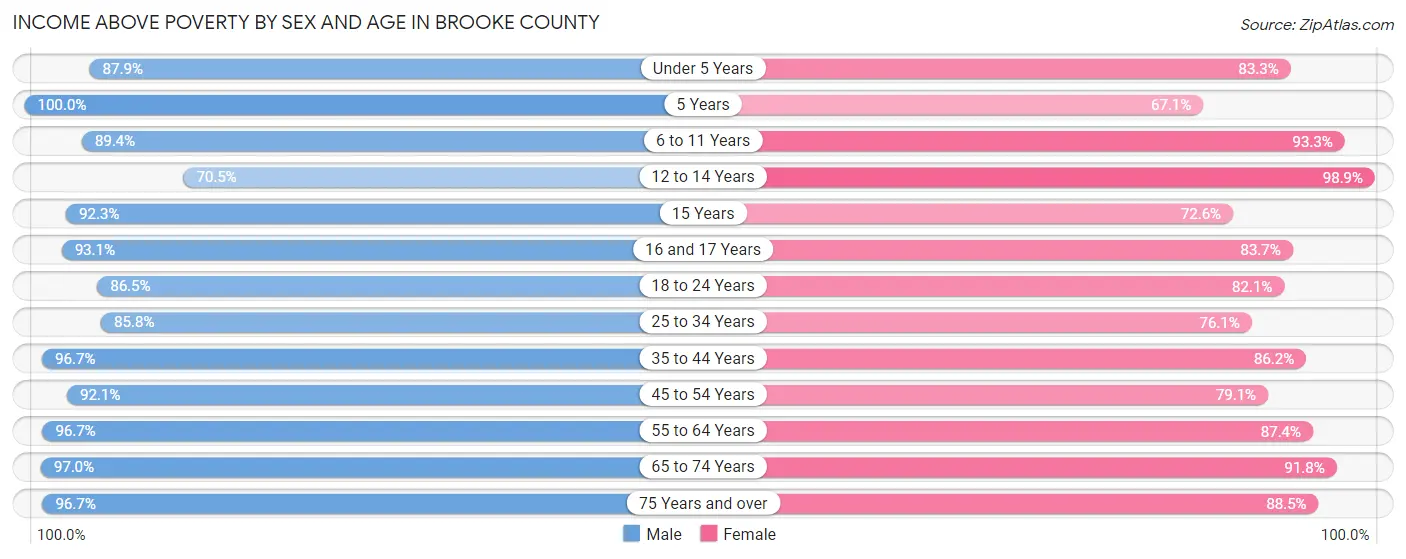
Income Above Poverty by Sex and Age in Brooke County
According to the poverty statistics in Brooke County, males aged 5 years and females aged 12 to 14 years are the age groups that are most secure financially, with 100.0% of males and 98.9% of females in these age groups living above the poverty line.
| Age Bracket | Male | Female |
| Under 5 Years | 415 (87.9%) | 404 (83.3%) |
| 5 Years | 154 (100.0%) | 57 (67.1%) |
| 6 to 11 Years | 538 (89.4%) | 755 (93.3%) |
| 12 to 14 Years | 220 (70.5%) | 187 (98.9%) |
| 15 Years | 84 (92.3%) | 106 (72.6%) |
| 16 and 17 Years | 270 (93.1%) | 169 (83.7%) |
| 18 to 24 Years | 673 (86.5%) | 523 (82.1%) |
| 25 to 34 Years | 1,033 (85.8%) | 874 (76.1%) |
| 35 to 44 Years | 1,152 (96.7%) | 972 (86.2%) |
| 45 to 54 Years | 1,263 (92.1%) | 1,097 (79.1%) |
| 55 to 64 Years | 1,658 (96.7%) | 1,496 (87.4%) |
| 65 to 74 Years | 1,442 (97.0%) | 1,505 (91.8%) |
| 75 Years and over | 870 (96.7%) | 1,044 (88.5%) |
| Total | 9,772 (92.5%) | 9,189 (85.5%) |
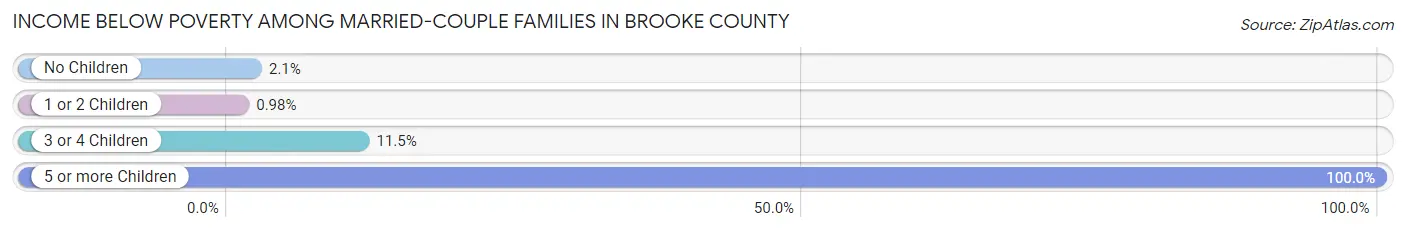
Income Below Poverty Among Married-Couple Families in Brooke County
The poverty statistics for married-couple families in Brooke County show that 2.3% or 92 of the total 4,008 families live below the poverty line. Families with 5 or more children have the highest poverty rate of 100.0%, comprising of 3 families. On the other hand, families with 1 or 2 children have the lowest poverty rate of 1.0%, which includes 9 families.
| Children | Above Poverty | Below Poverty |
| No Children | 2,858 (97.9%) | 61 (2.1%) |
| 1 or 2 Children | 911 (99.0%) | 9 (1.0%) |
| 3 or 4 Children | 147 (88.5%) | 19 (11.5%) |
| 5 or more Children | 0 (0.0%) | 3 (100.0%) |
| Total | 3,916 (97.7%) | 92 (2.3%) |
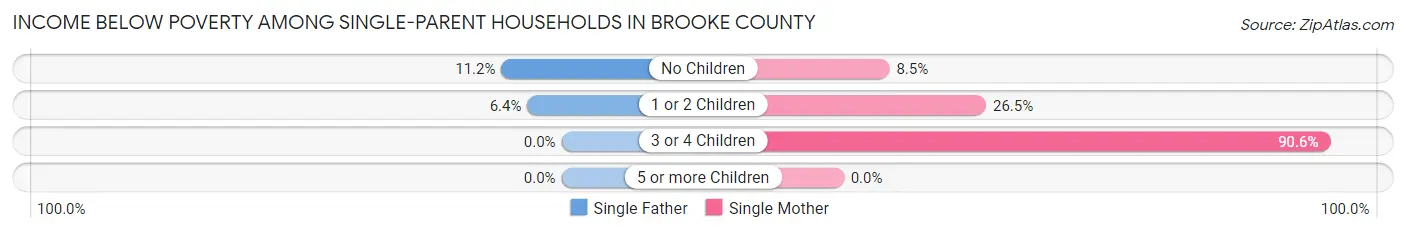
Income Below Poverty Among Single-Parent Households in Brooke County
According to the poverty data in Brooke County, 6.8% or 26 single-father households and 20.5% or 227 single-mother households are living below the poverty line. Among single-father households, those with no children have the highest poverty rate, with 13 households (11.2%) experiencing poverty. Likewise, among single-mother households, those with 3 or 4 children have the highest poverty rate, with 58 households (90.6%) falling below the poverty line.
| Children | Single Father | Single Mother |
| No Children | 13 (11.2%) | 51 (8.5%) |
| 1 or 2 Children | 13 (6.4%) | 118 (26.5%) |
| 3 or 4 Children | 0 (0.0%) | 58 (90.6%) |
| 5 or more Children | 0 (0.0%) | 0 (0.0%) |
| Total | 26 (6.8%) | 227 (20.5%) |
Income Below Poverty Among Married-Couple vs Single-Parent Households in Brooke County
The poverty data for Brooke County shows that 92 of the married-couple family households (2.3%) and 253 of the single-parent households (17.0%) are living below the poverty level. Within the married-couple family households, those with 5 or more children have the highest poverty rate, with 3 households (100.0%) falling below the poverty line. Among the single-parent households, those with 3 or 4 children have the highest poverty rate, with 58 household (46.4%) living below poverty.
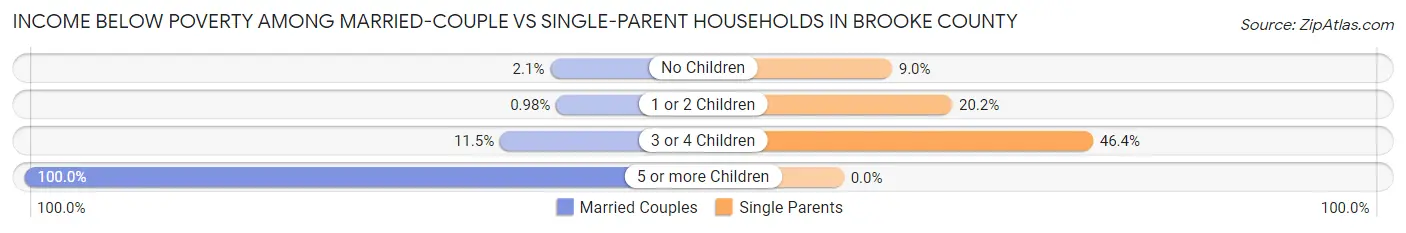
| Children | Married-Couple Families | Single-Parent Households |
| No Children | 61 (2.1%) | 64 (9.0%) |
| 1 or 2 Children | 9 (1.0%) | 131 (20.2%) |
| 3 or 4 Children | 19 (11.5%) | 58 (46.4%) |
| 5 or more Children | 3 (100.0%) | 0 (0.0%) |
| Total | 92 (2.3%) | 253 (17.0%) |
Employment Characteristics in Brooke County
Employment by Class of Employer in Brooke County
Among the 9,282 employed individuals in Brooke County, private company employees (5,919 | 63.8%), not-for-profit organizations (1,042 | 11.2%), and local government employees (1,010 | 10.9%) make up the most common classes of employment.
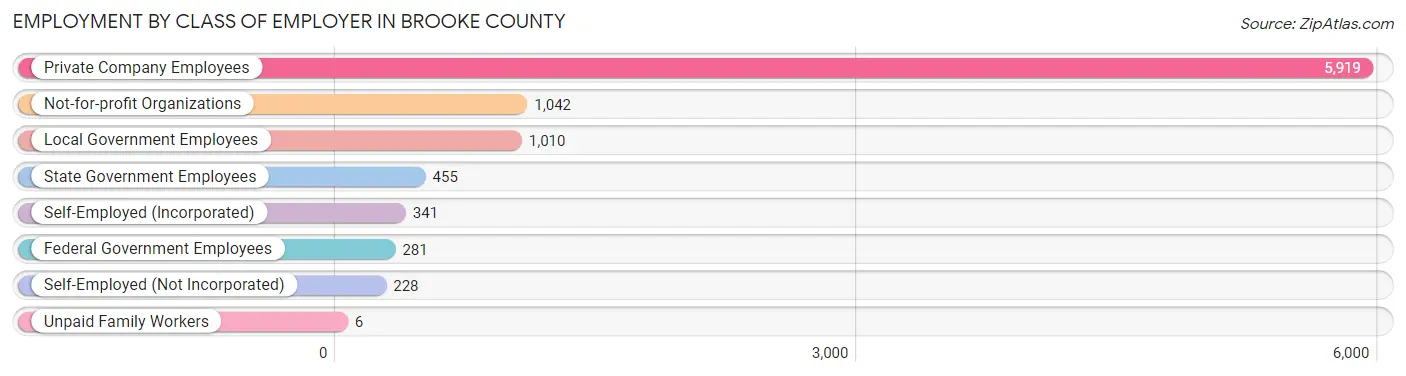
| Employer Class | # Employees | % Employees |
| Private Company Employees | 5,919 | 63.8% |
| Self-Employed (Incorporated) | 341 | 3.7% |
| Self-Employed (Not Incorporated) | 228 | 2.5% |
| Not-for-profit Organizations | 1,042 | 11.2% |
| Local Government Employees | 1,010 | 10.9% |
| State Government Employees | 455 | 4.9% |
| Federal Government Employees | 281 | 3.0% |
| Unpaid Family Workers | 6 | 0.1% |
| Total | 9,282 | 100.0% |
Employment Status by Age in Brooke County
According to the labor force statistics for Brooke County, out of the total population over 16 years of age (18,917), 54.0% or 10,215 individuals are in the labor force, with 5.7% or 582 of them unemployed. The age group with the highest labor force participation rate is 30 to 34 years, with 84.5% or 1,002 individuals in the labor force. Within the labor force, the 25 to 29 years age range has the highest percentage of unemployed individuals, with 14.7% or 130 of them being unemployed.
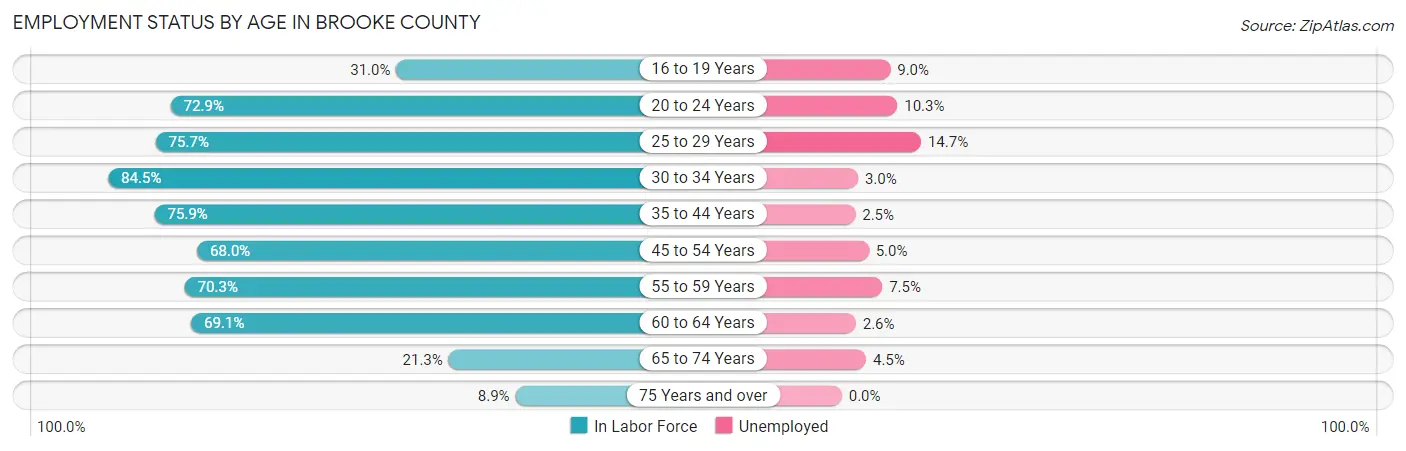
| Age Bracket | In Labor Force | Unemployed |
| 16 to 19 Years | 388 (31.0%) | 35 (9.0%) |
| 20 to 24 Years | 1,029 (72.9%) | 106 (10.3%) |
| 25 to 29 Years | 886 (75.7%) | 130 (14.7%) |
| 30 to 34 Years | 1,002 (84.5%) | 30 (3.0%) |
| 35 to 44 Years | 1,760 (75.9%) | 44 (2.5%) |
| 45 to 54 Years | 1,882 (68.0%) | 94 (5.0%) |
| 55 to 59 Years | 1,067 (70.3%) | 80 (7.5%) |
| 60 to 64 Years | 1,321 (69.1%) | 34 (2.6%) |
| 65 to 74 Years | 674 (21.3%) | 30 (4.5%) |
| 75 Years and over | 197 (8.9%) | 0 (0.0%) |
| Total | 10,215 (54.0%) | 582 (5.7%) |
Employment Status by Educational Attainment in Brooke County
According to labor force statistics for Brooke County, 72.8% of individuals (7,915) out of the total population between 25 and 64 years of age (10,872) are in the labor force, with 5.2% or 412 of them being unemployed. The group with the highest labor force participation rate are those with the educational attainment of bachelor's degree or higher, with 83.5% or 2,139 individuals in the labor force. Within the labor force, individuals with less than high school education have the highest percentage of unemployment, with 9.3% or 43 of them being unemployed.
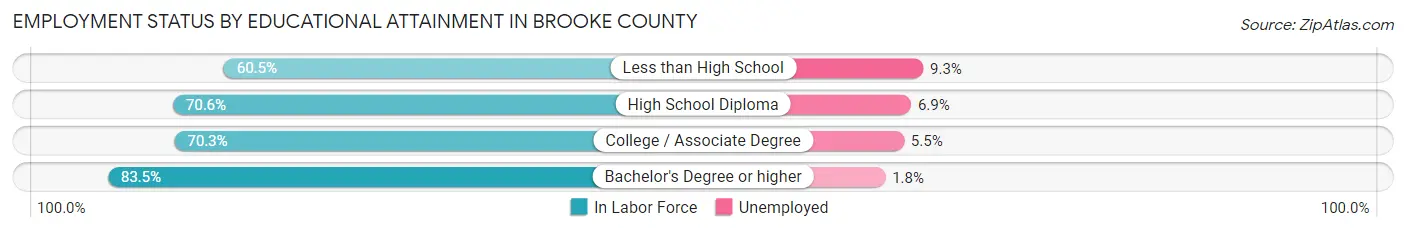
| Educational Attainment | In Labor Force | Unemployed |
| Less than High School | 460 (60.5%) | 71 (9.3%) |
| High School Diploma | 2,900 (70.6%) | 283 (6.9%) |
| College / Associate Degree | 2,420 (70.3%) | 189 (5.5%) |
| Bachelor's Degree or higher | 2,139 (83.5%) | 46 (1.8%) |
| Total | 7,915 (72.8%) | 565 (5.2%) |
Employment Occupations by Sex in Brooke County
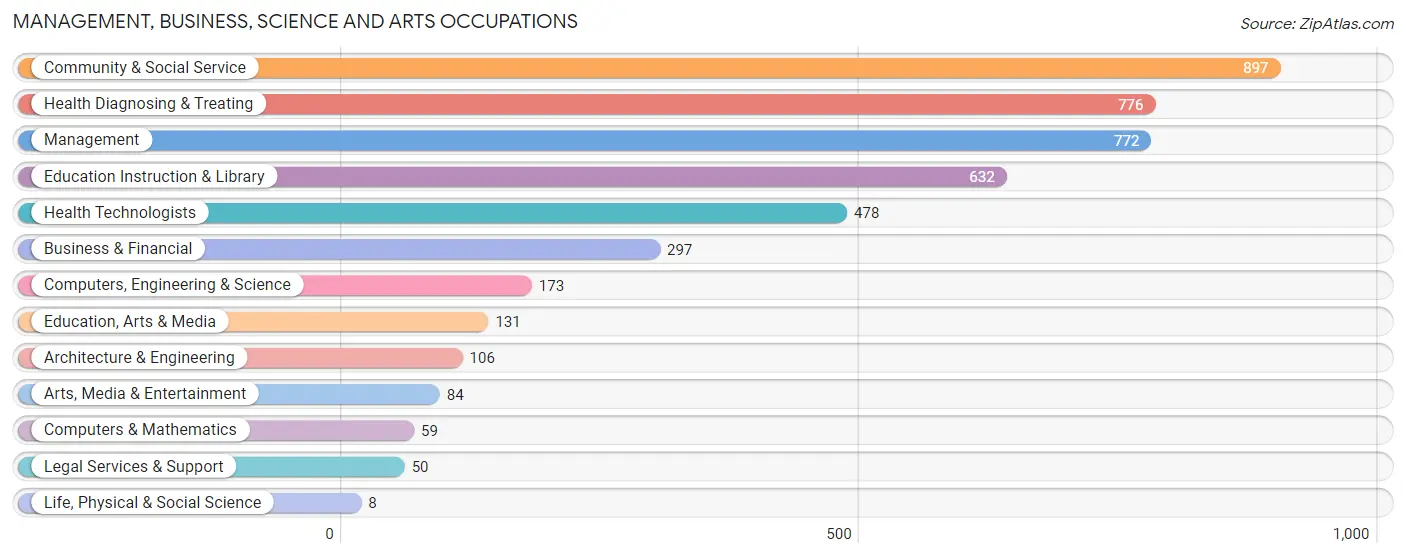
Management, Business, Science and Arts Occupations
The most common Management, Business, Science and Arts occupations in Brooke County are Community & Social Service (897 | 9.3%), Health Diagnosing & Treating (776 | 8.1%), Management (772 | 8.1%), Education Instruction & Library (632 | 6.6%), and Health Technologists (478 | 5.0%).
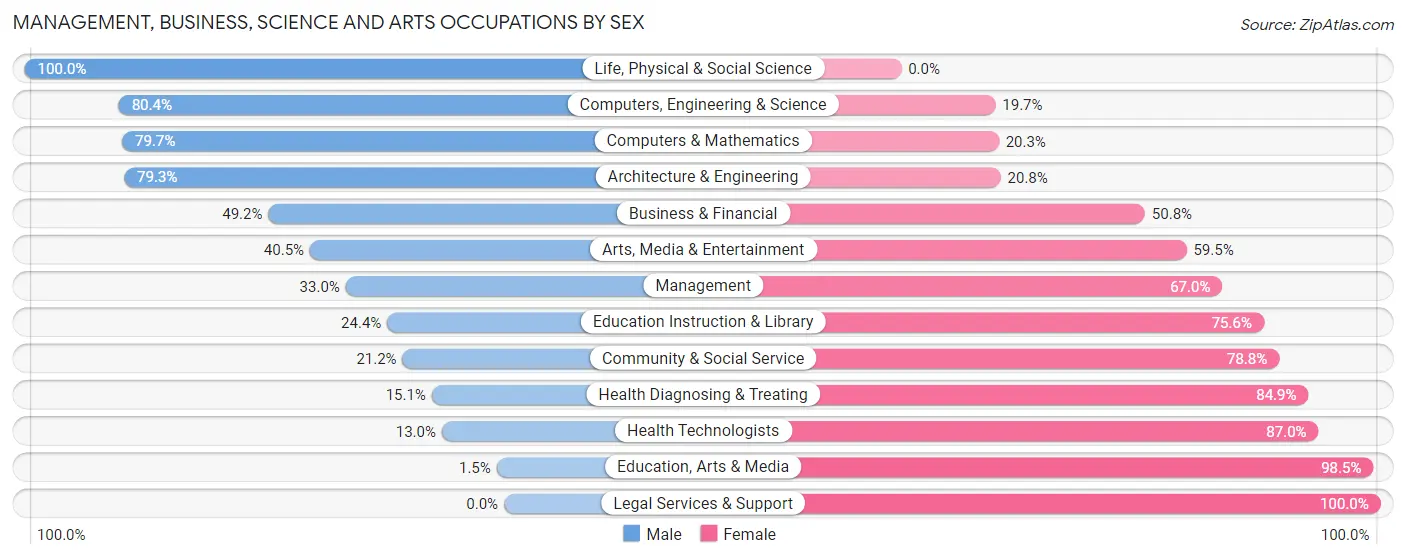
Management, Business, Science and Arts Occupations by Sex
Within the Management, Business, Science and Arts occupations in Brooke County, the most male-oriented occupations are Life, Physical & Social Science (100.0%), Computers, Engineering & Science (80.3%), and Computers & Mathematics (79.7%), while the most female-oriented occupations are Legal Services & Support (100.0%), Education, Arts & Media (98.5%), and Health Technologists (87.0%).
| Occupation | Male | Female |
| Management | 255 (33.0%) | 517 (67.0%) |
| Business & Financial | 146 (49.2%) | 151 (50.8%) |
| Computers, Engineering & Science | 139 (80.3%) | 34 (19.7%) |
| Computers & Mathematics | 47 (79.7%) | 12 (20.3%) |
| Architecture & Engineering | 84 (79.2%) | 22 (20.7%) |
| Life, Physical & Social Science | 8 (100.0%) | 0 (0.0%) |
| Community & Social Service | 190 (21.2%) | 707 (78.8%) |
| Education, Arts & Media | 2 (1.5%) | 129 (98.5%) |
| Legal Services & Support | 0 (0.0%) | 50 (100.0%) |
| Education Instruction & Library | 154 (24.4%) | 478 (75.6%) |
| Arts, Media & Entertainment | 34 (40.5%) | 50 (59.5%) |
| Health Diagnosing & Treating | 117 (15.1%) | 659 (84.9%) |
| Health Technologists | 62 (13.0%) | 416 (87.0%) |
| Total (Category) | 847 (29.1%) | 2,068 (70.9%) |
| Total (Overall) | 5,113 (53.3%) | 4,479 (46.7%) |
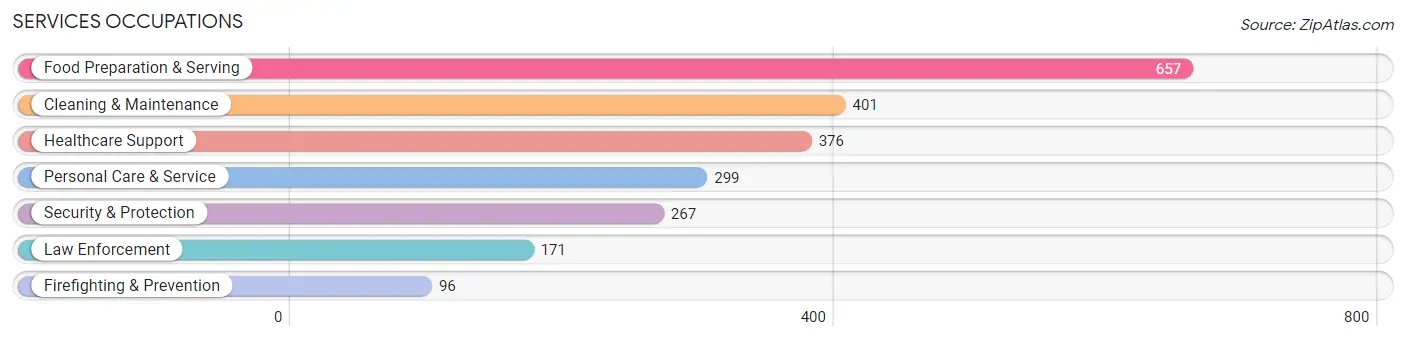
Services Occupations
The most common Services occupations in Brooke County are Food Preparation & Serving (657 | 6.9%), Cleaning & Maintenance (401 | 4.2%), Healthcare Support (376 | 3.9%), Personal Care & Service (299 | 3.1%), and Security & Protection (267 | 2.8%).
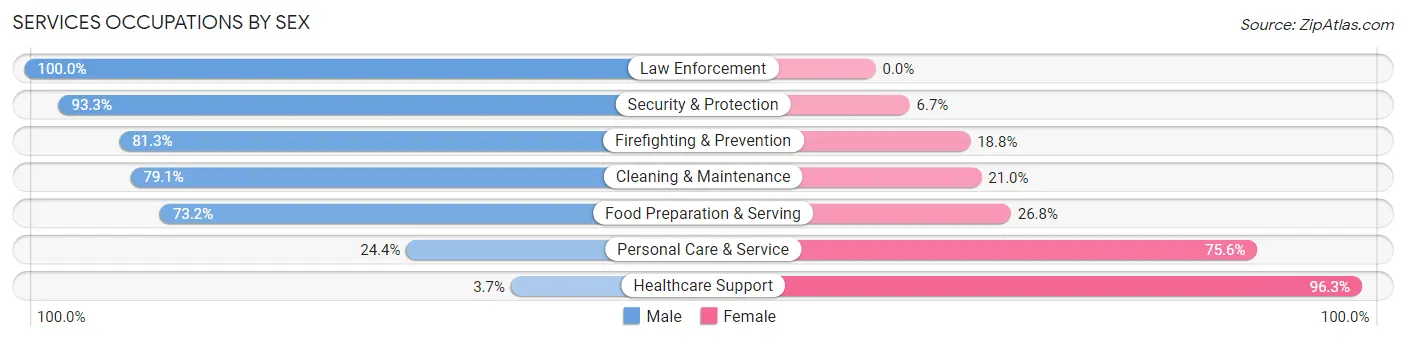
Services Occupations by Sex
Within the Services occupations in Brooke County, the most male-oriented occupations are Law Enforcement (100.0%), Security & Protection (93.3%), and Firefighting & Prevention (81.2%), while the most female-oriented occupations are Healthcare Support (96.3%), Personal Care & Service (75.6%), and Food Preparation & Serving (26.8%).
| Occupation | Male | Female |
| Healthcare Support | 14 (3.7%) | 362 (96.3%) |
| Security & Protection | 249 (93.3%) | 18 (6.7%) |
| Firefighting & Prevention | 78 (81.2%) | 18 (18.8%) |
| Law Enforcement | 171 (100.0%) | 0 (0.0%) |
| Food Preparation & Serving | 481 (73.2%) | 176 (26.8%) |
| Cleaning & Maintenance | 317 (79.0%) | 84 (20.9%) |
| Personal Care & Service | 73 (24.4%) | 226 (75.6%) |
| Total (Category) | 1,134 (56.7%) | 866 (43.3%) |
| Total (Overall) | 5,113 (53.3%) | 4,479 (46.7%) |
Sales and Office Occupations
The most common Sales and Office occupations in Brooke County are Sales & Related (1,042 | 10.9%), and Office & Administration (946 | 9.9%).

Sales and Office Occupations by Sex
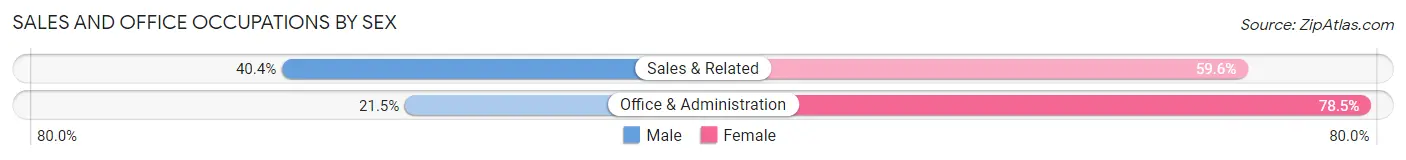
| Occupation | Male | Female |
| Sales & Related | 421 (40.4%) | 621 (59.6%) |
| Office & Administration | 203 (21.5%) | 743 (78.5%) |
| Total (Category) | 624 (31.4%) | 1,364 (68.6%) |
| Total (Overall) | 5,113 (53.3%) | 4,479 (46.7%) |
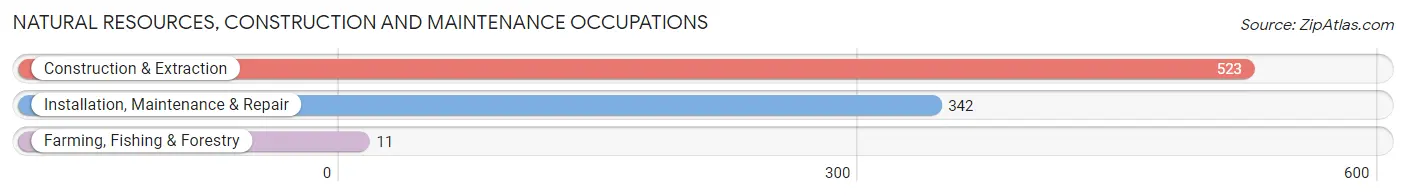
Natural Resources, Construction and Maintenance Occupations
The most common Natural Resources, Construction and Maintenance occupations in Brooke County are Construction & Extraction (523 | 5.4%), Installation, Maintenance & Repair (342 | 3.6%), and Farming, Fishing & Forestry (11 | 0.1%).
Natural Resources, Construction and Maintenance Occupations by Sex
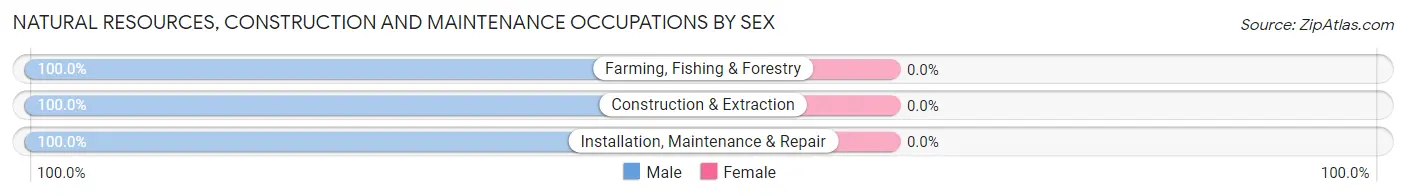
| Occupation | Male | Female |
| Farming, Fishing & Forestry | 11 (100.0%) | 0 (0.0%) |
| Construction & Extraction | 523 (100.0%) | 0 (0.0%) |
| Installation, Maintenance & Repair | 342 (100.0%) | 0 (0.0%) |
| Total (Category) | 876 (100.0%) | 0 (0.0%) |
| Total (Overall) | 5,113 (53.3%) | 4,479 (46.7%) |
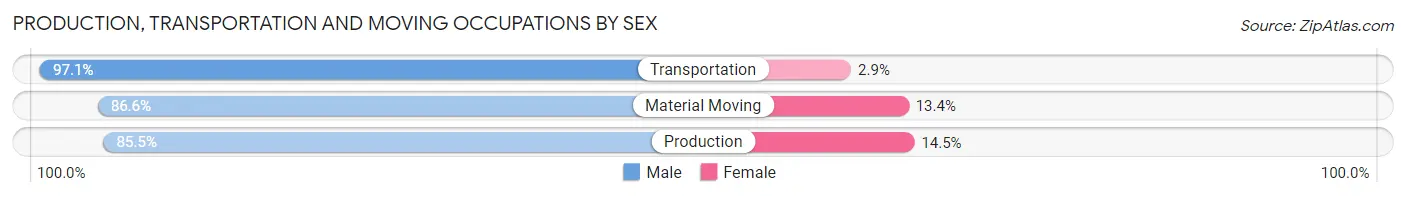
Production, Transportation and Moving Occupations
The most common Production, Transportation and Moving occupations in Brooke County are Production (732 | 7.6%), Transportation (664 | 6.9%), and Material Moving (417 | 4.3%).
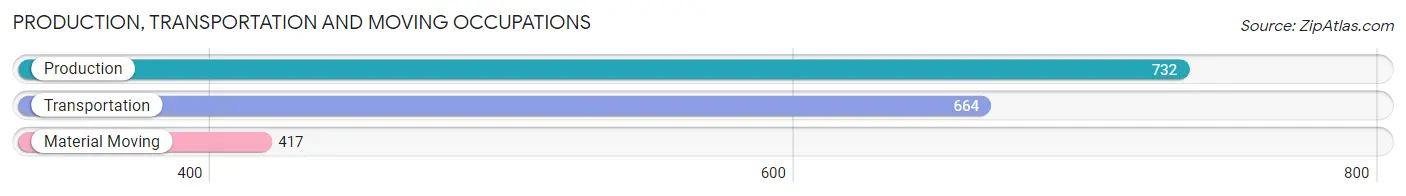
Production, Transportation and Moving Occupations by Sex
| Occupation | Male | Female |
| Production | 626 (85.5%) | 106 (14.5%) |
| Transportation | 645 (97.1%) | 19 (2.9%) |
| Material Moving | 361 (86.6%) | 56 (13.4%) |
| Total (Category) | 1,632 (90.0%) | 181 (10.0%) |
| Total (Overall) | 5,113 (53.3%) | 4,479 (46.7%) |
Employment Industries by Sex in Brooke County
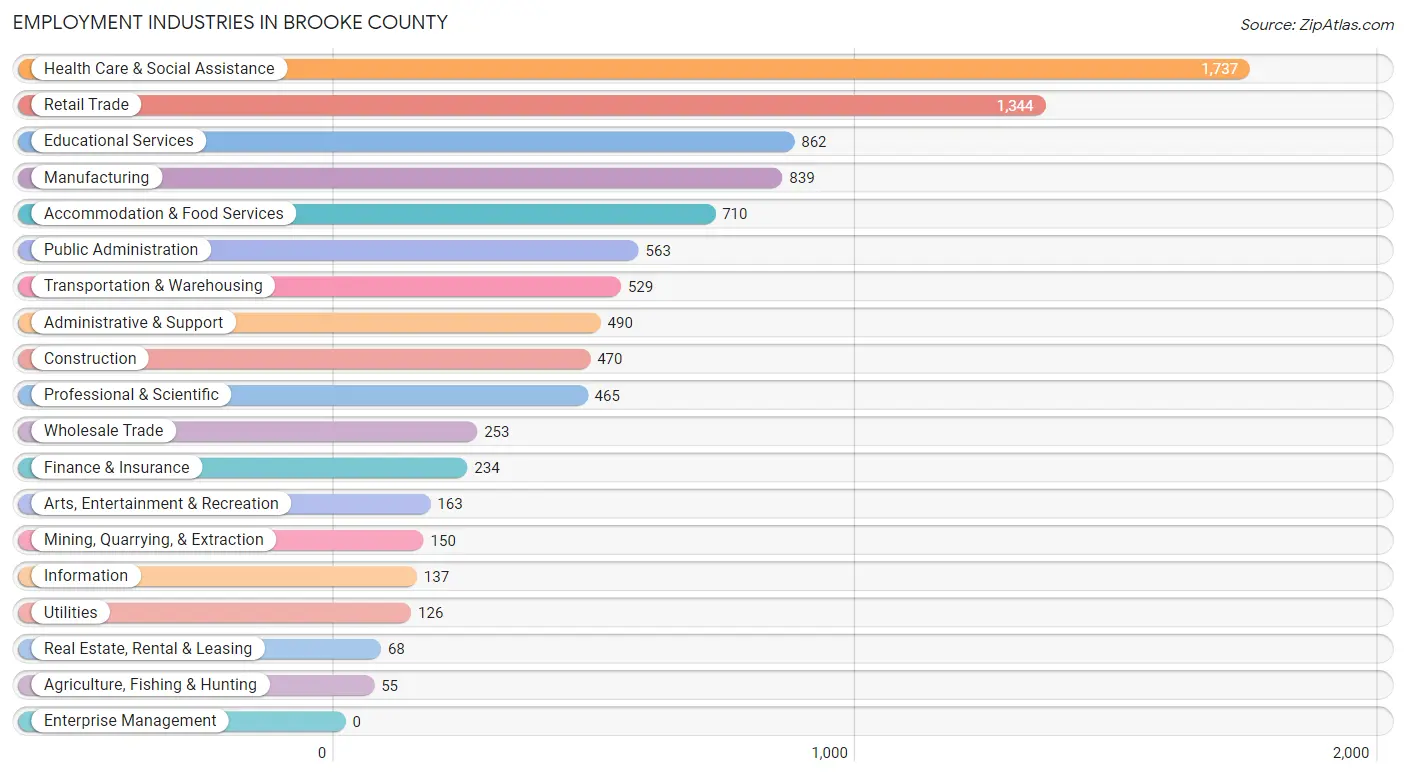
Employment Industries in Brooke County
The major employment industries in Brooke County include Health Care & Social Assistance (1,737 | 18.1%), Retail Trade (1,344 | 14.0%), Educational Services (862 | 9.0%), Manufacturing (839 | 8.7%), and Accommodation & Food Services (710 | 7.4%).
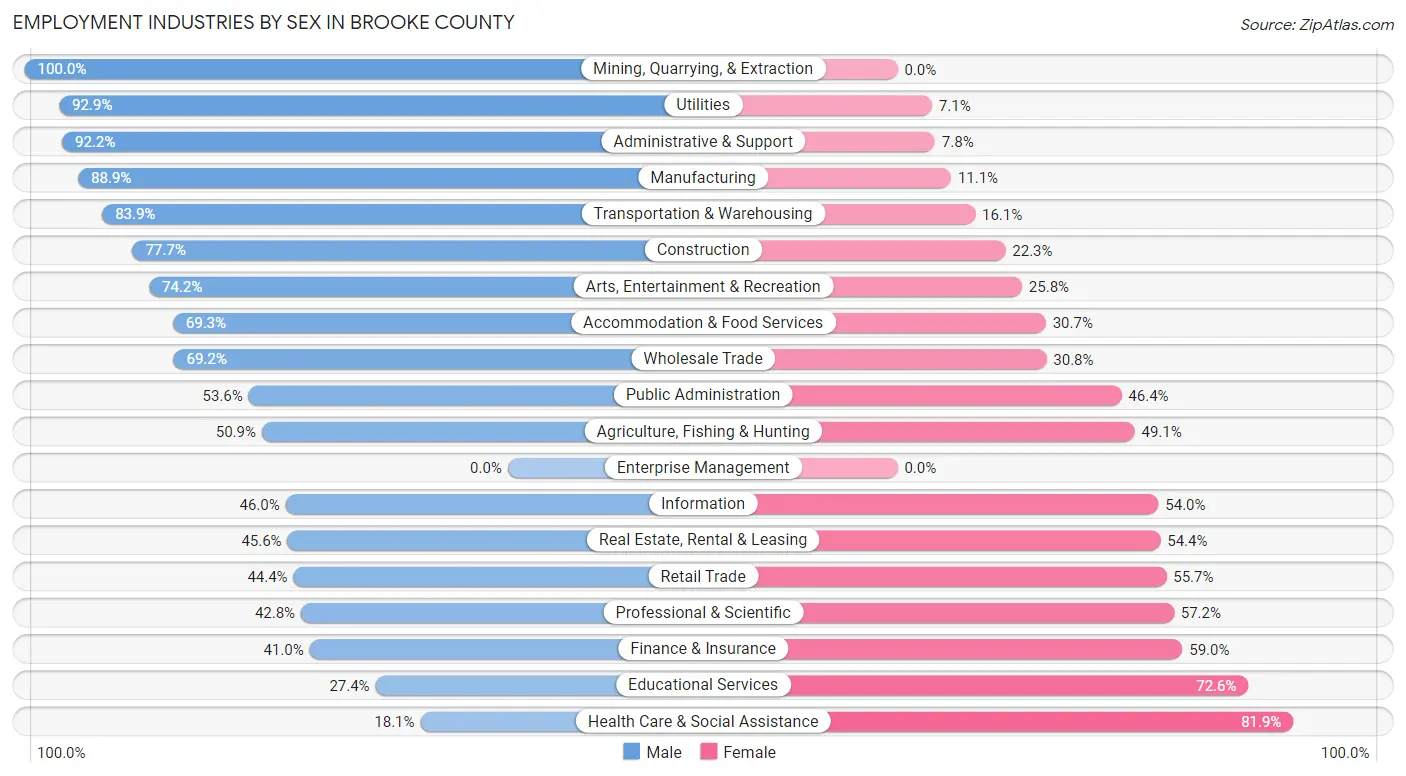
Employment Industries by Sex in Brooke County
The Brooke County industries that see more men than women are Mining, Quarrying, & Extraction (100.0%), Utilities (92.9%), and Administrative & Support (92.2%), whereas the industries that tend to have a higher number of women are Health Care & Social Assistance (81.9%), Educational Services (72.6%), and Finance & Insurance (59.0%).
| Industry | Male | Female |
| Agriculture, Fishing & Hunting | 28 (50.9%) | 27 (49.1%) |
| Mining, Quarrying, & Extraction | 150 (100.0%) | 0 (0.0%) |
| Construction | 365 (77.7%) | 105 (22.3%) |
| Manufacturing | 746 (88.9%) | 93 (11.1%) |
| Wholesale Trade | 175 (69.2%) | 78 (30.8%) |
| Retail Trade | 596 (44.4%) | 748 (55.6%) |
| Transportation & Warehousing | 444 (83.9%) | 85 (16.1%) |
| Utilities | 117 (92.9%) | 9 (7.1%) |
| Information | 63 (46.0%) | 74 (54.0%) |
| Finance & Insurance | 96 (41.0%) | 138 (59.0%) |
| Real Estate, Rental & Leasing | 31 (45.6%) | 37 (54.4%) |
| Professional & Scientific | 199 (42.8%) | 266 (57.2%) |
| Enterprise Management | 0 (0.0%) | 0 (0.0%) |
| Administrative & Support | 452 (92.2%) | 38 (7.8%) |
| Educational Services | 236 (27.4%) | 626 (72.6%) |
| Health Care & Social Assistance | 314 (18.1%) | 1,423 (81.9%) |
| Arts, Entertainment & Recreation | 121 (74.2%) | 42 (25.8%) |
| Accommodation & Food Services | 492 (69.3%) | 218 (30.7%) |
| Public Administration | 302 (53.6%) | 261 (46.4%) |
| Total | 5,113 (53.3%) | 4,479 (46.7%) |
Education in Brooke County
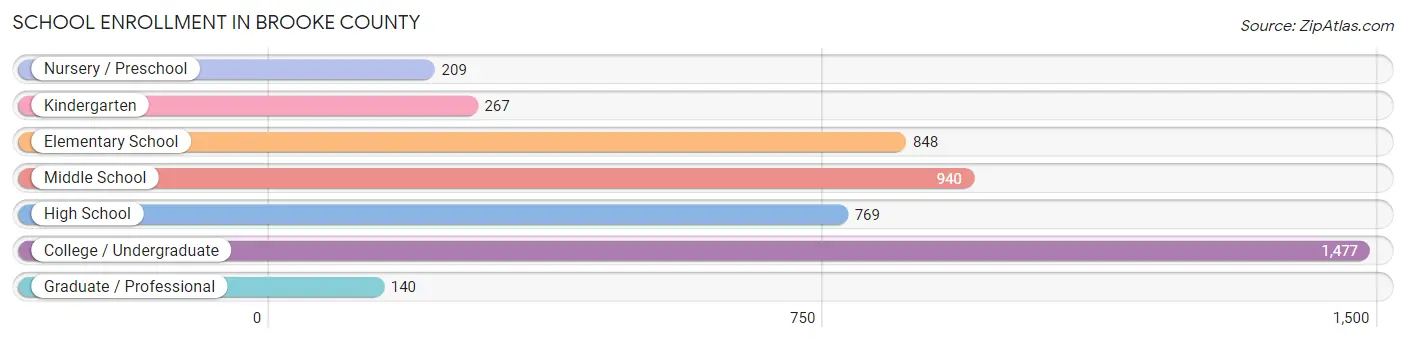
School Enrollment in Brooke County
The most common levels of schooling among the 4,650 students in Brooke County are college / undergraduate (1,477 | 31.8%), middle school (940 | 20.2%), and elementary school (848 | 18.2%).
| School Level | # Students | % Students |
| Nursery / Preschool | 209 | 4.5% |
| Kindergarten | 267 | 5.7% |
| Elementary School | 848 | 18.2% |
| Middle School | 940 | 20.2% |
| High School | 769 | 16.5% |
| College / Undergraduate | 1,477 | 31.8% |
| Graduate / Professional | 140 | 3.0% |
| Total | 4,650 | 100.0% |
School Enrollment by Age by Funding Source in Brooke County
Out of a total of 4,650 students who are enrolled in schools in Brooke County, 1,265 (27.2%) attend a private institution, while the remaining 3,385 (72.8%) are enrolled in public schools. The age group of 18 to 19 year olds has the highest likelihood of being enrolled in private schools, with 508 (78.9% in the age bracket) enrolled. Conversely, the age group of 5 to 9 year old has the lowest likelihood of being enrolled in a private school, with 872 (95.0% in the age bracket) attending a public institution.
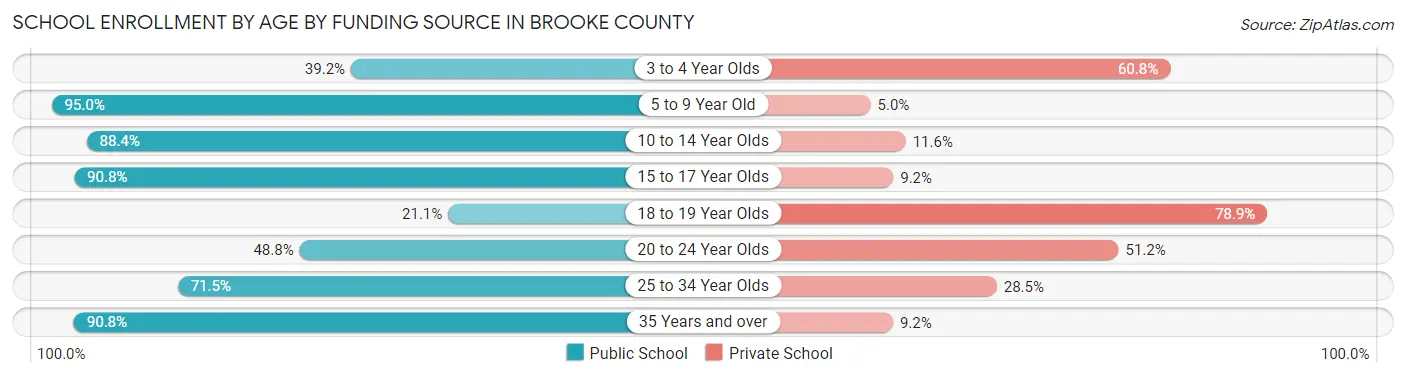
| Age Bracket | Public School | Private School |
| 3 to 4 Year Olds | 60 (39.2%) | 93 (60.8%) |
| 5 to 9 Year Old | 872 (95.0%) | 46 (5.0%) |
| 10 to 14 Year Olds | 1,056 (88.4%) | 138 (11.6%) |
| 15 to 17 Year Olds | 658 (90.8%) | 67 (9.2%) |
| 18 to 19 Year Olds | 136 (21.1%) | 508 (78.9%) |
| 20 to 24 Year Olds | 306 (48.8%) | 321 (51.2%) |
| 25 to 34 Year Olds | 208 (71.5%) | 83 (28.5%) |
| 35 Years and over | 89 (90.8%) | 9 (9.2%) |
| Total | 3,385 (72.8%) | 1,265 (27.2%) |
Educational Attainment by Field of Study in Brooke County
Education (1,001 | 26.9%), business (743 | 20.0%), science & technology (431 | 11.6%), arts & humanities (330 | 8.9%), and social sciences (206 | 5.5%) are the most common fields of study among 3,720 individuals in Brooke County who have obtained a bachelor's degree or higher.
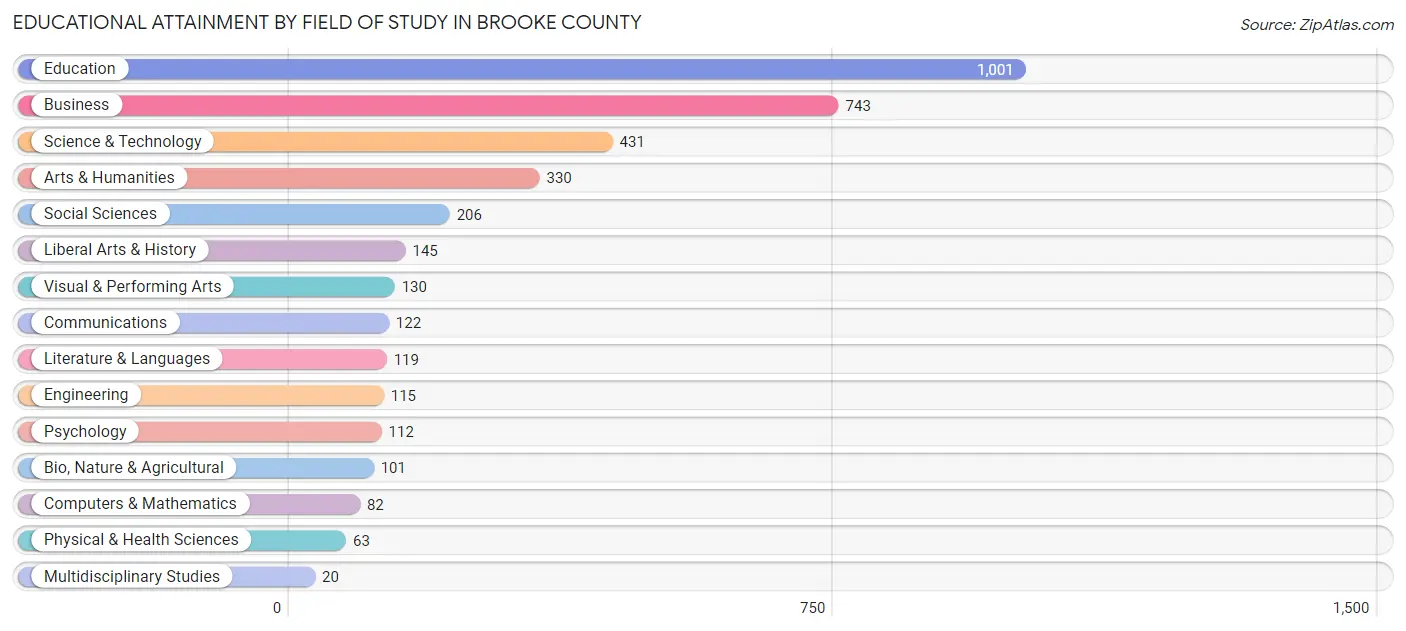
| Field of Study | # Graduates | % Graduates |
| Computers & Mathematics | 82 | 2.2% |
| Bio, Nature & Agricultural | 101 | 2.7% |
| Physical & Health Sciences | 63 | 1.7% |
| Psychology | 112 | 3.0% |
| Social Sciences | 206 | 5.5% |
| Engineering | 115 | 3.1% |
| Multidisciplinary Studies | 20 | 0.5% |
| Science & Technology | 431 | 11.6% |
| Business | 743 | 20.0% |
| Education | 1,001 | 26.9% |
| Literature & Languages | 119 | 3.2% |
| Liberal Arts & History | 145 | 3.9% |
| Visual & Performing Arts | 130 | 3.5% |
| Communications | 122 | 3.3% |
| Arts & Humanities | 330 | 8.9% |
| Total | 3,720 | 100.0% |
Transportation & Commute in Brooke County
Vehicle Availability by Sex in Brooke County
The most prevalent vehicle ownership categories in Brooke County are males with 2 vehicles (2,030, accounting for 41.9%) and females with 2 vehicles (1,786, making up 48.4%).
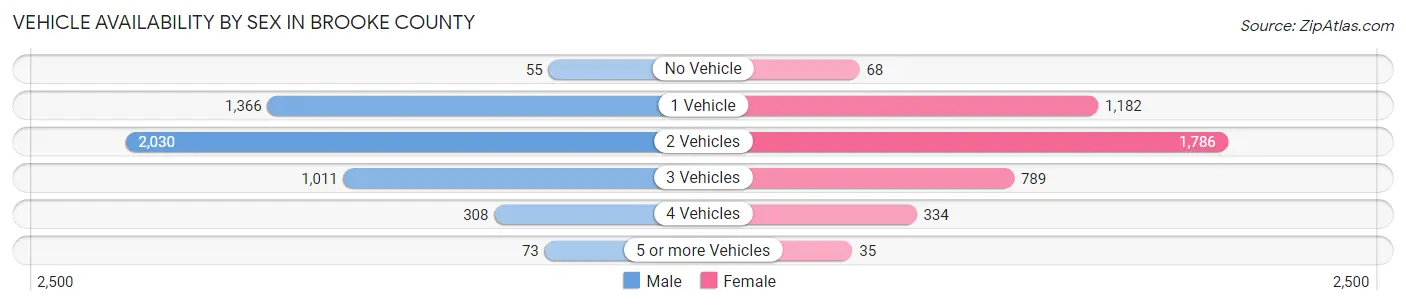
| Vehicles Available | Male | Female |
| No Vehicle | 55 (1.1%) | 68 (1.6%) |
| 1 Vehicle | 1,366 (28.2%) | 1,182 (28.2%) |
| 2 Vehicles | 2,030 (41.9%) | 1,786 (42.6%) |
| 3 Vehicles | 1,011 (20.9%) | 789 (18.8%) |
| 4 Vehicles | 308 (6.4%) | 334 (8.0%) |
| 5 or more Vehicles | 73 (1.5%) | 35 (0.8%) |
| Total | 4,843 (100.0%) | 4,194 (100.0%) |
Commute Time in Brooke County
The most frequently occuring commute durations in Brooke County are 10 to 14 minutes (1,653 commuters, 18.9%), 5 to 9 minutes (1,339 commuters, 15.3%), and 20 to 24 minutes (1,171 commuters, 13.4%).
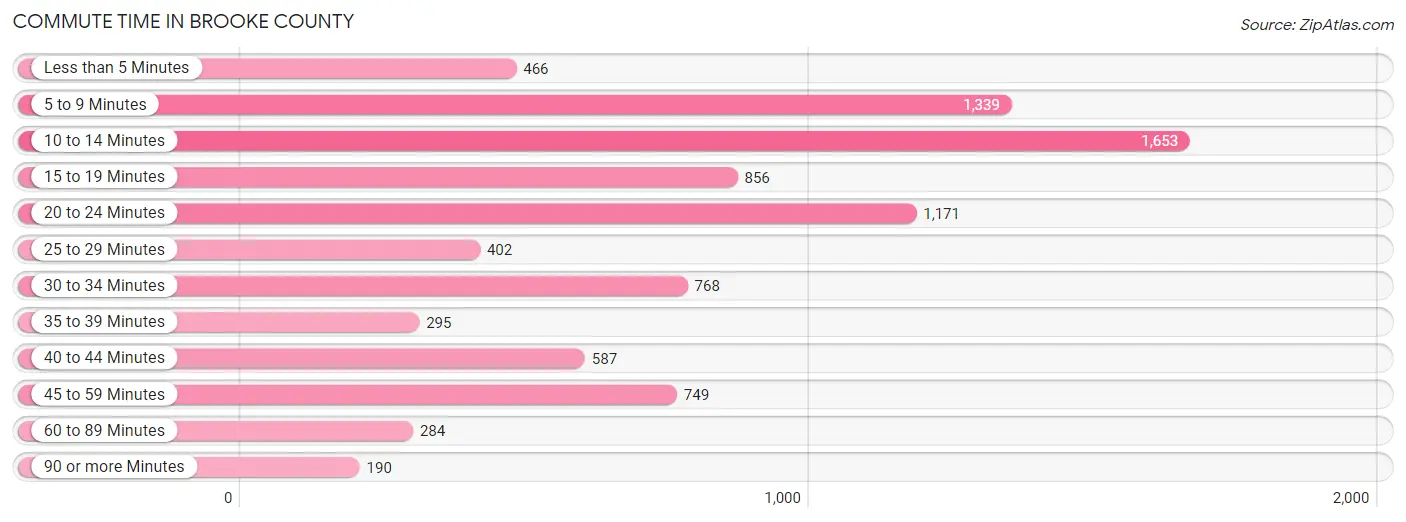
| Commute Time | # Commuters | % Commuters |
| Less than 5 Minutes | 466 | 5.3% |
| 5 to 9 Minutes | 1,339 | 15.3% |
| 10 to 14 Minutes | 1,653 | 18.9% |
| 15 to 19 Minutes | 856 | 9.8% |
| 20 to 24 Minutes | 1,171 | 13.4% |
| 25 to 29 Minutes | 402 | 4.6% |
| 30 to 34 Minutes | 768 | 8.8% |
| 35 to 39 Minutes | 295 | 3.4% |
| 40 to 44 Minutes | 587 | 6.7% |
| 45 to 59 Minutes | 749 | 8.6% |
| 60 to 89 Minutes | 284 | 3.2% |
| 90 or more Minutes | 190 | 2.2% |
Commute Time by Sex in Brooke County
The most common commute times in Brooke County are 10 to 14 minutes (1,040 commuters, 22.0%) for males and 20 to 24 minutes (647 commuters, 16.0%) for females.
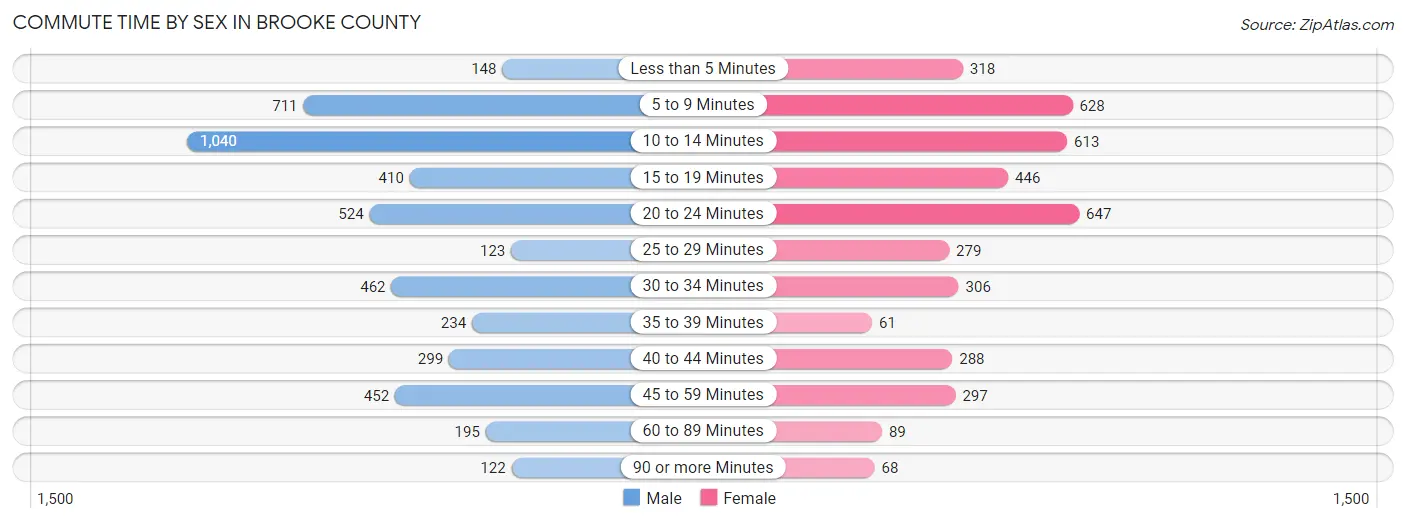
| Commute Time | Male | Female |
| Less than 5 Minutes | 148 (3.1%) | 318 (7.9%) |
| 5 to 9 Minutes | 711 (15.1%) | 628 (15.5%) |
| 10 to 14 Minutes | 1,040 (22.0%) | 613 (15.2%) |
| 15 to 19 Minutes | 410 (8.7%) | 446 (11.0%) |
| 20 to 24 Minutes | 524 (11.1%) | 647 (16.0%) |
| 25 to 29 Minutes | 123 (2.6%) | 279 (6.9%) |
| 30 to 34 Minutes | 462 (9.8%) | 306 (7.6%) |
| 35 to 39 Minutes | 234 (5.0%) | 61 (1.5%) |
| 40 to 44 Minutes | 299 (6.3%) | 288 (7.1%) |
| 45 to 59 Minutes | 452 (9.6%) | 297 (7.3%) |
| 60 to 89 Minutes | 195 (4.1%) | 89 (2.2%) |
| 90 or more Minutes | 122 (2.6%) | 68 (1.7%) |
Time of Departure to Work by Sex in Brooke County
The most frequent times of departure to work in Brooke County are 6:30 AM to 6:59 AM (925, 19.6%) for males and 8:00 AM to 8:29 AM (615, 15.2%) for females.
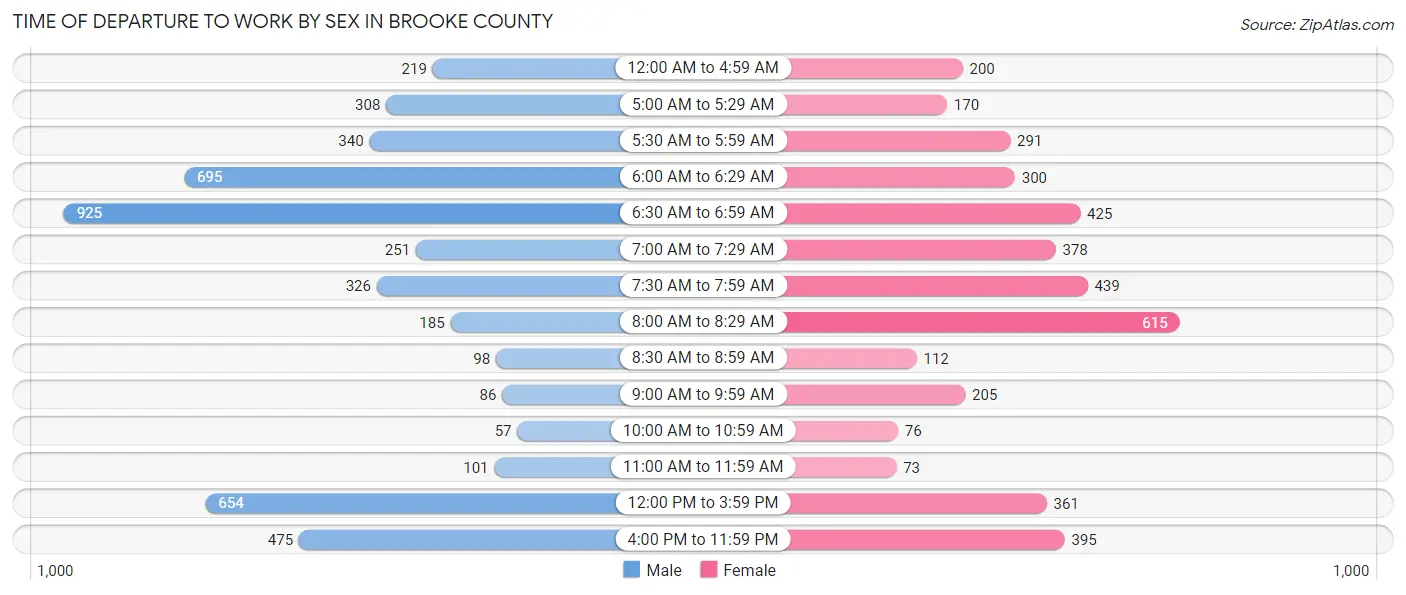
| Time of Departure | Male | Female |
| 12:00 AM to 4:59 AM | 219 (4.6%) | 200 (5.0%) |
| 5:00 AM to 5:29 AM | 308 (6.5%) | 170 (4.2%) |
| 5:30 AM to 5:59 AM | 340 (7.2%) | 291 (7.2%) |
| 6:00 AM to 6:29 AM | 695 (14.7%) | 300 (7.4%) |
| 6:30 AM to 6:59 AM | 925 (19.6%) | 425 (10.5%) |
| 7:00 AM to 7:29 AM | 251 (5.3%) | 378 (9.4%) |
| 7:30 AM to 7:59 AM | 326 (6.9%) | 439 (10.9%) |
| 8:00 AM to 8:29 AM | 185 (3.9%) | 615 (15.2%) |
| 8:30 AM to 8:59 AM | 98 (2.1%) | 112 (2.8%) |
| 9:00 AM to 9:59 AM | 86 (1.8%) | 205 (5.1%) |
| 10:00 AM to 10:59 AM | 57 (1.2%) | 76 (1.9%) |
| 11:00 AM to 11:59 AM | 101 (2.1%) | 73 (1.8%) |
| 12:00 PM to 3:59 PM | 654 (13.9%) | 361 (8.9%) |
| 4:00 PM to 11:59 PM | 475 (10.1%) | 395 (9.8%) |
| Total | 4,720 (100.0%) | 4,040 (100.0%) |
Housing Occupancy in Brooke County
Occupancy by Ownership in Brooke County
Of the total 9,593 dwellings in Brooke County, owner-occupied units account for 7,165 (74.7%), while renter-occupied units make up 2,428 (25.3%).
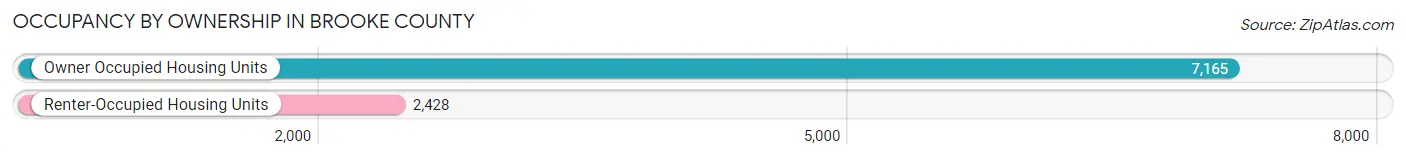
| Occupancy | # Housing Units | % Housing Units |
| Owner Occupied Housing Units | 7,165 | 74.7% |
| Renter-Occupied Housing Units | 2,428 | 25.3% |
| Total Occupied Housing Units | 9,593 | 100.0% |
Occupancy by Household Size in Brooke County
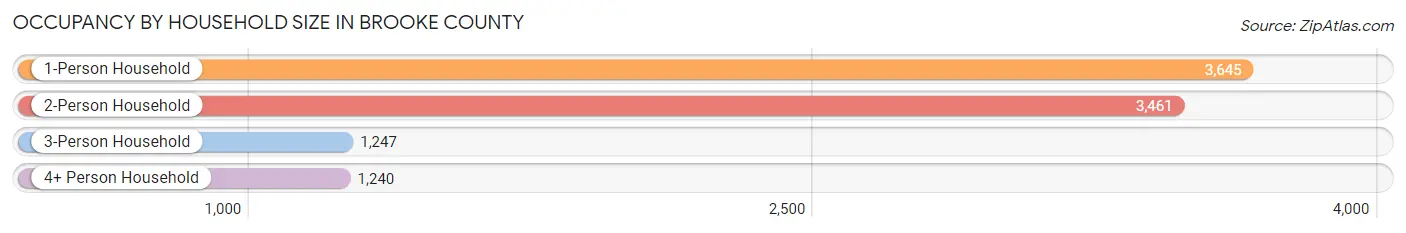
| Household Size | # Housing Units | % Housing Units |
| 1-Person Household | 3,645 | 38.0% |
| 2-Person Household | 3,461 | 36.1% |
| 3-Person Household | 1,247 | 13.0% |
| 4+ Person Household | 1,240 | 12.9% |
| Total Housing Units | 9,593 | 100.0% |
Occupancy by Ownership by Household Size in Brooke County
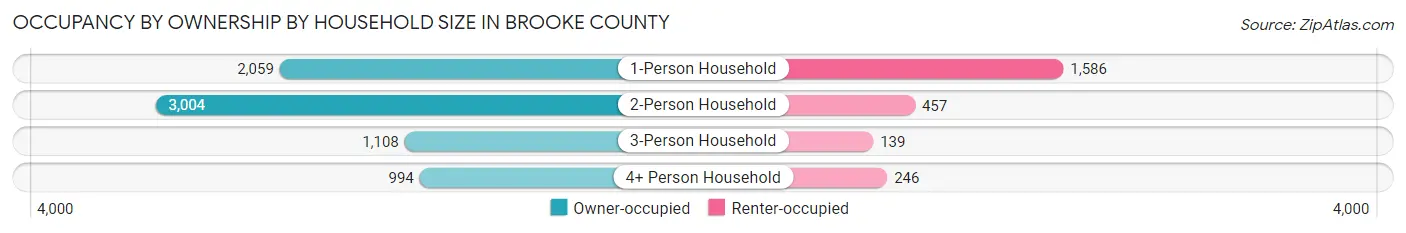
| Household Size | Owner-occupied | Renter-occupied |
| 1-Person Household | 2,059 (56.5%) | 1,586 (43.5%) |
| 2-Person Household | 3,004 (86.8%) | 457 (13.2%) |
| 3-Person Household | 1,108 (88.8%) | 139 (11.2%) |
| 4+ Person Household | 994 (80.2%) | 246 (19.8%) |
| Total Housing Units | 7,165 (74.7%) | 2,428 (25.3%) |
Occupancy by Educational Attainment in Brooke County
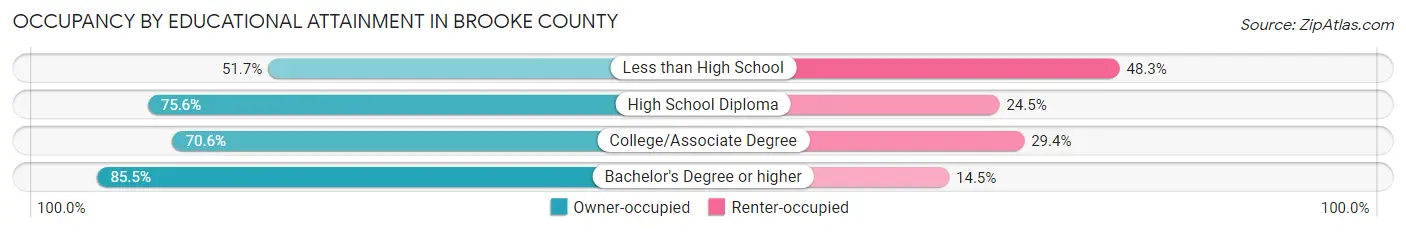
| Household Size | Owner-occupied | Renter-occupied |
| Less than High School | 283 (51.7%) | 264 (48.3%) |
| High School Diploma | 2,941 (75.5%) | 952 (24.4%) |
| College/Associate Degree | 2,214 (70.6%) | 920 (29.4%) |
| Bachelor's Degree or higher | 1,727 (85.5%) | 292 (14.5%) |
Occupancy by Age of Householder in Brooke County
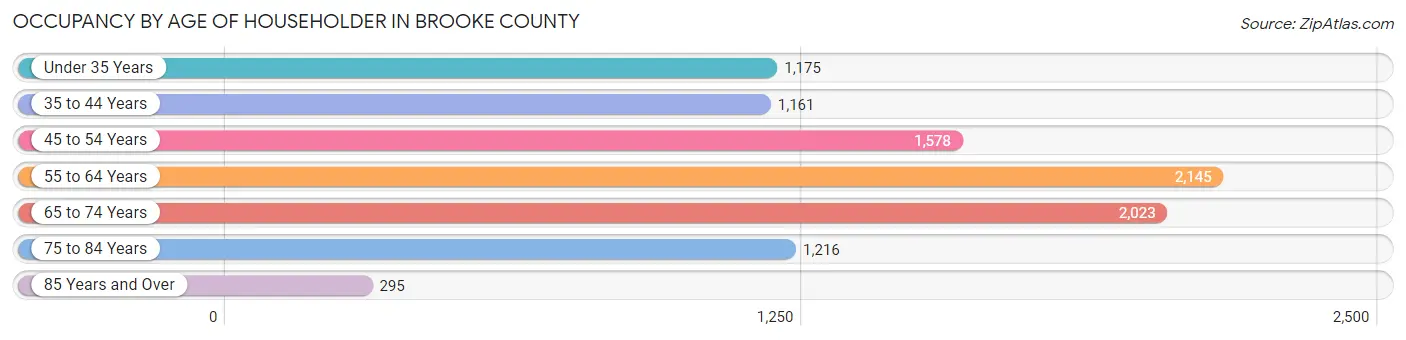
| Age Bracket | # Households | % Households |
| Under 35 Years | 1,175 | 12.2% |
| 35 to 44 Years | 1,161 | 12.1% |
| 45 to 54 Years | 1,578 | 16.5% |
| 55 to 64 Years | 2,145 | 22.4% |
| 65 to 74 Years | 2,023 | 21.1% |
| 75 to 84 Years | 1,216 | 12.7% |
| 85 Years and Over | 295 | 3.1% |
| Total | 9,593 | 100.0% |
Housing Finances in Brooke County
Median Income by Occupancy in Brooke County
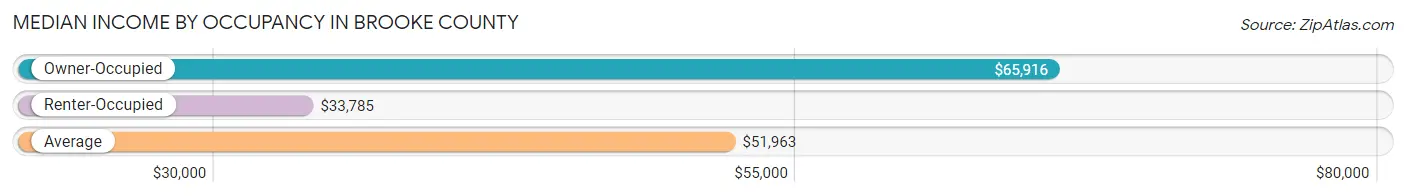
| Occupancy Type | # Households | Median Income |
| Owner-Occupied | 7,165 (74.7%) | $65,916 |
| Renter-Occupied | 2,428 (25.3%) | $33,785 |
| Average | 9,593 (100.0%) | $51,963 |
Occupancy by Householder Income Bracket in Brooke County
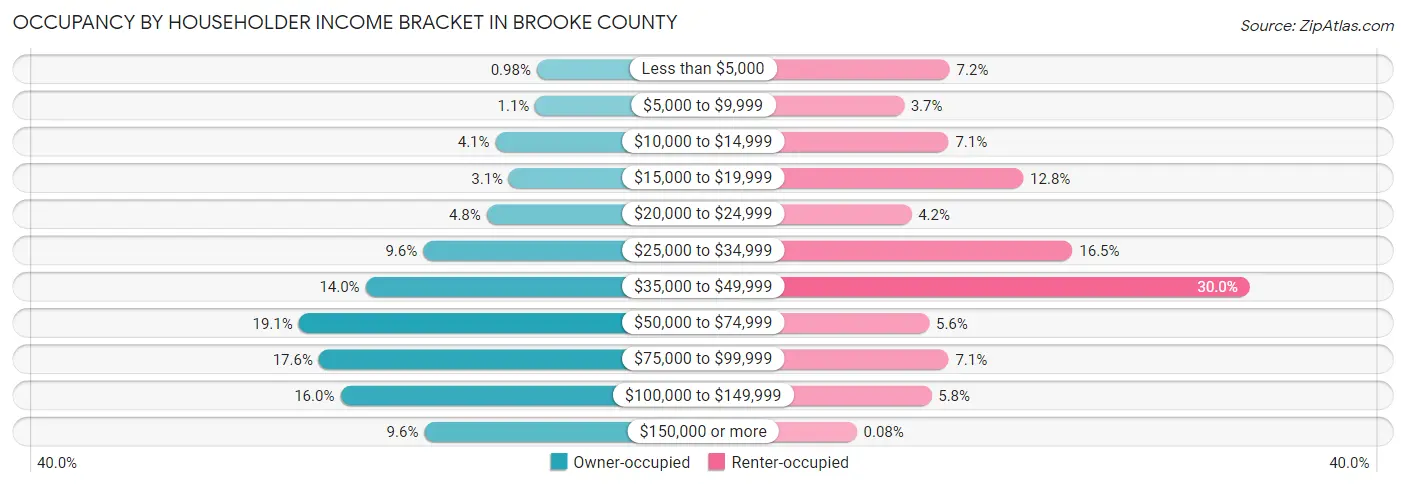
| Income Bracket | Owner-occupied | Renter-occupied |
| Less than $5,000 | 70 (1.0%) | 174 (7.2%) |
| $5,000 to $9,999 | 79 (1.1%) | 89 (3.7%) |
| $10,000 to $14,999 | 296 (4.1%) | 172 (7.1%) |
| $15,000 to $19,999 | 222 (3.1%) | 310 (12.8%) |
| $20,000 to $24,999 | 344 (4.8%) | 103 (4.2%) |
| $25,000 to $34,999 | 691 (9.6%) | 401 (16.5%) |
| $35,000 to $49,999 | 1,005 (14.0%) | 729 (30.0%) |
| $50,000 to $74,999 | 1,371 (19.1%) | 136 (5.6%) |
| $75,000 to $99,999 | 1,260 (17.6%) | 172 (7.1%) |
| $100,000 to $149,999 | 1,143 (16.0%) | 140 (5.8%) |
| $150,000 or more | 684 (9.6%) | 2 (0.1%) |
| Total | 7,165 (100.0%) | 2,428 (100.0%) |
Monthly Housing Cost Tiers in Brooke County
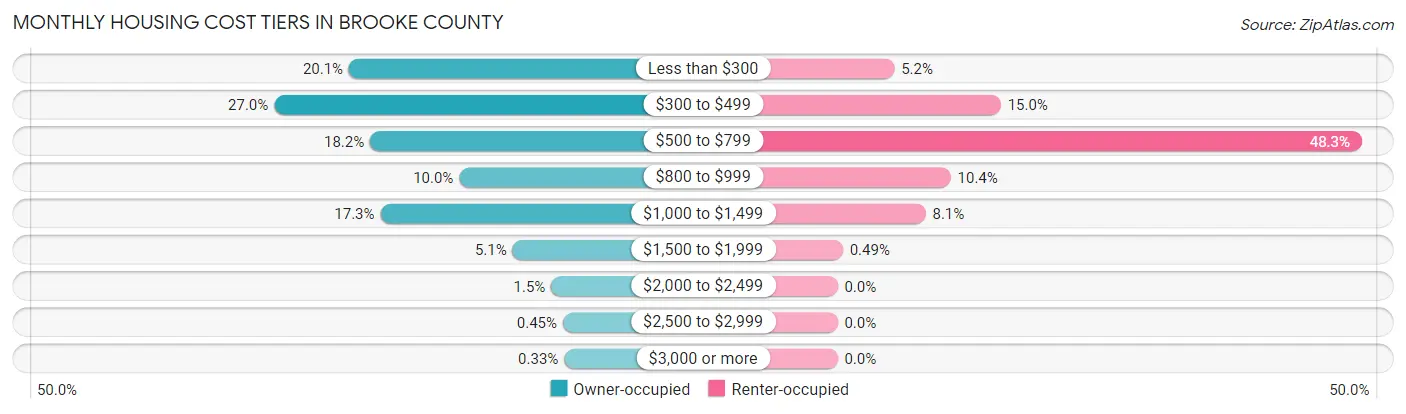
| Monthly Cost | Owner-occupied | Renter-occupied |
| Less than $300 | 1,443 (20.1%) | 127 (5.2%) |
| $300 to $499 | 1,937 (27.0%) | 365 (15.0%) |
| $500 to $799 | 1,304 (18.2%) | 1,172 (48.3%) |
| $800 to $999 | 716 (10.0%) | 253 (10.4%) |
| $1,000 to $1,499 | 1,236 (17.2%) | 197 (8.1%) |
| $1,500 to $1,999 | 364 (5.1%) | 12 (0.5%) |
| $2,000 to $2,499 | 109 (1.5%) | 0 (0.0%) |
| $2,500 to $2,999 | 32 (0.4%) | 0 (0.0%) |
| $3,000 or more | 24 (0.3%) | 0 (0.0%) |
| Total | 7,165 (100.0%) | 2,428 (100.0%) |
Physical Housing Characteristics in Brooke County
Housing Structures in Brooke County
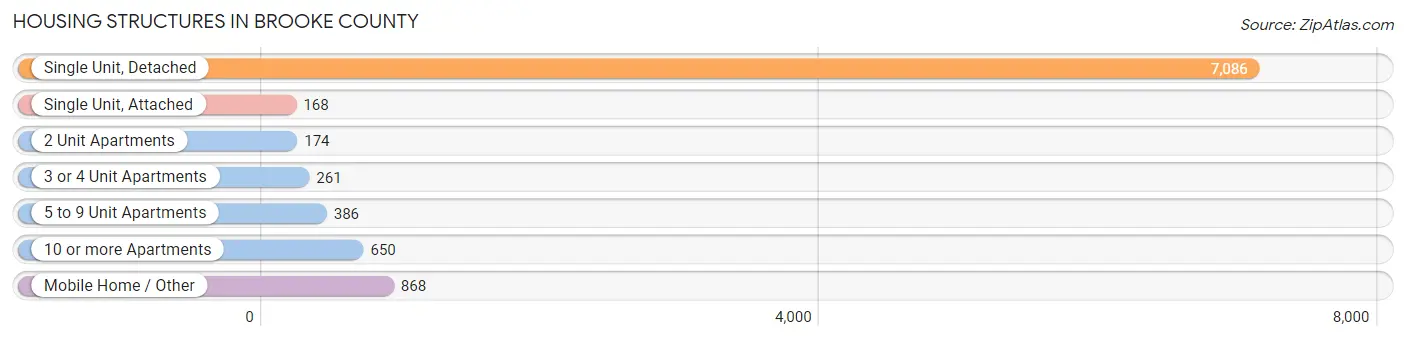
| Structure Type | # Housing Units | % Housing Units |
| Single Unit, Detached | 7,086 | 73.9% |
| Single Unit, Attached | 168 | 1.8% |
| 2 Unit Apartments | 174 | 1.8% |
| 3 or 4 Unit Apartments | 261 | 2.7% |
| 5 to 9 Unit Apartments | 386 | 4.0% |
| 10 or more Apartments | 650 | 6.8% |
| Mobile Home / Other | 868 | 9.0% |
| Total | 9,593 | 100.0% |
Housing Structures by Occupancy in Brooke County
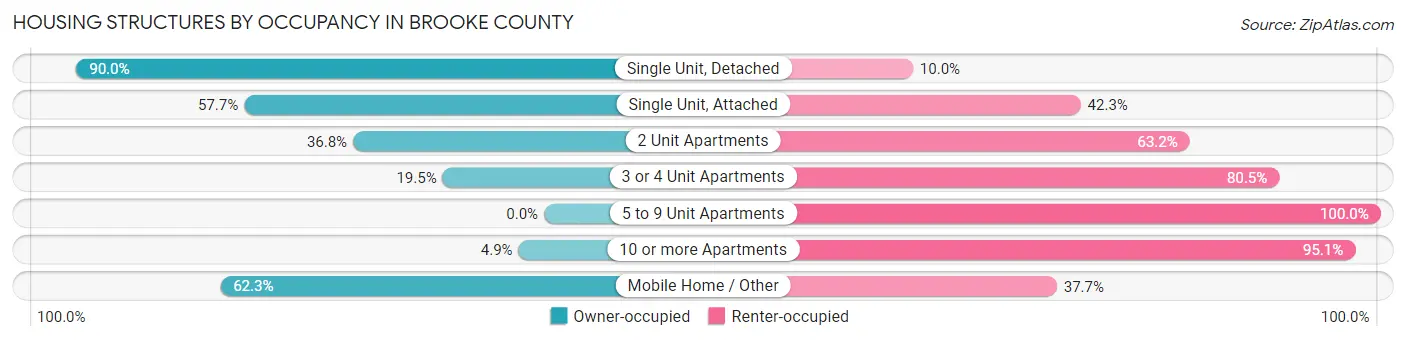
| Structure Type | Owner-occupied | Renter-occupied |
| Single Unit, Detached | 6,380 (90.0%) | 706 (10.0%) |
| Single Unit, Attached | 97 (57.7%) | 71 (42.3%) |
| 2 Unit Apartments | 64 (36.8%) | 110 (63.2%) |
| 3 or 4 Unit Apartments | 51 (19.5%) | 210 (80.5%) |
| 5 to 9 Unit Apartments | 0 (0.0%) | 386 (100.0%) |
| 10 or more Apartments | 32 (4.9%) | 618 (95.1%) |
| Mobile Home / Other | 541 (62.3%) | 327 (37.7%) |
| Total | 7,165 (74.7%) | 2,428 (25.3%) |
Housing Structures by Number of Rooms in Brooke County
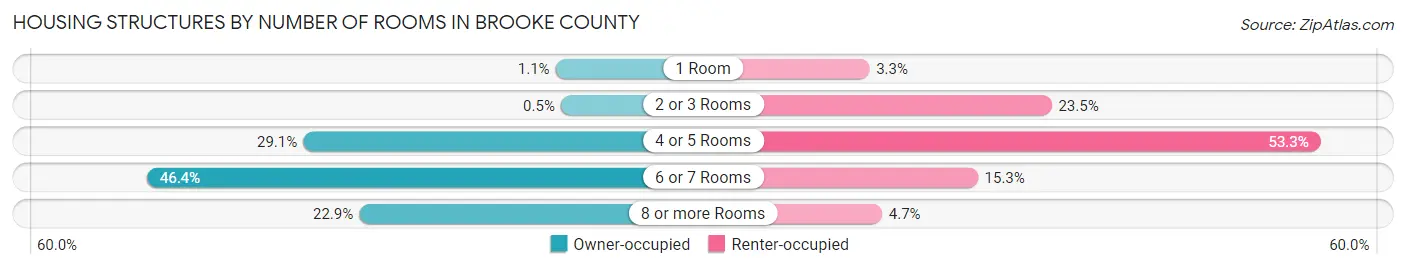
| Number of Rooms | Owner-occupied | Renter-occupied |
| 1 Room | 78 (1.1%) | 79 (3.3%) |
| 2 or 3 Rooms | 36 (0.5%) | 570 (23.5%) |
| 4 or 5 Rooms | 2,085 (29.1%) | 1,295 (53.3%) |
| 6 or 7 Rooms | 3,327 (46.4%) | 371 (15.3%) |
| 8 or more Rooms | 1,639 (22.9%) | 113 (4.6%) |
| Total | 7,165 (100.0%) | 2,428 (100.0%) |
Housing Structure by Heating Type in Brooke County
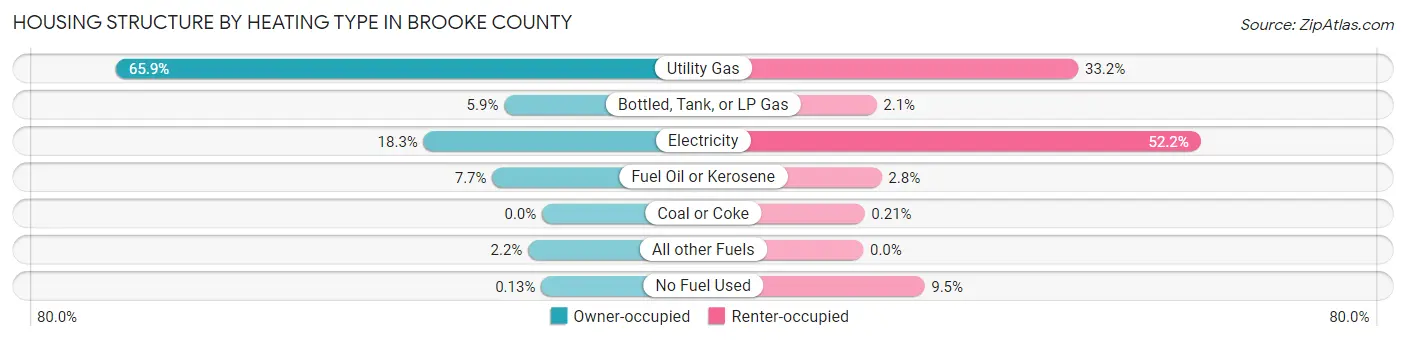
| Heating Type | Owner-occupied | Renter-occupied |
| Utility Gas | 4,720 (65.9%) | 807 (33.2%) |
| Bottled, Tank, or LP Gas | 419 (5.9%) | 50 (2.1%) |
| Electricity | 1,312 (18.3%) | 1,267 (52.2%) |
| Fuel Oil or Kerosene | 551 (7.7%) | 69 (2.8%) |
| Coal or Coke | 0 (0.0%) | 5 (0.2%) |
| All other Fuels | 154 (2.1%) | 0 (0.0%) |
| No Fuel Used | 9 (0.1%) | 230 (9.5%) |
| Total | 7,165 (100.0%) | 2,428 (100.0%) |
Household Vehicle Usage in Brooke County
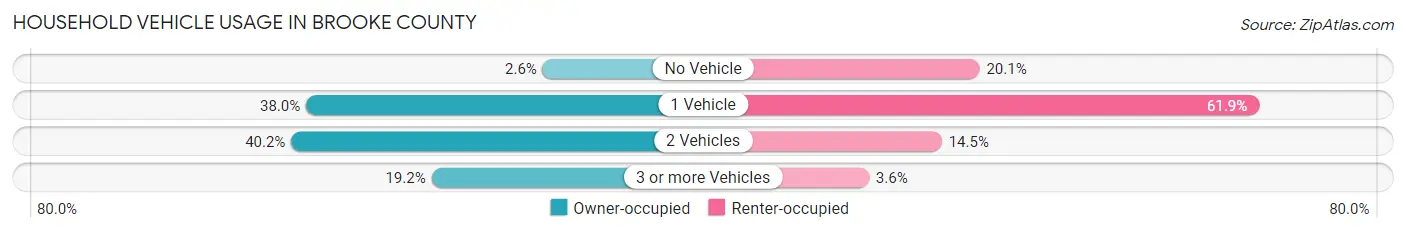
| Vehicles per Household | Owner-occupied | Renter-occupied |
| No Vehicle | 188 (2.6%) | 488 (20.1%) |
| 1 Vehicle | 2,720 (38.0%) | 1,502 (61.9%) |
| 2 Vehicles | 2,879 (40.2%) | 351 (14.5%) |
| 3 or more Vehicles | 1,378 (19.2%) | 87 (3.6%) |
| Total | 7,165 (100.0%) | 2,428 (100.0%) |
Real Estate & Mortgages in Brooke County
Real Estate and Mortgage Overview in Brooke County
| Characteristic | Without Mortgage | With Mortgage |
| Housing Units | 4,144 | 3,021 |
| Median Property Value | $91,700 | $144,600 |
| Median Household Income | $50,914 | $296 |
| Monthly Housing Costs | $350 | $24 |
| Real Estate Taxes | $577 | $51 |
Property Value by Mortgage Status in Brooke County
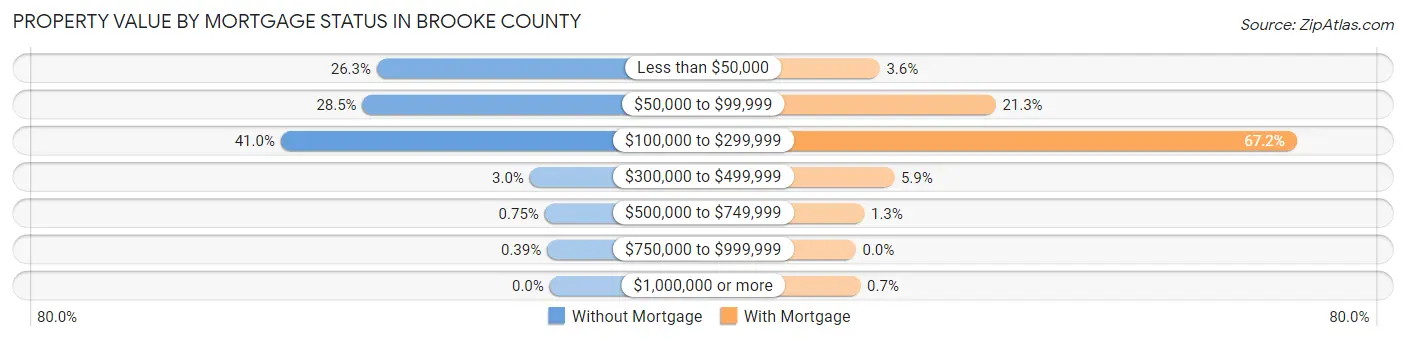
| Property Value | Without Mortgage | With Mortgage |
| Less than $50,000 | 1,091 (26.3%) | 110 (3.6%) |
| $50,000 to $99,999 | 1,182 (28.5%) | 644 (21.3%) |
| $100,000 to $299,999 | 1,698 (41.0%) | 2,030 (67.2%) |
| $300,000 to $499,999 | 126 (3.0%) | 177 (5.9%) |
| $500,000 to $749,999 | 31 (0.7%) | 39 (1.3%) |
| $750,000 to $999,999 | 16 (0.4%) | 0 (0.0%) |
| $1,000,000 or more | 0 (0.0%) | 21 (0.7%) |
| Total | 4,144 (100.0%) | 3,021 (100.0%) |
Household Income by Mortgage Status in Brooke County
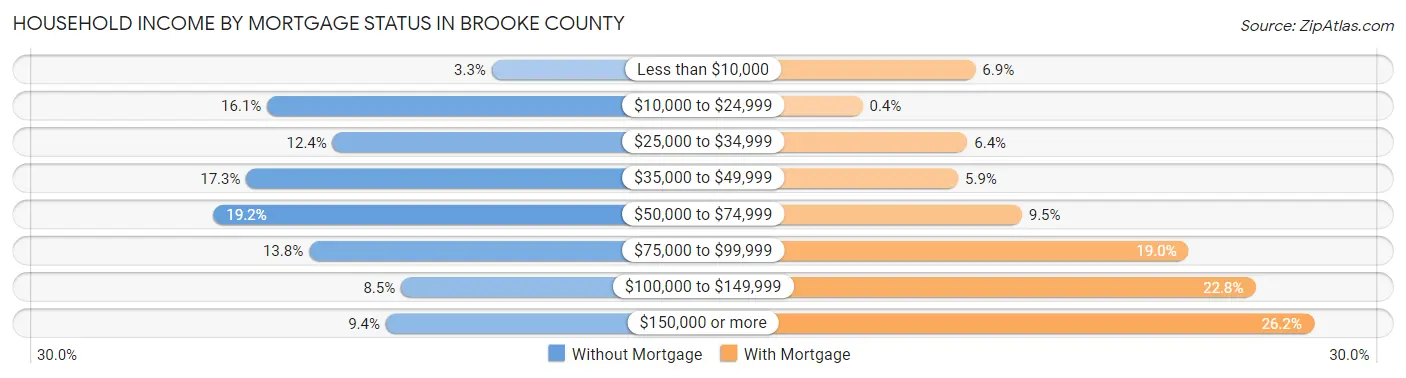
| Household Income | Without Mortgage | With Mortgage |
| Less than $10,000 | 137 (3.3%) | 207 (6.9%) |
| $10,000 to $24,999 | 669 (16.1%) | 12 (0.4%) |
| $25,000 to $34,999 | 514 (12.4%) | 193 (6.4%) |
| $35,000 to $49,999 | 718 (17.3%) | 177 (5.9%) |
| $50,000 to $74,999 | 796 (19.2%) | 287 (9.5%) |
| $75,000 to $99,999 | 570 (13.8%) | 575 (19.0%) |
| $100,000 to $149,999 | 352 (8.5%) | 690 (22.8%) |
| $150,000 or more | 388 (9.4%) | 791 (26.2%) |
| Total | 4,144 (100.0%) | 3,021 (100.0%) |
Property Value to Household Income Ratio in Brooke County
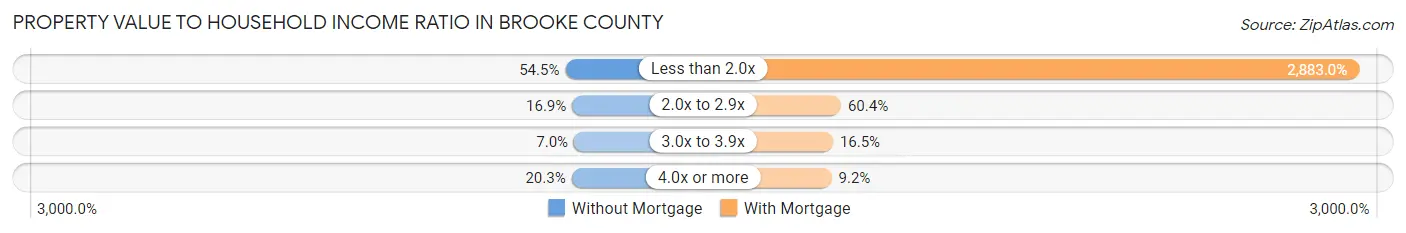
| Value-to-Income Ratio | Without Mortgage | With Mortgage |
| Less than 2.0x | 2,260 (54.5%) | 87,094 (2,882.9%) |
| 2.0x to 2.9x | 699 (16.9%) | 1,824 (60.4%) |
| 3.0x to 3.9x | 289 (7.0%) | 499 (16.5%) |
| 4.0x or more | 841 (20.3%) | 278 (9.2%) |
| Total | 4,144 (100.0%) | 3,021 (100.0%) |
Real Estate Taxes by Mortgage Status in Brooke County
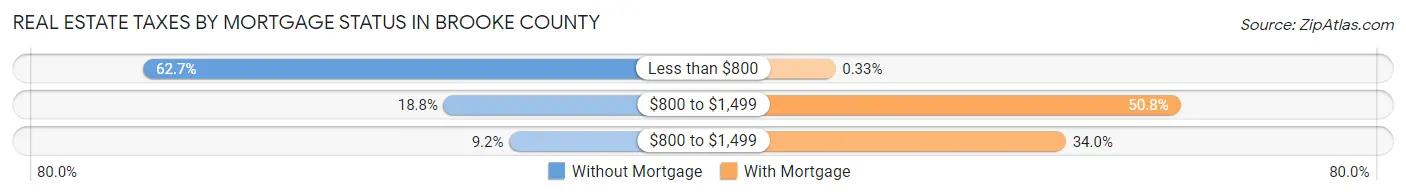
| Property Taxes | Without Mortgage | With Mortgage |
| Less than $800 | 2,597 (62.7%) | 10 (0.3%) |
| $800 to $1,499 | 777 (18.8%) | 1,534 (50.8%) |
| $800 to $1,499 | 380 (9.2%) | 1,027 (34.0%) |
| Total | 4,144 (100.0%) | 3,021 (100.0%) |
Health & Disability in Brooke County
Health Insurance Coverage by Age in Brooke County
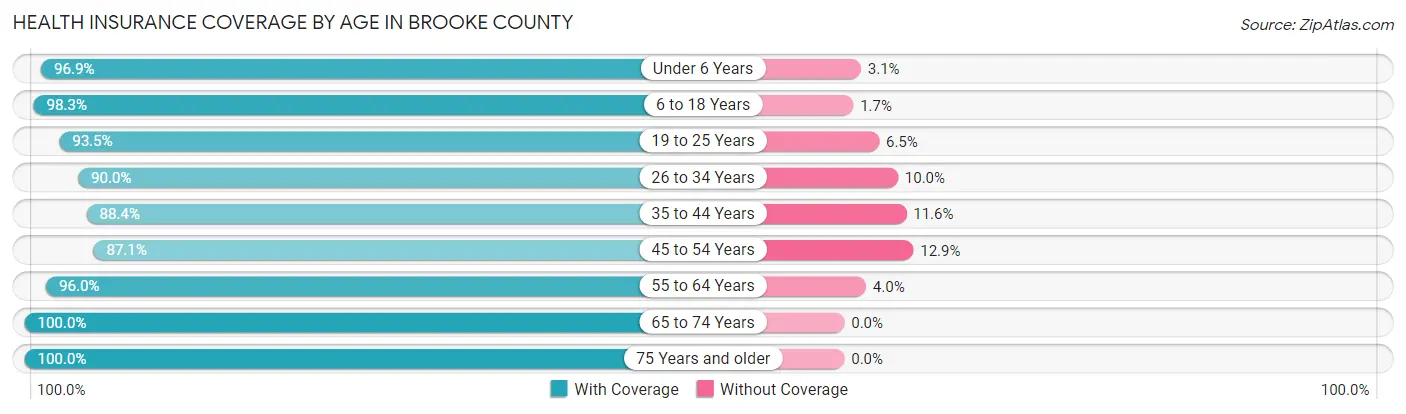
| Age Bracket | With Coverage | Without Coverage |
| Under 6 Years | 1,162 (96.9%) | 37 (3.1%) |
| 6 to 18 Years | 3,001 (98.3%) | 51 (1.7%) |
| 19 to 25 Years | 2,007 (93.5%) | 139 (6.5%) |
| 26 to 34 Years | 1,811 (90.0%) | 201 (10.0%) |
| 35 to 44 Years | 2,050 (88.4%) | 268 (11.6%) |
| 45 to 54 Years | 2,403 (87.1%) | 355 (12.9%) |
| 55 to 64 Years | 3,288 (96.0%) | 138 (4.0%) |
| 65 to 74 Years | 3,126 (100.0%) | 0 (0.0%) |
| 75 Years and older | 2,080 (100.0%) | 0 (0.0%) |
| Total | 20,928 (94.6%) | 1,189 (5.4%) |
Health Insurance Coverage by Citizenship Status in Brooke County
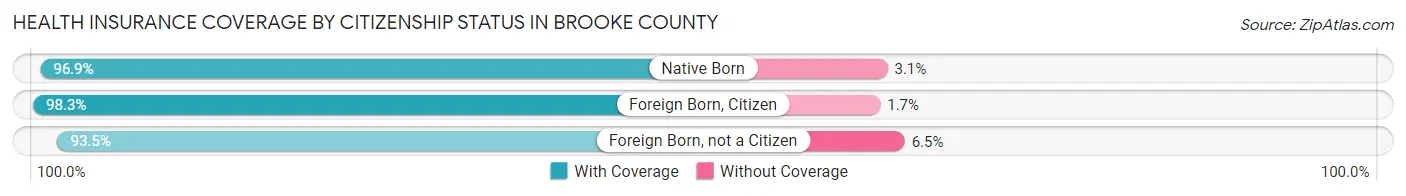
| Citizenship Status | With Coverage | Without Coverage |
| Native Born | 1,162 (96.9%) | 37 (3.1%) |
| Foreign Born, Citizen | 3,001 (98.3%) | 51 (1.7%) |
| Foreign Born, not a Citizen | 2,007 (93.5%) | 139 (6.5%) |
Health Insurance Coverage by Household Income in Brooke County
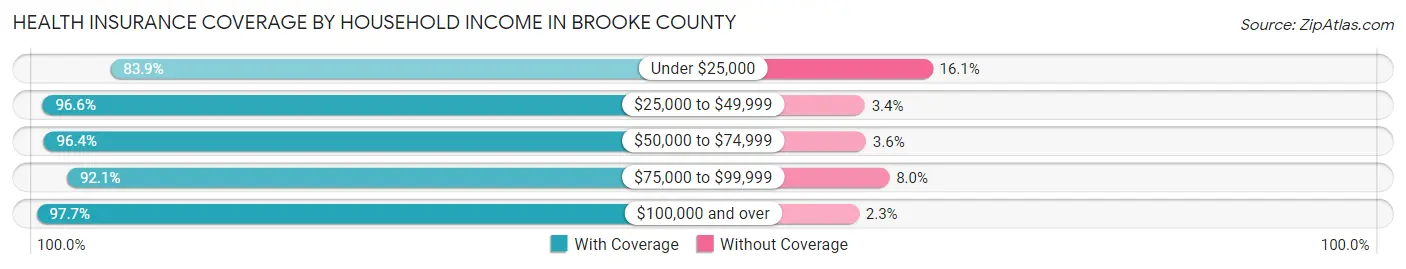
| Household Income | With Coverage | Without Coverage |
| Under $25,000 | 2,313 (83.9%) | 443 (16.1%) |
| $25,000 to $49,999 | 5,231 (96.6%) | 182 (3.4%) |
| $50,000 to $74,999 | 3,394 (96.4%) | 126 (3.6%) |
| $75,000 to $99,999 | 3,564 (92.0%) | 308 (8.0%) |
| $100,000 and over | 5,628 (97.7%) | 130 (2.3%) |
Public vs Private Health Insurance Coverage by Age in Brooke County
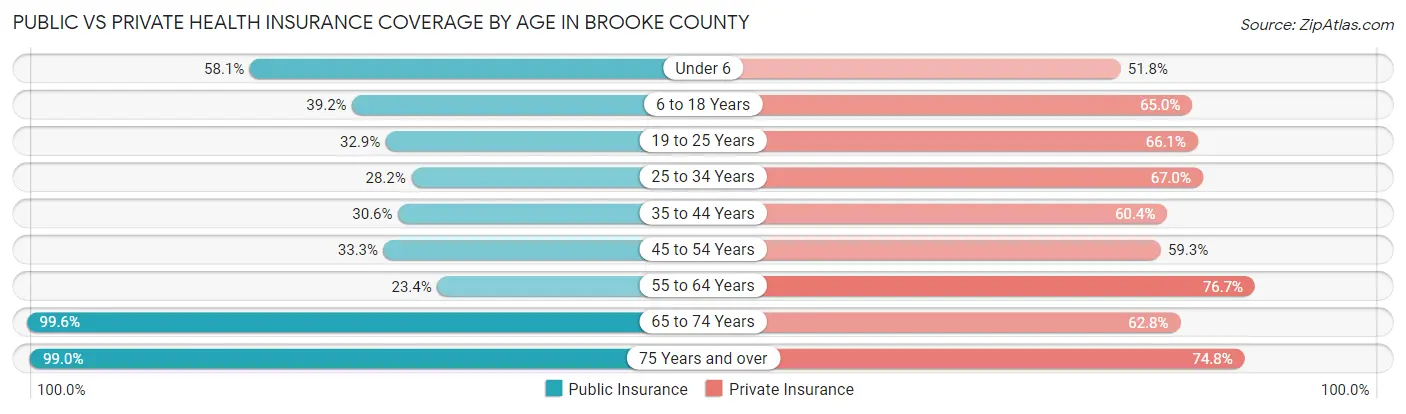
| Age Bracket | Public Insurance | Private Insurance |
| Under 6 | 697 (58.1%) | 621 (51.8%) |
| 6 to 18 Years | 1,195 (39.2%) | 1,985 (65.0%) |
| 19 to 25 Years | 706 (32.9%) | 1,418 (66.1%) |
| 25 to 34 Years | 567 (28.2%) | 1,348 (67.0%) |
| 35 to 44 Years | 710 (30.6%) | 1,400 (60.4%) |
| 45 to 54 Years | 919 (33.3%) | 1,634 (59.3%) |
| 55 to 64 Years | 800 (23.4%) | 2,627 (76.7%) |
| 65 to 74 Years | 3,114 (99.6%) | 1,964 (62.8%) |
| 75 Years and over | 2,059 (99.0%) | 1,555 (74.8%) |
| Total | 10,767 (48.7%) | 14,552 (65.8%) |
Disability Status by Sex by Age in Brooke County
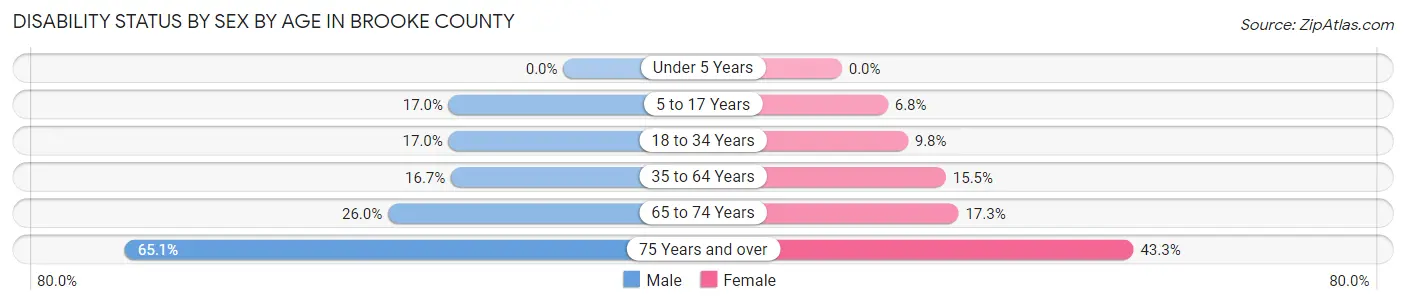
| Age Bracket | Male | Female |
| Under 5 Years | 0 (0.0%) | 0 (0.0%) |
| 5 to 17 Years | 254 (17.0%) | 100 (6.8%) |
| 18 to 34 Years | 407 (17.0%) | 206 (9.8%) |
| 35 to 64 Years | 713 (16.7%) | 653 (15.4%) |
| 65 to 74 Years | 387 (26.0%) | 284 (17.3%) |
| 75 Years and over | 586 (65.1%) | 511 (43.3%) |
Disability Class by Sex by Age in Brooke County
Disability Class: Hearing Difficulty
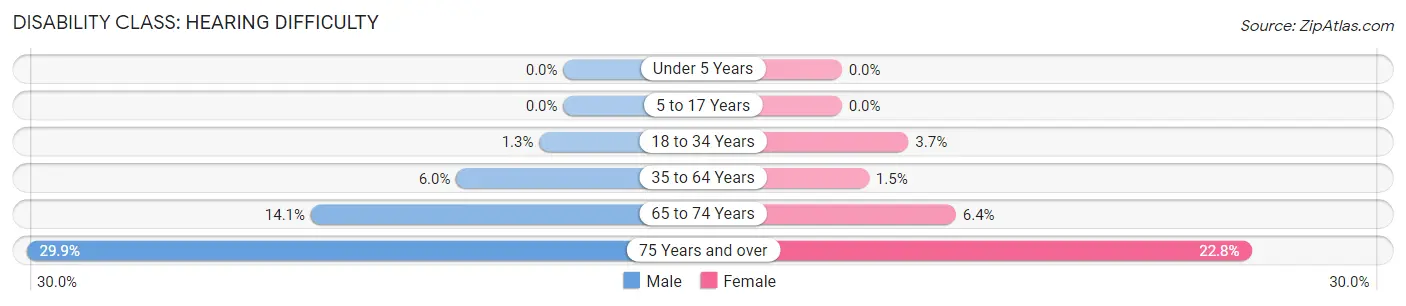
| Age Bracket | Male | Female |
| Under 5 Years | 0 (0.0%) | 0 (0.0%) |
| 5 to 17 Years | 0 (0.0%) | 0 (0.0%) |
| 18 to 34 Years | 32 (1.3%) | 78 (3.7%) |
| 35 to 64 Years | 255 (6.0%) | 64 (1.5%) |
| 65 to 74 Years | 209 (14.1%) | 104 (6.4%) |
| 75 Years and over | 269 (29.9%) | 269 (22.8%) |
Disability Class: Vision Difficulty
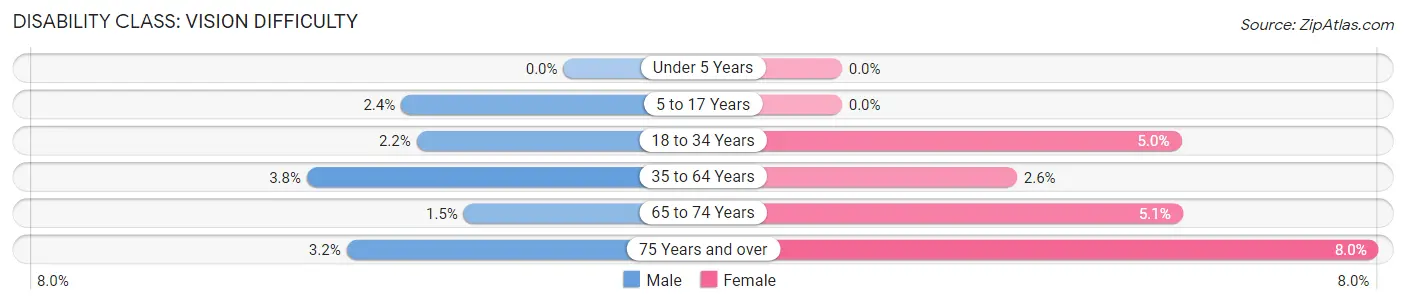
| Age Bracket | Male | Female |
| Under 5 Years | 0 (0.0%) | 0 (0.0%) |
| 5 to 17 Years | 36 (2.4%) | 0 (0.0%) |
| 18 to 34 Years | 52 (2.2%) | 106 (5.0%) |
| 35 to 64 Years | 163 (3.8%) | 110 (2.6%) |
| 65 to 74 Years | 22 (1.5%) | 83 (5.1%) |
| 75 Years and over | 29 (3.2%) | 94 (8.0%) |
Disability Class: Cognitive Difficulty
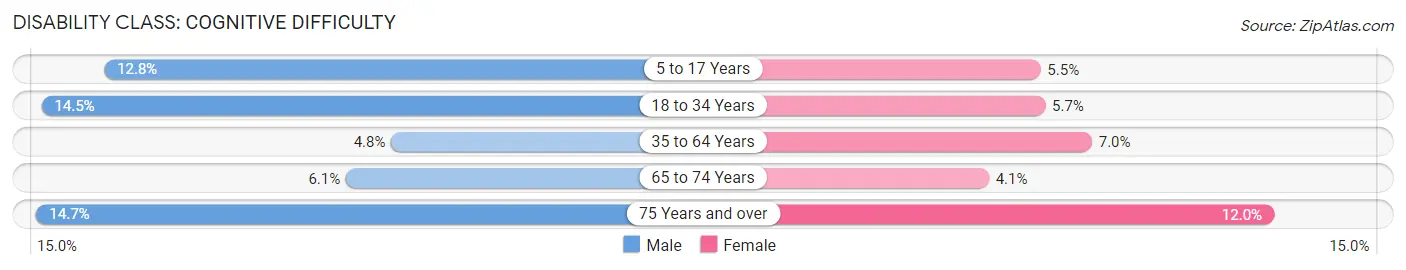
| Age Bracket | Male | Female |
| 5 to 17 Years | 191 (12.8%) | 81 (5.5%) |
| 18 to 34 Years | 347 (14.5%) | 119 (5.7%) |
| 35 to 64 Years | 205 (4.8%) | 294 (7.0%) |
| 65 to 74 Years | 90 (6.0%) | 67 (4.1%) |
| 75 Years and over | 132 (14.7%) | 142 (12.0%) |
Disability Class: Ambulatory Difficulty
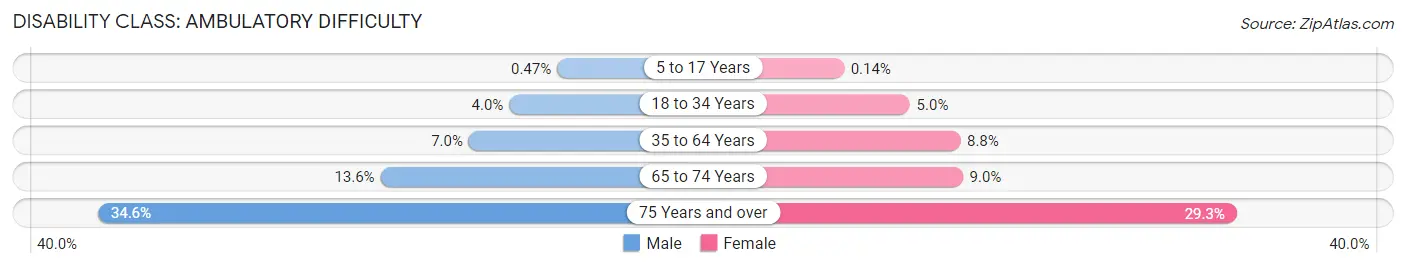
| Age Bracket | Male | Female |
| 5 to 17 Years | 7 (0.5%) | 2 (0.1%) |
| 18 to 34 Years | 96 (4.0%) | 106 (5.0%) |
| 35 to 64 Years | 300 (7.0%) | 371 (8.8%) |
| 65 to 74 Years | 202 (13.6%) | 147 (9.0%) |
| 75 Years and over | 311 (34.6%) | 346 (29.3%) |
Disability Class: Self-Care Difficulty
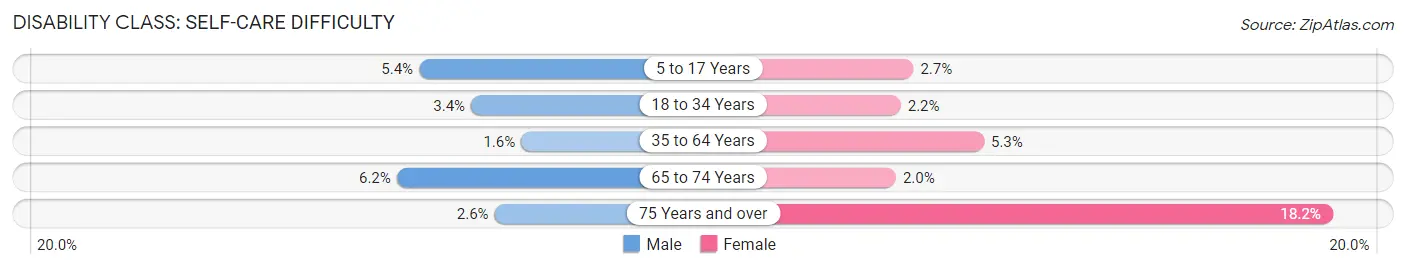
| Age Bracket | Male | Female |
| 5 to 17 Years | 80 (5.4%) | 39 (2.7%) |
| 18 to 34 Years | 82 (3.4%) | 46 (2.2%) |
| 35 to 64 Years | 67 (1.6%) | 223 (5.3%) |
| 65 to 74 Years | 92 (6.2%) | 33 (2.0%) |
| 75 Years and over | 23 (2.6%) | 215 (18.2%) |
Technology Access in Brooke County
Computing Device Access in Brooke County
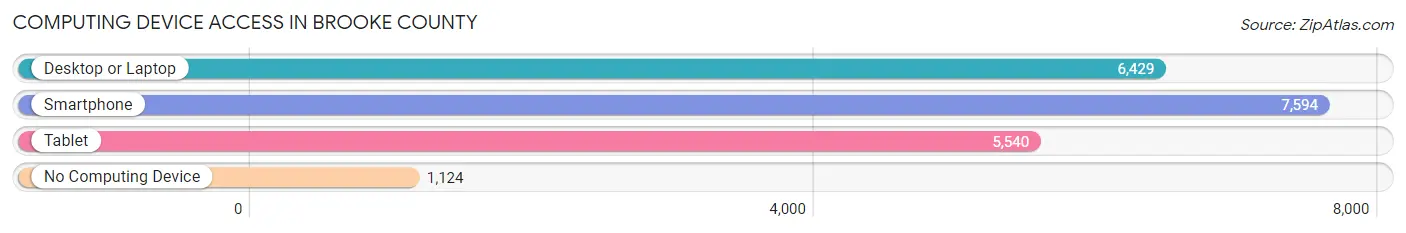
| Device Type | # Households | % Households |
| Desktop or Laptop | 6,429 | 67.0% |
| Smartphone | 7,594 | 79.2% |
| Tablet | 5,540 | 57.8% |
| No Computing Device | 1,124 | 11.7% |
| Total | 9,593 | 100.0% |
Internet Access in Brooke County
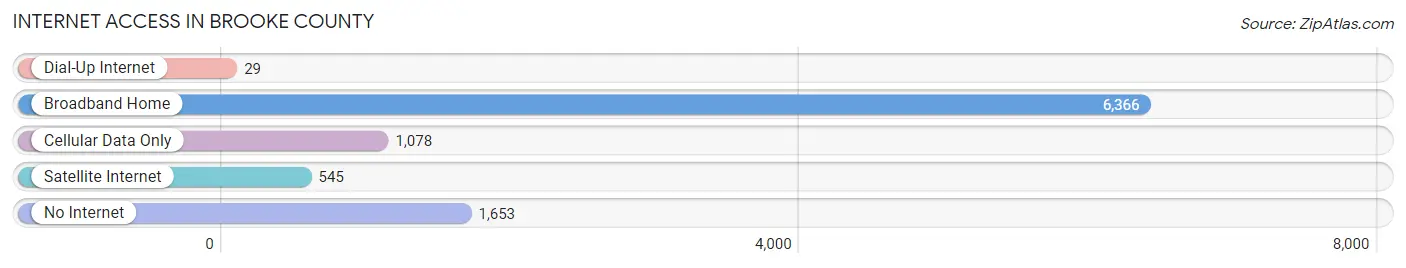
| Internet Type | # Households | % Households |
| Dial-Up Internet | 29 | 0.3% |
| Broadband Home | 6,366 | 66.4% |
| Cellular Data Only | 1,078 | 11.2% |
| Satellite Internet | 545 | 5.7% |
| No Internet | 1,653 | 17.2% |
| Total | 9,593 | 100.0% |
Brooke County Summary
Brooke County is located in the northern panhandle of West Virginia, and is bordered by Ohio to the north, Marshall County to the east, Hancock County to the south, and Ohio County to the west. The county seat is Wellsburg, and the county was named for Robert Brooke, the colonial governor of Virginia from 1788 to 1791.
History
The area that is now Brooke County was originally part of the Virginia Colony, and was part of the Ohio Country, which was claimed by both Virginia and Pennsylvania. In 1776, the area became part of the newly formed state of West Virginia. The county was created in 1848 from parts of Ohio and Marshall counties.
The county was home to several Native American tribes, including the Shawnee, Mingo, and Delaware. The first European settlers arrived in the area in the late 1700s, and the county was officially established in 1848.
During the Civil War, Brooke County was a major center of Union activity, and the county was the site of several battles. After the war, the county experienced a period of economic growth, with the development of coal mining, oil and gas production, and manufacturing.
Geography
Brooke County covers an area of approximately 200 square miles, and is located in the northern panhandle of West Virginia. The county is bordered by Ohio to the north, Marshall County to the east, Hancock County to the south, and Ohio County to the west. The county is located in the Appalachian Plateau region of West Virginia, and is characterized by rolling hills and valleys.
The county is home to several rivers, including the Ohio River, which forms the northern border of the county, and the Little Kanawha River, which flows through the county. The county also contains several lakes, including Brooke Lake and Indian Creek Lake.
Economy
The economy of Brooke County is largely based on manufacturing, agriculture, and tourism. The county is home to several manufacturing companies, including a steel mill, a glass factory, and a paper mill. The county is also home to several agricultural operations, including dairy farms, beef farms, and poultry farms.
The county is also home to several tourist attractions, including the Brooke County Museum, the Wellsburg Historic District, and the Brooke County Fairgrounds.
Demographics
As of the 2010 census, the population of Brooke County was 24,069. The population is largely white (96.2%), with small percentages of African Americans (2.2%), Native Americans (0.3%), Asians (0.2%), and other races (1.1%). The median household income in the county is $41,945, and the median age is 42.7 years.
Common Questions
What is the Total Population of Brooke County?
Total Population of Brooke County is 22,349.
What is the Total Male Population of Brooke County?
Total Male Population of Brooke County is 11,092.
What is the Total Female Population of Brooke County?
Total Female Population of Brooke County is 11,257.
What is the Ratio of Males per 100 Females in Brooke County?
There are 98.53 Males per 100 Females in Brooke County.
What is the Ratio of Females per 100 Males in Brooke County?
There are 101.49 Females per 100 Males in Brooke County.
What is the Median Population Age in Brooke County?
Median Population Age in Brooke County is 46.4 Years.
What is the Average Family Size in Brooke County
Average Family Size in Brooke County is 2.9 People.
What is the Average Household Size in Brooke County
Average Household Size in Brooke County is 2.2 People.
What is Per Capita Income in Brooke County?
Per Capita income in Brooke County is $30,400.
What is the Median Family Income in Brooke County?
Median Family Income in Brooke County is $73,380.
What is the Median Household income in Brooke County?
Median Household Income in Brooke County is $51,963.
What is Income or Wage Gap in Brooke County?
Income or Wage Gap in Brooke County is 30.4%.
Women in Brooke County earn 69.6 cents for every dollar earned by a man.
What is Family Income Deficit in Brooke County?
Family Income Deficit in Brooke County is $10,259.
Families that are below poverty line in Brooke County earn $10,259 less on average than the poverty threshold level.
What is Inequality or Gini Index in Brooke County?
Inequality or Gini Index in Brooke County is 0.41.
How Large is the Labor Force in Brooke County?
There are 10,215 People in the Labor Forcein in Brooke County.
What is the Percentage of People in the Labor Force in Brooke County?
54.0% of People are in the Labor Force in Brooke County.
What is the Unemployment Rate in Brooke County?
Unemployment Rate in Brooke County is 5.7%.