Braxton County, WV
Braxton County Map

Braxton County Overview
12,505
TOTAL POPULATION
6,406
MALE POPULATION
6,099
FEMALE POPULATION
105.03
MALES / 100 FEMALES
95.21
FEMALES / 100 MALES
46.8
MEDIAN AGE
3.2
AVG FAMILY SIZE
2.6
AVG HOUSEHOLD SIZE
$21,948
PER CAPITA INCOME
$46,045
AVG FAMILY INCOME
$42,245
AVG HOUSEHOLD INCOME
16.8%
WAGE / INCOME GAP [ % ]
83.2¢/ $1
WAGE / INCOME GAP [ $ ]
$7,259
FAMILY INCOME DEFICIT
0.41
INEQUALITY / GINI INDEX
4,467
LABOR FORCE [ PEOPLE ]
42.6%
PERCENT IN LABOR FORCE
14.4%
UNEMPLOYMENT RATE
Race in Braxton County
The most populous races in Braxton County are White / Caucasian (11,186 | 89.4%), Two or more Races (1,135 | 9.1%), and Hispanic or Latino (137 | 1.1%).

| Race | # Population | % Population |
| Asian | 11 | 0.1% |
| Black / African American | 131 | 1.1% |
| Hawaiian / Pacific | 0 | 0.0% |
| Hispanic or Latino | 137 | 1.1% |
| Native / Alaskan | 33 | 0.3% |
| White / Caucasian | 11,186 | 89.4% |
| Two or more Races | 1,135 | 9.1% |
| Some other Race | 9 | 0.1% |
| Total | 12,505 | 100.0% |
Ancestry in Braxton County
The most populous ancestries reported in Braxton County are German (2,333 | 18.7%), Irish (1,956 | 15.6%), English (1,521 | 12.2%), American (946 | 7.6%), and French (192 | 1.5%), together accounting for 55.6% of all Braxton County residents.

| Ancestry | # Population | % Population |
| African | 23 | 0.2% |
| American | 946 | 7.6% |
| Blackfeet | 67 | 0.5% |
| British | 23 | 0.2% |
| Cajun | 11 | 0.1% |
| Celtic | 21 | 0.2% |
| Central American | 9 | 0.1% |
| Cherokee | 40 | 0.3% |
| Cuban | 6 | 0.1% |
| Czech | 33 | 0.3% |
| Danish | 4 | 0.0% |
| Dutch | 166 | 1.3% |
| Eastern European | 1 | 0.0% |
| English | 1,521 | 12.2% |
| European | 78 | 0.6% |
| French | 192 | 1.5% |
| French Canadian | 11 | 0.1% |
| German | 2,333 | 18.7% |
| Hungarian | 2 | 0.0% |
| Indian (Asian) | 41 | 0.3% |
| Irish | 1,956 | 15.6% |
| Italian | 149 | 1.2% |
| Korean | 5 | 0.0% |
| Mexican | 122 | 1.0% |
| Northern European | 29 | 0.2% |
| Norwegian | 11 | 0.1% |
| Polish | 31 | 0.3% |
| Russian | 11 | 0.1% |
| Salvadoran | 9 | 0.1% |
| Scandinavian | 2 | 0.0% |
| Scotch-Irish | 125 | 1.0% |
| Scottish | 185 | 1.5% |
| Slovene | 9 | 0.1% |
| Subsaharan African | 23 | 0.2% |
| Swedish | 5 | 0.0% |
| Swiss | 15 | 0.1% |
| Welsh | 70 | 0.6% | View All 37 Rows |
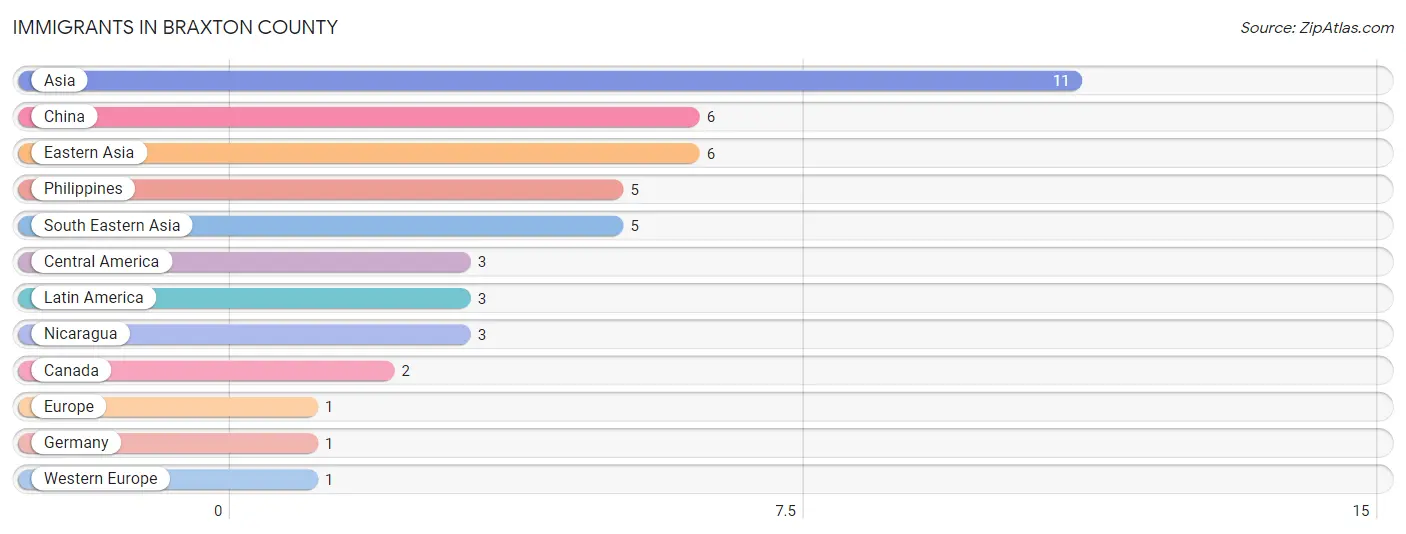
Immigrants in Braxton County
The most numerous immigrant groups reported in Braxton County came from Asia (11 | 0.1%), China (6 | 0.1%), Eastern Asia (6 | 0.1%), Philippines (5 | 0.0%), and South Eastern Asia (5 | 0.0%), together accounting for 0.3% of all Braxton County residents.
| Immigration Origin | # Population | % Population |
| Asia | 11 | 0.1% |
| Canada | 2 | 0.0% |
| Central America | 3 | 0.0% |
| China | 6 | 0.1% |
| Eastern Asia | 6 | 0.1% |
| Europe | 1 | 0.0% |
| Germany | 1 | 0.0% |
| Latin America | 3 | 0.0% |
| Nicaragua | 3 | 0.0% |
| Philippines | 5 | 0.0% |
| South Eastern Asia | 5 | 0.0% |
| Western Europe | 1 | 0.0% | View All 12 Rows |
Sex and Age in Braxton County
Sex and Age in Braxton County
The most populous age groups in Braxton County are 60 to 64 Years (591 | 9.2%) for men and 65 to 69 Years (519 | 8.5%) for women.

| Age Bracket | Male | Female |
| Under 5 Years | 268 (4.2%) | 269 (4.4%) |
| 5 to 9 Years | 311 (4.9%) | 315 (5.2%) |
| 10 to 14 Years | 420 (6.6%) | 371 (6.1%) |
| 15 to 19 Years | 383 (6.0%) | 314 (5.1%) |
| 20 to 24 Years | 281 (4.4%) | 281 (4.6%) |
| 25 to 29 Years | 387 (6.0%) | 337 (5.5%) |
| 30 to 34 Years | 380 (5.9%) | 340 (5.6%) |
| 35 to 39 Years | 432 (6.7%) | 193 (3.2%) |
| 40 to 44 Years | 261 (4.1%) | 442 (7.2%) |
| 45 to 49 Years | 400 (6.2%) | 416 (6.8%) |
| 50 to 54 Years | 429 (6.7%) | 410 (6.7%) |
| 55 to 59 Years | 365 (5.7%) | 453 (7.4%) |
| 60 to 64 Years | 591 (9.2%) | 444 (7.3%) |
| 65 to 69 Years | 404 (6.3%) | 519 (8.5%) |
| 70 to 74 Years | 457 (7.1%) | 353 (5.8%) |
| 75 to 79 Years | 243 (3.8%) | 260 (4.3%) |
| 80 to 84 Years | 233 (3.6%) | 142 (2.3%) |
| 85 Years and over | 161 (2.5%) | 240 (3.9%) |
| Total | 6,406 (100.0%) | 6,099 (100.0%) |
Families and Households in Braxton County
Median Family Size in Braxton County
The median family size in Braxton County is 3.18 persons per family, with single male/father families (246 | 7.9%) accounting for the largest median family size of 3.59 persons per family. On the other hand, single female/mother families (485 | 15.5%) represent the smallest median family size with 3.00 persons per family.

| Family Type | # Families | Family Size |
| Married-Couple | 2,401 (76.7%) | 3.17 |
| Single Male/Father | 246 (7.9%) | 3.59 |
| Single Female/Mother | 485 (15.5%) | 3.00 |
| Total Families | 3,132 (100.0%) | 3.18 |
Median Household Size in Braxton County
The median household size in Braxton County is 2.64 persons per household, with single male/father households (246 | 5.4%) accounting for the largest median household size of 3.74 persons per household. non-family households (1,435 | 31.4%) represent the smallest median household size with 1.18 persons per household.

| Household Type | # Households | Household Size |
| Married-Couple | 2,401 (52.6%) | 3.34 |
| Single Male/Father | 246 (5.4%) | 3.74 |
| Single Female/Mother | 485 (10.6%) | 3.01 |
| Non-family | 1,435 (31.4%) | 1.18 |
| Total Households | 4,567 (100.0%) | 2.64 |
Household Size by Marriage Status in Braxton County
Out of a total of 4,567 households in Braxton County, 3,132 (68.6%) are family households, while 1,435 (31.4%) are nonfamily households. The most numerous type of family households are 2-person households, comprising 1,498, and the most common type of nonfamily households are 1-person households, comprising 1,244.

| Household Size | Family Households | Nonfamily Households |
| 1-Person Households | - | 1,244 (27.2%) |
| 2-Person Households | 1,498 (32.8%) | 190 (4.2%) |
| 3-Person Households | 943 (20.6%) | 1 (0.0%) |
| 4-Person Households | 536 (11.7%) | 0 (0.0%) |
| 5-Person Households | 81 (1.8%) | 0 (0.0%) |
| 6-Person Households | 58 (1.3%) | 0 (0.0%) |
| 7+ Person Households | 16 (0.4%) | 0 (0.0%) |
| Total | 3,132 (68.6%) | 1,435 (31.4%) |
Female Fertility in Braxton County
Fertility by Age in Braxton County
Average fertility rate in Braxton County is 28.0 births per 1,000 women. Women in the age bracket of 20 to 34 years have the highest fertility rate with 33.0 births per 1,000 women. Women in the age bracket of 35 to 50 years acount for 50.8% of all women with births.

| Age Bracket | Women with Births | Births / 1,000 Women |
| 15 to 19 years | 0 (0.0%) | 0.0 |
| 20 to 34 years | 32 (49.2%) | 33.0 |
| 35 to 50 years | 33 (50.8%) | 31.0 |
| Total | 65 (100.0%) | 28.0 |
Fertility by Age by Marriage Status in Braxton County
92.3% of women with births (65) in Braxton County are married. The highest percentage of unmarried women with births falls into 20 to 34 years age bracket with 15.6% of them unmarried at the time of birth, while the lowest percentage of unmarried women with births belong to 35 to 50 years age bracket with 0.0% of them unmarried.

| Age Bracket | Married | Unmarried |
| 15 to 19 years | 0 (0.0%) | 0 (0.0%) |
| 20 to 34 years | 27 (84.4%) | 5 (15.6%) |
| 35 to 50 years | 33 (100.0%) | 0 (0.0%) |
| Total | 60 (92.3%) | 5 (7.7%) |
Fertility by Education in Braxton County

| Educational Attainment | Women with Births | Births / 1,000 Women |
| Less than High School | 0 (0.0%) | 0.0 |
| High School Diploma | 32 (49.2%) | 29.0 |
| College or Associate's Degree | 0 (0.0%) | 0.0 |
| Bachelor's Degree | 33 (50.8%) | 122.0 |
| Graduate Degree | 0 (0.0%) | 0.0 |
| Total | 65 (100.0%) | 28.0 |
Fertility by Education by Marriage Status in Braxton County
7.7% of women with births in Braxton County are unmarried. Women with the educational attainment of bachelor's degree are most likely to be married with 100.0% of them married at childbirth, while women with the educational attainment of high school diploma are least likely to be married with 15.6% of them unmarried at childbirth.

| Educational Attainment | Married | Unmarried |
| Less than High School | 0 (0.0%) | 0 (0.0%) |
| High School Diploma | 27 (84.4%) | 5 (15.6%) |
| College or Associate's Degree | 0 (0.0%) | 0 (0.0%) |
| Bachelor's Degree | 33 (100.0%) | 0 (0.0%) |
| Graduate Degree | 0 (0.0%) | 0 (0.0%) |
| Total | 60 (92.3%) | 5 (7.7%) |
Income in Braxton County
Income Overview in Braxton County
Per Capita Income in Braxton County is $21,948, while median incomes of families and households are $46,045 and $42,245 respectively.
| Characteristic | Number | Measure |
| Per Capita Income | 12,505 | $21,948 |
| Median Family Income | 3,132 | $46,045 |
| Mean Family Income | 3,132 | $59,664 |
| Median Household Income | 4,567 | $42,245 |
| Mean Household Income | 4,567 | $53,962 |
| Income Deficit | 3,132 | $7,259 |
| Wage / Income Gap (%) | 12,505 | 16.75% |
| Wage / Income Gap ($) | 12,505 | 83.25¢ per $1 |
| Gini / Inequality Index | 12,505 | 0.41 |
Earnings by Sex in Braxton County
Average Earnings in Braxton County are $27,420, $30,966 for men and $25,778 for women, a difference of 16.8%.

| Sex | Number | Average Earnings |
| Male | 2,525 (55.7%) | $30,966 |
| Female | 2,009 (44.3%) | $25,778 |
| Total | 4,534 (100.0%) | $27,420 |
Earnings by Sex by Income Bracket in Braxton County
The most common earnings brackets in Braxton County are $30,000 to $34,999 for men (231 | 9.1%) and $25,000 to $29,999 for women (303 | 15.1%).

| Income | Male | Female |
| $2,499 or less | 131 (5.2%) | 81 (4.0%) |
| $2,500 to $4,999 | 53 (2.1%) | 85 (4.2%) |
| $5,000 to $7,499 | 200 (7.9%) | 119 (5.9%) |
| $7,500 to $9,999 | 20 (0.8%) | 85 (4.2%) |
| $10,000 to $12,499 | 92 (3.6%) | 189 (9.4%) |
| $12,500 to $14,999 | 35 (1.4%) | 130 (6.5%) |
| $15,000 to $17,499 | 185 (7.3%) | 21 (1.1%) |
| $17,500 to $19,999 | 71 (2.8%) | 73 (3.6%) |
| $20,000 to $22,499 | 79 (3.1%) | 111 (5.5%) |
| $22,500 to $24,999 | 214 (8.5%) | 52 (2.6%) |
| $25,000 to $29,999 | 128 (5.1%) | 303 (15.1%) |
| $30,000 to $34,999 | 231 (9.1%) | 126 (6.3%) |
| $35,000 to $39,999 | 94 (3.7%) | 89 (4.4%) |
| $40,000 to $44,999 | 152 (6.0%) | 62 (3.1%) |
| $45,000 to $49,999 | 68 (2.7%) | 132 (6.6%) |
| $50,000 to $54,999 | 166 (6.6%) | 37 (1.8%) |
| $55,000 to $64,999 | 197 (7.8%) | 170 (8.5%) |
| $65,000 to $74,999 | 55 (2.2%) | 47 (2.3%) |
| $75,000 to $99,999 | 222 (8.8%) | 78 (3.9%) |
| $100,000+ | 132 (5.2%) | 19 (0.9%) |
| Total | 2,525 (100.0%) | 2,009 (100.0%) |
Earnings by Sex by Educational Attainment in Braxton County
Average earnings in Braxton County are $33,006 for men and $27,281 for women, a difference of 17.3%. Men with an educational attainment of graduate degree enjoy the highest average annual earnings of $71,974, while those with less than high school education earn the least with $23,352. Women with an educational attainment of graduate degree earn the most with the average annual earnings of $60,111, while those with high school diploma education have the smallest earnings of $25,349.

| Educational Attainment | Male Income | Female Income |
| Less than High School | $23,352 | $25,527 |
| High School Diploma | $31,161 | $25,349 |
| College or Associate's Degree | $36,932 | $26,141 |
| Bachelor's Degree | $56,360 | $40,982 |
| Graduate Degree | $71,974 | $60,111 |
| Total | $33,006 | $27,281 |
Family Income in Braxton County
Family Income Brackets in Braxton County
According to the Braxton County family income data, there are 604 families falling into the $35,000 to $49,999 income range, which is the most common income bracket and makes up 19.3% of all families. Conversely, the $200,000+ income bracket is the least frequent group with only 25 families (0.8%) belonging to this category.

| Income Bracket | # Families | % Families |
| Less than $10,000 | 72 | 2.3% |
| $10,000 to $14,999 | 72 | 2.3% |
| $15,000 to $24,999 | 435 | 13.9% |
| $25,000 to $34,999 | 539 | 17.2% |
| $35,000 to $49,999 | 604 | 19.3% |
| $50,000 to $74,999 | 589 | 18.8% |
| $75,000 to $99,999 | 329 | 10.5% |
| $100,000 to $149,999 | 351 | 11.2% |
| $150,000 to $199,999 | 116 | 3.7% |
| $200,000+ | 25 | 0.8% |
Family Income by Famaliy Size in Braxton County
6-person families (44 | 1.4%) account for the highest median family income in Braxton County with $91,250 per family, while 2-person families (1,532 | 48.9%) have the highest median income of $20,328 per family member.

| Income Bracket | # Families | Median Income |
| 2-Person Families | 1,532 (48.9%) | $40,657 |
| 3-Person Families | 978 (31.2%) | $53,777 |
| 4-Person Families | 499 (15.9%) | $50,496 |
| 5-Person Families | 71 (2.3%) | $58,558 |
| 6-Person Families | 44 (1.4%) | $91,250 |
| 7+ Person Families | 8 (0.3%) | $0 |
| Total | 3,132 (100.0%) | $46,045 |
Family Income by Number of Earners in Braxton County
The median family income in Braxton County is $46,045, with families comprising 3+ earners (84) having the highest median family income of $143,750, while families with no earners (994) have the lowest median family income of $38,359, accounting for 2.7% and 31.7% of families, respectively.

| Number of Earners | # Families | Median Income |
| No Earners | 994 (31.7%) | $38,359 |
| 1 Earner | 1,201 (38.4%) | $47,288 |
| 2 Earners | 853 (27.2%) | $71,513 |
| 3+ Earners | 84 (2.7%) | $143,750 |
| Total | 3,132 (100.0%) | $46,045 |
Household Income in Braxton County
Household Income Brackets in Braxton County
With 913 households falling in the category, the $50,000 to $74,999 income range is the most frequent in Braxton County, accounting for 20.0% of all households. In contrast, only 50 households (1.1%) fall into the $200,000+ income bracket, making it the least populous group.

| Income Bracket | # Households | % Households |
| Less than $10,000 | 292 | 6.4% |
| $10,000 to $14,999 | 301 | 6.6% |
| $15,000 to $24,999 | 626 | 13.7% |
| $25,000 to $34,999 | 630 | 13.8% |
| $35,000 to $49,999 | 799 | 17.5% |
| $50,000 to $74,999 | 913 | 20.0% |
| $75,000 to $99,999 | 461 | 10.1% |
| $100,000 to $149,999 | 365 | 8.0% |
| $150,000 to $199,999 | 128 | 2.8% |
| $200,000+ | 50 | 1.1% |
Household Income by Householder Age in Braxton County
The median household income in Braxton County is $42,245, with the highest median household income of $55,357 found in the 15 to 24 years age bracket for the primary householder. A total of 14 households (0.3%) fall into this category. Meanwhile, the 65+ years age bracket for the primary householder has the lowest median household income of $37,917, with 1,718 households (37.6%) in this group.

| Income Bracket | # Households | Median Income |
| 15 to 24 Years | 14 (0.3%) | $55,357 |
| 25 to 44 Years | 924 (20.2%) | $52,336 |
| 45 to 64 Years | 1,911 (41.8%) | $42,339 |
| 65+ Years | 1,718 (37.6%) | $37,917 |
| Total | 4,567 (100.0%) | $42,245 |
Poverty in Braxton County
Income Below Poverty by Sex and Age in Braxton County
With 14.8% poverty level for males and 21.8% for females among the residents of Braxton County, 15 year old males and under 5 year old females are the most vulnerable to poverty, with 22 males (71.0%) and 131 females (48.7%) in their respective age groups living below the poverty level.

| Age Bracket | Male | Female |
| Under 5 Years | 40 (14.9%) | 131 (48.7%) |
| 5 Years | 0 (0.0%) | 23 (39.0%) |
| 6 to 11 Years | 107 (26.4%) | 129 (27.6%) |
| 12 to 14 Years | 25 (8.6%) | 26 (17.7%) |
| 15 Years | 22 (71.0%) | 10 (30.3%) |
| 16 and 17 Years | 12 (6.4%) | 0 (0.0%) |
| 18 to 24 Years | 83 (19.1%) | 31 (7.9%) |
| 25 to 34 Years | 45 (6.6%) | 198 (32.8%) |
| 35 to 44 Years | 154 (25.0%) | 209 (35.8%) |
| 45 to 54 Years | 131 (16.9%) | 112 (13.7%) |
| 55 to 64 Years | 114 (12.0%) | 221 (24.9%) |
| 65 to 74 Years | 93 (11.0%) | 109 (12.5%) |
| 75 Years and over | 84 (13.2%) | 87 (14.3%) |
| Total | 910 (14.8%) | 1,286 (21.8%) |
Income Above Poverty by Sex and Age in Braxton County
According to the poverty statistics in Braxton County, males aged 5 years and females aged 16 and 17 years are the age groups that are most secure financially, with 100.0% of males and 100.0% of females in these age groups living above the poverty line.

| Age Bracket | Male | Female |
| Under 5 Years | 228 (85.1%) | 138 (51.3%) |
| 5 Years | 36 (100.0%) | 36 (61.0%) |
| 6 to 11 Years | 298 (73.6%) | 338 (72.4%) |
| 12 to 14 Years | 265 (91.4%) | 121 (82.3%) |
| 15 Years | 9 (29.0%) | 23 (69.7%) |
| 16 and 17 Years | 176 (93.6%) | 167 (100.0%) |
| 18 to 24 Years | 352 (80.9%) | 364 (92.1%) |
| 25 to 34 Years | 636 (93.4%) | 405 (67.2%) |
| 35 to 44 Years | 463 (75.0%) | 375 (64.2%) |
| 45 to 54 Years | 646 (83.1%) | 706 (86.3%) |
| 55 to 64 Years | 837 (88.0%) | 666 (75.1%) |
| 65 to 74 Years | 755 (89.0%) | 763 (87.5%) |
| 75 Years and over | 553 (86.8%) | 520 (85.7%) |
| Total | 5,254 (85.2%) | 4,622 (78.2%) |
Income Below Poverty Among Married-Couple Families in Braxton County
The poverty statistics for married-couple families in Braxton County show that 9.2% or 220 of the total 2,401 families live below the poverty line. Families with 5 or more children have the highest poverty rate of 100.0%, comprising of 7 families. On the other hand, families with 3 or 4 children have the lowest poverty rate of 0.0%, which includes 0 families.

| Children | Above Poverty | Below Poverty |
| No Children | 1,396 (94.6%) | 79 (5.4%) |
| 1 or 2 Children | 721 (84.3%) | 134 (15.7%) |
| 3 or 4 Children | 64 (100.0%) | 0 (0.0%) |
| 5 or more Children | 0 (0.0%) | 7 (100.0%) |
| Total | 2,181 (90.8%) | 220 (9.2%) |
Income Below Poverty Among Single-Parent Households in Braxton County
According to the poverty data in Braxton County, 25.6% or 63 single-father households and 31.1% or 151 single-mother households are living below the poverty line. Among single-father households, those with 3 or 4 children have the highest poverty rate, with 26 households (89.7%) experiencing poverty. Likewise, among single-mother households, those with 5 or more children have the highest poverty rate, with 1 households (100.0%) falling below the poverty line.

| Children | Single Father | Single Mother |
| No Children | 0 (0.0%) | 66 (29.7%) |
| 1 or 2 Children | 37 (42.0%) | 84 (32.2%) |
| 3 or 4 Children | 26 (89.7%) | 0 (0.0%) |
| 5 or more Children | 0 (0.0%) | 1 (100.0%) |
| Total | 63 (25.6%) | 151 (31.1%) |
Income Below Poverty Among Married-Couple vs Single-Parent Households in Braxton County
The poverty data for Braxton County shows that 220 of the married-couple family households (9.2%) and 214 of the single-parent households (29.3%) are living below the poverty level. Within the married-couple family households, those with 5 or more children have the highest poverty rate, with 7 households (100.0%) falling below the poverty line. Among the single-parent households, those with 5 or more children have the highest poverty rate, with 1 household (100.0%) living below poverty.

| Children | Married-Couple Families | Single-Parent Households |
| No Children | 79 (5.4%) | 66 (18.8%) |
| 1 or 2 Children | 134 (15.7%) | 121 (34.7%) |
| 3 or 4 Children | 0 (0.0%) | 26 (86.7%) |
| 5 or more Children | 7 (100.0%) | 1 (100.0%) |
| Total | 220 (9.2%) | 214 (29.3%) |
Employment Characteristics in Braxton County
Employment by Class of Employer in Braxton County
Among the 3,730 employed individuals in Braxton County, private company employees (2,664 | 71.4%), state government employees (435 | 11.7%), and local government employees (281 | 7.5%) make up the most common classes of employment.

| Employer Class | # Employees | % Employees |
| Private Company Employees | 2,664 | 71.4% |
| Self-Employed (Incorporated) | 75 | 2.0% |
| Self-Employed (Not Incorporated) | 84 | 2.2% |
| Not-for-profit Organizations | 94 | 2.5% |
| Local Government Employees | 281 | 7.5% |
| State Government Employees | 435 | 11.7% |
| Federal Government Employees | 97 | 2.6% |
| Unpaid Family Workers | 0 | 0.0% |
| Total | 3,730 | 100.0% |
Employment Status by Age in Braxton County
According to the labor force statistics for Braxton County, out of the total population over 16 years of age (10,487), 42.6% or 4,467 individuals are in the labor force, with 14.4% or 643 of them unemployed. The age group with the highest labor force participation rate is 20 to 24 years, with 81.1% or 456 individuals in the labor force. Within the labor force, the 30 to 34 years age range has the highest percentage of unemployed individuals, with 31.0% or 139 of them being unemployed.

| Age Bracket | In Labor Force | Unemployed |
| 16 to 19 Years | 244 (38.5%) | 57 (23.4%) |
| 20 to 24 Years | 456 (81.1%) | 120 (26.3%) |
| 25 to 29 Years | 435 (60.1%) | 66 (15.2%) |
| 30 to 34 Years | 449 (62.4%) | 139 (31.0%) |
| 35 to 44 Years | 811 (61.1%) | 75 (9.3%) |
| 45 to 54 Years | 1,187 (71.7%) | 180 (15.2%) |
| 55 to 59 Years | 373 (45.6%) | 4 (1.1%) |
| 60 to 64 Years | 218 (21.1%) | 0 (0.0%) |
| 65 to 74 Years | 291 (16.8%) | 0 (0.0%) |
| 75 Years and over | 6 (0.5%) | 0 (0.0%) |
| Total | 4,467 (42.6%) | 643 (14.4%) |
Employment Status by Educational Attainment in Braxton County
According to labor force statistics for Braxton County, 55.3% of individuals (3,473) out of the total population between 25 and 64 years of age (6,280) are in the labor force, with 13.4% or 465 of them being unemployed. The group with the highest labor force participation rate are those with the educational attainment of bachelor's degree or higher, with 80.5% or 667 individuals in the labor force. Within the labor force, individuals with less than high school education have the highest percentage of unemployment, with 28.7% or 84 of them being unemployed.

| Educational Attainment | In Labor Force | Unemployed |
| Less than High School | 293 (35.2%) | 239 (28.7%) |
| High School Diploma | 1,659 (48.6%) | 328 (9.6%) |
| College / Associate Degree | 856 (71.0%) | 305 (25.3%) |
| Bachelor's Degree or higher | 667 (80.5%) | 7 (0.9%) |
| Total | 3,473 (55.3%) | 842 (13.4%) |
Employment Occupations by Sex in Braxton County
Management, Business, Science and Arts Occupations
The most common Management, Business, Science and Arts occupations in Braxton County are Management (268 | 7.0%), Community & Social Service (245 | 6.4%), Education Instruction & Library (147 | 3.9%), Computers, Engineering & Science (144 | 3.8%), and Architecture & Engineering (87 | 2.3%).

Management, Business, Science and Arts Occupations by Sex
Within the Management, Business, Science and Arts occupations in Braxton County, the most male-oriented occupations are Architecture & Engineering (100.0%), Computers, Engineering & Science (90.3%), and Arts, Media & Entertainment (85.7%), while the most female-oriented occupations are Education, Arts & Media (100.0%), Education Instruction & Library (97.3%), and Health Technologists (89.1%).

| Occupation | Male | Female |
| Management | 152 (56.7%) | 116 (43.3%) |
| Business & Financial | 17 (63.0%) | 10 (37.0%) |
| Computers, Engineering & Science | 130 (90.3%) | 14 (9.7%) |
| Computers & Mathematics | 43 (75.4%) | 14 (24.6%) |
| Architecture & Engineering | 87 (100.0%) | 0 (0.0%) |
| Life, Physical & Social Science | 0 (0.0%) | 0 (0.0%) |
| Community & Social Service | 45 (18.4%) | 200 (81.6%) |
| Education, Arts & Media | 0 (0.0%) | 40 (100.0%) |
| Legal Services & Support | 5 (31.2%) | 11 (68.8%) |
| Education Instruction & Library | 4 (2.7%) | 143 (97.3%) |
| Arts, Media & Entertainment | 36 (85.7%) | 6 (14.3%) |
| Health Diagnosing & Treating | 7 (13.7%) | 44 (86.3%) |
| Health Technologists | 5 (10.9%) | 41 (89.1%) |
| Total (Category) | 351 (47.8%) | 384 (52.2%) |
| Total (Overall) | 2,039 (53.5%) | 1,773 (46.5%) |
Services Occupations
The most common Services occupations in Braxton County are Food Preparation & Serving (272 | 7.1%), Healthcare Support (177 | 4.6%), Security & Protection (156 | 4.1%), Cleaning & Maintenance (148 | 3.9%), and Firefighting & Prevention (98 | 2.6%).

Services Occupations by Sex
Within the Services occupations in Braxton County, the most male-oriented occupations are Law Enforcement (100.0%), Security & Protection (97.4%), and Firefighting & Prevention (95.9%), while the most female-oriented occupations are Healthcare Support (100.0%), Personal Care & Service (98.9%), and Food Preparation & Serving (90.1%).

| Occupation | Male | Female |
| Healthcare Support | 0 (0.0%) | 177 (100.0%) |
| Security & Protection | 152 (97.4%) | 4 (2.6%) |
| Firefighting & Prevention | 94 (95.9%) | 4 (4.1%) |
| Law Enforcement | 58 (100.0%) | 0 (0.0%) |
| Food Preparation & Serving | 27 (9.9%) | 245 (90.1%) |
| Cleaning & Maintenance | 119 (80.4%) | 29 (19.6%) |
| Personal Care & Service | 1 (1.1%) | 92 (98.9%) |
| Total (Category) | 299 (35.3%) | 547 (64.7%) |
| Total (Overall) | 2,039 (53.5%) | 1,773 (46.5%) |
Sales and Office Occupations
The most common Sales and Office occupations in Braxton County are Sales & Related (550 | 14.4%), and Office & Administration (365 | 9.6%).

Sales and Office Occupations by Sex

| Occupation | Male | Female |
| Sales & Related | 129 (23.4%) | 421 (76.5%) |
| Office & Administration | 42 (11.5%) | 323 (88.5%) |
| Total (Category) | 171 (18.7%) | 744 (81.3%) |
| Total (Overall) | 2,039 (53.5%) | 1,773 (46.5%) |
Natural Resources, Construction and Maintenance Occupations
The most common Natural Resources, Construction and Maintenance occupations in Braxton County are Installation, Maintenance & Repair (319 | 8.4%), Construction & Extraction (202 | 5.3%), and Farming, Fishing & Forestry (4 | 0.1%).

Natural Resources, Construction and Maintenance Occupations by Sex

| Occupation | Male | Female |
| Farming, Fishing & Forestry | 4 (100.0%) | 0 (0.0%) |
| Construction & Extraction | 200 (99.0%) | 2 (1.0%) |
| Installation, Maintenance & Repair | 319 (100.0%) | 0 (0.0%) |
| Total (Category) | 523 (99.6%) | 2 (0.4%) |
| Total (Overall) | 2,039 (53.5%) | 1,773 (46.5%) |
Production, Transportation and Moving Occupations
The most common Production, Transportation and Moving occupations in Braxton County are Material Moving (367 | 9.6%), Production (240 | 6.3%), and Transportation (184 | 4.8%).

Production, Transportation and Moving Occupations by Sex

| Occupation | Male | Female |
| Production | 216 (90.0%) | 24 (10.0%) |
| Transportation | 149 (81.0%) | 35 (19.0%) |
| Material Moving | 330 (89.9%) | 37 (10.1%) |
| Total (Category) | 695 (87.9%) | 96 (12.1%) |
| Total (Overall) | 2,039 (53.5%) | 1,773 (46.5%) |
Employment Industries by Sex in Braxton County
Employment Industries in Braxton County
The major employment industries in Braxton County include Retail Trade (956 | 25.1%), Health Care & Social Assistance (425 | 11.2%), Educational Services (347 | 9.1%), Public Administration (339 | 8.9%), and Construction (289 | 7.6%).

Employment Industries by Sex in Braxton County
The Braxton County industries that see more men than women are Agriculture, Fishing & Hunting (100.0%), Mining, Quarrying, & Extraction (100.0%), and Utilities (100.0%), whereas the industries that tend to have a higher number of women are Real Estate, Rental & Leasing (100.0%), Finance & Insurance (93.9%), and Educational Services (91.1%).

| Industry | Male | Female |
| Agriculture, Fishing & Hunting | 49 (100.0%) | 0 (0.0%) |
| Mining, Quarrying, & Extraction | 84 (100.0%) | 0 (0.0%) |
| Construction | 277 (95.9%) | 12 (4.2%) |
| Manufacturing | 237 (90.8%) | 24 (9.2%) |
| Wholesale Trade | 81 (97.6%) | 2 (2.4%) |
| Retail Trade | 475 (49.7%) | 481 (50.3%) |
| Transportation & Warehousing | 115 (80.4%) | 28 (19.6%) |
| Utilities | 9 (100.0%) | 0 (0.0%) |
| Information | 32 (50.0%) | 32 (50.0%) |
| Finance & Insurance | 3 (6.1%) | 46 (93.9%) |
| Real Estate, Rental & Leasing | 0 (0.0%) | 2 (100.0%) |
| Professional & Scientific | 83 (59.7%) | 56 (40.3%) |
| Enterprise Management | 0 (0.0%) | 0 (0.0%) |
| Administrative & Support | 149 (92.5%) | 12 (7.4%) |
| Educational Services | 31 (8.9%) | 316 (91.1%) |
| Health Care & Social Assistance | 45 (10.6%) | 380 (89.4%) |
| Arts, Entertainment & Recreation | 18 (75.0%) | 6 (25.0%) |
| Accommodation & Food Services | 23 (9.7%) | 214 (90.3%) |
| Public Administration | 239 (70.5%) | 100 (29.5%) |
| Total | 2,039 (53.5%) | 1,773 (46.5%) |
Education in Braxton County
School Enrollment in Braxton County
The most common levels of schooling among the 2,085 students in Braxton County are high school (734 | 35.2%), elementary school (588 | 28.2%), and middle school (499 | 23.9%).

| School Level | # Students | % Students |
| Nursery / Preschool | 71 | 3.4% |
| Kindergarten | 77 | 3.7% |
| Elementary School | 588 | 28.2% |
| Middle School | 499 | 23.9% |
| High School | 734 | 35.2% |
| College / Undergraduate | 110 | 5.3% |
| Graduate / Professional | 6 | 0.3% |
| Total | 2,085 | 100.0% |
School Enrollment by Age by Funding Source in Braxton County
Out of a total of 2,085 students who are enrolled in schools in Braxton County, 123 (5.9%) attend a private institution, while the remaining 1,962 (94.1%) are enrolled in public schools. The age group of 3 to 4 year olds has the highest likelihood of being enrolled in private schools, with 3 (15.0% in the age bracket) enrolled. Conversely, the age group of 20 to 24 year olds has the lowest likelihood of being enrolled in a private school, with 83 (100.0% in the age bracket) attending a public institution.

| Age Bracket | Public School | Private School |
| 3 to 4 Year Olds | 17 (85.0%) | 3 (15.0%) |
| 5 to 9 Year Old | 538 (94.1%) | 34 (5.9%) |
| 10 to 14 Year Olds | 726 (92.1%) | 62 (7.9%) |
| 15 to 17 Year Olds | 408 (97.4%) | 11 (2.6%) |
| 18 to 19 Year Olds | 156 (93.4%) | 11 (6.6%) |
| 20 to 24 Year Olds | 83 (100.0%) | 0 (0.0%) |
| 25 to 34 Year Olds | 18 (100.0%) | 0 (0.0%) |
| 35 Years and over | 17 (94.4%) | 1 (5.6%) |
| Total | 1,962 (94.1%) | 123 (5.9%) |
Educational Attainment by Field of Study in Braxton County
Education (313 | 25.3%), business (234 | 18.9%), arts & humanities (152 | 12.3%), science & technology (133 | 10.7%), and social sciences (105 | 8.5%) are the most common fields of study among 1,239 individuals in Braxton County who have obtained a bachelor's degree or higher.

| Field of Study | # Graduates | % Graduates |
| Computers & Mathematics | 12 | 1.0% |
| Bio, Nature & Agricultural | 65 | 5.2% |
| Physical & Health Sciences | 34 | 2.7% |
| Psychology | 39 | 3.2% |
| Social Sciences | 105 | 8.5% |
| Engineering | 28 | 2.3% |
| Multidisciplinary Studies | 45 | 3.6% |
| Science & Technology | 133 | 10.7% |
| Business | 234 | 18.9% |
| Education | 313 | 25.3% |
| Literature & Languages | 1 | 0.1% |
| Liberal Arts & History | 38 | 3.1% |
| Visual & Performing Arts | 36 | 2.9% |
| Communications | 4 | 0.3% |
| Arts & Humanities | 152 | 12.3% |
| Total | 1,239 | 100.0% |
Transportation & Commute in Braxton County
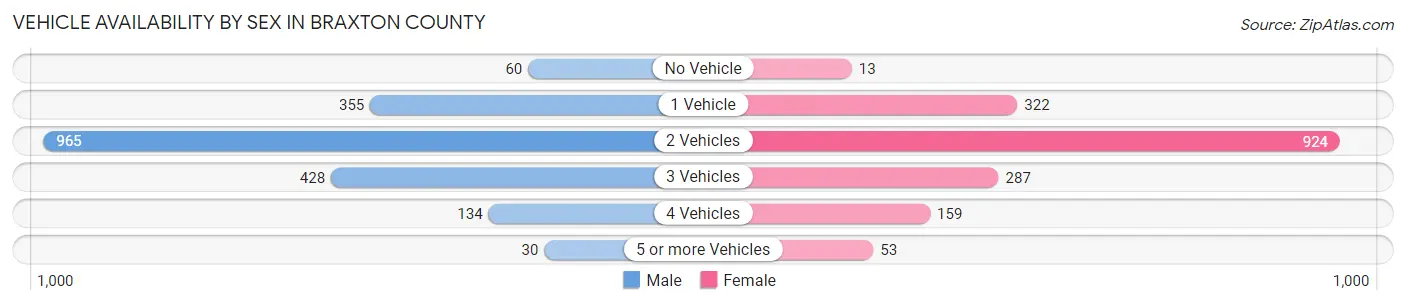
Vehicle Availability by Sex in Braxton County
The most prevalent vehicle ownership categories in Braxton County are males with 2 vehicles (965, accounting for 48.9%) and females with 2 vehicles (924, making up 54.9%).
| Vehicles Available | Male | Female |
| No Vehicle | 60 (3.0%) | 13 (0.7%) |
| 1 Vehicle | 355 (18.0%) | 322 (18.3%) |
| 2 Vehicles | 965 (48.9%) | 924 (52.6%) |
| 3 Vehicles | 428 (21.7%) | 287 (16.3%) |
| 4 Vehicles | 134 (6.8%) | 159 (9.0%) |
| 5 or more Vehicles | 30 (1.5%) | 53 (3.0%) |
| Total | 1,972 (100.0%) | 1,758 (100.0%) |
Commute Time in Braxton County
The most frequently occuring commute durations in Braxton County are 30 to 34 minutes (633 commuters, 17.6%), 15 to 19 minutes (440 commuters, 12.3%), and 20 to 24 minutes (386 commuters, 10.7%).

| Commute Time | # Commuters | % Commuters |
| Less than 5 Minutes | 71 | 2.0% |
| 5 to 9 Minutes | 298 | 8.3% |
| 10 to 14 Minutes | 382 | 10.6% |
| 15 to 19 Minutes | 440 | 12.3% |
| 20 to 24 Minutes | 386 | 10.7% |
| 25 to 29 Minutes | 376 | 10.5% |
| 30 to 34 Minutes | 633 | 17.6% |
| 35 to 39 Minutes | 76 | 2.1% |
| 40 to 44 Minutes | 175 | 4.9% |
| 45 to 59 Minutes | 368 | 10.2% |
| 60 to 89 Minutes | 181 | 5.0% |
| 90 or more Minutes | 204 | 5.7% |
Commute Time by Sex in Braxton County
The most common commute times in Braxton County are 30 to 34 minutes (309 commuters, 16.6%) for males and 30 to 34 minutes (324 commuters, 18.8%) for females.

| Commute Time | Male | Female |
| Less than 5 Minutes | 42 (2.2%) | 29 (1.7%) |
| 5 to 9 Minutes | 151 (8.1%) | 147 (8.5%) |
| 10 to 14 Minutes | 129 (6.9%) | 253 (14.7%) |
| 15 to 19 Minutes | 140 (7.5%) | 300 (17.4%) |
| 20 to 24 Minutes | 185 (9.9%) | 201 (11.7%) |
| 25 to 29 Minutes | 145 (7.8%) | 231 (13.4%) |
| 30 to 34 Minutes | 309 (16.6%) | 324 (18.8%) |
| 35 to 39 Minutes | 36 (1.9%) | 40 (2.3%) |
| 40 to 44 Minutes | 102 (5.5%) | 73 (4.2%) |
| 45 to 59 Minutes | 308 (16.5%) | 60 (3.5%) |
| 60 to 89 Minutes | 123 (6.6%) | 58 (3.4%) |
| 90 or more Minutes | 196 (10.5%) | 8 (0.5%) |
Time of Departure to Work by Sex in Braxton County
The most frequent times of departure to work in Braxton County are 6:00 AM to 6:29 AM (254, 13.6%) for males and 7:00 AM to 7:29 AM (333, 19.3%) for females.

| Time of Departure | Male | Female |
| 12:00 AM to 4:59 AM | 179 (9.6%) | 128 (7.4%) |
| 5:00 AM to 5:29 AM | 214 (11.5%) | 52 (3.0%) |
| 5:30 AM to 5:59 AM | 189 (10.1%) | 113 (6.6%) |
| 6:00 AM to 6:29 AM | 254 (13.6%) | 141 (8.2%) |
| 6:30 AM to 6:59 AM | 213 (11.4%) | 122 (7.1%) |
| 7:00 AM to 7:29 AM | 79 (4.2%) | 333 (19.3%) |
| 7:30 AM to 7:59 AM | 116 (6.2%) | 305 (17.7%) |
| 8:00 AM to 8:29 AM | 58 (3.1%) | 44 (2.5%) |
| 8:30 AM to 8:59 AM | 124 (6.7%) | 28 (1.6%) |
| 9:00 AM to 9:59 AM | 79 (4.2%) | 144 (8.4%) |
| 10:00 AM to 10:59 AM | 64 (3.4%) | 30 (1.7%) |
| 11:00 AM to 11:59 AM | 43 (2.3%) | 18 (1.0%) |
| 12:00 PM to 3:59 PM | 159 (8.5%) | 169 (9.8%) |
| 4:00 PM to 11:59 PM | 95 (5.1%) | 97 (5.6%) |
| Total | 1,866 (100.0%) | 1,724 (100.0%) |
Housing Occupancy in Braxton County
Occupancy by Ownership in Braxton County
Of the total 4,567 dwellings in Braxton County, owner-occupied units account for 3,722 (81.5%), while renter-occupied units make up 845 (18.5%).

| Occupancy | # Housing Units | % Housing Units |
| Owner Occupied Housing Units | 3,722 | 81.5% |
| Renter-Occupied Housing Units | 845 | 18.5% |
| Total Occupied Housing Units | 4,567 | 100.0% |
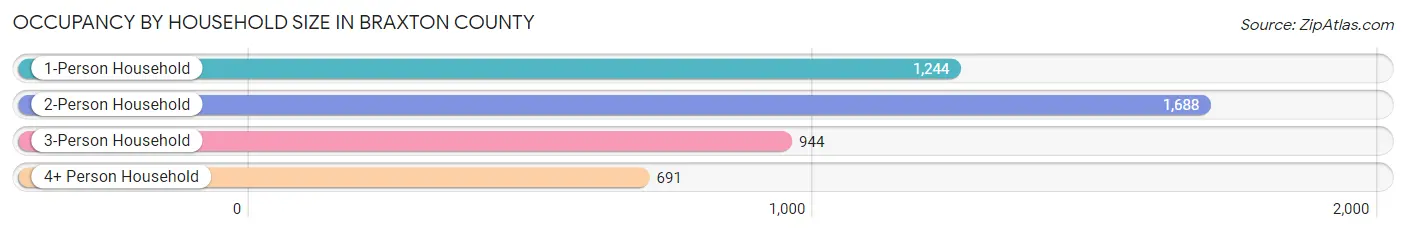
Occupancy by Household Size in Braxton County
| Household Size | # Housing Units | % Housing Units |
| 1-Person Household | 1,244 | 27.2% |
| 2-Person Household | 1,688 | 37.0% |
| 3-Person Household | 944 | 20.7% |
| 4+ Person Household | 691 | 15.1% |
| Total Housing Units | 4,567 | 100.0% |
Occupancy by Ownership by Household Size in Braxton County

| Household Size | Owner-occupied | Renter-occupied |
| 1-Person Household | 952 (76.5%) | 292 (23.5%) |
| 2-Person Household | 1,403 (83.1%) | 285 (16.9%) |
| 3-Person Household | 850 (90.0%) | 94 (10.0%) |
| 4+ Person Household | 517 (74.8%) | 174 (25.2%) |
| Total Housing Units | 3,722 (81.5%) | 845 (18.5%) |
Occupancy by Educational Attainment in Braxton County

| Household Size | Owner-occupied | Renter-occupied |
| Less than High School | 570 (74.7%) | 193 (25.3%) |
| High School Diploma | 1,836 (87.4%) | 266 (12.7%) |
| College/Associate Degree | 736 (78.7%) | 199 (21.3%) |
| Bachelor's Degree or higher | 580 (75.6%) | 187 (24.4%) |
Occupancy by Age of Householder in Braxton County

| Age Bracket | # Households | % Households |
| Under 35 Years | 328 | 7.2% |
| 35 to 44 Years | 610 | 13.4% |
| 45 to 54 Years | 985 | 21.6% |
| 55 to 64 Years | 926 | 20.3% |
| 65 to 74 Years | 1,000 | 21.9% |
| 75 to 84 Years | 496 | 10.9% |
| 85 Years and Over | 222 | 4.9% |
| Total | 4,567 | 100.0% |
Housing Finances in Braxton County
Median Income by Occupancy in Braxton County

| Occupancy Type | # Households | Median Income |
| Owner-Occupied | 3,722 (81.5%) | $43,409 |
| Renter-Occupied | 845 (18.5%) | $32,394 |
| Average | 4,567 (100.0%) | $42,245 |
Occupancy by Householder Income Bracket in Braxton County

| Income Bracket | Owner-occupied | Renter-occupied |
| Less than $5,000 | 130 (3.5%) | 26 (3.1%) |
| $5,000 to $9,999 | 51 (1.4%) | 87 (10.3%) |
| $10,000 to $14,999 | 204 (5.5%) | 97 (11.5%) |
| $15,000 to $19,999 | 166 (4.5%) | 44 (5.2%) |
| $20,000 to $24,999 | 337 (9.0%) | 80 (9.5%) |
| $25,000 to $34,999 | 532 (14.3%) | 100 (11.8%) |
| $35,000 to $49,999 | 713 (19.2%) | 85 (10.1%) |
| $50,000 to $74,999 | 695 (18.7%) | 220 (26.0%) |
| $75,000 to $99,999 | 425 (11.4%) | 34 (4.0%) |
| $100,000 to $149,999 | 302 (8.1%) | 65 (7.7%) |
| $150,000 or more | 167 (4.5%) | 7 (0.8%) |
| Total | 3,722 (100.0%) | 845 (100.0%) |
Monthly Housing Cost Tiers in Braxton County

| Monthly Cost | Owner-occupied | Renter-occupied |
| Less than $300 | 1,275 (34.3%) | 32 (3.8%) |
| $300 to $499 | 942 (25.3%) | 180 (21.3%) |
| $500 to $799 | 541 (14.5%) | 252 (29.8%) |
| $800 to $999 | 245 (6.6%) | 87 (10.3%) |
| $1,000 to $1,499 | 474 (12.7%) | 30 (3.5%) |
| $1,500 to $1,999 | 64 (1.7%) | 4 (0.5%) |
| $2,000 to $2,499 | 160 (4.3%) | 0 (0.0%) |
| $2,500 to $2,999 | 15 (0.4%) | 0 (0.0%) |
| $3,000 or more | 6 (0.2%) | 0 (0.0%) |
| Total | 3,722 (100.0%) | 845 (100.0%) |
Physical Housing Characteristics in Braxton County
Housing Structures in Braxton County

| Structure Type | # Housing Units | % Housing Units |
| Single Unit, Detached | 3,131 | 68.6% |
| Single Unit, Attached | 14 | 0.3% |
| 2 Unit Apartments | 58 | 1.3% |
| 3 or 4 Unit Apartments | 53 | 1.2% |
| 5 to 9 Unit Apartments | 37 | 0.8% |
| 10 or more Apartments | 30 | 0.7% |
| Mobile Home / Other | 1,244 | 27.2% |
| Total | 4,567 | 100.0% |
Housing Structures by Occupancy in Braxton County

| Structure Type | Owner-occupied | Renter-occupied |
| Single Unit, Detached | 2,534 (80.9%) | 597 (19.1%) |
| Single Unit, Attached | 14 (100.0%) | 0 (0.0%) |
| 2 Unit Apartments | 5 (8.6%) | 53 (91.4%) |
| 3 or 4 Unit Apartments | 24 (45.3%) | 29 (54.7%) |
| 5 to 9 Unit Apartments | 0 (0.0%) | 37 (100.0%) |
| 10 or more Apartments | 0 (0.0%) | 30 (100.0%) |
| Mobile Home / Other | 1,145 (92.0%) | 99 (8.0%) |
| Total | 3,722 (81.5%) | 845 (18.5%) |
Housing Structures by Number of Rooms in Braxton County

| Number of Rooms | Owner-occupied | Renter-occupied |
| 1 Room | 5 (0.1%) | 0 (0.0%) |
| 2 or 3 Rooms | 49 (1.3%) | 61 (7.2%) |
| 4 or 5 Rooms | 1,284 (34.5%) | 363 (43.0%) |
| 6 or 7 Rooms | 1,355 (36.4%) | 352 (41.7%) |
| 8 or more Rooms | 1,029 (27.7%) | 69 (8.2%) |
| Total | 3,722 (100.0%) | 845 (100.0%) |
Housing Structure by Heating Type in Braxton County

| Heating Type | Owner-occupied | Renter-occupied |
| Utility Gas | 1,404 (37.7%) | 378 (44.7%) |
| Bottled, Tank, or LP Gas | 417 (11.2%) | 62 (7.3%) |
| Electricity | 1,341 (36.0%) | 184 (21.8%) |
| Fuel Oil or Kerosene | 0 (0.0%) | 0 (0.0%) |
| Coal or Coke | 64 (1.7%) | 0 (0.0%) |
| All other Fuels | 496 (13.3%) | 221 (26.2%) |
| No Fuel Used | 0 (0.0%) | 0 (0.0%) |
| Total | 3,722 (100.0%) | 845 (100.0%) |
Household Vehicle Usage in Braxton County

| Vehicles per Household | Owner-occupied | Renter-occupied |
| No Vehicle | 207 (5.6%) | 167 (19.8%) |
| 1 Vehicle | 1,000 (26.9%) | 349 (41.3%) |
| 2 Vehicles | 1,601 (43.0%) | 277 (32.8%) |
| 3 or more Vehicles | 914 (24.6%) | 52 (6.1%) |
| Total | 3,722 (100.0%) | 845 (100.0%) |
Real Estate & Mortgages in Braxton County
Real Estate and Mortgage Overview in Braxton County
| Characteristic | Without Mortgage | With Mortgage |
| Housing Units | 2,364 | 1,358 |
| Median Property Value | $91,200 | $102,600 |
| Median Household Income | $40,218 | $67 |
| Monthly Housing Costs | $286 | $0 |
| Real Estate Taxes | $456 | $95 |
Property Value by Mortgage Status in Braxton County

| Property Value | Without Mortgage | With Mortgage |
| Less than $50,000 | 530 (22.4%) | 250 (18.4%) |
| $50,000 to $99,999 | 871 (36.8%) | 400 (29.5%) |
| $100,000 to $299,999 | 776 (32.8%) | 566 (41.7%) |
| $300,000 to $499,999 | 171 (7.2%) | 131 (9.7%) |
| $500,000 to $749,999 | 0 (0.0%) | 10 (0.7%) |
| $750,000 to $999,999 | 4 (0.2%) | 0 (0.0%) |
| $1,000,000 or more | 12 (0.5%) | 1 (0.1%) |
| Total | 2,364 (100.0%) | 1,358 (100.0%) |
Household Income by Mortgage Status in Braxton County

| Household Income | Without Mortgage | With Mortgage |
| Less than $10,000 | 148 (6.3%) | 32 (2.4%) |
| $10,000 to $24,999 | 560 (23.7%) | 33 (2.4%) |
| $25,000 to $34,999 | 321 (13.6%) | 147 (10.8%) |
| $35,000 to $49,999 | 603 (25.5%) | 211 (15.5%) |
| $50,000 to $74,999 | 287 (12.1%) | 110 (8.1%) |
| $75,000 to $99,999 | 183 (7.7%) | 408 (30.0%) |
| $100,000 to $149,999 | 162 (6.9%) | 242 (17.8%) |
| $150,000 or more | 100 (4.2%) | 140 (10.3%) |
| Total | 2,364 (100.0%) | 1,358 (100.0%) |
Property Value to Household Income Ratio in Braxton County

| Value-to-Income Ratio | Without Mortgage | With Mortgage |
| Less than 2.0x | 1,018 (43.1%) | 56,270 (4,143.6%) |
| 2.0x to 2.9x | 426 (18.0%) | 786 (57.9%) |
| 3.0x to 3.9x | 371 (15.7%) | 115 (8.5%) |
| 4.0x or more | 529 (22.4%) | 277 (20.4%) |
| Total | 2,364 (100.0%) | 1,358 (100.0%) |
Real Estate Taxes by Mortgage Status in Braxton County

| Property Taxes | Without Mortgage | With Mortgage |
| Less than $800 | 1,564 (66.2%) | 33 (2.4%) |
| $800 to $1,499 | 344 (14.5%) | 894 (65.8%) |
| $800 to $1,499 | 55 (2.3%) | 294 (21.6%) |
| Total | 2,364 (100.0%) | 1,358 (100.0%) |
Health & Disability in Braxton County
Health Insurance Coverage by Age in Braxton County

| Age Bracket | With Coverage | Without Coverage |
| Under 6 Years | 619 (97.9%) | 13 (2.1%) |
| 6 to 18 Years | 1,867 (98.2%) | 34 (1.8%) |
| 19 to 25 Years | 403 (56.3%) | 313 (43.7%) |
| 26 to 34 Years | 841 (67.9%) | 397 (32.1%) |
| 35 to 44 Years | 1,105 (93.5%) | 77 (6.5%) |
| 45 to 54 Years | 1,365 (85.6%) | 230 (14.4%) |
| 55 to 64 Years | 1,737 (94.5%) | 101 (5.5%) |
| 65 to 74 Years | 1,717 (99.8%) | 3 (0.2%) |
| 75 Years and older | 1,244 (100.0%) | 0 (0.0%) |
| Total | 10,898 (90.3%) | 1,168 (9.7%) |
Health Insurance Coverage by Citizenship Status in Braxton County

| Citizenship Status | With Coverage | Without Coverage |
| Native Born | 619 (97.9%) | 13 (2.1%) |
| Foreign Born, Citizen | 1,867 (98.2%) | 34 (1.8%) |
| Foreign Born, not a Citizen | 403 (56.3%) | 313 (43.7%) |
Health Insurance Coverage by Household Income in Braxton County

| Household Income | With Coverage | Without Coverage |
| Under $25,000 | 2,188 (96.5%) | 79 (3.5%) |
| $25,000 to $49,999 | 2,960 (82.8%) | 614 (17.2%) |
| $50,000 to $74,999 | 2,818 (89.0%) | 347 (11.0%) |
| $75,000 to $99,999 | 1,336 (96.7%) | 45 (3.3%) |
| $100,000 and over | 1,588 (95.0%) | 83 (5.0%) |
Public vs Private Health Insurance Coverage by Age in Braxton County

| Age Bracket | Public Insurance | Private Insurance |
| Under 6 | 400 (63.3%) | 230 (36.4%) |
| 6 to 18 Years | 969 (51.0%) | 980 (51.5%) |
| 19 to 25 Years | 141 (19.7%) | 273 (38.1%) |
| 25 to 34 Years | 257 (20.8%) | 618 (49.9%) |
| 35 to 44 Years | 438 (37.1%) | 680 (57.5%) |
| 45 to 54 Years | 534 (33.5%) | 943 (59.1%) |
| 55 to 64 Years | 1,002 (54.5%) | 863 (46.9%) |
| 65 to 74 Years | 1,698 (98.7%) | 927 (53.9%) |
| 75 Years and over | 1,242 (99.8%) | 689 (55.4%) |
| Total | 6,681 (55.4%) | 6,203 (51.4%) |
Disability Status by Sex by Age in Braxton County

| Age Bracket | Male | Female |
| Under 5 Years | 0 (0.0%) | 0 (0.0%) |
| 5 to 17 Years | 22 (2.3%) | 78 (8.8%) |
| 18 to 34 Years | 49 (4.4%) | 57 (5.7%) |
| 35 to 64 Years | 718 (30.7%) | 240 (10.5%) |
| 65 to 74 Years | 218 (25.7%) | 161 (18.5%) |
| 75 Years and over | 322 (50.5%) | 372 (61.3%) |
Disability Class by Sex by Age in Braxton County
Disability Class: Hearing Difficulty

| Age Bracket | Male | Female |
| Under 5 Years | 0 (0.0%) | 0 (0.0%) |
| 5 to 17 Years | 0 (0.0%) | 1 (0.1%) |
| 18 to 34 Years | 5 (0.4%) | 9 (0.9%) |
| 35 to 64 Years | 381 (16.3%) | 3 (0.1%) |
| 65 to 74 Years | 73 (8.6%) | 59 (6.8%) |
| 75 Years and over | 110 (17.3%) | 177 (29.2%) |
Disability Class: Vision Difficulty

| Age Bracket | Male | Female |
| Under 5 Years | 0 (0.0%) | 0 (0.0%) |
| 5 to 17 Years | 0 (0.0%) | 58 (6.6%) |
| 18 to 34 Years | 13 (1.2%) | 30 (3.0%) |
| 35 to 64 Years | 110 (4.7%) | 37 (1.6%) |
| 65 to 74 Years | 27 (3.2%) | 36 (4.1%) |
| 75 Years and over | 58 (9.1%) | 43 (7.1%) |
Disability Class: Cognitive Difficulty

| Age Bracket | Male | Female |
| 5 to 17 Years | 8 (0.8%) | 28 (3.2%) |
| 18 to 34 Years | 36 (3.2%) | 45 (4.5%) |
| 35 to 64 Years | 410 (17.6%) | 94 (4.1%) |
| 65 to 74 Years | 21 (2.5%) | 38 (4.4%) |
| 75 Years and over | 41 (6.4%) | 253 (41.7%) |
Disability Class: Ambulatory Difficulty

| Age Bracket | Male | Female |
| 5 to 17 Years | 14 (1.5%) | 14 (1.6%) |
| 18 to 34 Years | 0 (0.0%) | 30 (3.0%) |
| 35 to 64 Years | 488 (20.9%) | 172 (7.5%) |
| 65 to 74 Years | 154 (18.2%) | 117 (13.4%) |
| 75 Years and over | 135 (21.2%) | 305 (50.2%) |
Disability Class: Self-Care Difficulty

| Age Bracket | Male | Female |
| 5 to 17 Years | 14 (1.5%) | 14 (1.6%) |
| 18 to 34 Years | 5 (0.4%) | 30 (3.0%) |
| 35 to 64 Years | 73 (3.1%) | 112 (4.9%) |
| 65 to 74 Years | 15 (1.8%) | 59 (6.8%) |
| 75 Years and over | 28 (4.4%) | 204 (33.6%) |
Technology Access in Braxton County
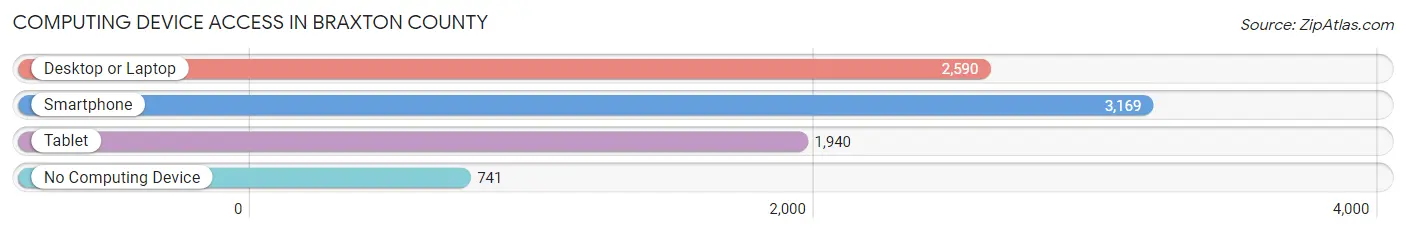
Computing Device Access in Braxton County
| Device Type | # Households | % Households |
| Desktop or Laptop | 2,590 | 56.7% |
| Smartphone | 3,169 | 69.4% |
| Tablet | 1,940 | 42.5% |
| No Computing Device | 741 | 16.2% |
| Total | 4,567 | 100.0% |
Internet Access in Braxton County

| Internet Type | # Households | % Households |
| Dial-Up Internet | 36 | 0.8% |
| Broadband Home | 2,398 | 52.5% |
| Cellular Data Only | 430 | 9.4% |
| Satellite Internet | 646 | 14.1% |
| No Internet | 1,042 | 22.8% |
| Total | 4,567 | 100.0% |
Braxton County Summary
Braxton County is located in the central part of West Virginia, and is part of the state’s Appalachian region. It is bordered by Lewis, Webster, Nicholas, Clay, and Gilmer counties. The county seat is Sutton, and the county was created in 1836 from parts of Lewis, Kanawha, and Nicholas counties. The county has a total area of 441 square miles, and a population of 14,523 as of the 2010 census.
History
The area that is now Braxton County was originally inhabited by the Monongahela and Adena Native American tribes. The first European settlers arrived in the area in the late 1700s, and the county was officially established in 1836. The county was named after Carter Braxton, a signer of the Declaration of Independence.
During the Civil War, Braxton County was a major site of the Battle of Bulltown, which took place in 1863. The battle was a Confederate victory, and resulted in the death of several Union soldiers.
In the late 1800s, the county experienced a period of economic growth, as the timber and coal industries began to expand. The county also became a popular tourist destination, as the area was known for its scenic beauty.
Geography
Braxton County is located in the central part of West Virginia, and is part of the state’s Appalachian region. It is bordered by Lewis, Webster, Nicholas, Clay, and Gilmer counties. The county has a total area of 441 square miles, and is mostly mountainous, with elevations ranging from 1,000 to 3,000 feet.
The county is home to several rivers, including the Elk, Little Kanawha, and Gauley. The Elk River is the largest river in the county, and is a popular destination for fishing and boating.
Economy
The economy of Braxton County is largely based on agriculture and natural resources. The county is home to several large farms, and the main crops grown in the area are corn, soybeans, hay, and wheat. The county is also home to several coal mines, and the coal industry is a major source of employment in the area.
In addition to agriculture and natural resources, the county is also home to several manufacturing companies, including a furniture factory and a paper mill. Tourism is also an important part of the economy, as the county is home to several state parks and recreational areas.
Demographics
As of the 2010 census, the population of Braxton County was 14,523. The population is mostly white (96.3%), with small percentages of African Americans (1.7%), Native Americans (0.3%), and Asians (0.2%). The median household income in the county is $35,945, and the median age is 43.
The county is home to several small towns, including Sutton, the county seat, and Gassaway, the largest town in the county. The county is also home to several unincorporated communities, including Burnsville, Frametown, and Flatwoods.
Conclusion
Braxton County is located in the central part of West Virginia, and is part of the state’s Appalachian region. The county has a total area of 441 square miles, and a population of 14,523 as of the 2010 census. The economy of the county is largely based on agriculture and natural resources, and the county is also home to several manufacturing companies and tourist attractions. The population of the county is mostly white, with small percentages of African Americans, Native Americans, and Asians.
Common Questions
What is the Total Population of Braxton County?
Total Population of Braxton County is 12,505.
What is the Total Male Population of Braxton County?
Total Male Population of Braxton County is 6,406.
What is the Total Female Population of Braxton County?
Total Female Population of Braxton County is 6,099.
What is the Ratio of Males per 100 Females in Braxton County?
There are 105.03 Males per 100 Females in Braxton County.
What is the Ratio of Females per 100 Males in Braxton County?
There are 95.21 Females per 100 Males in Braxton County.
What is the Median Population Age in Braxton County?
Median Population Age in Braxton County is 46.8 Years.
What is the Average Family Size in Braxton County
Average Family Size in Braxton County is 3.2 People.
What is the Average Household Size in Braxton County
Average Household Size in Braxton County is 2.6 People.
What is Per Capita Income in Braxton County?
Per Capita income in Braxton County is $21,948.
What is the Median Family Income in Braxton County?
Median Family Income in Braxton County is $46,045.
What is the Median Household income in Braxton County?
Median Household Income in Braxton County is $42,245.
What is Income or Wage Gap in Braxton County?
Income or Wage Gap in Braxton County is 16.8%.
Women in Braxton County earn 83.2 cents for every dollar earned by a man.
What is Family Income Deficit in Braxton County?
Family Income Deficit in Braxton County is $7,259.
Families that are below poverty line in Braxton County earn $7,259 less on average than the poverty threshold level.
What is Inequality or Gini Index in Braxton County?
Inequality or Gini Index in Braxton County is 0.41.
How Large is the Labor Force in Braxton County?
There are 4,467 People in the Labor Forcein in Braxton County.
What is the Percentage of People in the Labor Force in Braxton County?
42.6% of People are in the Labor Force in Braxton County.
What is the Unemployment Rate in Braxton County?
Unemployment Rate in Braxton County is 14.4%.