Berkeley County, WV
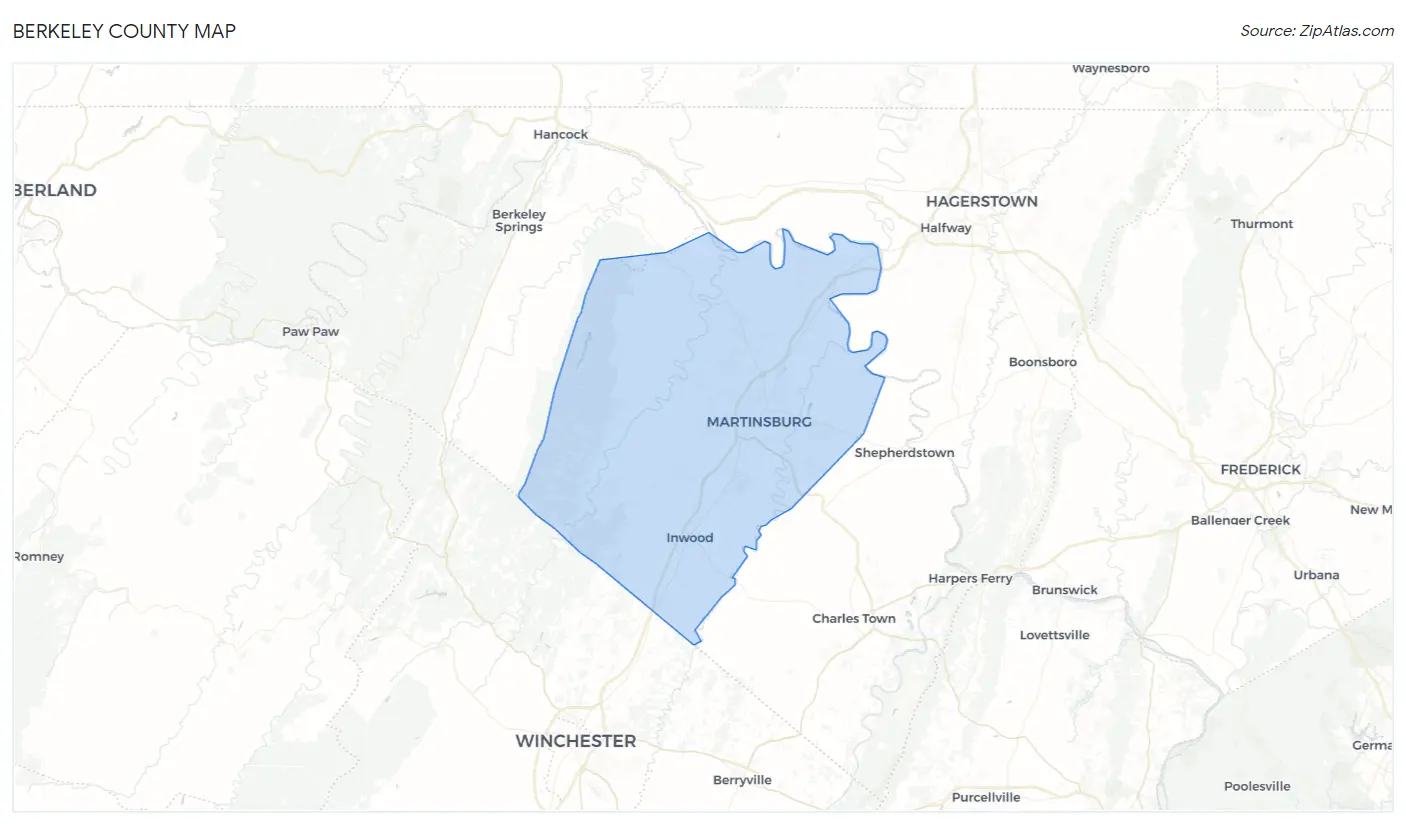
Berkeley County Map
Berkeley County Overview
123,283
TOTAL POPULATION
61,697
MALE POPULATION
61,586
FEMALE POPULATION
100.18
MALES / 100 FEMALES
99.82
FEMALES / 100 MALES
38.8
MEDIAN AGE
3.1
AVG FAMILY SIZE
2.5
AVG HOUSEHOLD SIZE
$35,909
PER CAPITA INCOME
$85,110
AVG FAMILY INCOME
$73,619
AVG HOUSEHOLD INCOME
30.1%
WAGE / INCOME GAP [ % ]
69.9¢/ $1
WAGE / INCOME GAP [ $ ]
$10,882
FAMILY INCOME DEFICIT
0.40
INEQUALITY / GINI INDEX
65,244
LABOR FORCE [ PEOPLE ]
66.4%
PERCENT IN LABOR FORCE
4.6%
UNEMPLOYMENT RATE
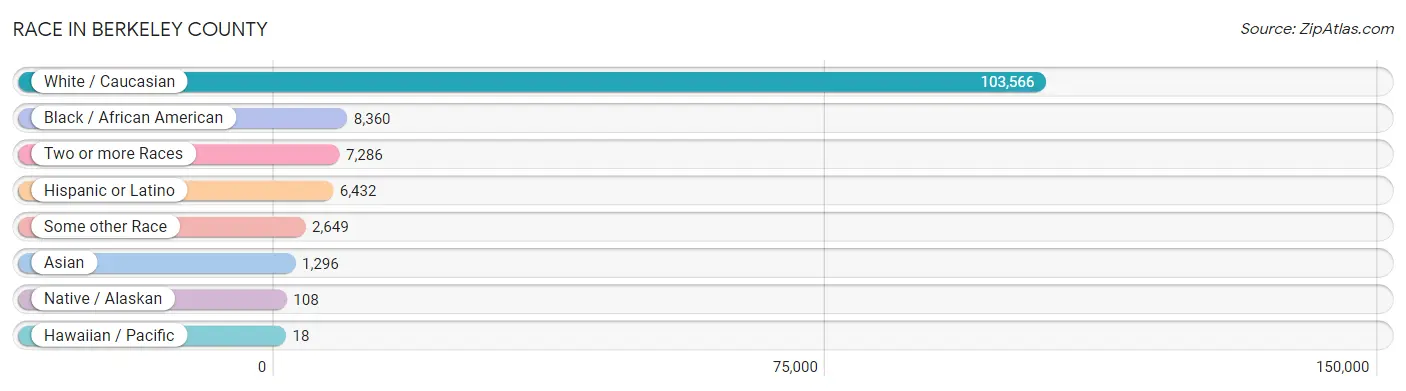
Race in Berkeley County
The most populous races in Berkeley County are White / Caucasian (103,566 | 84.0%), Black / African American (8,360 | 6.8%), and Two or more Races (7,286 | 5.9%).
| Race | # Population | % Population |
| Asian | 1,296 | 1.1% |
| Black / African American | 8,360 | 6.8% |
| Hawaiian / Pacific | 18 | 0.0% |
| Hispanic or Latino | 6,432 | 5.2% |
| Native / Alaskan | 108 | 0.1% |
| White / Caucasian | 103,566 | 84.0% |
| Two or more Races | 7,286 | 5.9% |
| Some other Race | 2,649 | 2.1% |
| Total | 123,283 | 100.0% |
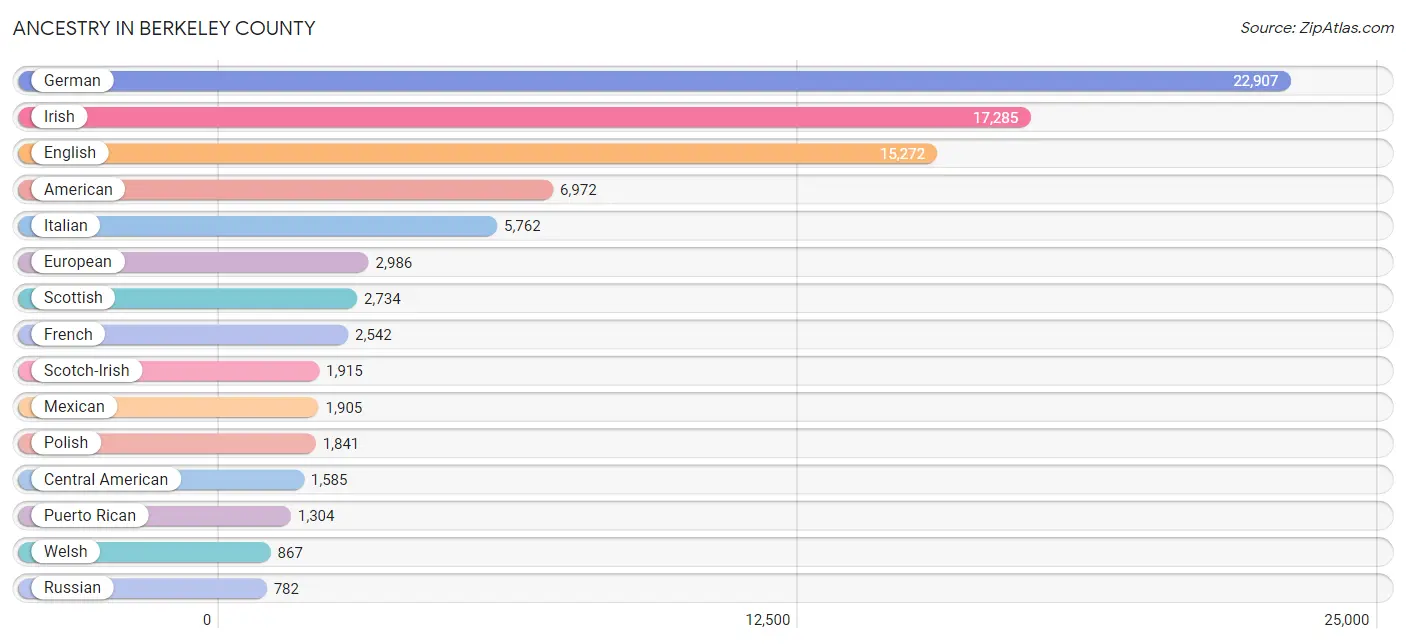
Ancestry in Berkeley County
The most populous ancestries reported in Berkeley County are German (22,907 | 18.6%), Irish (17,285 | 14.0%), English (15,272 | 12.4%), American (6,972 | 5.7%), and Italian (5,762 | 4.7%), together accounting for 55.3% of all Berkeley County residents.
| Ancestry | # Population | % Population |
| African | 290 | 0.2% |
| Albanian | 21 | 0.0% |
| Alsatian | 17 | 0.0% |
| American | 6,972 | 5.7% |
| Apache | 26 | 0.0% |
| Arab | 324 | 0.3% |
| Argentinean | 95 | 0.1% |
| Armenian | 15 | 0.0% |
| Australian | 52 | 0.0% |
| Austrian | 326 | 0.3% |
| Bhutanese | 323 | 0.3% |
| Blackfeet | 19 | 0.0% |
| British | 610 | 0.5% |
| Burmese | 242 | 0.2% |
| Canadian | 176 | 0.1% |
| Celtic | 14 | 0.0% |
| Central American | 1,585 | 1.3% |
| Cherokee | 317 | 0.3% |
| Chinese | 1 | 0.0% |
| Choctaw | 13 | 0.0% |
| Colombian | 8 | 0.0% |
| Costa Rican | 218 | 0.2% |
| Croatian | 59 | 0.1% |
| Crow | 4 | 0.0% |
| Czech | 136 | 0.1% |
| Czechoslovakian | 137 | 0.1% |
| Danish | 111 | 0.1% |
| Dominican | 555 | 0.4% |
| Dutch | 644 | 0.5% |
| Eastern European | 352 | 0.3% |
| Ecuadorian | 85 | 0.1% |
| Egyptian | 271 | 0.2% |
| English | 15,272 | 12.4% |
| Ethiopian | 56 | 0.1% |
| European | 2,986 | 2.4% |
| Filipino | 66 | 0.1% |
| Finnish | 10 | 0.0% |
| French | 2,542 | 2.1% |
| French Canadian | 239 | 0.2% |
| German | 22,907 | 18.6% |
| Ghanaian | 96 | 0.1% |
| Greek | 257 | 0.2% |
| Guatemalan | 513 | 0.4% |
| Guyanese | 189 | 0.2% |
| Honduran | 187 | 0.2% |
| Hungarian | 220 | 0.2% |
| Indian (Asian) | 103 | 0.1% |
| Irish | 17,285 | 14.0% |
| Iroquois | 7 | 0.0% |
| Israeli | 16 | 0.0% |
| Italian | 5,762 | 4.7% |
| Jamaican | 479 | 0.4% |
| Japanese | 31 | 0.0% |
| Korean | 412 | 0.3% |
| Latvian | 18 | 0.0% |
| Lebanese | 11 | 0.0% |
| Lithuanian | 42 | 0.0% |
| Macedonian | 17 | 0.0% |
| Malaysian | 39 | 0.0% |
| Mexican | 1,905 | 1.5% |
| Mexican American Indian | 6 | 0.0% |
| Native Hawaiian | 1 | 0.0% |
| Nicaraguan | 21 | 0.0% |
| Nigerian | 83 | 0.1% |
| Northern European | 248 | 0.2% |
| Norwegian | 587 | 0.5% |
| Pakistani | 110 | 0.1% |
| Panamanian | 7 | 0.0% |
| Pennsylvania German | 63 | 0.1% |
| Peruvian | 128 | 0.1% |
| Polish | 1,841 | 1.5% |
| Portuguese | 114 | 0.1% |
| Puerto Rican | 1,304 | 1.1% |
| Romanian | 151 | 0.1% |
| Russian | 782 | 0.6% |
| Salvadoran | 639 | 0.5% |
| Scandinavian | 333 | 0.3% |
| Scotch-Irish | 1,915 | 1.5% |
| Scottish | 2,734 | 2.2% |
| Serbian | 74 | 0.1% |
| Shoshone | 7 | 0.0% |
| Sioux | 37 | 0.0% |
| Slovak | 227 | 0.2% |
| Slovene | 25 | 0.0% |
| South American | 434 | 0.4% |
| South American Indian | 15 | 0.0% |
| Spaniard | 52 | 0.0% |
| Spanish | 249 | 0.2% |
| Sri Lankan | 394 | 0.3% |
| Subsaharan African | 743 | 0.6% |
| Swedish | 408 | 0.3% |
| Swiss | 203 | 0.2% |
| Syrian | 15 | 0.0% |
| Thai | 272 | 0.2% |
| Turkish | 28 | 0.0% |
| Ukrainian | 85 | 0.1% |
| Uruguayan | 49 | 0.0% |
| Venezuelan | 69 | 0.1% |
| Welsh | 867 | 0.7% |
| West Indian | 9 | 0.0% |
| Zimbabwean | 28 | 0.0% | View All 101 Rows |
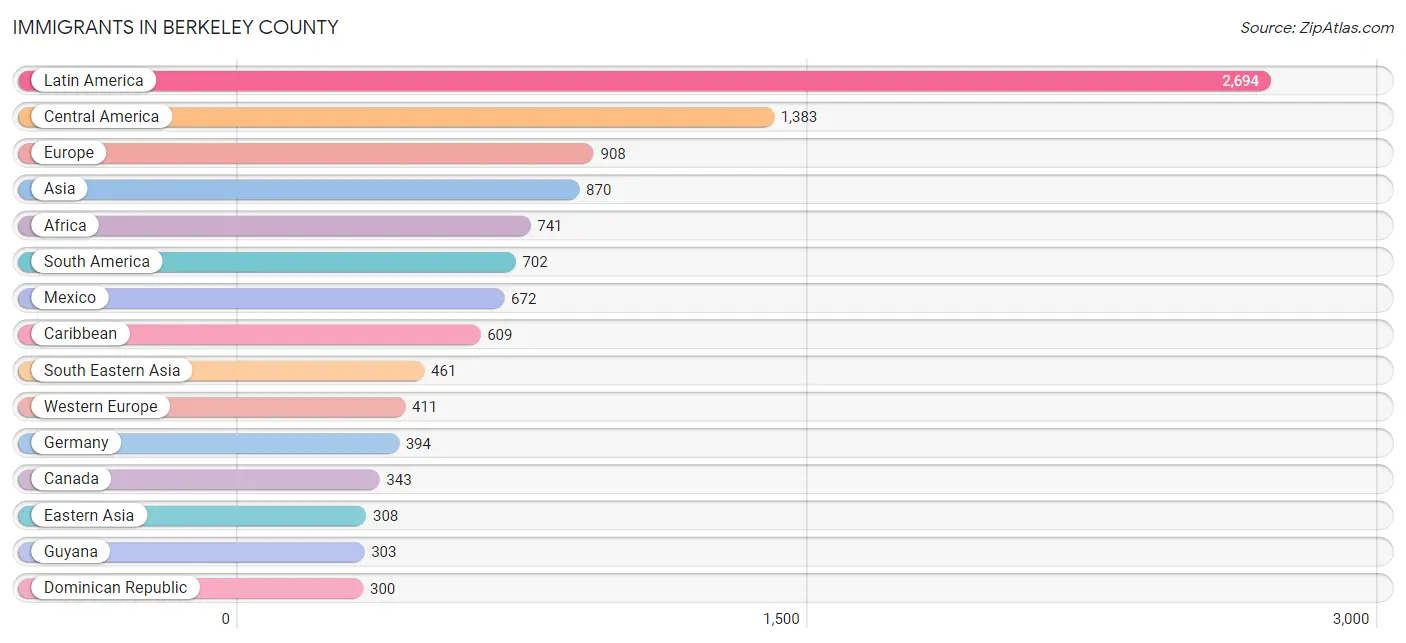
Immigrants in Berkeley County
The most numerous immigrant groups reported in Berkeley County came from Latin America (2,694 | 2.2%), Central America (1,383 | 1.1%), Europe (908 | 0.7%), Asia (870 | 0.7%), and Africa (741 | 0.6%), together accounting for 5.4% of all Berkeley County residents.
| Immigration Origin | # Population | % Population |
| Africa | 741 | 0.6% |
| Albania | 21 | 0.0% |
| Argentina | 113 | 0.1% |
| Asia | 870 | 0.7% |
| Brazil | 18 | 0.0% |
| Cambodia | 2 | 0.0% |
| Cameroon | 50 | 0.0% |
| Canada | 343 | 0.3% |
| Caribbean | 609 | 0.5% |
| Central America | 1,383 | 1.1% |
| China | 94 | 0.1% |
| Colombia | 33 | 0.0% |
| Costa Rica | 164 | 0.1% |
| Czechoslovakia | 10 | 0.0% |
| Dominican Republic | 300 | 0.2% |
| Eastern Africa | 247 | 0.2% |
| Eastern Asia | 308 | 0.3% |
| Eastern Europe | 141 | 0.1% |
| Ecuador | 68 | 0.1% |
| Egypt | 194 | 0.2% |
| El Salvador | 189 | 0.2% |
| England | 55 | 0.0% |
| Eritrea | 98 | 0.1% |
| Ethiopia | 33 | 0.0% |
| Europe | 908 | 0.7% |
| France | 17 | 0.0% |
| Germany | 394 | 0.3% |
| Ghana | 15 | 0.0% |
| Guatemala | 244 | 0.2% |
| Guyana | 303 | 0.3% |
| Honduras | 89 | 0.1% |
| Hungary | 22 | 0.0% |
| Israel | 16 | 0.0% |
| Italy | 196 | 0.2% |
| Jamaica | 256 | 0.2% |
| Japan | 72 | 0.1% |
| Kazakhstan | 20 | 0.0% |
| Korea | 142 | 0.1% |
| Latin America | 2,694 | 2.2% |
| Liberia | 38 | 0.0% |
| Mexico | 672 | 0.5% |
| Middle Africa | 50 | 0.0% |
| Nicaragua | 25 | 0.0% |
| Nigeria | 127 | 0.1% |
| Northern Africa | 194 | 0.2% |
| Northern Europe | 70 | 0.1% |
| Pakistan | 65 | 0.1% |
| Peru | 73 | 0.1% |
| Philippines | 200 | 0.2% |
| Portugal | 62 | 0.1% |
| Romania | 29 | 0.0% |
| Russia | 48 | 0.0% |
| Scotland | 15 | 0.0% |
| South Africa | 24 | 0.0% |
| South America | 702 | 0.6% |
| South Central Asia | 85 | 0.1% |
| South Eastern Asia | 461 | 0.4% |
| Southern Europe | 260 | 0.2% |
| Spain | 2 | 0.0% |
| Taiwan | 24 | 0.0% |
| Thailand | 47 | 0.0% |
| Trinidad and Tobago | 44 | 0.0% |
| Uruguay | 49 | 0.0% |
| Venezuela | 45 | 0.0% |
| Vietnam | 212 | 0.2% |
| Western Africa | 180 | 0.2% |
| Western Asia | 16 | 0.0% |
| Western Europe | 411 | 0.3% |
| Zimbabwe | 116 | 0.1% | View All 69 Rows |
Sex and Age in Berkeley County
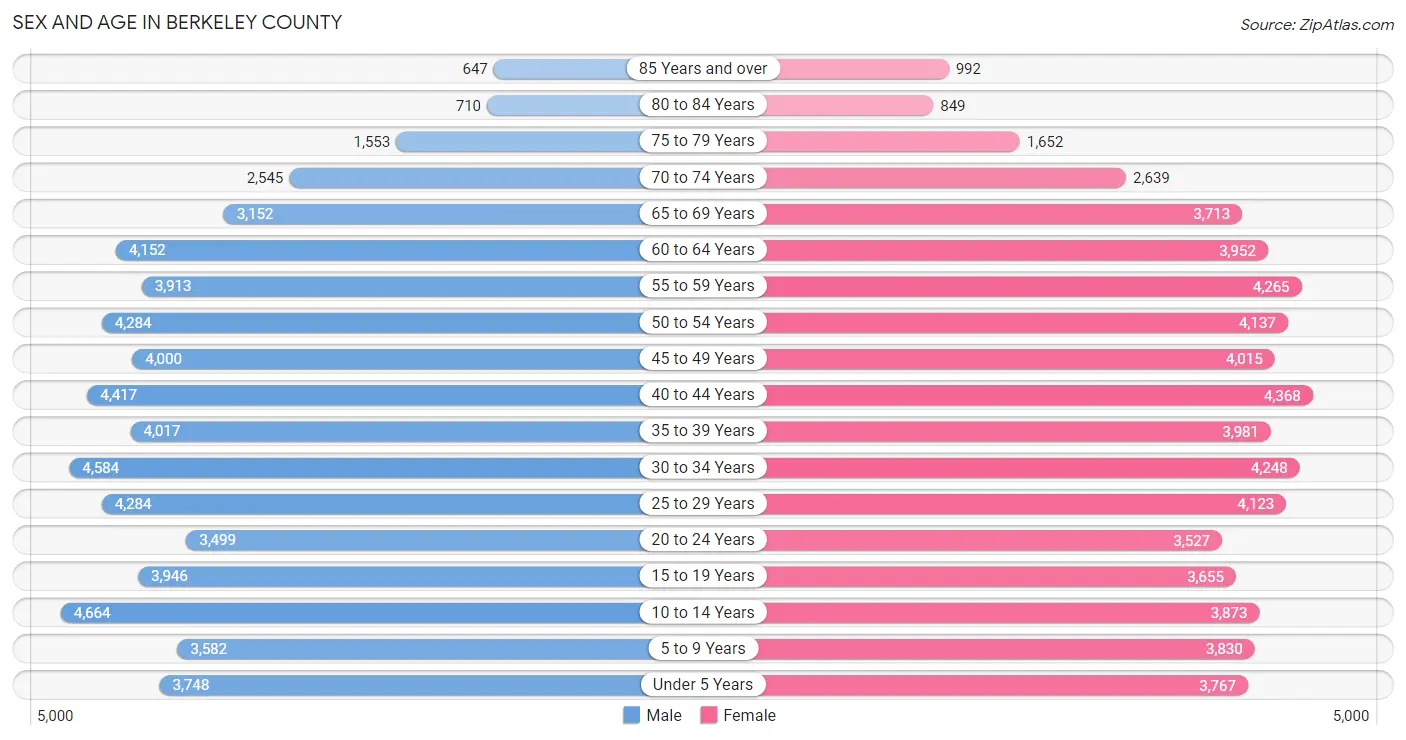
Sex and Age in Berkeley County
The most populous age groups in Berkeley County are 10 to 14 Years (4,664 | 7.6%) for men and 40 to 44 Years (4,368 | 7.1%) for women.
| Age Bracket | Male | Female |
| Under 5 Years | 3,748 (6.1%) | 3,767 (6.1%) |
| 5 to 9 Years | 3,582 (5.8%) | 3,830 (6.2%) |
| 10 to 14 Years | 4,664 (7.6%) | 3,873 (6.3%) |
| 15 to 19 Years | 3,946 (6.4%) | 3,655 (5.9%) |
| 20 to 24 Years | 3,499 (5.7%) | 3,527 (5.7%) |
| 25 to 29 Years | 4,284 (6.9%) | 4,123 (6.7%) |
| 30 to 34 Years | 4,584 (7.4%) | 4,248 (6.9%) |
| 35 to 39 Years | 4,017 (6.5%) | 3,981 (6.5%) |
| 40 to 44 Years | 4,417 (7.2%) | 4,368 (7.1%) |
| 45 to 49 Years | 4,000 (6.5%) | 4,015 (6.5%) |
| 50 to 54 Years | 4,284 (6.9%) | 4,137 (6.7%) |
| 55 to 59 Years | 3,913 (6.3%) | 4,265 (6.9%) |
| 60 to 64 Years | 4,152 (6.7%) | 3,952 (6.4%) |
| 65 to 69 Years | 3,152 (5.1%) | 3,713 (6.0%) |
| 70 to 74 Years | 2,545 (4.1%) | 2,639 (4.3%) |
| 75 to 79 Years | 1,553 (2.5%) | 1,652 (2.7%) |
| 80 to 84 Years | 710 (1.1%) | 849 (1.4%) |
| 85 Years and over | 647 (1.1%) | 992 (1.6%) |
| Total | 61,697 (100.0%) | 61,586 (100.0%) |
Families and Households in Berkeley County
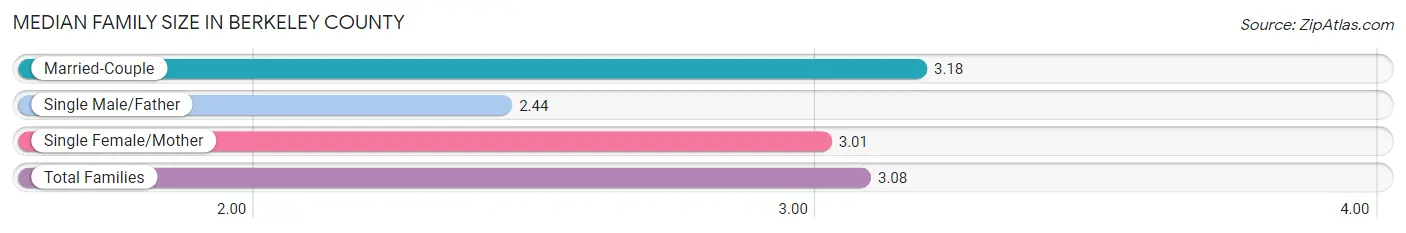
Median Family Size in Berkeley County
The median family size in Berkeley County is 3.08 persons per family, with married-couple families (23,257 | 74.5%) accounting for the largest median family size of 3.18 persons per family. On the other hand, single male/father families (2,894 | 9.3%) represent the smallest median family size with 2.44 persons per family.
| Family Type | # Families | Family Size |
| Married-Couple | 23,257 (74.5%) | 3.18 |
| Single Male/Father | 2,894 (9.3%) | 2.44 |
| Single Female/Mother | 5,058 (16.2%) | 3.01 |
| Total Families | 31,209 (100.0%) | 3.08 |
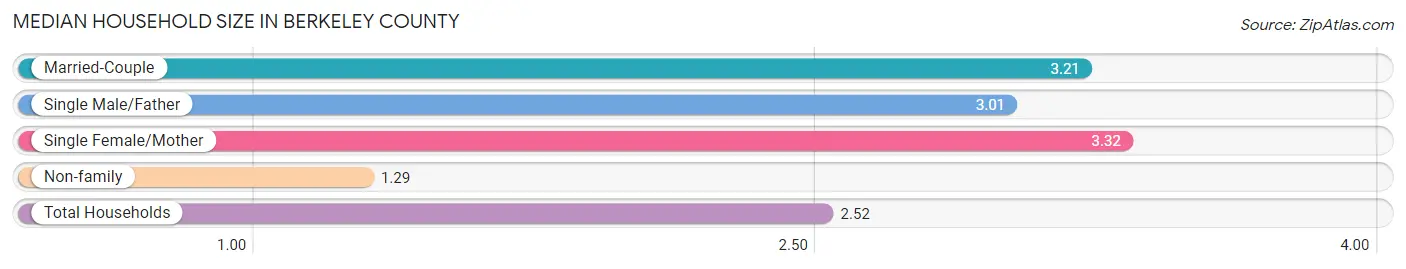
Median Household Size in Berkeley County
The median household size in Berkeley County is 2.52 persons per household, with single female/mother households (5,058 | 10.4%) accounting for the largest median household size of 3.32 persons per household. non-family households (17,319 | 35.7%) represent the smallest median household size with 1.29 persons per household.
| Household Type | # Households | Household Size |
| Married-Couple | 23,257 (47.9%) | 3.21 |
| Single Male/Father | 2,894 (6.0%) | 3.01 |
| Single Female/Mother | 5,058 (10.4%) | 3.32 |
| Non-family | 17,319 (35.7%) | 1.29 |
| Total Households | 48,528 (100.0%) | 2.52 |
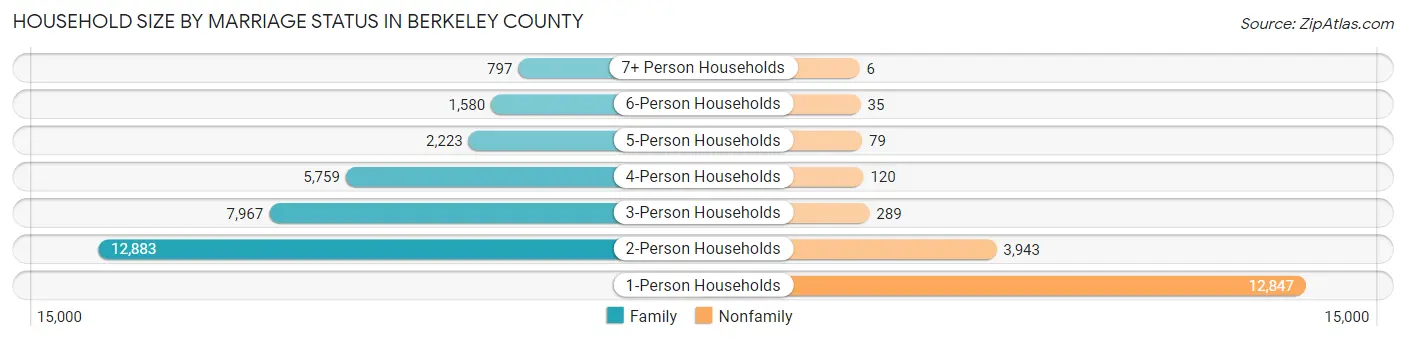
Household Size by Marriage Status in Berkeley County
Out of a total of 48,528 households in Berkeley County, 31,209 (64.3%) are family households, while 17,319 (35.7%) are nonfamily households. The most numerous type of family households are 2-person households, comprising 12,883, and the most common type of nonfamily households are 1-person households, comprising 12,847.
| Household Size | Family Households | Nonfamily Households |
| 1-Person Households | - | 12,847 (26.5%) |
| 2-Person Households | 12,883 (26.6%) | 3,943 (8.1%) |
| 3-Person Households | 7,967 (16.4%) | 289 (0.6%) |
| 4-Person Households | 5,759 (11.9%) | 120 (0.3%) |
| 5-Person Households | 2,223 (4.6%) | 79 (0.2%) |
| 6-Person Households | 1,580 (3.3%) | 35 (0.1%) |
| 7+ Person Households | 797 (1.6%) | 6 (0.0%) |
| Total | 31,209 (64.3%) | 17,319 (35.7%) |
Female Fertility in Berkeley County
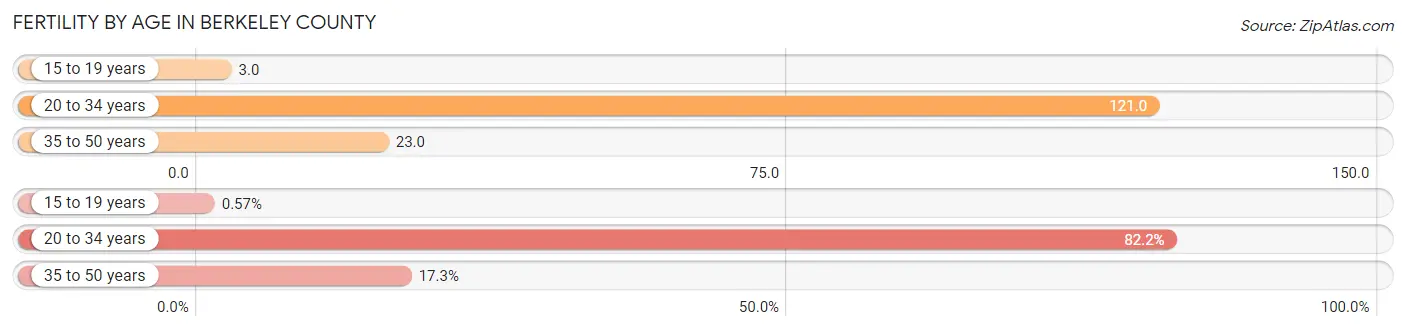
Fertility by Age in Berkeley County
Average fertility rate in Berkeley County is 61.0 births per 1,000 women. Women in the age bracket of 20 to 34 years have the highest fertility rate with 121.0 births per 1,000 women. Women in the age bracket of 20 to 34 years acount for 82.2% of all women with births.
| Age Bracket | Women with Births | Births / 1,000 Women |
| 15 to 19 years | 10 (0.6%) | 3.0 |
| 20 to 34 years | 1,436 (82.2%) | 121.0 |
| 35 to 50 years | 302 (17.3%) | 23.0 |
| Total | 1,748 (100.0%) | 61.0 |
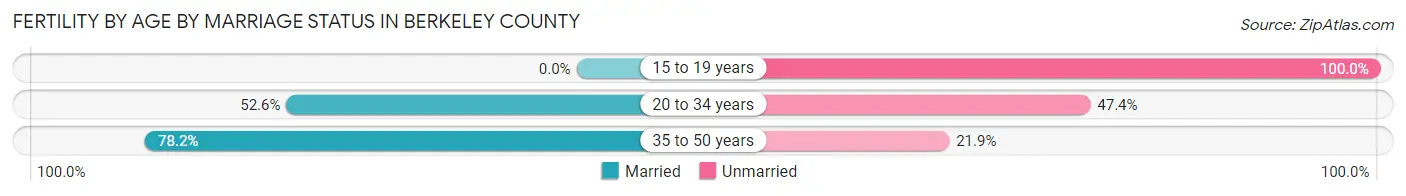
Fertility by Age by Marriage Status in Berkeley County
56.7% of women with births (1,748) in Berkeley County are married. The highest percentage of unmarried women with births falls into 15 to 19 years age bracket with 100.0% of them unmarried at the time of birth, while the lowest percentage of unmarried women with births belong to 35 to 50 years age bracket with 21.9% of them unmarried.
| Age Bracket | Married | Unmarried |
| 15 to 19 years | 0 (0.0%) | 10 (100.0%) |
| 20 to 34 years | 755 (52.6%) | 681 (47.4%) |
| 35 to 50 years | 236 (78.1%) | 66 (21.8%) |
| Total | 991 (56.7%) | 757 (43.3%) |
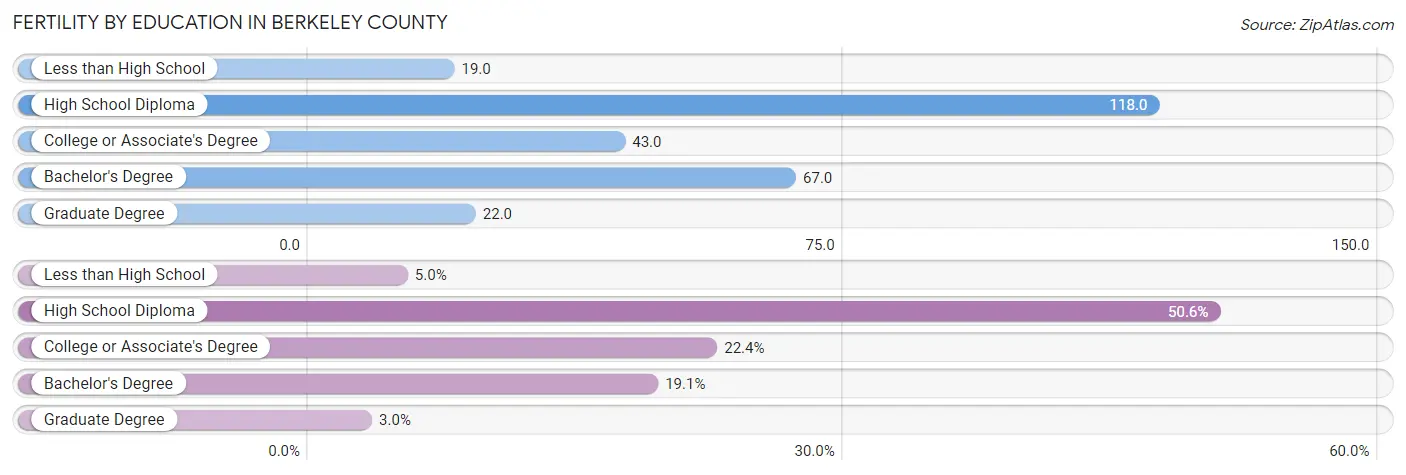
Fertility by Education in Berkeley County
Average fertility rate in Berkeley County is 61.0 births per 1,000 women. Women with the education attainment of high school diploma have the highest fertility rate of 118.0 births per 1,000 women, while women with the education attainment of less than high school have the lowest fertility at 19.0 births per 1,000 women. Women with the education attainment of high school diploma represent 50.6% of all women with births.
| Educational Attainment | Women with Births | Births / 1,000 Women |
| Less than High School | 87 (5.0%) | 19.0 |
| High School Diploma | 885 (50.6%) | 118.0 |
| College or Associate's Degree | 391 (22.4%) | 43.0 |
| Bachelor's Degree | 333 (19.1%) | 67.0 |
| Graduate Degree | 52 (3.0%) | 22.0 |
| Total | 1,748 (100.0%) | 61.0 |
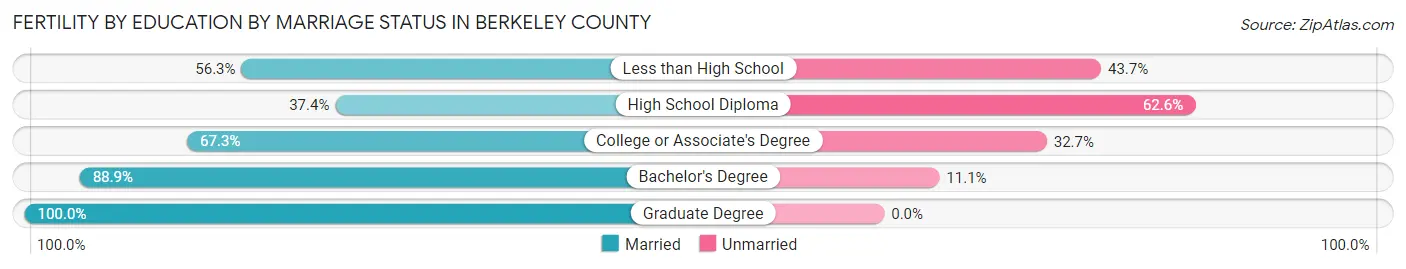
Fertility by Education by Marriage Status in Berkeley County
43.3% of women with births in Berkeley County are unmarried. Women with the educational attainment of graduate degree are most likely to be married with 100.0% of them married at childbirth, while women with the educational attainment of high school diploma are least likely to be married with 62.6% of them unmarried at childbirth.
| Educational Attainment | Married | Unmarried |
| Less than High School | 49 (56.3%) | 38 (43.7%) |
| High School Diploma | 331 (37.4%) | 554 (62.6%) |
| College or Associate's Degree | 263 (67.3%) | 128 (32.7%) |
| Bachelor's Degree | 296 (88.9%) | 37 (11.1%) |
| Graduate Degree | 52 (100.0%) | 0 (0.0%) |
| Total | 991 (56.7%) | 757 (43.3%) |
Income in Berkeley County
Income Overview in Berkeley County
Per Capita Income in Berkeley County is $35,909, while median incomes of families and households are $85,110 and $73,619 respectively.
| Characteristic | Number | Measure |
| Per Capita Income | 123,283 | $35,909 |
| Median Family Income | 31,209 | $85,110 |
| Mean Family Income | 31,209 | $100,434 |
| Median Household Income | 48,528 | $73,619 |
| Mean Household Income | 48,528 | $90,429 |
| Income Deficit | 31,209 | $10,882 |
| Wage / Income Gap (%) | 123,283 | 30.12% |
| Wage / Income Gap ($) | 123,283 | 69.88¢ per $1 |
| Gini / Inequality Index | 123,283 | 0.40 |
Earnings by Sex in Berkeley County
Average Earnings in Berkeley County are $43,024, $49,013 for men and $34,251 for women, a difference of 30.1%.
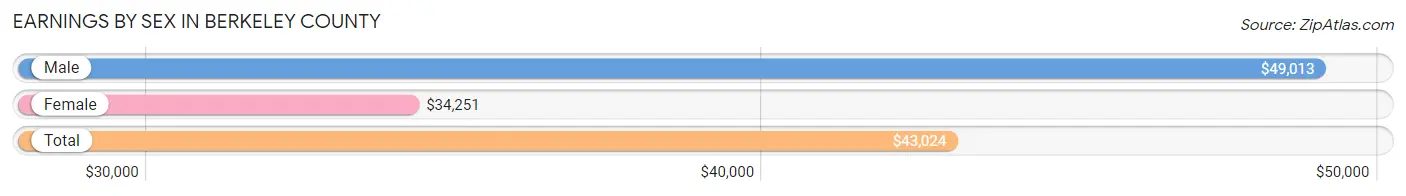
| Sex | Number | Average Earnings |
| Male | 35,816 (53.4%) | $49,013 |
| Female | 31,209 (46.6%) | $34,251 |
| Total | 67,025 (100.0%) | $43,024 |
Earnings by Sex by Income Bracket in Berkeley County
The most common earnings brackets in Berkeley County are $100,000+ for men (4,807 | 13.4%) and $25,000 to $29,999 for women (2,661 | 8.5%).
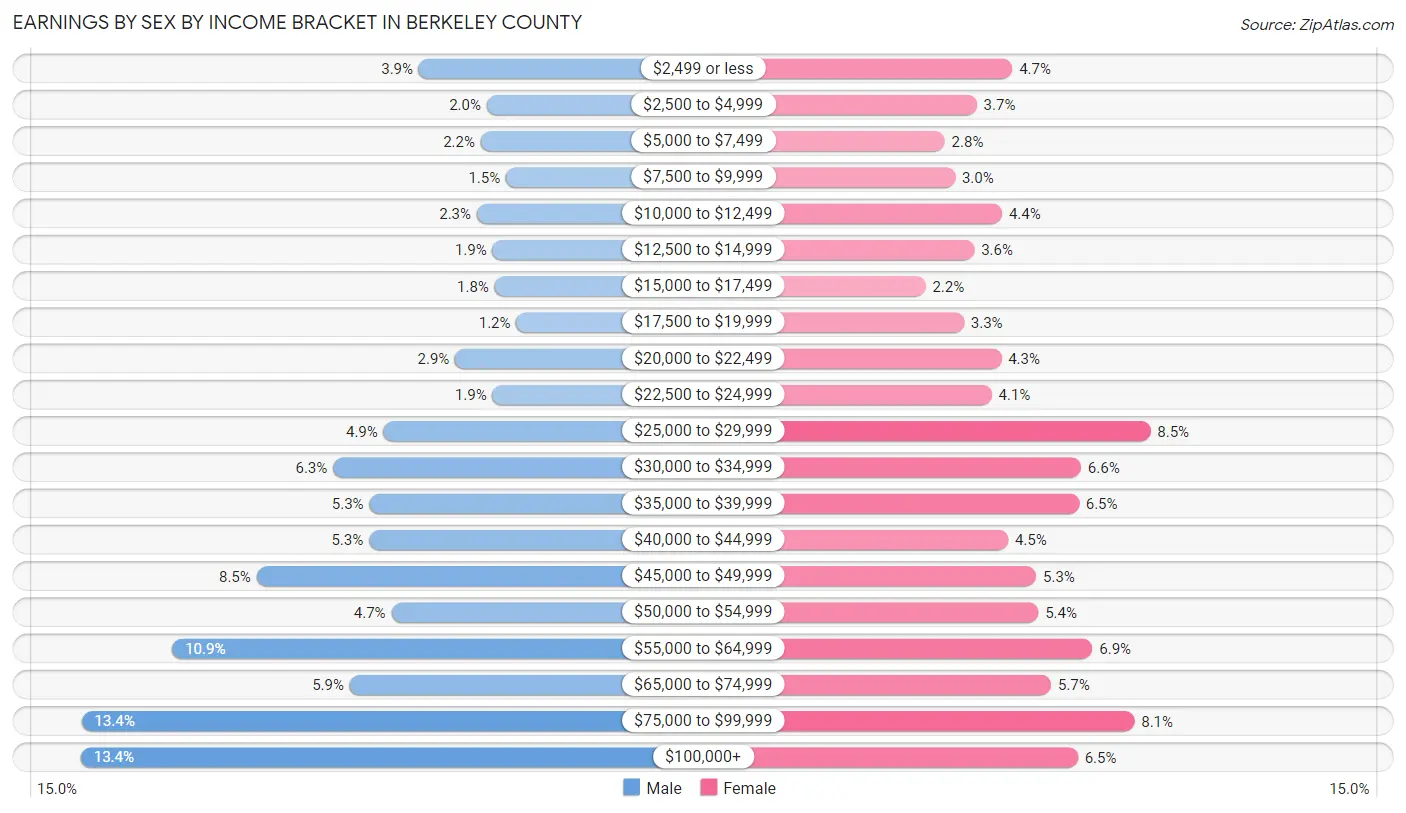
| Income | Male | Female |
| $2,499 or less | 1,403 (3.9%) | 1,450 (4.6%) |
| $2,500 to $4,999 | 719 (2.0%) | 1,138 (3.6%) |
| $5,000 to $7,499 | 779 (2.2%) | 857 (2.8%) |
| $7,500 to $9,999 | 525 (1.5%) | 950 (3.0%) |
| $10,000 to $12,499 | 819 (2.3%) | 1,360 (4.4%) |
| $12,500 to $14,999 | 662 (1.8%) | 1,118 (3.6%) |
| $15,000 to $17,499 | 641 (1.8%) | 691 (2.2%) |
| $17,500 to $19,999 | 424 (1.2%) | 1,026 (3.3%) |
| $20,000 to $22,499 | 1,040 (2.9%) | 1,356 (4.3%) |
| $22,500 to $24,999 | 664 (1.8%) | 1,271 (4.1%) |
| $25,000 to $29,999 | 1,760 (4.9%) | 2,661 (8.5%) |
| $30,000 to $34,999 | 2,267 (6.3%) | 2,052 (6.6%) |
| $35,000 to $39,999 | 1,902 (5.3%) | 2,035 (6.5%) |
| $40,000 to $44,999 | 1,907 (5.3%) | 1,414 (4.5%) |
| $45,000 to $49,999 | 3,036 (8.5%) | 1,661 (5.3%) |
| $50,000 to $54,999 | 1,679 (4.7%) | 1,679 (5.4%) |
| $55,000 to $64,999 | 3,885 (10.8%) | 2,152 (6.9%) |
| $65,000 to $74,999 | 2,098 (5.9%) | 1,792 (5.7%) |
| $75,000 to $99,999 | 4,799 (13.4%) | 2,522 (8.1%) |
| $100,000+ | 4,807 (13.4%) | 2,024 (6.5%) |
| Total | 35,816 (100.0%) | 31,209 (100.0%) |
Earnings by Sex by Educational Attainment in Berkeley County
Average earnings in Berkeley County are $54,886 for men and $37,718 for women, a difference of 31.3%. Men with an educational attainment of graduate degree enjoy the highest average annual earnings of $82,766, while those with less than high school education earn the least with $31,738. Women with an educational attainment of graduate degree earn the most with the average annual earnings of $66,067, while those with less than high school education have the smallest earnings of $23,948.
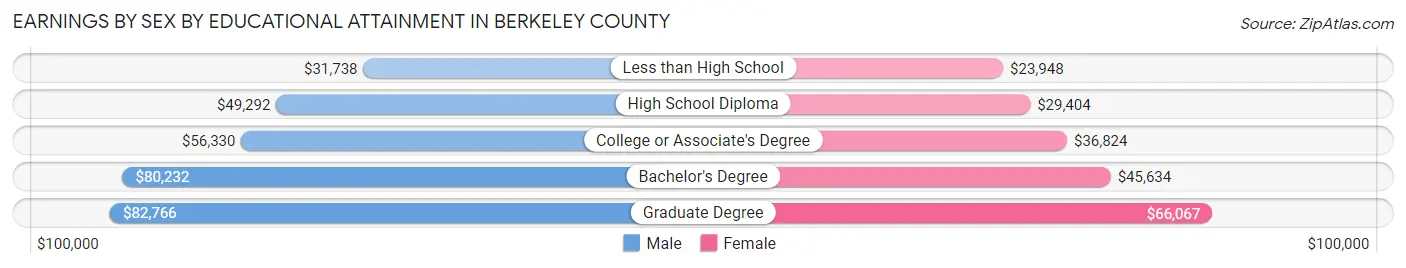
| Educational Attainment | Male Income | Female Income |
| Less than High School | $31,738 | $23,948 |
| High School Diploma | $49,292 | $29,404 |
| College or Associate's Degree | $56,330 | $36,824 |
| Bachelor's Degree | $80,232 | $45,634 |
| Graduate Degree | $82,766 | $66,067 |
| Total | $54,886 | $37,718 |
Family Income in Berkeley County
Family Income Brackets in Berkeley County
According to the Berkeley County family income data, there are 6,772 families falling into the $100,000 to $149,999 income range, which is the most common income bracket and makes up 21.7% of all families. Conversely, the $10,000 to $14,999 income bracket is the least frequent group with only 468 families (1.5%) belonging to this category.
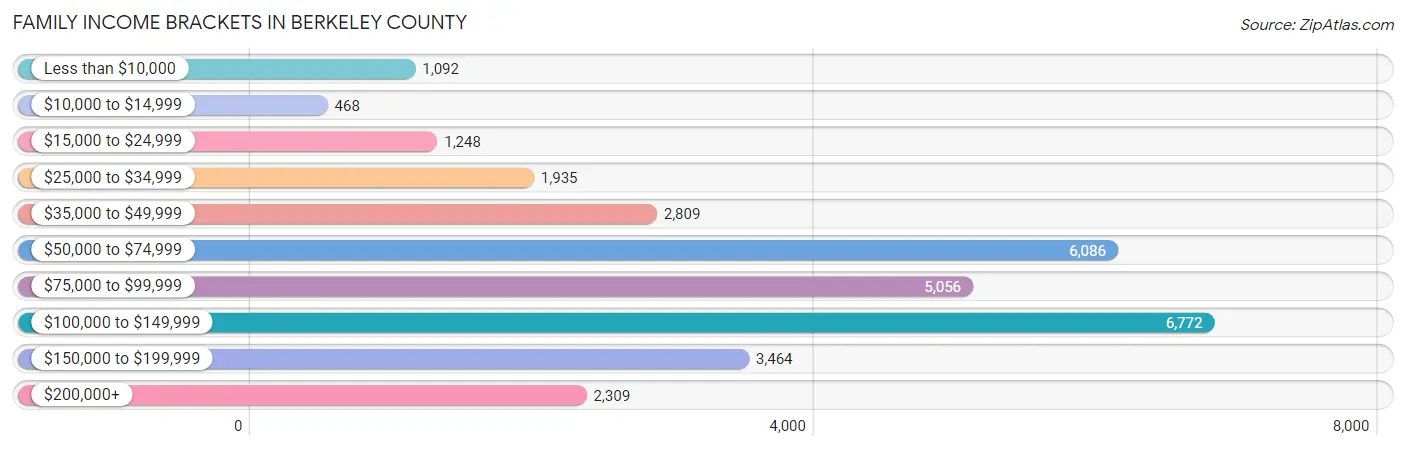
| Income Bracket | # Families | % Families |
| Less than $10,000 | 1,092 | 3.5% |
| $10,000 to $14,999 | 468 | 1.5% |
| $15,000 to $24,999 | 1,248 | 4.0% |
| $25,000 to $34,999 | 1,935 | 6.2% |
| $35,000 to $49,999 | 2,809 | 9.0% |
| $50,000 to $74,999 | 6,086 | 19.5% |
| $75,000 to $99,999 | 5,056 | 16.2% |
| $100,000 to $149,999 | 6,772 | 21.7% |
| $150,000 to $199,999 | 3,464 | 11.1% |
| $200,000+ | 2,309 | 7.4% |
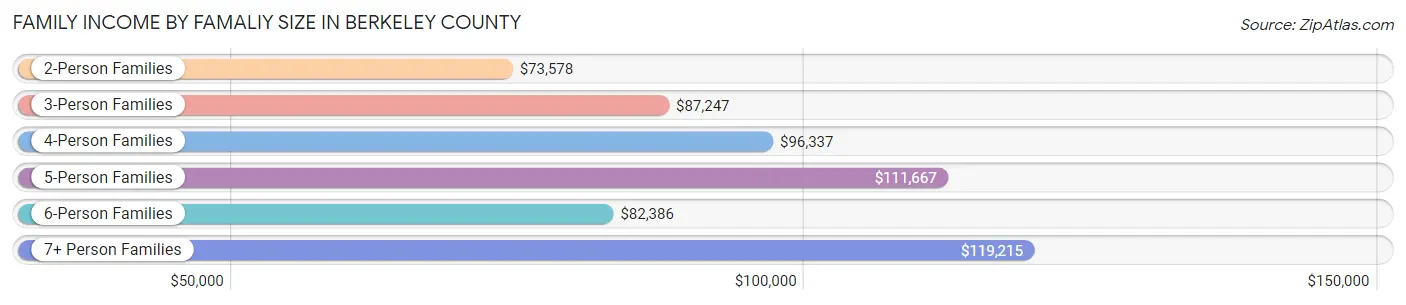
Family Income by Famaliy Size in Berkeley County
7+ person families (659 | 2.1%) account for the highest median family income in Berkeley County with $119,215 per family, while 2-person families (14,598 | 46.8%) have the highest median income of $36,789 per family member.
| Income Bracket | # Families | Median Income |
| 2-Person Families | 14,598 (46.8%) | $73,578 |
| 3-Person Families | 7,439 (23.8%) | $87,247 |
| 4-Person Families | 5,356 (17.2%) | $96,337 |
| 5-Person Families | 2,000 (6.4%) | $111,667 |
| 6-Person Families | 1,157 (3.7%) | $82,386 |
| 7+ Person Families | 659 (2.1%) | $119,215 |
| Total | 31,209 (100.0%) | $85,110 |
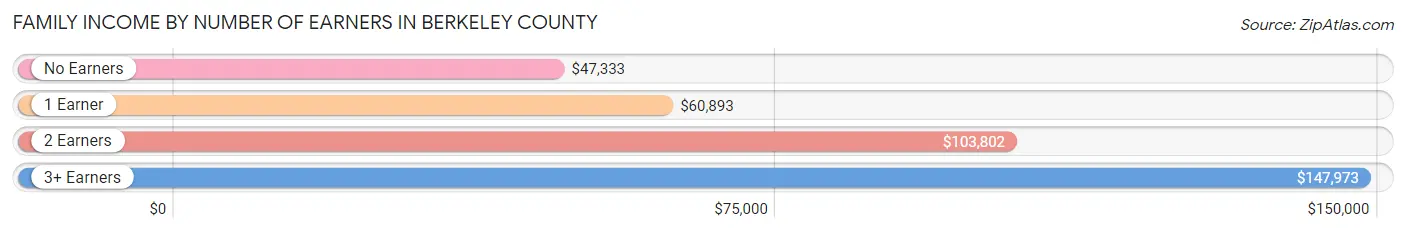
Family Income by Number of Earners in Berkeley County
The median family income in Berkeley County is $85,110, with families comprising 3+ earners (3,436) having the highest median family income of $147,973, while families with no earners (4,196) have the lowest median family income of $47,333, accounting for 11.0% and 13.4% of families, respectively.
| Number of Earners | # Families | Median Income |
| No Earners | 4,196 (13.4%) | $47,333 |
| 1 Earner | 10,714 (34.3%) | $60,893 |
| 2 Earners | 12,863 (41.2%) | $103,802 |
| 3+ Earners | 3,436 (11.0%) | $147,973 |
| Total | 31,209 (100.0%) | $85,110 |
Household Income in Berkeley County
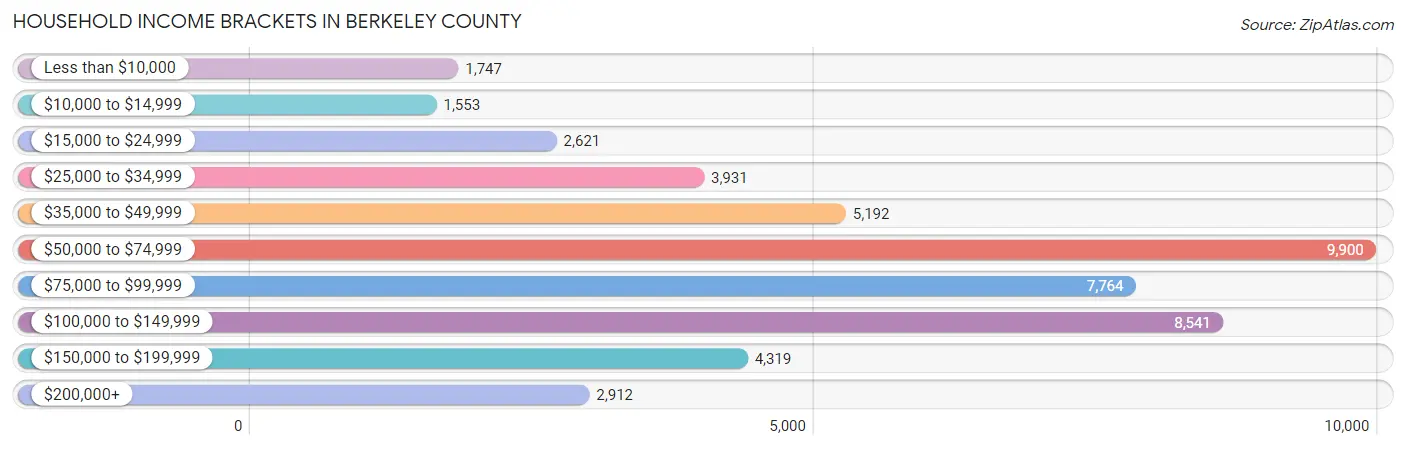
Household Income Brackets in Berkeley County
With 9,900 households falling in the category, the $50,000 to $74,999 income range is the most frequent in Berkeley County, accounting for 20.4% of all households. In contrast, only 1,553 households (3.2%) fall into the $10,000 to $14,999 income bracket, making it the least populous group.
| Income Bracket | # Households | % Households |
| Less than $10,000 | 1,747 | 3.6% |
| $10,000 to $14,999 | 1,553 | 3.2% |
| $15,000 to $24,999 | 2,621 | 5.4% |
| $25,000 to $34,999 | 3,931 | 8.1% |
| $35,000 to $49,999 | 5,192 | 10.7% |
| $50,000 to $74,999 | 9,900 | 20.4% |
| $75,000 to $99,999 | 7,764 | 16.0% |
| $100,000 to $149,999 | 8,541 | 17.6% |
| $150,000 to $199,999 | 4,319 | 8.9% |
| $200,000+ | 2,912 | 6.0% |
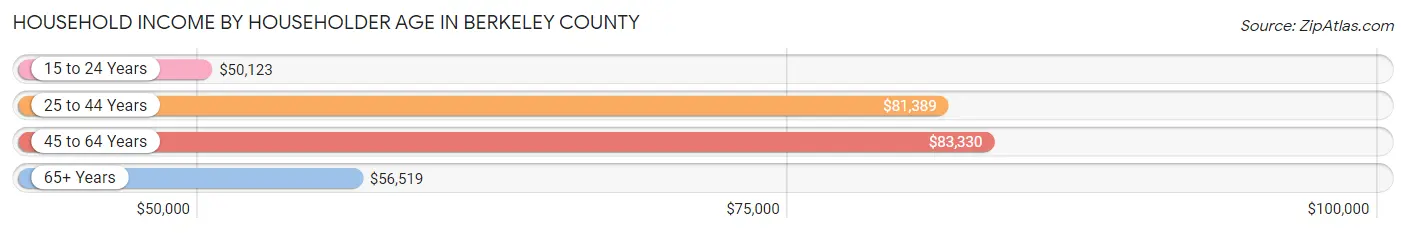
Household Income by Householder Age in Berkeley County
The median household income in Berkeley County is $73,619, with the highest median household income of $83,330 found in the 45 to 64 years age bracket for the primary householder. A total of 18,645 households (38.4%) fall into this category. Meanwhile, the 15 to 24 years age bracket for the primary householder has the lowest median household income of $50,123, with 1,843 households (3.8%) in this group.
| Income Bracket | # Households | Median Income |
| 15 to 24 Years | 1,843 (3.8%) | $50,123 |
| 25 to 44 Years | 16,555 (34.1%) | $81,389 |
| 45 to 64 Years | 18,645 (38.4%) | $83,330 |
| 65+ Years | 11,485 (23.7%) | $56,519 |
| Total | 48,528 (100.0%) | $73,619 |
Poverty in Berkeley County
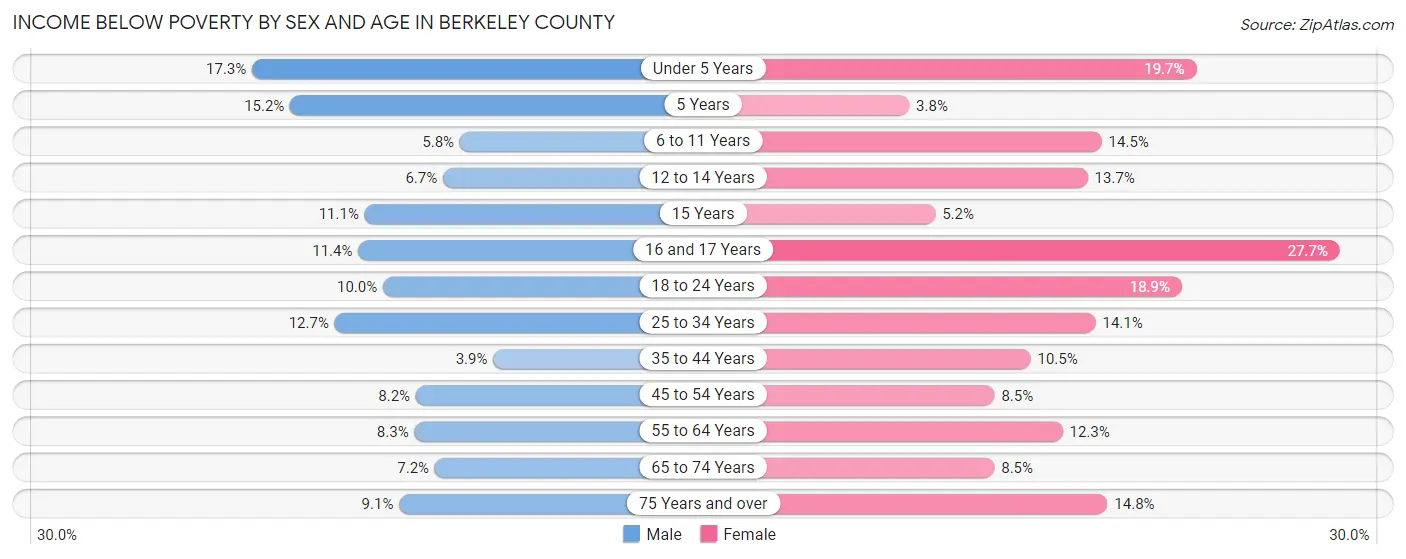
Income Below Poverty by Sex and Age in Berkeley County
With 8.9% poverty level for males and 13.0% for females among the residents of Berkeley County, under 5 year old males and 16 and 17 year old females are the most vulnerable to poverty, with 637 males (17.3%) and 473 females (27.7%) in their respective age groups living below the poverty level.
| Age Bracket | Male | Female |
| Under 5 Years | 637 (17.3%) | 721 (19.7%) |
| 5 Years | 89 (15.2%) | 18 (3.7%) |
| 6 to 11 Years | 259 (5.8%) | 643 (14.5%) |
| 12 to 14 Years | 178 (6.7%) | 327 (13.7%) |
| 15 Years | 91 (11.1%) | 38 (5.2%) |
| 16 and 17 Years | 186 (11.4%) | 473 (27.7%) |
| 18 to 24 Years | 496 (10.0%) | 896 (18.9%) |
| 25 to 34 Years | 1,108 (12.7%) | 1,180 (14.1%) |
| 35 to 44 Years | 325 (3.9%) | 875 (10.5%) |
| 45 to 54 Years | 677 (8.2%) | 692 (8.5%) |
| 55 to 64 Years | 664 (8.3%) | 1,009 (12.3%) |
| 65 to 74 Years | 406 (7.1%) | 536 (8.5%) |
| 75 Years and over | 266 (9.1%) | 515 (14.8%) |
| Total | 5,382 (8.9%) | 7,923 (13.0%) |
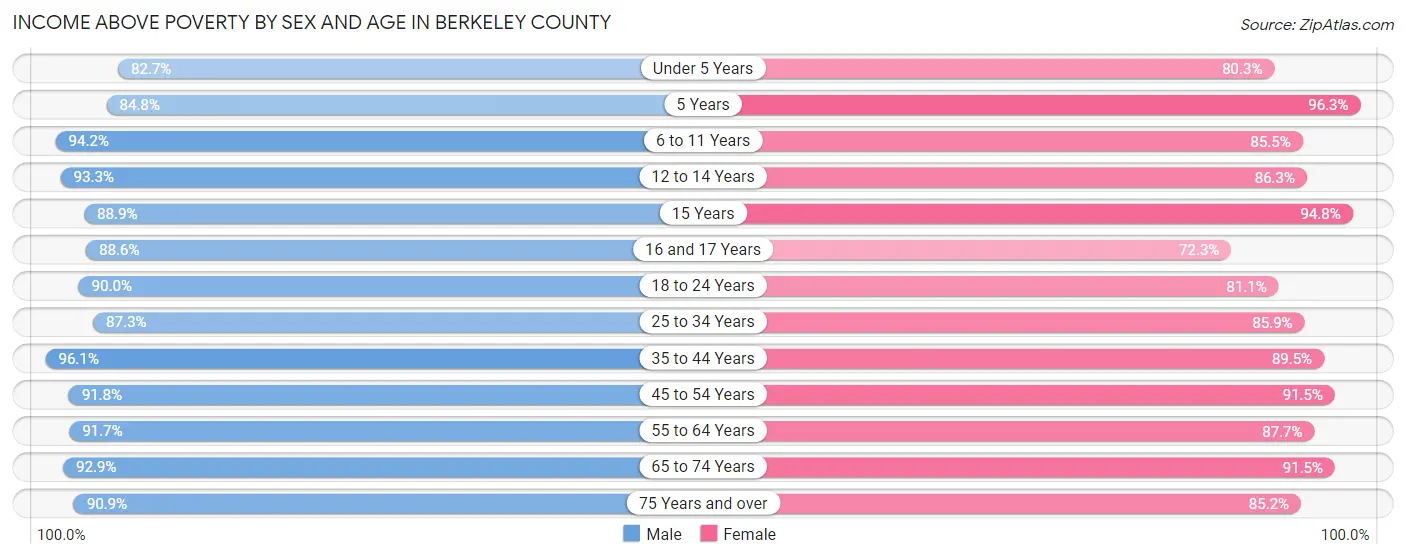
Income Above Poverty by Sex and Age in Berkeley County
According to the poverty statistics in Berkeley County, males aged 35 to 44 years and females aged 5 years are the age groups that are most secure financially, with 96.1% of males and 96.3% of females in these age groups living above the poverty line.
| Age Bracket | Male | Female |
| Under 5 Years | 3,038 (82.7%) | 2,932 (80.3%) |
| 5 Years | 496 (84.8%) | 462 (96.3%) |
| 6 to 11 Years | 4,239 (94.2%) | 3,800 (85.5%) |
| 12 to 14 Years | 2,477 (93.3%) | 2,061 (86.3%) |
| 15 Years | 732 (88.9%) | 693 (94.8%) |
| 16 and 17 Years | 1,443 (88.6%) | 1,233 (72.3%) |
| 18 to 24 Years | 4,443 (90.0%) | 3,838 (81.1%) |
| 25 to 34 Years | 7,596 (87.3%) | 7,170 (85.9%) |
| 35 to 44 Years | 8,001 (96.1%) | 7,452 (89.5%) |
| 45 to 54 Years | 7,565 (91.8%) | 7,450 (91.5%) |
| 55 to 64 Years | 7,344 (91.7%) | 7,198 (87.7%) |
| 65 to 74 Years | 5,273 (92.8%) | 5,780 (91.5%) |
| 75 Years and over | 2,644 (90.9%) | 2,967 (85.2%) |
| Total | 55,291 (91.1%) | 53,036 (87.0%) |
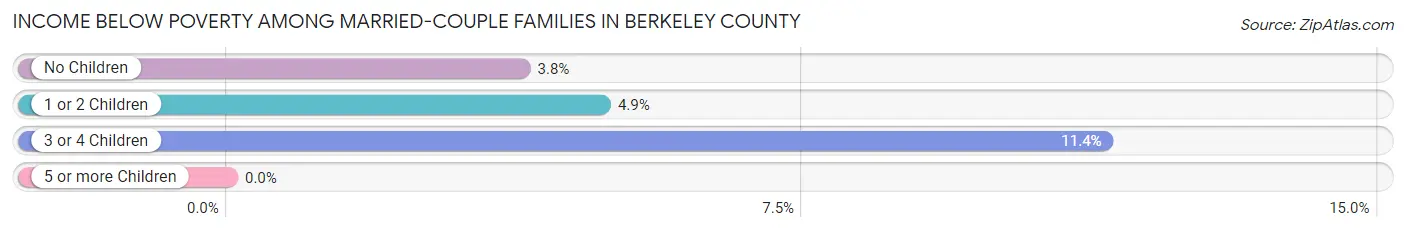
Income Below Poverty Among Married-Couple Families in Berkeley County
The poverty statistics for married-couple families in Berkeley County show that 4.6% or 1,080 of the total 23,257 families live below the poverty line. Families with 3 or 4 children have the highest poverty rate of 11.4%, comprising of 174 families. On the other hand, families with 5 or more children have the lowest poverty rate of 0.0%, which includes 0 families.
| Children | Above Poverty | Below Poverty |
| No Children | 12,809 (96.2%) | 509 (3.8%) |
| 1 or 2 Children | 7,751 (95.1%) | 397 (4.9%) |
| 3 or 4 Children | 1,348 (88.6%) | 174 (11.4%) |
| 5 or more Children | 269 (100.0%) | 0 (0.0%) |
| Total | 22,177 (95.4%) | 1,080 (4.6%) |
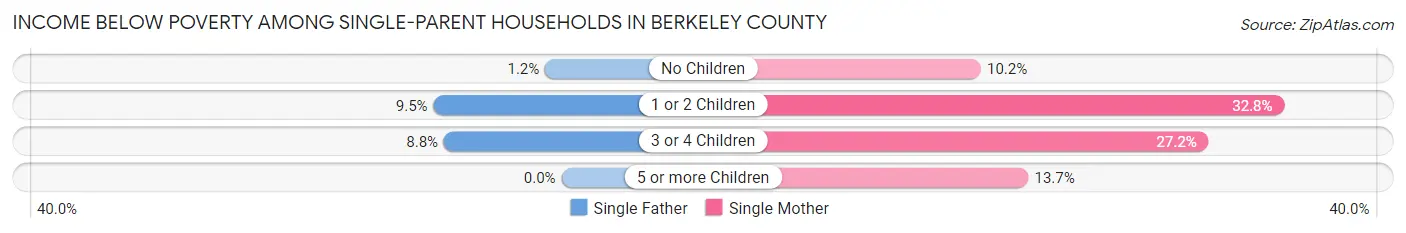
Income Below Poverty Among Single-Parent Households in Berkeley County
According to the poverty data in Berkeley County, 6.1% or 178 single-father households and 25.8% or 1,306 single-mother households are living below the poverty line. Among single-father households, those with 1 or 2 children have the highest poverty rate, with 130 households (9.5%) experiencing poverty. Likewise, among single-mother households, those with 1 or 2 children have the highest poverty rate, with 980 households (32.8%) falling below the poverty line.
| Children | Single Father | Single Mother |
| No Children | 14 (1.2%) | 136 (10.2%) |
| 1 or 2 Children | 130 (9.5%) | 980 (32.8%) |
| 3 or 4 Children | 34 (8.8%) | 180 (27.2%) |
| 5 or more Children | 0 (0.0%) | 10 (13.7%) |
| Total | 178 (6.1%) | 1,306 (25.8%) |
Income Below Poverty Among Married-Couple vs Single-Parent Households in Berkeley County
The poverty data for Berkeley County shows that 1,080 of the married-couple family households (4.6%) and 1,484 of the single-parent households (18.7%) are living below the poverty level. Within the married-couple family households, those with 3 or 4 children have the highest poverty rate, with 174 households (11.4%) falling below the poverty line. Among the single-parent households, those with 1 or 2 children have the highest poverty rate, with 1,110 household (25.5%) living below poverty.
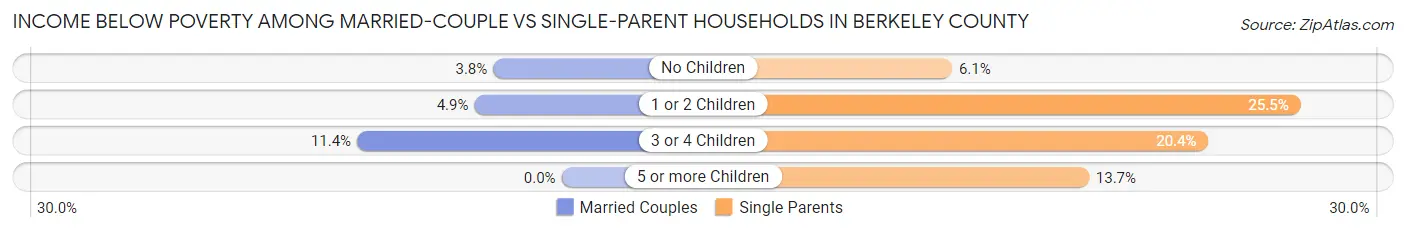
| Children | Married-Couple Families | Single-Parent Households |
| No Children | 509 (3.8%) | 150 (6.0%) |
| 1 or 2 Children | 397 (4.9%) | 1,110 (25.5%) |
| 3 or 4 Children | 174 (11.4%) | 214 (20.4%) |
| 5 or more Children | 0 (0.0%) | 10 (13.7%) |
| Total | 1,080 (4.6%) | 1,484 (18.7%) |
Employment Characteristics in Berkeley County
Employment by Class of Employer in Berkeley County
Among the 61,078 employed individuals in Berkeley County, private company employees (41,410 | 67.8%), local government employees (5,407 | 8.8%), and not-for-profit organizations (4,401 | 7.2%) make up the most common classes of employment.
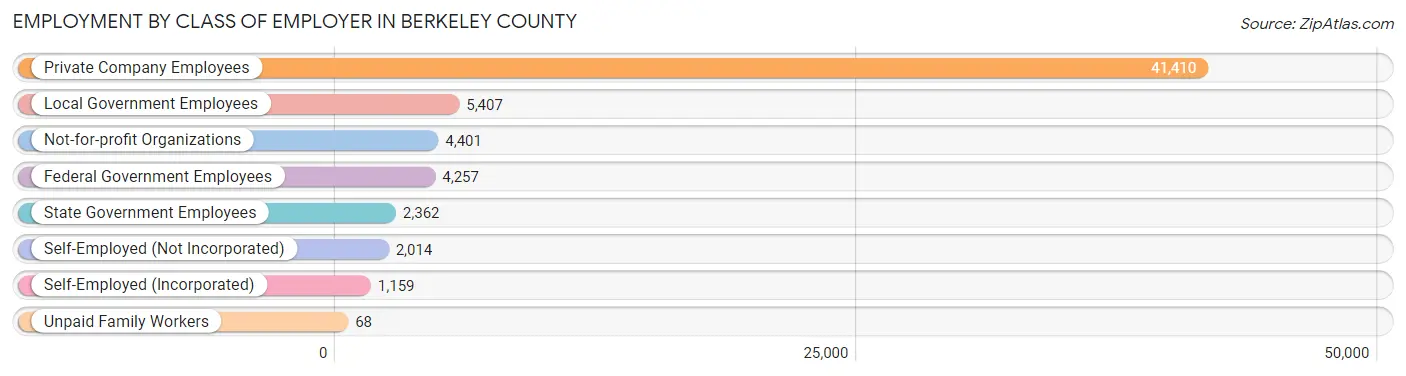
| Employer Class | # Employees | % Employees |
| Private Company Employees | 41,410 | 67.8% |
| Self-Employed (Incorporated) | 1,159 | 1.9% |
| Self-Employed (Not Incorporated) | 2,014 | 3.3% |
| Not-for-profit Organizations | 4,401 | 7.2% |
| Local Government Employees | 5,407 | 8.8% |
| State Government Employees | 2,362 | 3.9% |
| Federal Government Employees | 4,257 | 7.0% |
| Unpaid Family Workers | 68 | 0.1% |
| Total | 61,078 | 100.0% |
Employment Status by Age in Berkeley County
According to the labor force statistics for Berkeley County, out of the total population over 16 years of age (98,259), 66.4% or 65,244 individuals are in the labor force, with 4.6% or 3,001 of them unemployed. The age group with the highest labor force participation rate is 35 to 44 years, with 85.3% or 14,316 individuals in the labor force. Within the labor force, the 16 to 19 years age range has the highest percentage of unemployed individuals, with 17.7% or 523 of them being unemployed.
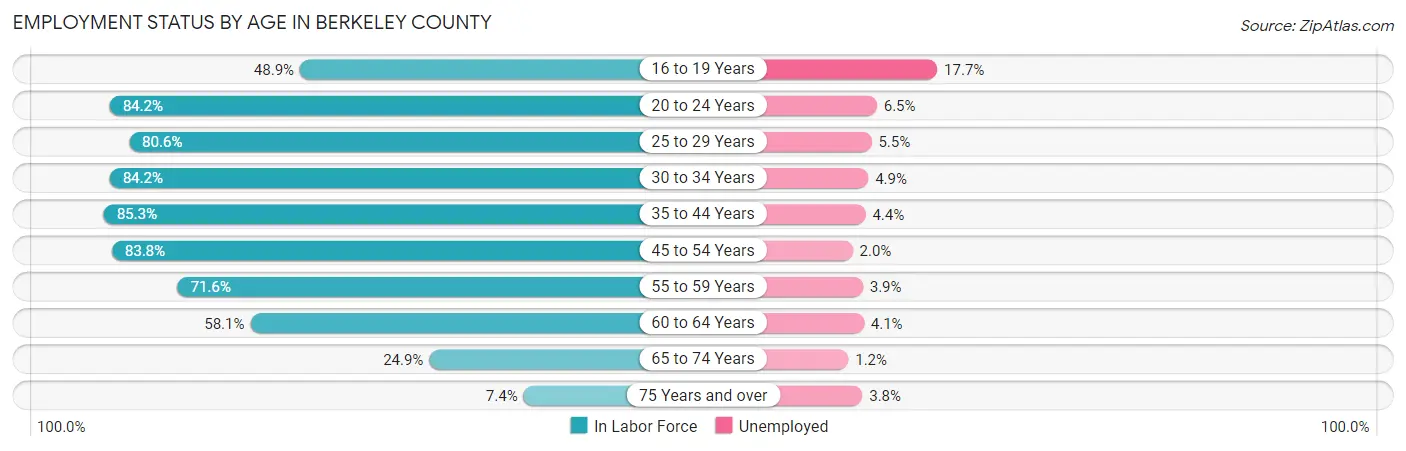
| Age Bracket | In Labor Force | Unemployed |
| 16 to 19 Years | 2,954 (48.9%) | 523 (17.7%) |
| 20 to 24 Years | 5,916 (84.2%) | 385 (6.5%) |
| 25 to 29 Years | 6,776 (80.6%) | 373 (5.5%) |
| 30 to 34 Years | 7,437 (84.2%) | 364 (4.9%) |
| 35 to 44 Years | 14,316 (85.3%) | 630 (4.4%) |
| 45 to 54 Years | 13,773 (83.8%) | 275 (2.0%) |
| 55 to 59 Years | 5,855 (71.6%) | 228 (3.9%) |
| 60 to 64 Years | 4,708 (58.1%) | 193 (4.1%) |
| 65 to 74 Years | 3,000 (24.9%) | 36 (1.2%) |
| 75 Years and over | 474 (7.4%) | 18 (3.8%) |
| Total | 65,244 (66.4%) | 3,001 (4.6%) |
Employment Status by Educational Attainment in Berkeley County
According to labor force statistics for Berkeley County, 79.2% of individuals (52,858) out of the total population between 25 and 64 years of age (66,740) are in the labor force, with 3.9% or 2,061 of them being unemployed. The group with the highest labor force participation rate are those with the educational attainment of college / associate degree, with 83.5% or 17,836 individuals in the labor force. Within the labor force, individuals with less than high school education have the highest percentage of unemployment, with 8.0% or 281 of them being unemployed.
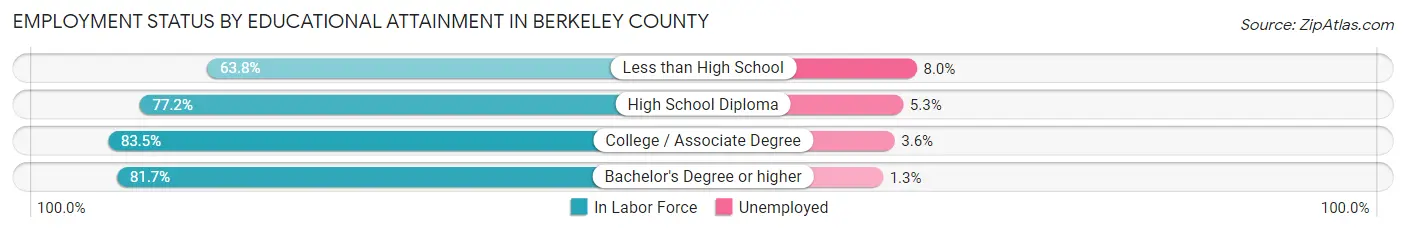
| Educational Attainment | In Labor Force | Unemployed |
| Less than High School | 3,516 (63.8%) | 441 (8.0%) |
| High School Diploma | 18,122 (77.2%) | 1,244 (5.3%) |
| College / Associate Degree | 17,836 (83.5%) | 769 (3.6%) |
| Bachelor's Degree or higher | 13,395 (81.7%) | 213 (1.3%) |
| Total | 52,858 (79.2%) | 2,603 (3.9%) |
Employment Occupations by Sex in Berkeley County
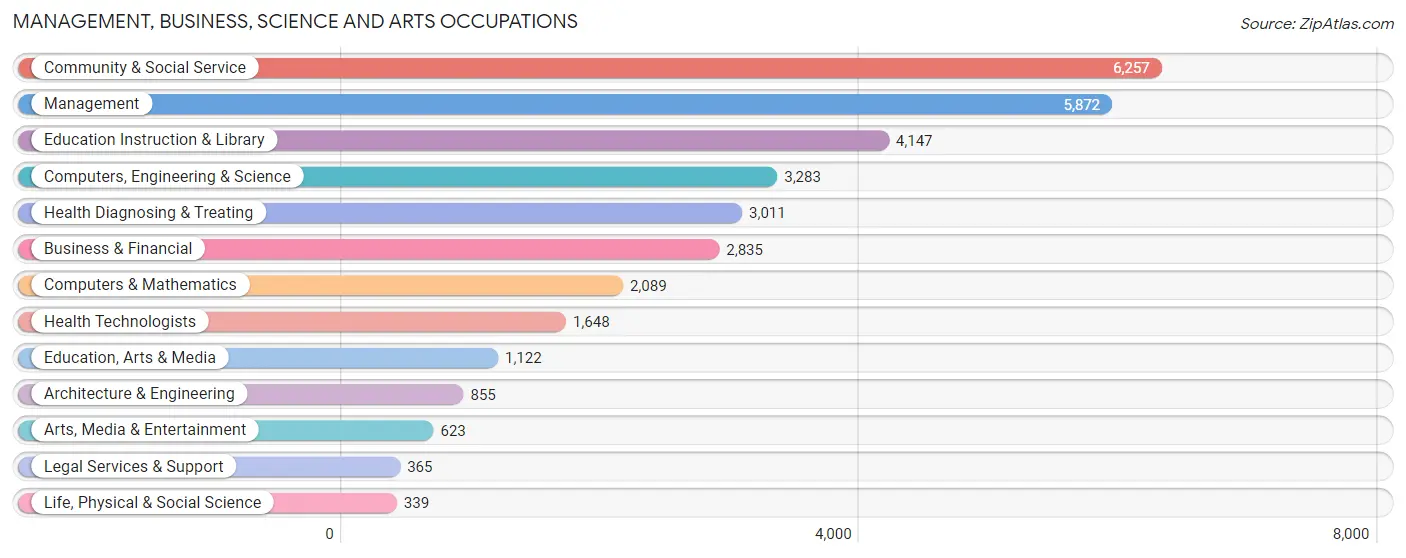
Management, Business, Science and Arts Occupations
The most common Management, Business, Science and Arts occupations in Berkeley County are Community & Social Service (6,257 | 10.1%), Management (5,872 | 9.5%), Education Instruction & Library (4,147 | 6.7%), Computers, Engineering & Science (3,283 | 5.3%), and Health Diagnosing & Treating (3,011 | 4.9%).
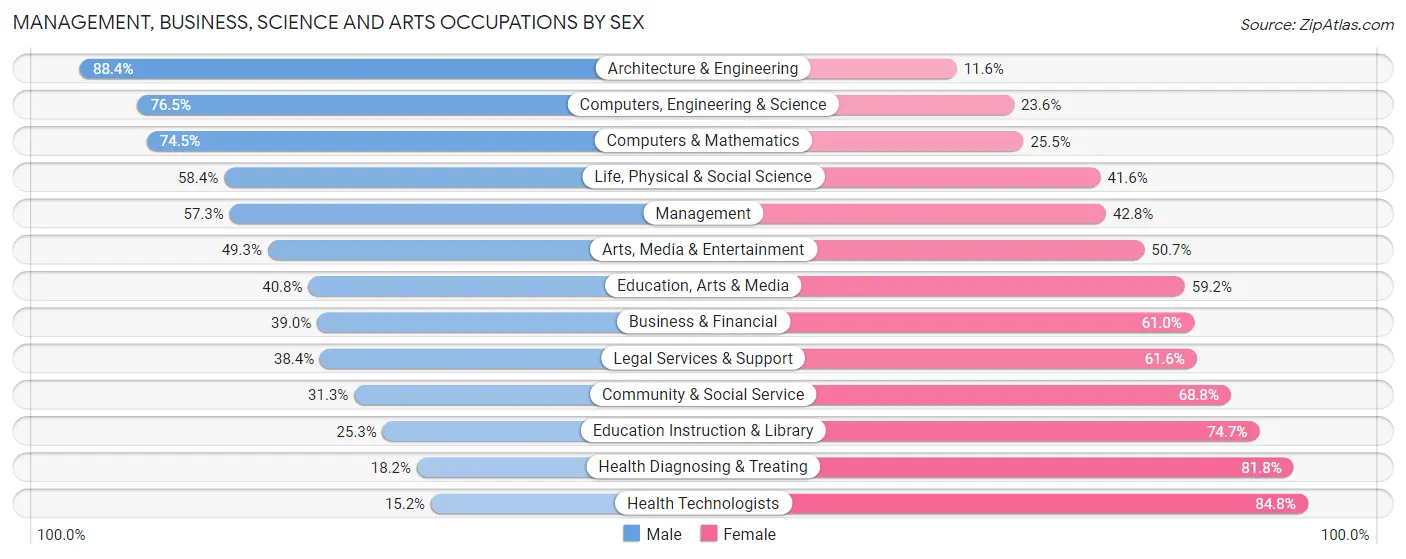
Management, Business, Science and Arts Occupations by Sex
Within the Management, Business, Science and Arts occupations in Berkeley County, the most male-oriented occupations are Architecture & Engineering (88.4%), Computers, Engineering & Science (76.4%), and Computers & Mathematics (74.5%), while the most female-oriented occupations are Health Technologists (84.8%), Health Diagnosing & Treating (81.8%), and Education Instruction & Library (74.7%).
| Occupation | Male | Female |
| Management | 3,362 (57.3%) | 2,510 (42.7%) |
| Business & Financial | 1,105 (39.0%) | 1,730 (61.0%) |
| Computers, Engineering & Science | 2,510 (76.4%) | 773 (23.5%) |
| Computers & Mathematics | 1,556 (74.5%) | 533 (25.5%) |
| Architecture & Engineering | 756 (88.4%) | 99 (11.6%) |
| Life, Physical & Social Science | 198 (58.4%) | 141 (41.6%) |
| Community & Social Service | 1,955 (31.2%) | 4,302 (68.8%) |
| Education, Arts & Media | 458 (40.8%) | 664 (59.2%) |
| Legal Services & Support | 140 (38.4%) | 225 (61.6%) |
| Education Instruction & Library | 1,050 (25.3%) | 3,097 (74.7%) |
| Arts, Media & Entertainment | 307 (49.3%) | 316 (50.7%) |
| Health Diagnosing & Treating | 547 (18.2%) | 2,464 (81.8%) |
| Health Technologists | 251 (15.2%) | 1,397 (84.8%) |
| Total (Category) | 9,479 (44.6%) | 11,779 (55.4%) |
| Total (Overall) | 33,197 (53.6%) | 28,731 (46.4%) |
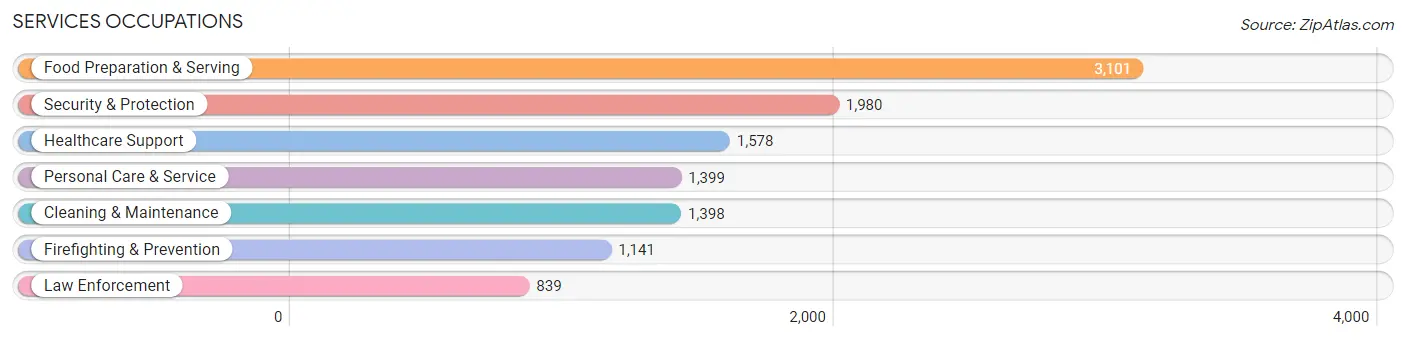
Services Occupations
The most common Services occupations in Berkeley County are Food Preparation & Serving (3,101 | 5.0%), Security & Protection (1,980 | 3.2%), Healthcare Support (1,578 | 2.5%), Personal Care & Service (1,399 | 2.3%), and Cleaning & Maintenance (1,398 | 2.3%).
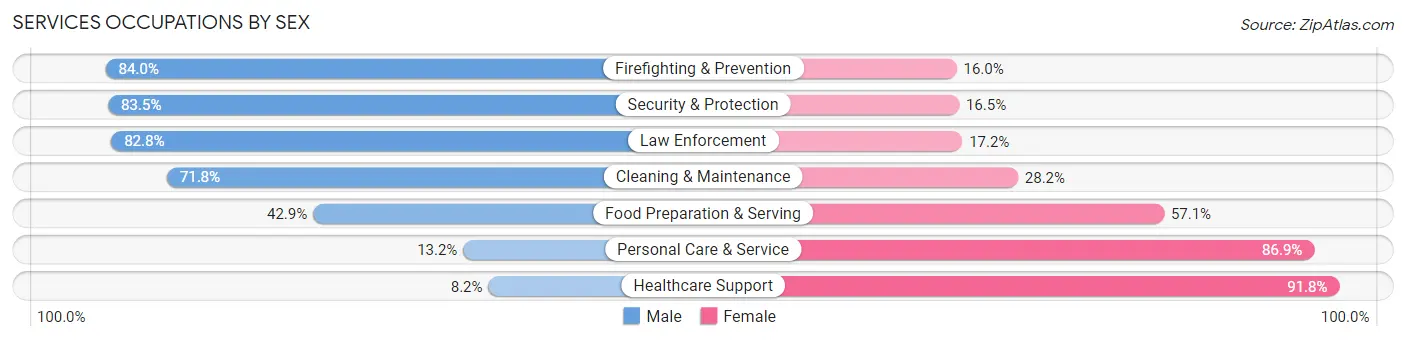
Services Occupations by Sex
Within the Services occupations in Berkeley County, the most male-oriented occupations are Firefighting & Prevention (84.0%), Security & Protection (83.5%), and Law Enforcement (82.8%), while the most female-oriented occupations are Healthcare Support (91.8%), Personal Care & Service (86.9%), and Food Preparation & Serving (57.1%).
| Occupation | Male | Female |
| Healthcare Support | 129 (8.2%) | 1,449 (91.8%) |
| Security & Protection | 1,653 (83.5%) | 327 (16.5%) |
| Firefighting & Prevention | 958 (84.0%) | 183 (16.0%) |
| Law Enforcement | 695 (82.8%) | 144 (17.2%) |
| Food Preparation & Serving | 1,330 (42.9%) | 1,771 (57.1%) |
| Cleaning & Maintenance | 1,004 (71.8%) | 394 (28.2%) |
| Personal Care & Service | 184 (13.2%) | 1,215 (86.9%) |
| Total (Category) | 4,300 (45.5%) | 5,156 (54.5%) |
| Total (Overall) | 33,197 (53.6%) | 28,731 (46.4%) |
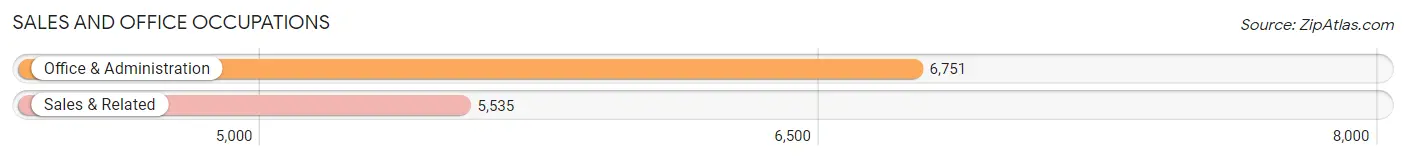
Sales and Office Occupations
The most common Sales and Office occupations in Berkeley County are Office & Administration (6,751 | 10.9%), and Sales & Related (5,535 | 8.9%).
Sales and Office Occupations by Sex
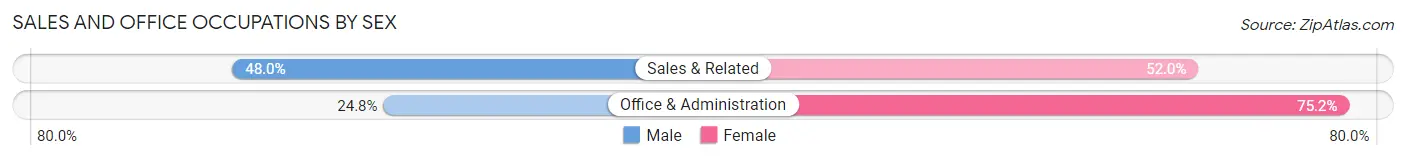
| Occupation | Male | Female |
| Sales & Related | 2,659 (48.0%) | 2,876 (52.0%) |
| Office & Administration | 1,675 (24.8%) | 5,076 (75.2%) |
| Total (Category) | 4,334 (35.3%) | 7,952 (64.7%) |
| Total (Overall) | 33,197 (53.6%) | 28,731 (46.4%) |
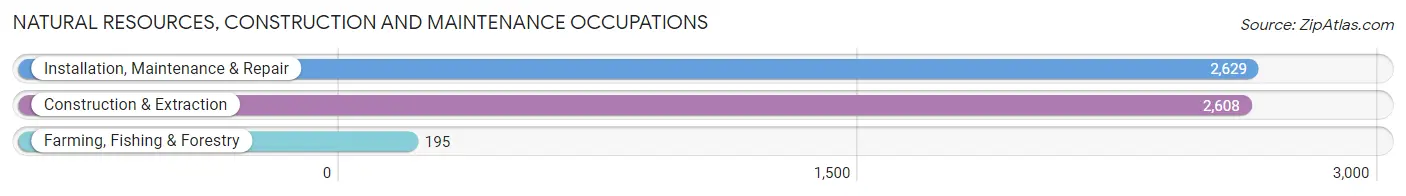
Natural Resources, Construction and Maintenance Occupations
The most common Natural Resources, Construction and Maintenance occupations in Berkeley County are Installation, Maintenance & Repair (2,629 | 4.3%), Construction & Extraction (2,608 | 4.2%), and Farming, Fishing & Forestry (195 | 0.3%).
Natural Resources, Construction and Maintenance Occupations by Sex
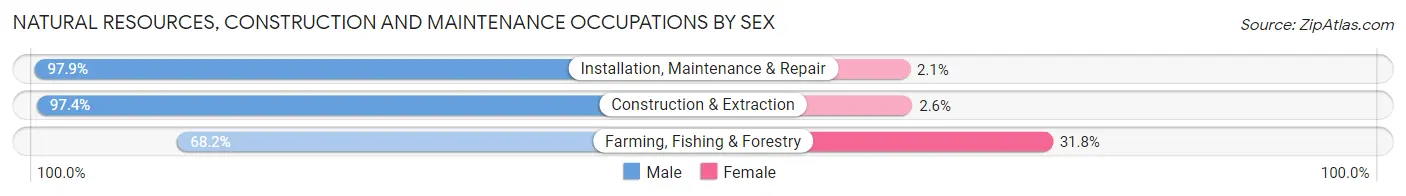
| Occupation | Male | Female |
| Farming, Fishing & Forestry | 133 (68.2%) | 62 (31.8%) |
| Construction & Extraction | 2,541 (97.4%) | 67 (2.6%) |
| Installation, Maintenance & Repair | 2,574 (97.9%) | 55 (2.1%) |
| Total (Category) | 5,248 (96.6%) | 184 (3.4%) |
| Total (Overall) | 33,197 (53.6%) | 28,731 (46.4%) |
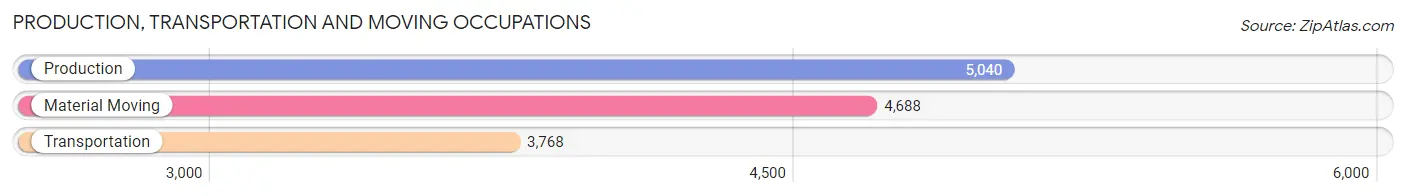
Production, Transportation and Moving Occupations
The most common Production, Transportation and Moving occupations in Berkeley County are Production (5,040 | 8.1%), Material Moving (4,688 | 7.6%), and Transportation (3,768 | 6.1%).
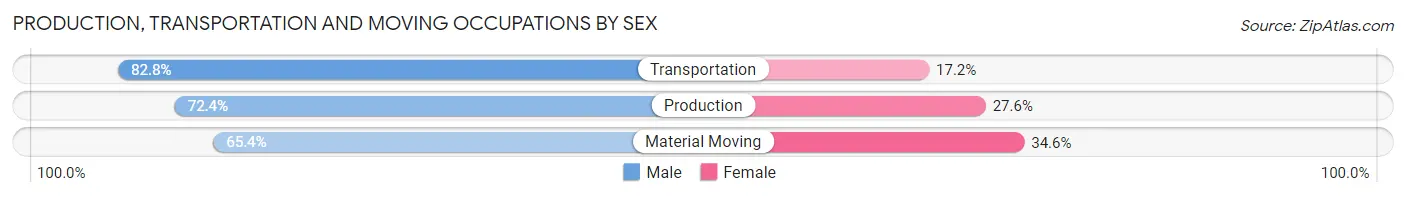
Production, Transportation and Moving Occupations by Sex
| Occupation | Male | Female |
| Production | 3,651 (72.4%) | 1,389 (27.6%) |
| Transportation | 3,121 (82.8%) | 647 (17.2%) |
| Material Moving | 3,064 (65.4%) | 1,624 (34.6%) |
| Total (Category) | 9,836 (72.9%) | 3,660 (27.1%) |
| Total (Overall) | 33,197 (53.6%) | 28,731 (46.4%) |
Employment Industries by Sex in Berkeley County
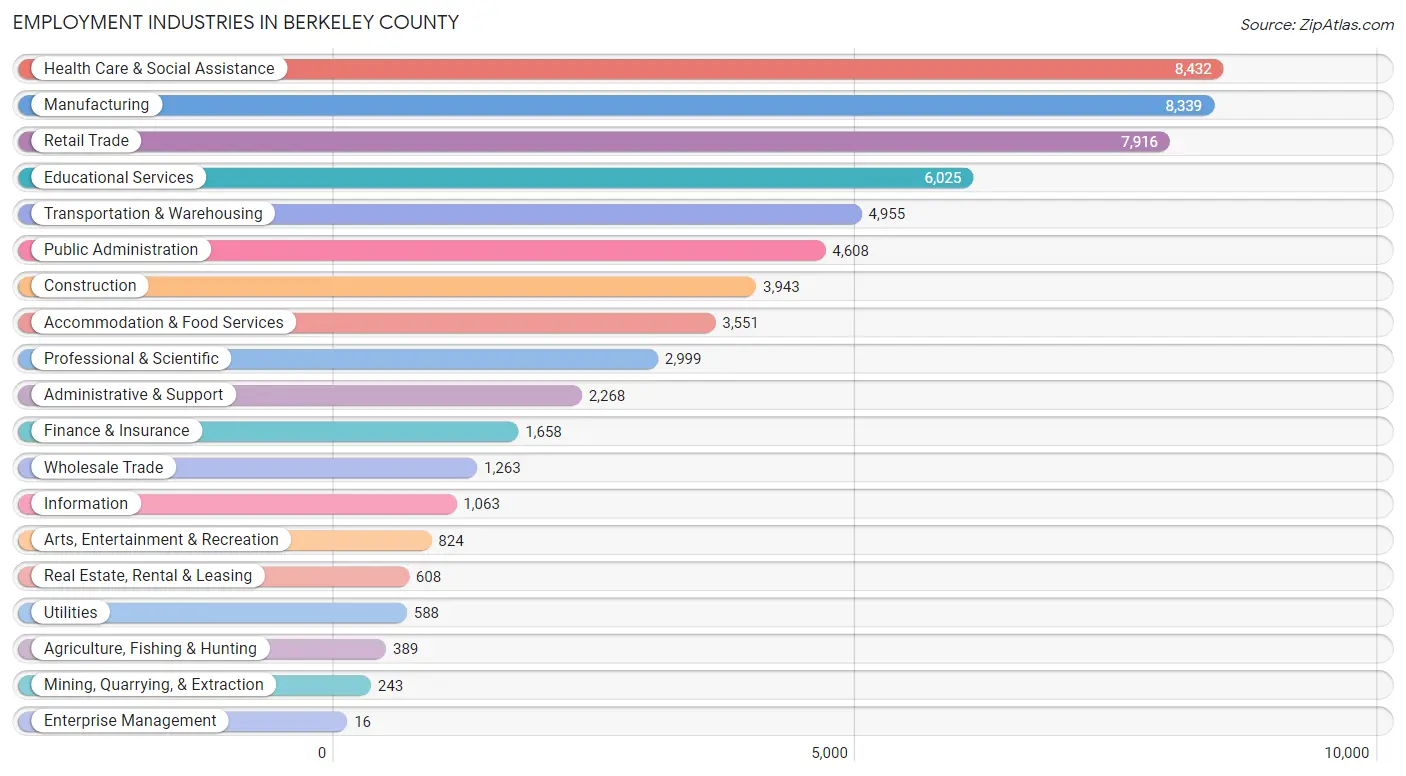
Employment Industries in Berkeley County
The major employment industries in Berkeley County include Health Care & Social Assistance (8,432 | 13.6%), Manufacturing (8,339 | 13.5%), Retail Trade (7,916 | 12.8%), Educational Services (6,025 | 9.7%), and Transportation & Warehousing (4,955 | 8.0%).
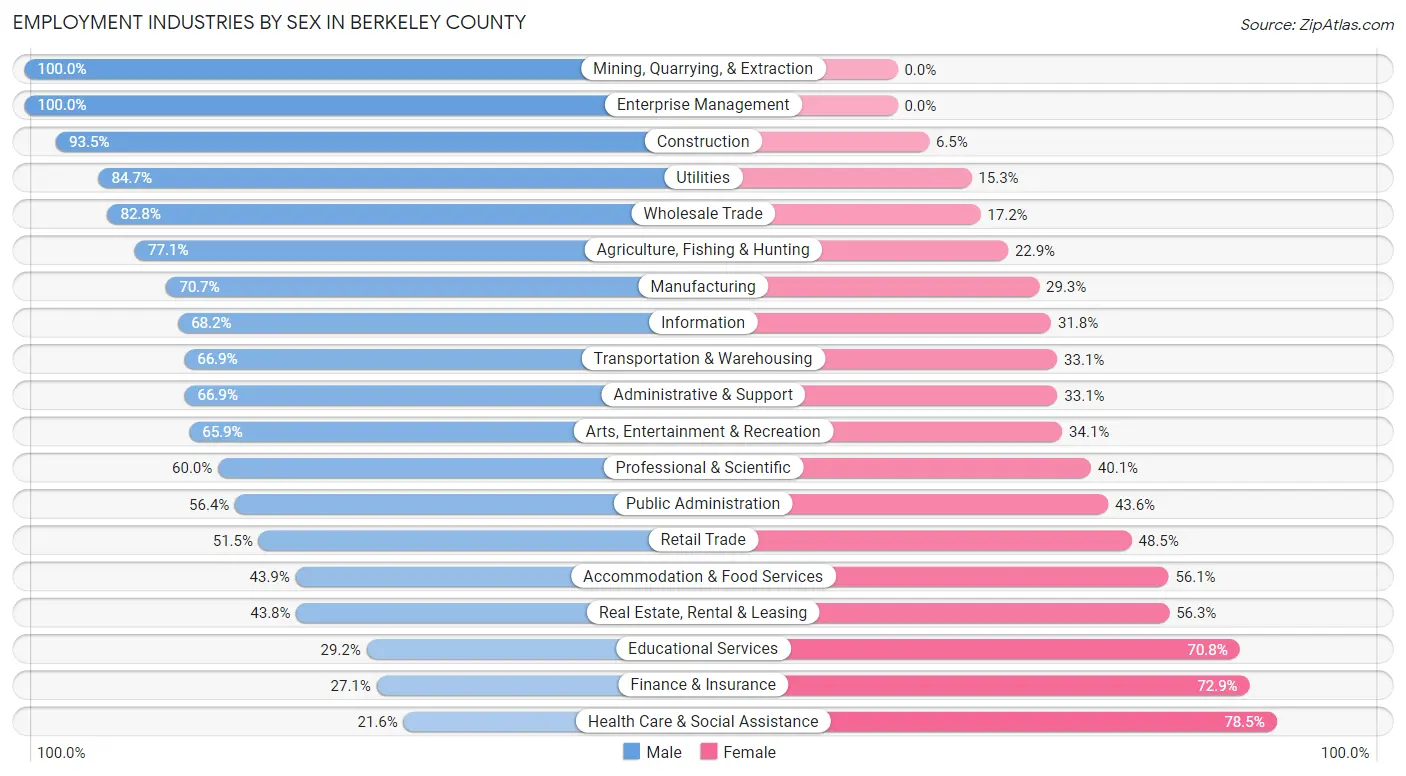
Employment Industries by Sex in Berkeley County
The Berkeley County industries that see more men than women are Mining, Quarrying, & Extraction (100.0%), Enterprise Management (100.0%), and Construction (93.5%), whereas the industries that tend to have a higher number of women are Health Care & Social Assistance (78.4%), Finance & Insurance (72.9%), and Educational Services (70.8%).
| Industry | Male | Female |
| Agriculture, Fishing & Hunting | 300 (77.1%) | 89 (22.9%) |
| Mining, Quarrying, & Extraction | 243 (100.0%) | 0 (0.0%) |
| Construction | 3,685 (93.5%) | 258 (6.5%) |
| Manufacturing | 5,893 (70.7%) | 2,446 (29.3%) |
| Wholesale Trade | 1,046 (82.8%) | 217 (17.2%) |
| Retail Trade | 4,079 (51.5%) | 3,837 (48.5%) |
| Transportation & Warehousing | 3,317 (66.9%) | 1,638 (33.1%) |
| Utilities | 498 (84.7%) | 90 (15.3%) |
| Information | 725 (68.2%) | 338 (31.8%) |
| Finance & Insurance | 450 (27.1%) | 1,208 (72.9%) |
| Real Estate, Rental & Leasing | 266 (43.8%) | 342 (56.2%) |
| Professional & Scientific | 1,798 (60.0%) | 1,201 (40.1%) |
| Enterprise Management | 16 (100.0%) | 0 (0.0%) |
| Administrative & Support | 1,517 (66.9%) | 751 (33.1%) |
| Educational Services | 1,759 (29.2%) | 4,266 (70.8%) |
| Health Care & Social Assistance | 1,817 (21.5%) | 6,615 (78.4%) |
| Arts, Entertainment & Recreation | 543 (65.9%) | 281 (34.1%) |
| Accommodation & Food Services | 1,559 (43.9%) | 1,992 (56.1%) |
| Public Administration | 2,600 (56.4%) | 2,008 (43.6%) |
| Total | 33,197 (53.6%) | 28,731 (46.4%) |
Education in Berkeley County
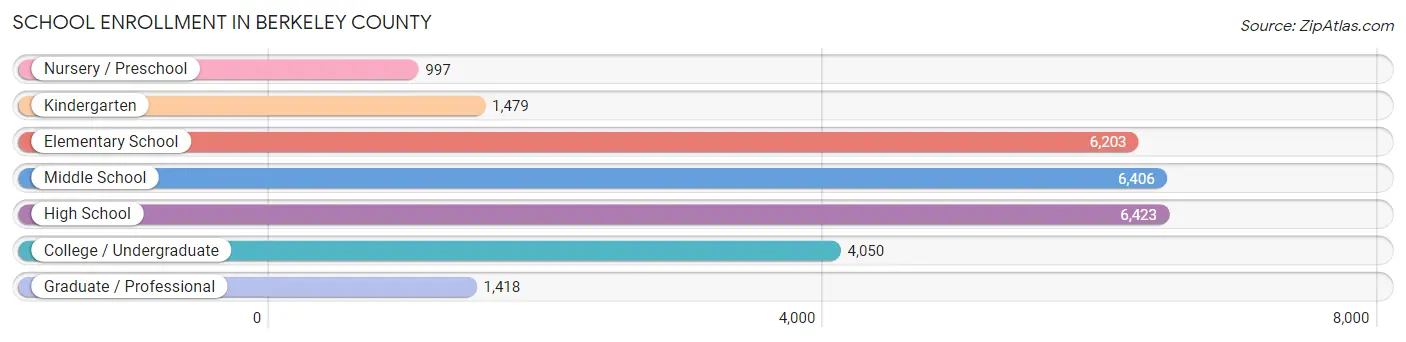
School Enrollment in Berkeley County
The most common levels of schooling among the 26,976 students in Berkeley County are high school (6,423 | 23.8%), middle school (6,406 | 23.7%), and elementary school (6,203 | 23.0%).
| School Level | # Students | % Students |
| Nursery / Preschool | 997 | 3.7% |
| Kindergarten | 1,479 | 5.5% |
| Elementary School | 6,203 | 23.0% |
| Middle School | 6,406 | 23.7% |
| High School | 6,423 | 23.8% |
| College / Undergraduate | 4,050 | 15.0% |
| Graduate / Professional | 1,418 | 5.3% |
| Total | 26,976 | 100.0% |
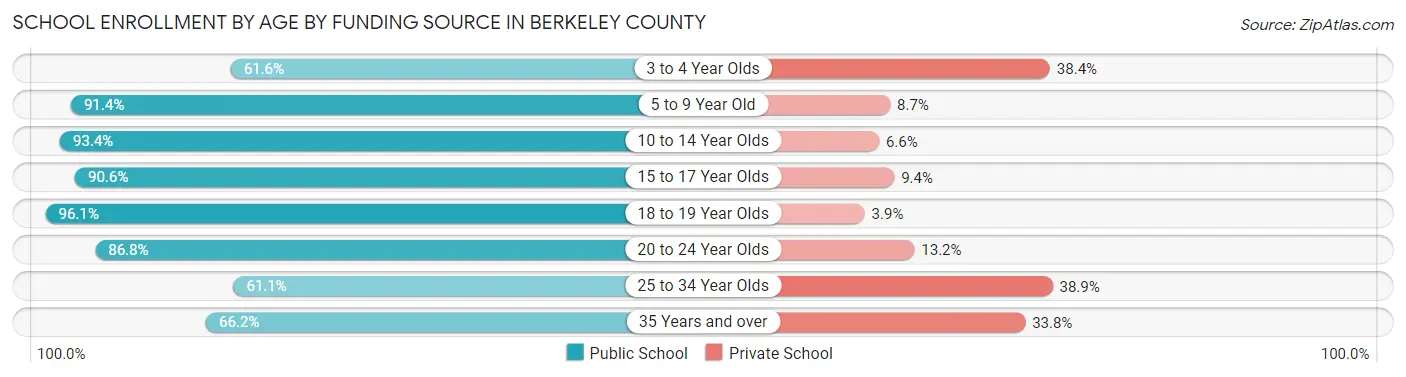
School Enrollment by Age by Funding Source in Berkeley County
Out of a total of 26,976 students who are enrolled in schools in Berkeley County, 3,291 (12.2%) attend a private institution, while the remaining 23,685 (87.8%) are enrolled in public schools. The age group of 25 to 34 year olds has the highest likelihood of being enrolled in private schools, with 586 (38.9% in the age bracket) enrolled. Conversely, the age group of 18 to 19 year olds has the lowest likelihood of being enrolled in a private school, with 1,377 (96.1% in the age bracket) attending a public institution.
| Age Bracket | Public School | Private School |
| 3 to 4 Year Olds | 348 (61.6%) | 217 (38.4%) |
| 5 to 9 Year Old | 6,316 (91.3%) | 598 (8.6%) |
| 10 to 14 Year Olds | 7,878 (93.4%) | 555 (6.6%) |
| 15 to 17 Year Olds | 4,256 (90.6%) | 442 (9.4%) |
| 18 to 19 Year Olds | 1,377 (96.1%) | 56 (3.9%) |
| 20 to 24 Year Olds | 1,332 (86.8%) | 202 (13.2%) |
| 25 to 34 Year Olds | 920 (61.1%) | 586 (38.9%) |
| 35 Years and over | 1,253 (66.2%) | 640 (33.8%) |
| Total | 23,685 (87.8%) | 3,291 (12.2%) |
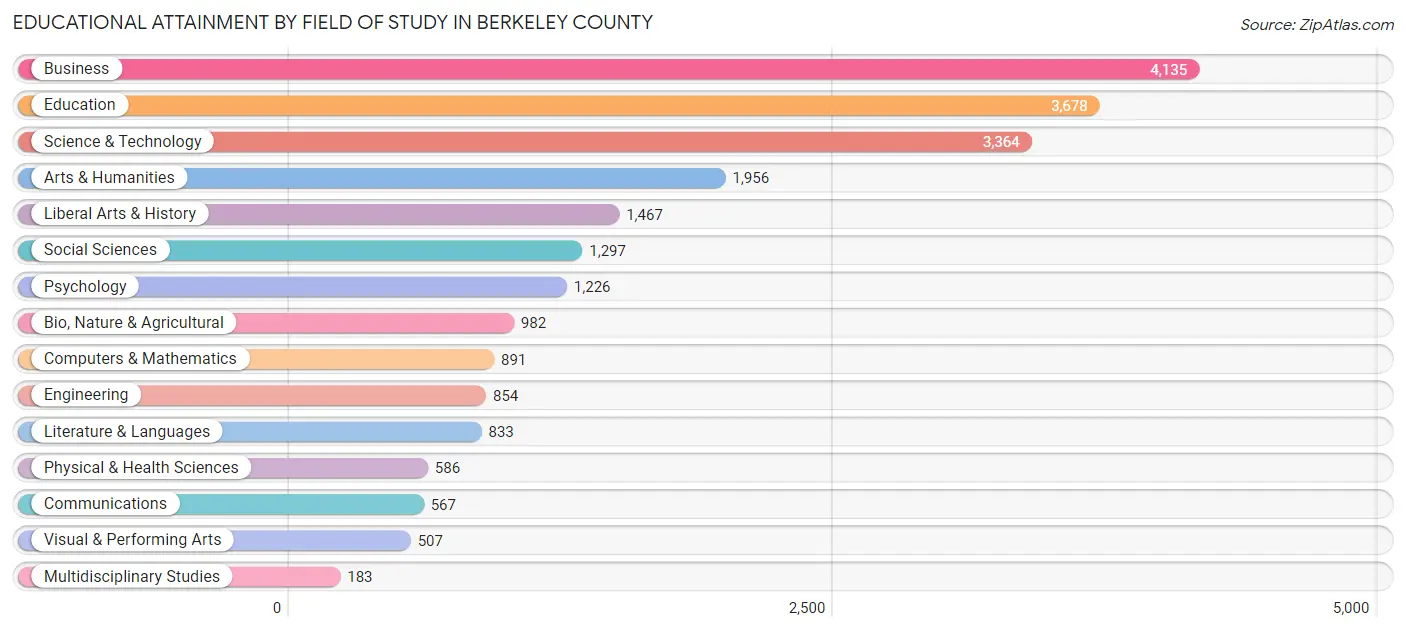
Educational Attainment by Field of Study in Berkeley County
Business (4,135 | 18.4%), education (3,678 | 16.3%), science & technology (3,364 | 14.9%), arts & humanities (1,956 | 8.7%), and liberal arts & history (1,467 | 6.5%) are the most common fields of study among 22,526 individuals in Berkeley County who have obtained a bachelor's degree or higher.
| Field of Study | # Graduates | % Graduates |
| Computers & Mathematics | 891 | 4.0% |
| Bio, Nature & Agricultural | 982 | 4.4% |
| Physical & Health Sciences | 586 | 2.6% |
| Psychology | 1,226 | 5.4% |
| Social Sciences | 1,297 | 5.8% |
| Engineering | 854 | 3.8% |
| Multidisciplinary Studies | 183 | 0.8% |
| Science & Technology | 3,364 | 14.9% |
| Business | 4,135 | 18.4% |
| Education | 3,678 | 16.3% |
| Literature & Languages | 833 | 3.7% |
| Liberal Arts & History | 1,467 | 6.5% |
| Visual & Performing Arts | 507 | 2.2% |
| Communications | 567 | 2.5% |
| Arts & Humanities | 1,956 | 8.7% |
| Total | 22,526 | 100.0% |
Transportation & Commute in Berkeley County
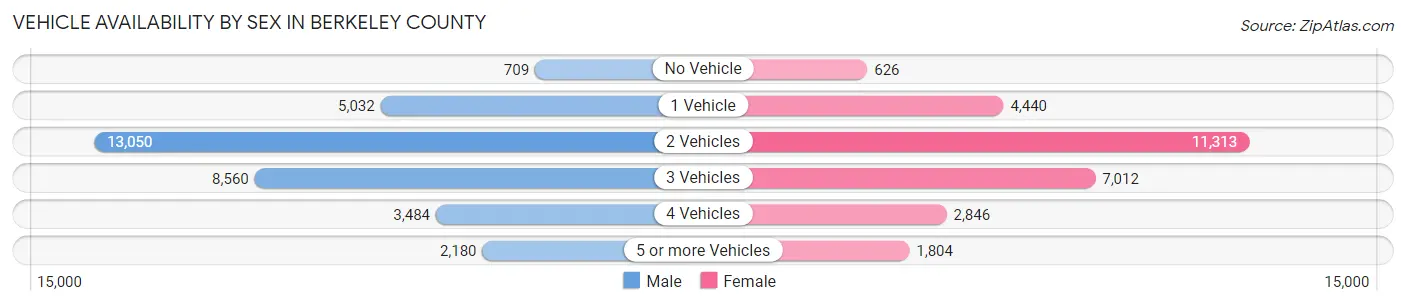
Vehicle Availability by Sex in Berkeley County
The most prevalent vehicle ownership categories in Berkeley County are males with 2 vehicles (13,050, accounting for 39.5%) and females with 2 vehicles (11,313, making up 46.5%).
| Vehicles Available | Male | Female |
| No Vehicle | 709 (2.1%) | 626 (2.2%) |
| 1 Vehicle | 5,032 (15.2%) | 4,440 (15.8%) |
| 2 Vehicles | 13,050 (39.5%) | 11,313 (40.3%) |
| 3 Vehicles | 8,560 (25.9%) | 7,012 (25.0%) |
| 4 Vehicles | 3,484 (10.5%) | 2,846 (10.2%) |
| 5 or more Vehicles | 2,180 (6.6%) | 1,804 (6.4%) |
| Total | 33,015 (100.0%) | 28,041 (100.0%) |
Commute Time in Berkeley County
The most frequently occuring commute durations in Berkeley County are 20 to 24 minutes (9,510 commuters, 17.0%), 15 to 19 minutes (9,222 commuters, 16.4%), and 30 to 34 minutes (7,511 commuters, 13.4%).
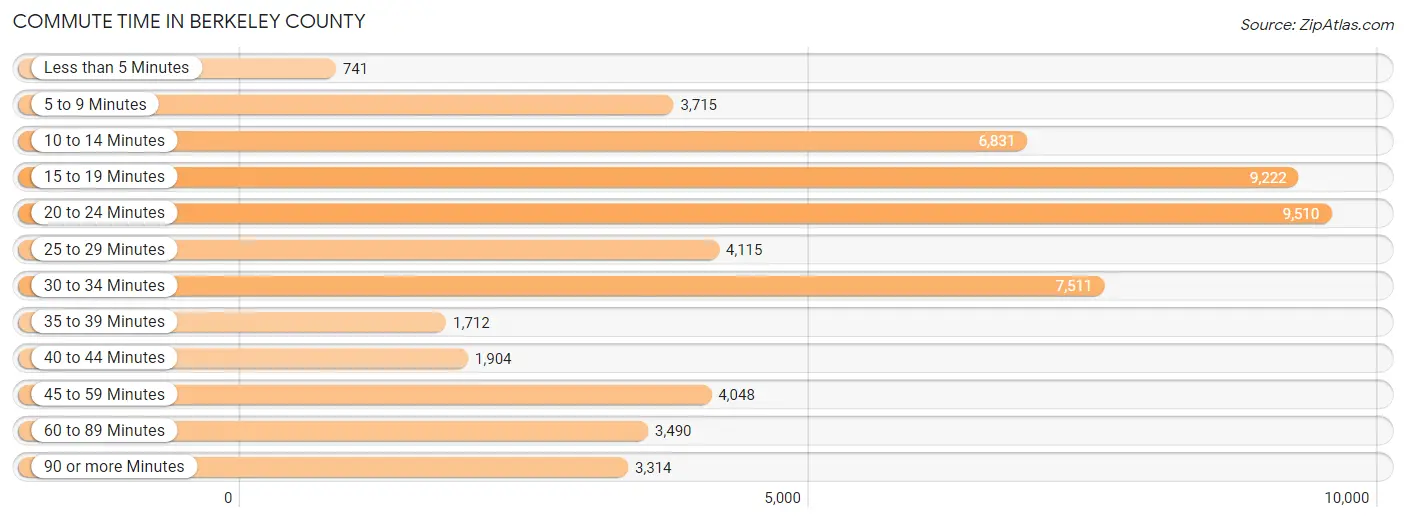
| Commute Time | # Commuters | % Commuters |
| Less than 5 Minutes | 741 | 1.3% |
| 5 to 9 Minutes | 3,715 | 6.6% |
| 10 to 14 Minutes | 6,831 | 12.2% |
| 15 to 19 Minutes | 9,222 | 16.4% |
| 20 to 24 Minutes | 9,510 | 17.0% |
| 25 to 29 Minutes | 4,115 | 7.3% |
| 30 to 34 Minutes | 7,511 | 13.4% |
| 35 to 39 Minutes | 1,712 | 3.0% |
| 40 to 44 Minutes | 1,904 | 3.4% |
| 45 to 59 Minutes | 4,048 | 7.2% |
| 60 to 89 Minutes | 3,490 | 6.2% |
| 90 or more Minutes | 3,314 | 5.9% |
Commute Time by Sex in Berkeley County
The most common commute times in Berkeley County are 20 to 24 minutes (5,565 commuters, 17.8%) for males and 15 to 19 minutes (4,738 commuters, 19.0%) for females.
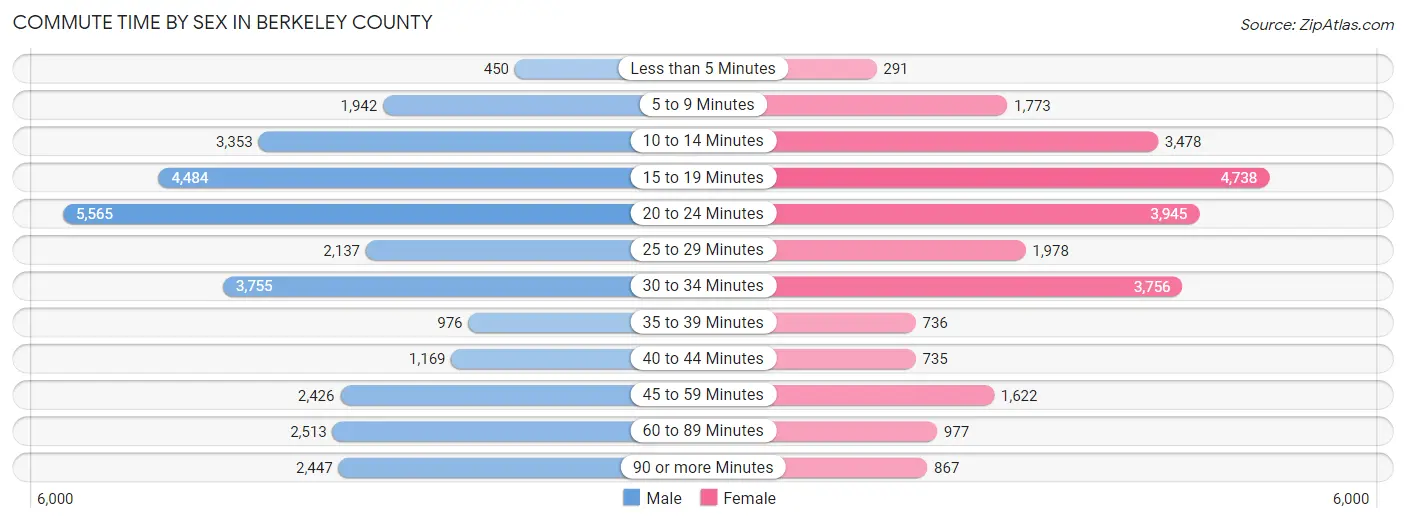
| Commute Time | Male | Female |
| Less than 5 Minutes | 450 (1.4%) | 291 (1.2%) |
| 5 to 9 Minutes | 1,942 (6.2%) | 1,773 (7.1%) |
| 10 to 14 Minutes | 3,353 (10.7%) | 3,478 (14.0%) |
| 15 to 19 Minutes | 4,484 (14.4%) | 4,738 (19.0%) |
| 20 to 24 Minutes | 5,565 (17.8%) | 3,945 (15.9%) |
| 25 to 29 Minutes | 2,137 (6.9%) | 1,978 (8.0%) |
| 30 to 34 Minutes | 3,755 (12.0%) | 3,756 (15.1%) |
| 35 to 39 Minutes | 976 (3.1%) | 736 (3.0%) |
| 40 to 44 Minutes | 1,169 (3.7%) | 735 (2.9%) |
| 45 to 59 Minutes | 2,426 (7.8%) | 1,622 (6.5%) |
| 60 to 89 Minutes | 2,513 (8.1%) | 977 (3.9%) |
| 90 or more Minutes | 2,447 (7.8%) | 867 (3.5%) |
Time of Departure to Work by Sex in Berkeley County
The most frequent times of departure to work in Berkeley County are 6:00 AM to 6:29 AM (4,193, 13.4%) for males and 7:00 AM to 7:29 AM (3,670, 14.7%) for females.
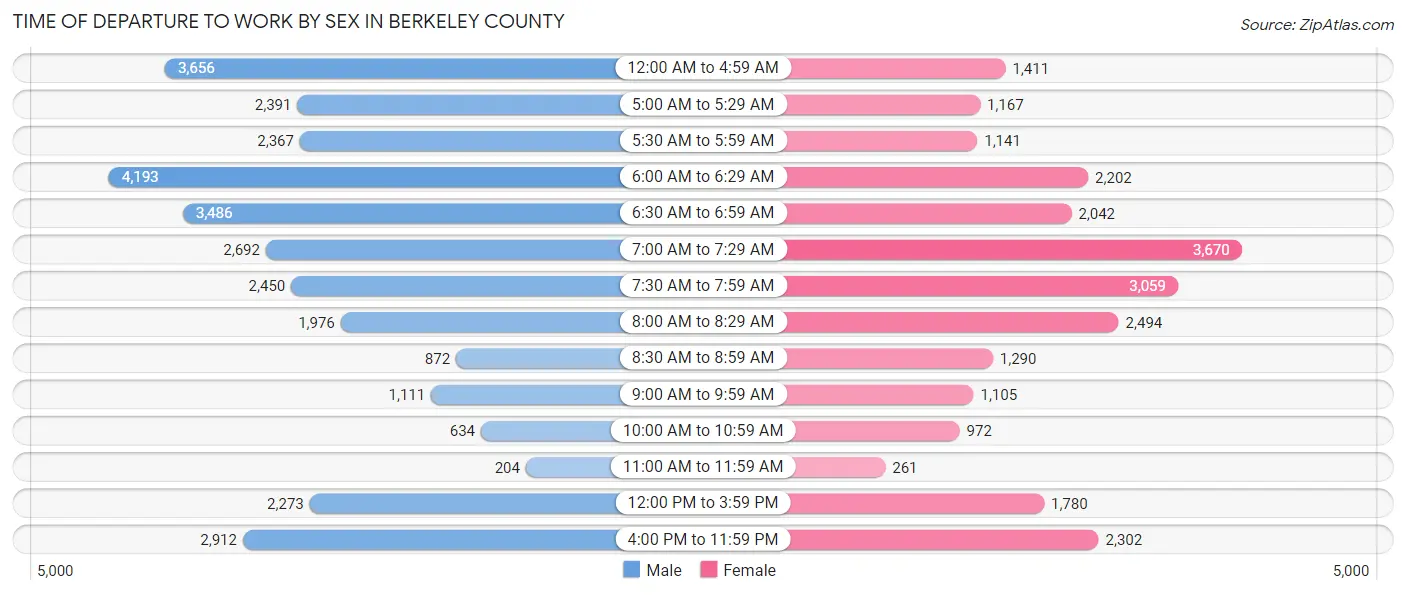
| Time of Departure | Male | Female |
| 12:00 AM to 4:59 AM | 3,656 (11.7%) | 1,411 (5.7%) |
| 5:00 AM to 5:29 AM | 2,391 (7.7%) | 1,167 (4.7%) |
| 5:30 AM to 5:59 AM | 2,367 (7.6%) | 1,141 (4.6%) |
| 6:00 AM to 6:29 AM | 4,193 (13.4%) | 2,202 (8.8%) |
| 6:30 AM to 6:59 AM | 3,486 (11.2%) | 2,042 (8.2%) |
| 7:00 AM to 7:29 AM | 2,692 (8.6%) | 3,670 (14.7%) |
| 7:30 AM to 7:59 AM | 2,450 (7.9%) | 3,059 (12.3%) |
| 8:00 AM to 8:29 AM | 1,976 (6.3%) | 2,494 (10.0%) |
| 8:30 AM to 8:59 AM | 872 (2.8%) | 1,290 (5.2%) |
| 9:00 AM to 9:59 AM | 1,111 (3.6%) | 1,105 (4.4%) |
| 10:00 AM to 10:59 AM | 634 (2.0%) | 972 (3.9%) |
| 11:00 AM to 11:59 AM | 204 (0.6%) | 261 (1.1%) |
| 12:00 PM to 3:59 PM | 2,273 (7.3%) | 1,780 (7.1%) |
| 4:00 PM to 11:59 PM | 2,912 (9.3%) | 2,302 (9.2%) |
| Total | 31,217 (100.0%) | 24,896 (100.0%) |
Housing Occupancy in Berkeley County
Occupancy by Ownership in Berkeley County
Of the total 48,528 dwellings in Berkeley County, owner-occupied units account for 36,589 (75.4%), while renter-occupied units make up 11,939 (24.6%).
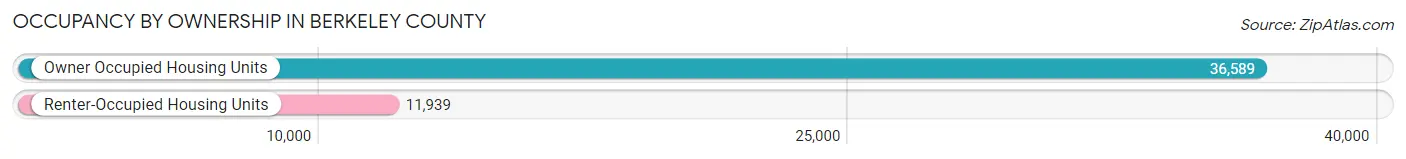
| Occupancy | # Housing Units | % Housing Units |
| Owner Occupied Housing Units | 36,589 | 75.4% |
| Renter-Occupied Housing Units | 11,939 | 24.6% |
| Total Occupied Housing Units | 48,528 | 100.0% |
Occupancy by Household Size in Berkeley County
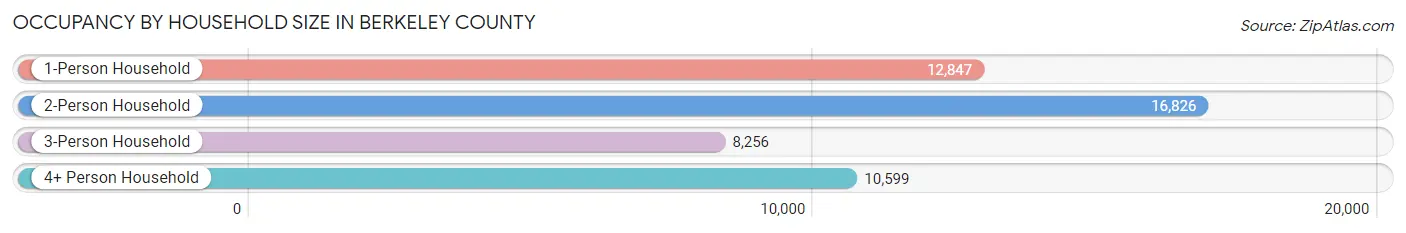
| Household Size | # Housing Units | % Housing Units |
| 1-Person Household | 12,847 | 26.5% |
| 2-Person Household | 16,826 | 34.7% |
| 3-Person Household | 8,256 | 17.0% |
| 4+ Person Household | 10,599 | 21.8% |
| Total Housing Units | 48,528 | 100.0% |
Occupancy by Ownership by Household Size in Berkeley County
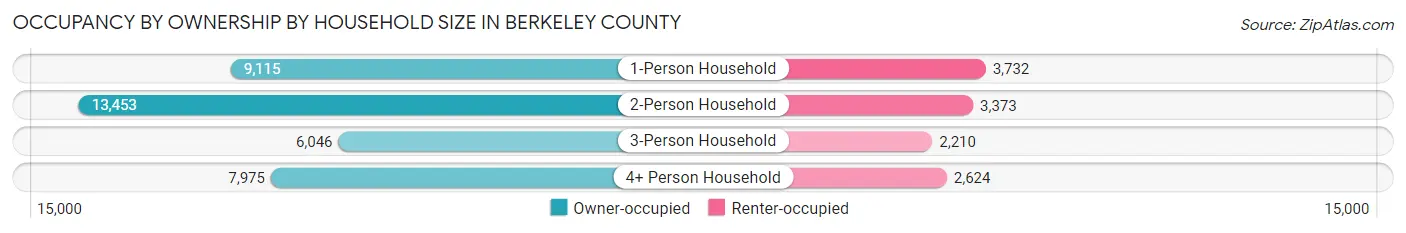
| Household Size | Owner-occupied | Renter-occupied |
| 1-Person Household | 9,115 (71.0%) | 3,732 (29.0%) |
| 2-Person Household | 13,453 (79.9%) | 3,373 (20.1%) |
| 3-Person Household | 6,046 (73.2%) | 2,210 (26.8%) |
| 4+ Person Household | 7,975 (75.2%) | 2,624 (24.8%) |
| Total Housing Units | 36,589 (75.4%) | 11,939 (24.6%) |
Occupancy by Educational Attainment in Berkeley County
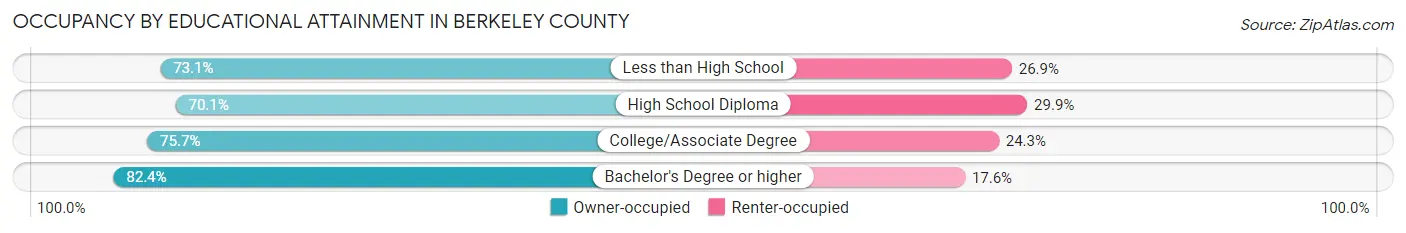
| Household Size | Owner-occupied | Renter-occupied |
| Less than High School | 2,528 (73.1%) | 930 (26.9%) |
| High School Diploma | 11,316 (70.1%) | 4,833 (29.9%) |
| College/Associate Degree | 12,246 (75.7%) | 3,934 (24.3%) |
| Bachelor's Degree or higher | 10,499 (82.4%) | 2,242 (17.6%) |
Occupancy by Age of Householder in Berkeley County
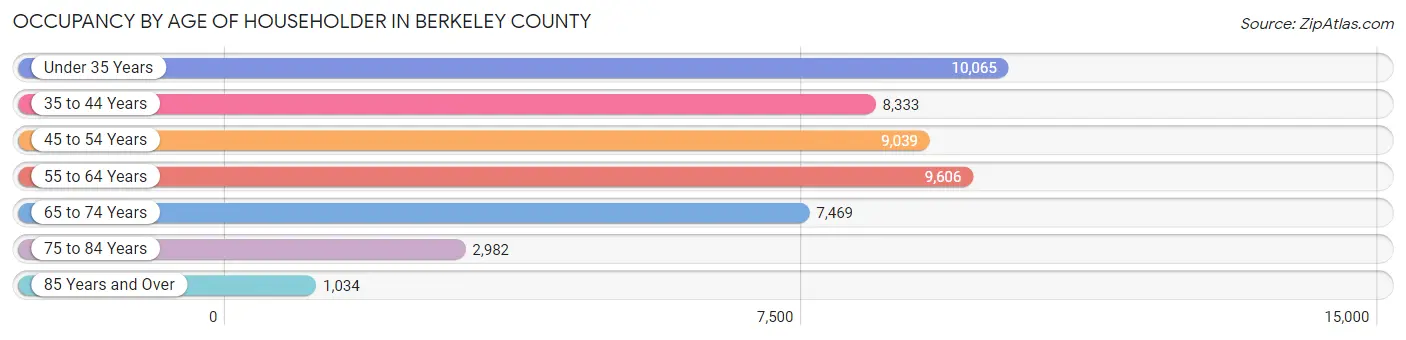
| Age Bracket | # Households | % Households |
| Under 35 Years | 10,065 | 20.7% |
| 35 to 44 Years | 8,333 | 17.2% |
| 45 to 54 Years | 9,039 | 18.6% |
| 55 to 64 Years | 9,606 | 19.8% |
| 65 to 74 Years | 7,469 | 15.4% |
| 75 to 84 Years | 2,982 | 6.1% |
| 85 Years and Over | 1,034 | 2.1% |
| Total | 48,528 | 100.0% |
Housing Finances in Berkeley County
Median Income by Occupancy in Berkeley County
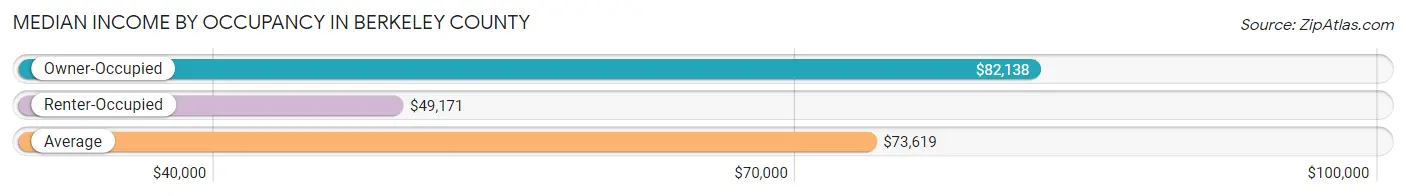
| Occupancy Type | # Households | Median Income |
| Owner-Occupied | 36,589 (75.4%) | $82,138 |
| Renter-Occupied | 11,939 (24.6%) | $49,171 |
| Average | 48,528 (100.0%) | $73,619 |
Occupancy by Householder Income Bracket in Berkeley County
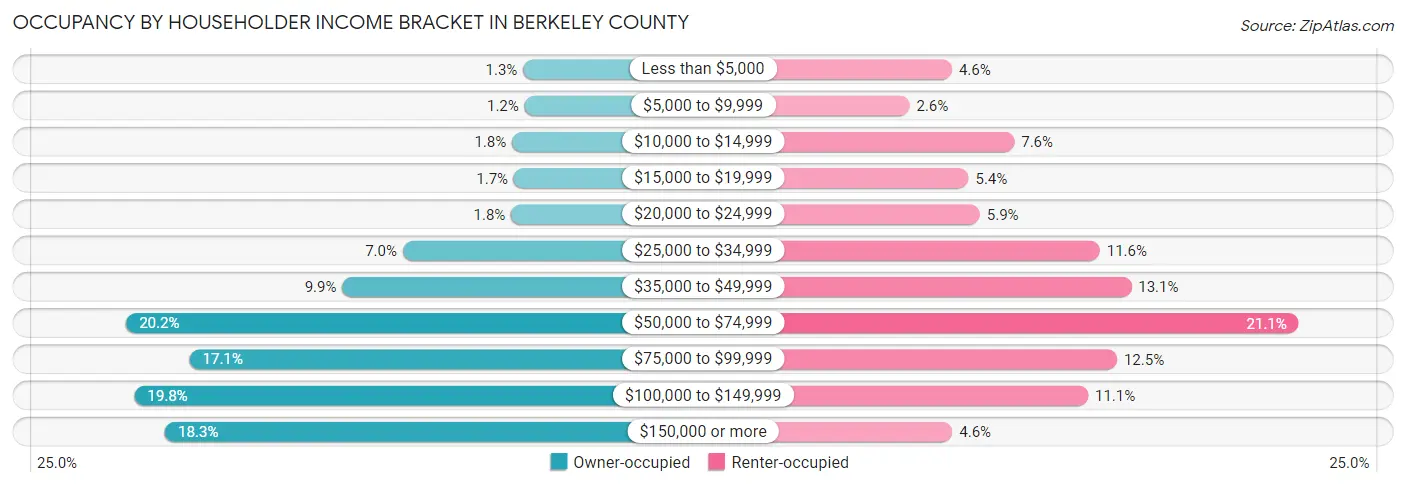
| Income Bracket | Owner-occupied | Renter-occupied |
| Less than $5,000 | 460 (1.3%) | 548 (4.6%) |
| $5,000 to $9,999 | 436 (1.2%) | 307 (2.6%) |
| $10,000 to $14,999 | 655 (1.8%) | 902 (7.6%) |
| $15,000 to $19,999 | 622 (1.7%) | 642 (5.4%) |
| $20,000 to $24,999 | 668 (1.8%) | 707 (5.9%) |
| $25,000 to $34,999 | 2,558 (7.0%) | 1,388 (11.6%) |
| $35,000 to $49,999 | 3,610 (9.9%) | 1,567 (13.1%) |
| $50,000 to $74,999 | 7,378 (20.2%) | 2,519 (21.1%) |
| $75,000 to $99,999 | 6,270 (17.1%) | 1,487 (12.4%) |
| $100,000 to $149,999 | 7,232 (19.8%) | 1,322 (11.1%) |
| $150,000 or more | 6,700 (18.3%) | 550 (4.6%) |
| Total | 36,589 (100.0%) | 11,939 (100.0%) |
Monthly Housing Cost Tiers in Berkeley County
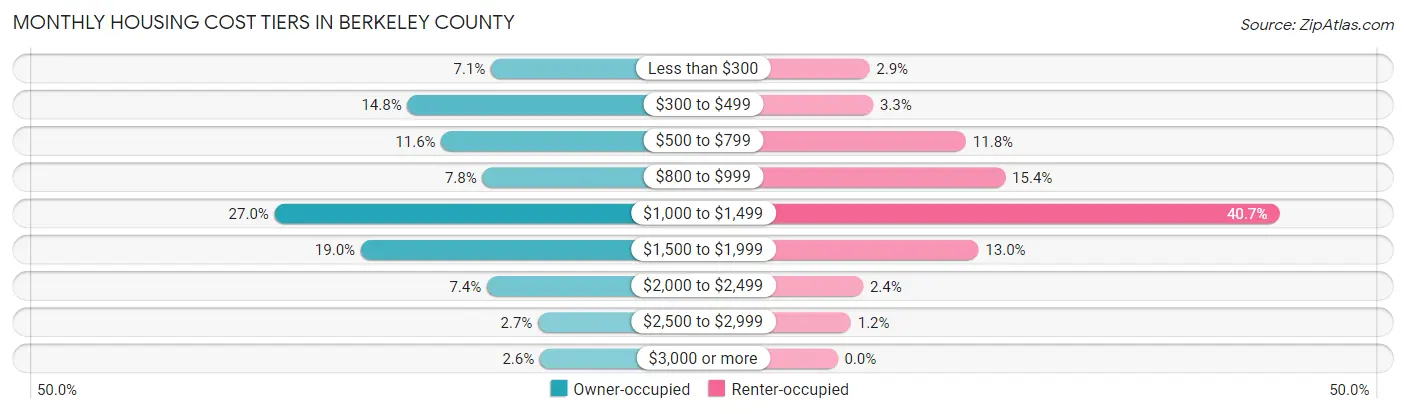
| Monthly Cost | Owner-occupied | Renter-occupied |
| Less than $300 | 2,580 (7.0%) | 351 (2.9%) |
| $300 to $499 | 5,397 (14.7%) | 390 (3.3%) |
| $500 to $799 | 4,257 (11.6%) | 1,412 (11.8%) |
| $800 to $999 | 2,869 (7.8%) | 1,843 (15.4%) |
| $1,000 to $1,499 | 9,871 (27.0%) | 4,855 (40.7%) |
| $1,500 to $1,999 | 6,966 (19.0%) | 1,550 (13.0%) |
| $2,000 to $2,499 | 2,720 (7.4%) | 280 (2.4%) |
| $2,500 to $2,999 | 997 (2.7%) | 147 (1.2%) |
| $3,000 or more | 932 (2.5%) | 0 (0.0%) |
| Total | 36,589 (100.0%) | 11,939 (100.0%) |
Physical Housing Characteristics in Berkeley County
Housing Structures in Berkeley County
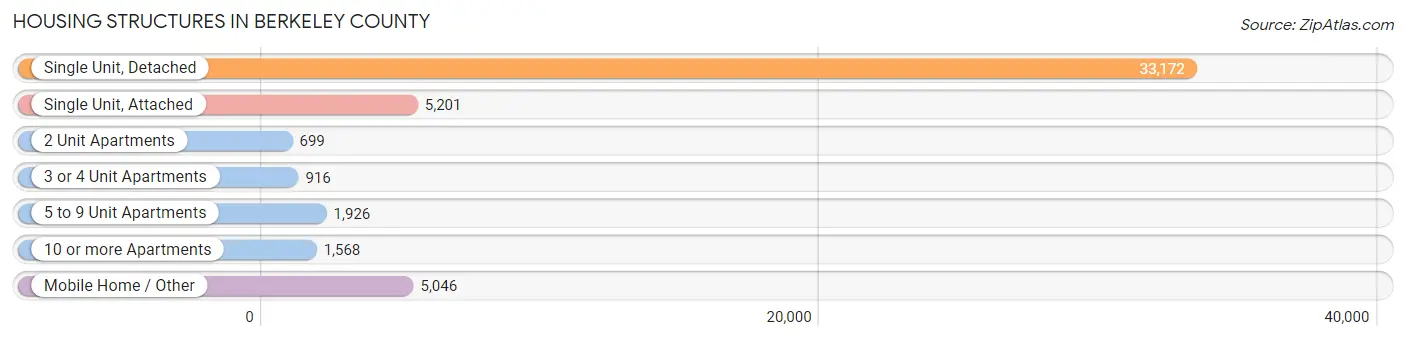
| Structure Type | # Housing Units | % Housing Units |
| Single Unit, Detached | 33,172 | 68.4% |
| Single Unit, Attached | 5,201 | 10.7% |
| 2 Unit Apartments | 699 | 1.4% |
| 3 or 4 Unit Apartments | 916 | 1.9% |
| 5 to 9 Unit Apartments | 1,926 | 4.0% |
| 10 or more Apartments | 1,568 | 3.2% |
| Mobile Home / Other | 5,046 | 10.4% |
| Total | 48,528 | 100.0% |
Housing Structures by Occupancy in Berkeley County
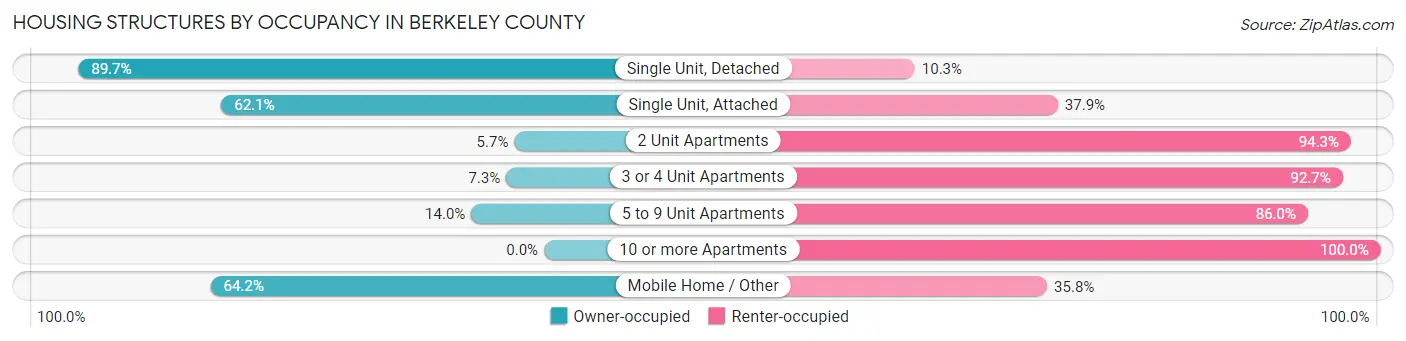
| Structure Type | Owner-occupied | Renter-occupied |
| Single Unit, Detached | 29,742 (89.7%) | 3,430 (10.3%) |
| Single Unit, Attached | 3,231 (62.1%) | 1,970 (37.9%) |
| 2 Unit Apartments | 40 (5.7%) | 659 (94.3%) |
| 3 or 4 Unit Apartments | 67 (7.3%) | 849 (92.7%) |
| 5 to 9 Unit Apartments | 270 (14.0%) | 1,656 (86.0%) |
| 10 or more Apartments | 0 (0.0%) | 1,568 (100.0%) |
| Mobile Home / Other | 3,239 (64.2%) | 1,807 (35.8%) |
| Total | 36,589 (75.4%) | 11,939 (24.6%) |
Housing Structures by Number of Rooms in Berkeley County
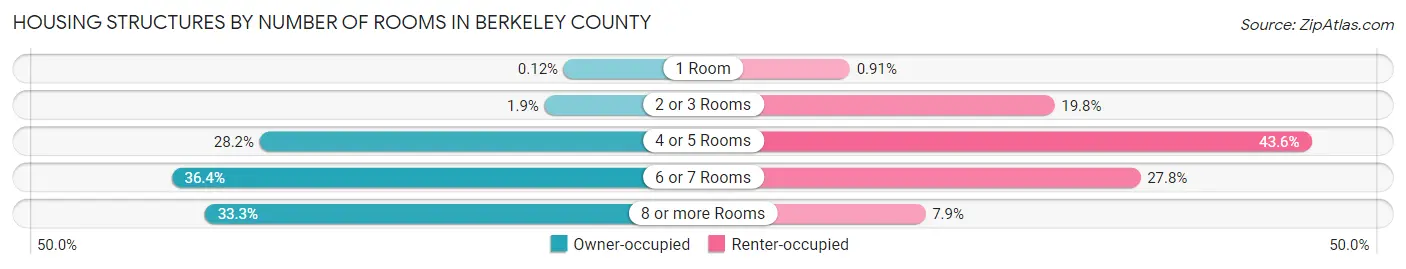
| Number of Rooms | Owner-occupied | Renter-occupied |
| 1 Room | 43 (0.1%) | 109 (0.9%) |
| 2 or 3 Rooms | 694 (1.9%) | 2,368 (19.8%) |
| 4 or 5 Rooms | 10,331 (28.2%) | 5,205 (43.6%) |
| 6 or 7 Rooms | 13,322 (36.4%) | 3,315 (27.8%) |
| 8 or more Rooms | 12,199 (33.3%) | 942 (7.9%) |
| Total | 36,589 (100.0%) | 11,939 (100.0%) |
Housing Structure by Heating Type in Berkeley County
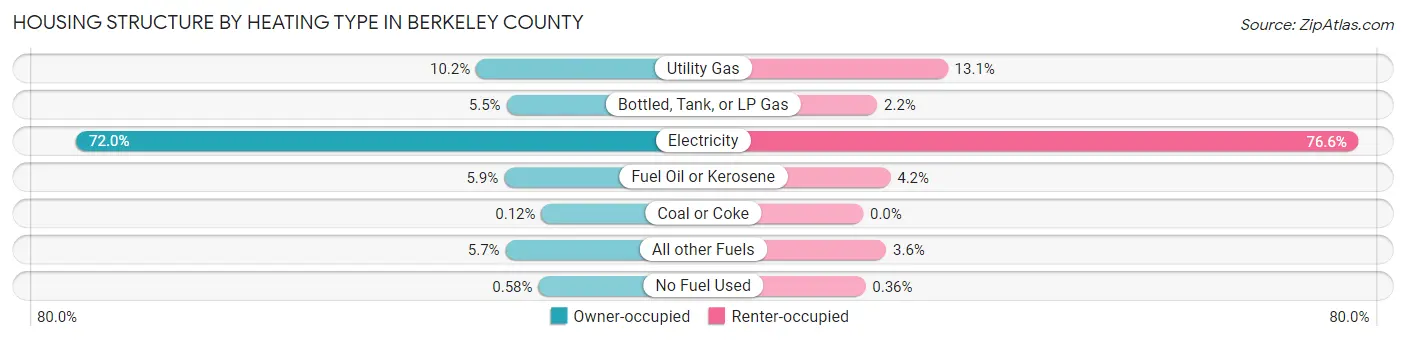
| Heating Type | Owner-occupied | Renter-occupied |
| Utility Gas | 3,737 (10.2%) | 1,562 (13.1%) |
| Bottled, Tank, or LP Gas | 2,017 (5.5%) | 259 (2.2%) |
| Electricity | 26,355 (72.0%) | 9,147 (76.6%) |
| Fuel Oil or Kerosene | 2,150 (5.9%) | 503 (4.2%) |
| Coal or Coke | 44 (0.1%) | 0 (0.0%) |
| All other Fuels | 2,075 (5.7%) | 425 (3.6%) |
| No Fuel Used | 211 (0.6%) | 43 (0.4%) |
| Total | 36,589 (100.0%) | 11,939 (100.0%) |
Household Vehicle Usage in Berkeley County
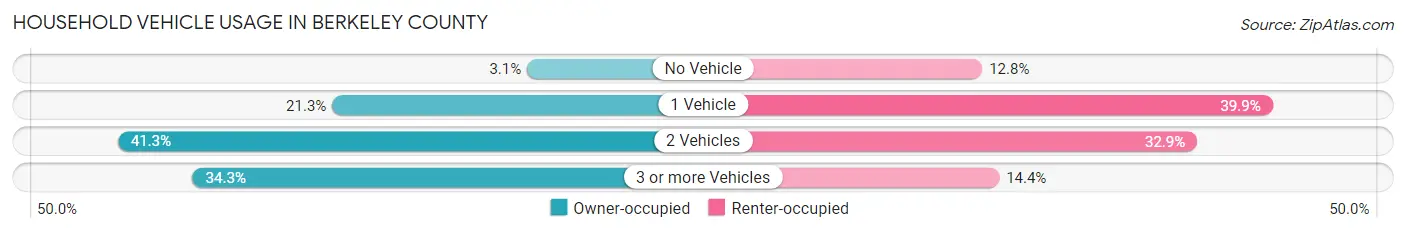
| Vehicles per Household | Owner-occupied | Renter-occupied |
| No Vehicle | 1,133 (3.1%) | 1,531 (12.8%) |
| 1 Vehicle | 7,789 (21.3%) | 4,765 (39.9%) |
| 2 Vehicles | 15,112 (41.3%) | 3,924 (32.9%) |
| 3 or more Vehicles | 12,555 (34.3%) | 1,719 (14.4%) |
| Total | 36,589 (100.0%) | 11,939 (100.0%) |
Real Estate & Mortgages in Berkeley County
Real Estate and Mortgage Overview in Berkeley County
| Characteristic | Without Mortgage | With Mortgage |
| Housing Units | 11,327 | 25,262 |
| Median Property Value | $192,600 | $245,800 |
| Median Household Income | $58,901 | $5,393 |
| Monthly Housing Costs | $395 | $932 |
| Real Estate Taxes | $1,107 | $446 |
Property Value by Mortgage Status in Berkeley County
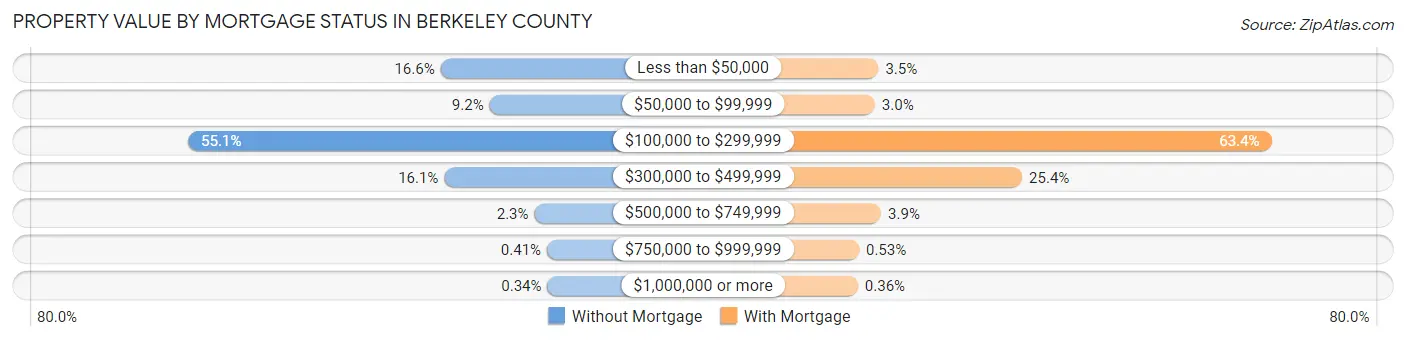
| Property Value | Without Mortgage | With Mortgage |
| Less than $50,000 | 1,884 (16.6%) | 881 (3.5%) |
| $50,000 to $99,999 | 1,038 (9.2%) | 746 (2.9%) |
| $100,000 to $299,999 | 6,239 (55.1%) | 16,008 (63.4%) |
| $300,000 to $499,999 | 1,819 (16.1%) | 6,415 (25.4%) |
| $500,000 to $749,999 | 263 (2.3%) | 985 (3.9%) |
| $750,000 to $999,999 | 46 (0.4%) | 135 (0.5%) |
| $1,000,000 or more | 38 (0.3%) | 92 (0.4%) |
| Total | 11,327 (100.0%) | 25,262 (100.0%) |
Household Income by Mortgage Status in Berkeley County
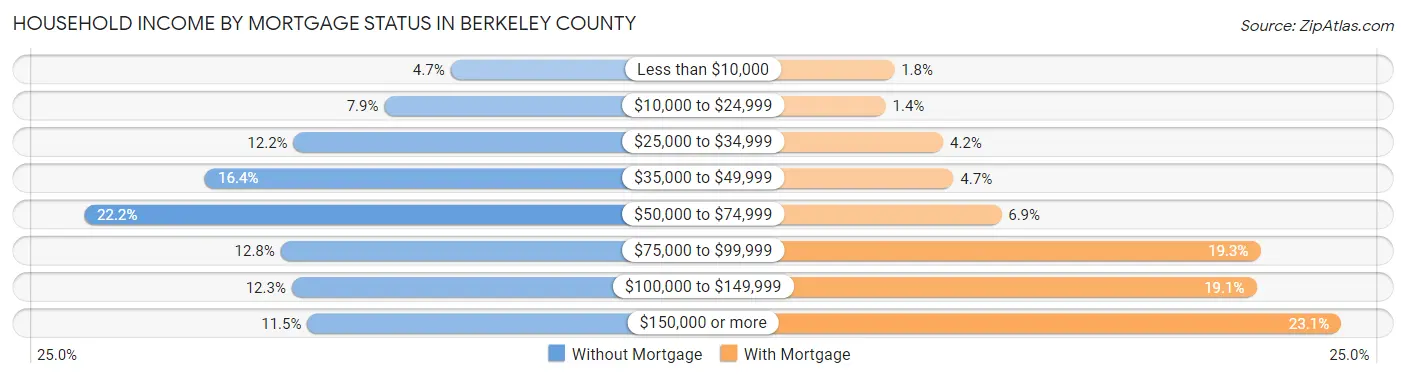
| Household Income | Without Mortgage | With Mortgage |
| Less than $10,000 | 535 (4.7%) | 465 (1.8%) |
| $10,000 to $24,999 | 892 (7.9%) | 361 (1.4%) |
| $25,000 to $34,999 | 1,382 (12.2%) | 1,053 (4.2%) |
| $35,000 to $49,999 | 1,858 (16.4%) | 1,176 (4.7%) |
| $50,000 to $74,999 | 2,511 (22.2%) | 1,752 (6.9%) |
| $75,000 to $99,999 | 1,451 (12.8%) | 4,867 (19.3%) |
| $100,000 to $149,999 | 1,391 (12.3%) | 4,819 (19.1%) |
| $150,000 or more | 1,307 (11.5%) | 5,841 (23.1%) |
| Total | 11,327 (100.0%) | 25,262 (100.0%) |
Property Value to Household Income Ratio in Berkeley County
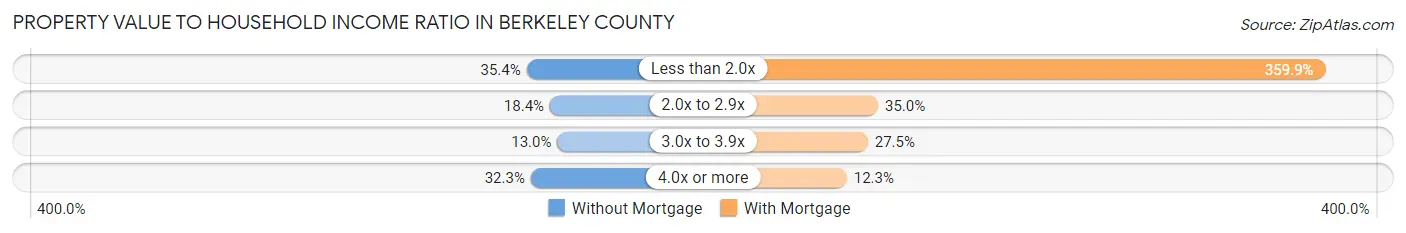
| Value-to-Income Ratio | Without Mortgage | With Mortgage |
| Less than 2.0x | 4,007 (35.4%) | 90,926 (359.9%) |
| 2.0x to 2.9x | 2,082 (18.4%) | 8,830 (34.9%) |
| 3.0x to 3.9x | 1,473 (13.0%) | 6,945 (27.5%) |
| 4.0x or more | 3,660 (32.3%) | 3,100 (12.3%) |
| Total | 11,327 (100.0%) | 25,262 (100.0%) |
Real Estate Taxes by Mortgage Status in Berkeley County
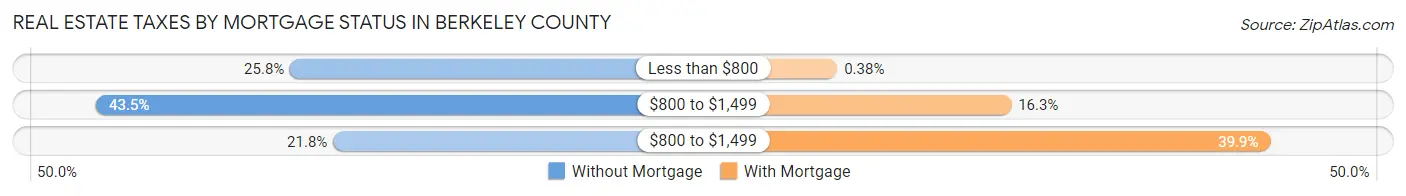
| Property Taxes | Without Mortgage | With Mortgage |
| Less than $800 | 2,917 (25.8%) | 97 (0.4%) |
| $800 to $1,499 | 4,924 (43.5%) | 4,111 (16.3%) |
| $800 to $1,499 | 2,471 (21.8%) | 10,088 (39.9%) |
| Total | 11,327 (100.0%) | 25,262 (100.0%) |
Health & Disability in Berkeley County
Health Insurance Coverage by Age in Berkeley County
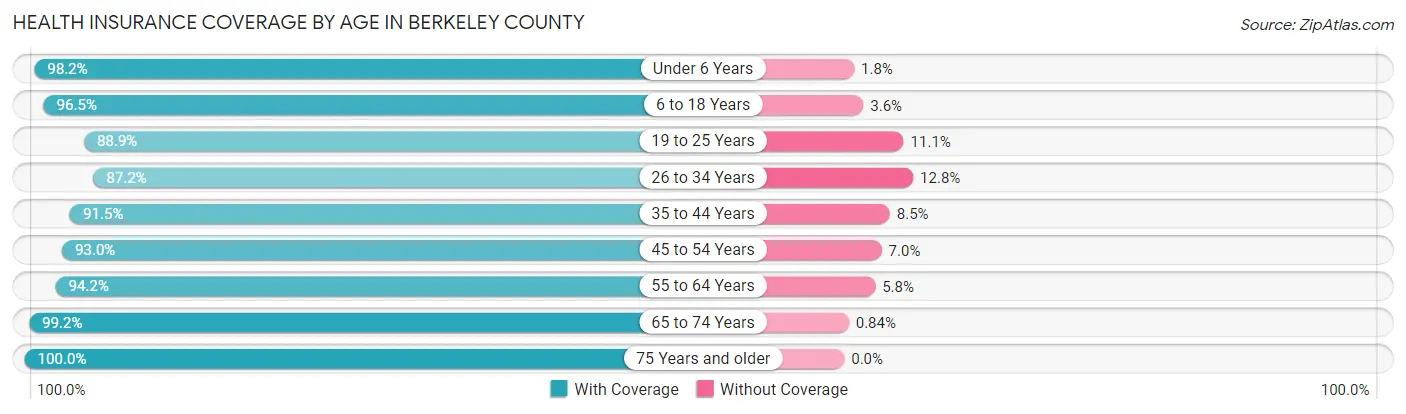
| Age Bracket | With Coverage | Without Coverage |
| Under 6 Years | 8,543 (98.2%) | 159 (1.8%) |
| 6 to 18 Years | 20,328 (96.5%) | 749 (3.5%) |
| 19 to 25 Years | 8,531 (88.9%) | 1,062 (11.1%) |
| 26 to 34 Years | 13,541 (87.2%) | 1,995 (12.8%) |
| 35 to 44 Years | 15,179 (91.5%) | 1,409 (8.5%) |
| 45 to 54 Years | 15,242 (93.0%) | 1,142 (7.0%) |
| 55 to 64 Years | 15,248 (94.2%) | 933 (5.8%) |
| 65 to 74 Years | 11,894 (99.2%) | 101 (0.8%) |
| 75 Years and older | 6,392 (100.0%) | 0 (0.0%) |
| Total | 114,898 (93.8%) | 7,550 (6.2%) |
Health Insurance Coverage by Citizenship Status in Berkeley County
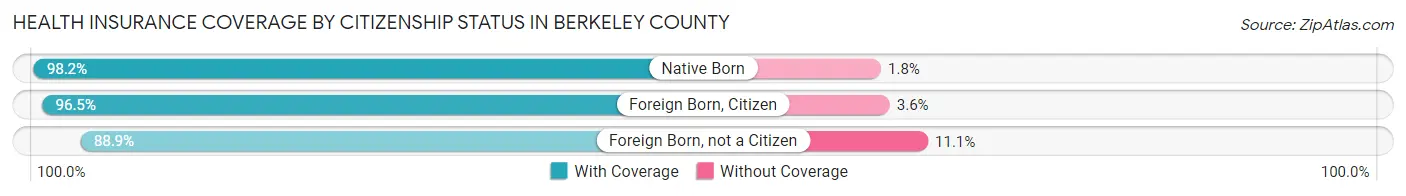
| Citizenship Status | With Coverage | Without Coverage |
| Native Born | 8,543 (98.2%) | 159 (1.8%) |
| Foreign Born, Citizen | 20,328 (96.5%) | 749 (3.5%) |
| Foreign Born, not a Citizen | 8,531 (88.9%) | 1,062 (11.1%) |
Health Insurance Coverage by Household Income in Berkeley County
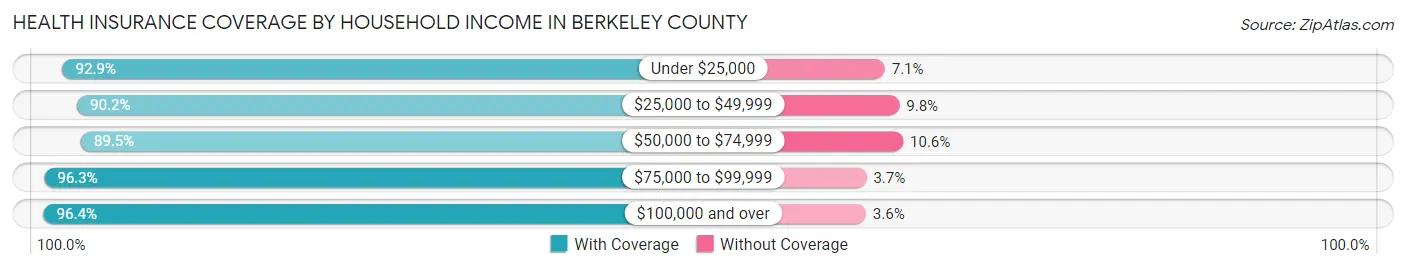
| Household Income | With Coverage | Without Coverage |
| Under $25,000 | 9,587 (92.9%) | 735 (7.1%) |
| $25,000 to $49,999 | 17,003 (90.2%) | 1,855 (9.8%) |
| $50,000 to $74,999 | 20,541 (89.4%) | 2,422 (10.5%) |
| $75,000 to $99,999 | 19,859 (96.3%) | 761 (3.7%) |
| $100,000 and over | 47,602 (96.4%) | 1,768 (3.6%) |
Public vs Private Health Insurance Coverage by Age in Berkeley County
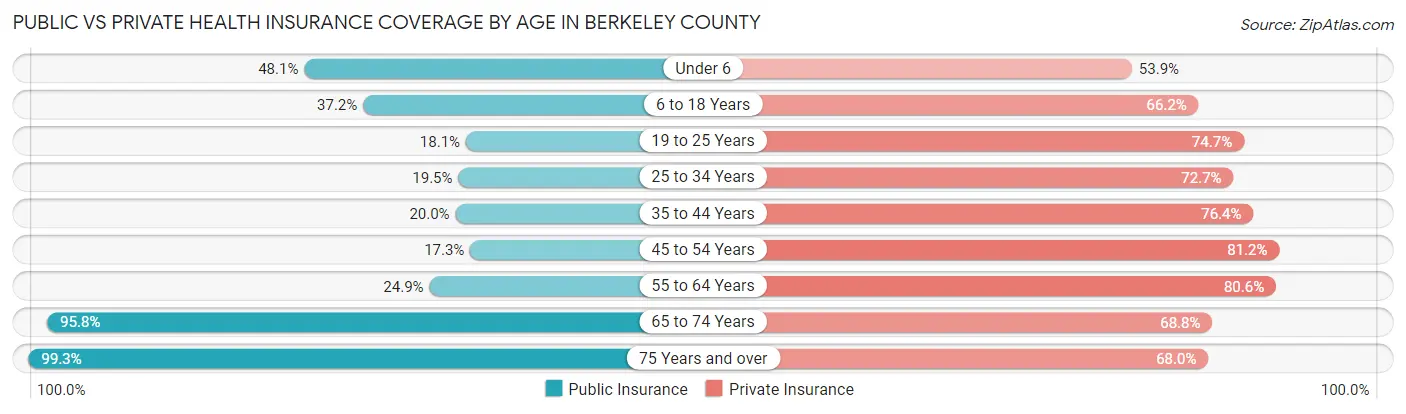
| Age Bracket | Public Insurance | Private Insurance |
| Under 6 | 4,186 (48.1%) | 4,686 (53.8%) |
| 6 to 18 Years | 7,834 (37.2%) | 13,959 (66.2%) |
| 19 to 25 Years | 1,735 (18.1%) | 7,162 (74.7%) |
| 25 to 34 Years | 3,028 (19.5%) | 11,291 (72.7%) |
| 35 to 44 Years | 3,323 (20.0%) | 12,671 (76.4%) |
| 45 to 54 Years | 2,833 (17.3%) | 13,304 (81.2%) |
| 55 to 64 Years | 4,023 (24.9%) | 13,041 (80.6%) |
| 65 to 74 Years | 11,495 (95.8%) | 8,249 (68.8%) |
| 75 Years and over | 6,347 (99.3%) | 4,347 (68.0%) |
| Total | 44,804 (36.6%) | 88,710 (72.5%) |
Disability Status by Sex by Age in Berkeley County
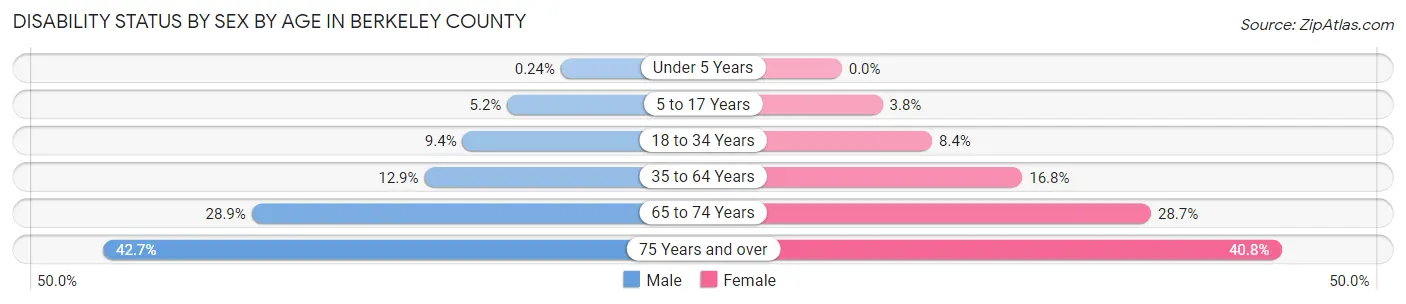
| Age Bracket | Male | Female |
| Under 5 Years | 9 (0.2%) | 0 (0.0%) |
| 5 to 17 Years | 557 (5.2%) | 384 (3.8%) |
| 18 to 34 Years | 1,269 (9.4%) | 1,090 (8.4%) |
| 35 to 64 Years | 3,157 (12.9%) | 4,132 (16.8%) |
| 65 to 74 Years | 1,643 (28.9%) | 1,813 (28.7%) |
| 75 Years and over | 1,243 (42.7%) | 1,420 (40.8%) |
Disability Class by Sex by Age in Berkeley County
Disability Class: Hearing Difficulty
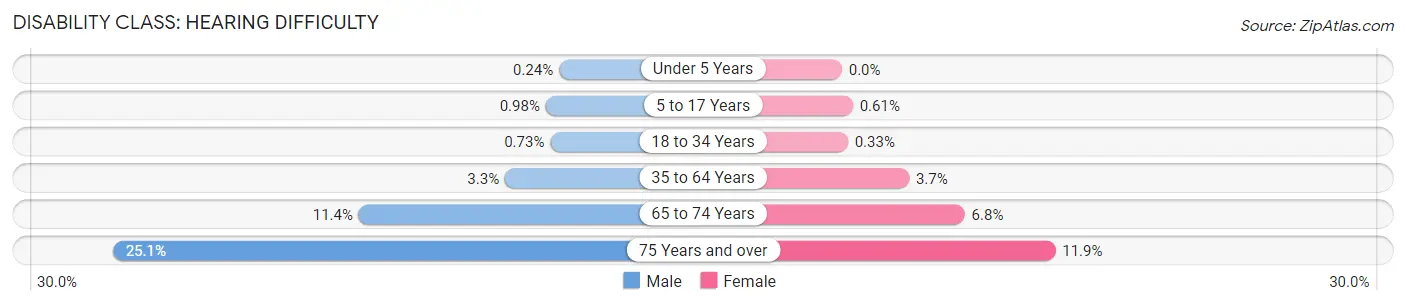
| Age Bracket | Male | Female |
| Under 5 Years | 9 (0.2%) | 0 (0.0%) |
| 5 to 17 Years | 105 (1.0%) | 62 (0.6%) |
| 18 to 34 Years | 99 (0.7%) | 43 (0.3%) |
| 35 to 64 Years | 795 (3.3%) | 923 (3.7%) |
| 65 to 74 Years | 647 (11.4%) | 432 (6.8%) |
| 75 Years and over | 730 (25.1%) | 414 (11.9%) |
Disability Class: Vision Difficulty
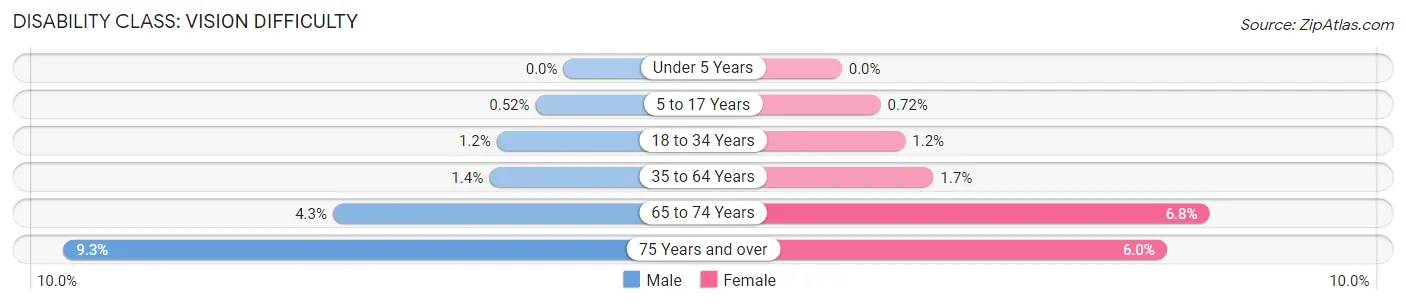
| Age Bracket | Male | Female |
| Under 5 Years | 0 (0.0%) | 0 (0.0%) |
| 5 to 17 Years | 56 (0.5%) | 73 (0.7%) |
| 18 to 34 Years | 168 (1.2%) | 153 (1.2%) |
| 35 to 64 Years | 338 (1.4%) | 420 (1.7%) |
| 65 to 74 Years | 243 (4.3%) | 431 (6.8%) |
| 75 Years and over | 270 (9.3%) | 210 (6.0%) |
Disability Class: Cognitive Difficulty
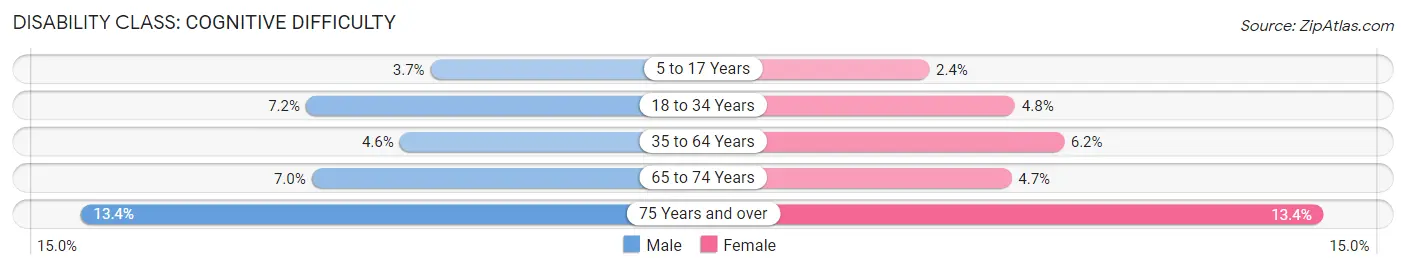
| Age Bracket | Male | Female |
| 5 to 17 Years | 396 (3.7%) | 246 (2.4%) |
| 18 to 34 Years | 972 (7.2%) | 626 (4.8%) |
| 35 to 64 Years | 1,117 (4.6%) | 1,526 (6.2%) |
| 65 to 74 Years | 398 (7.0%) | 298 (4.7%) |
| 75 Years and over | 391 (13.4%) | 467 (13.4%) |
Disability Class: Ambulatory Difficulty
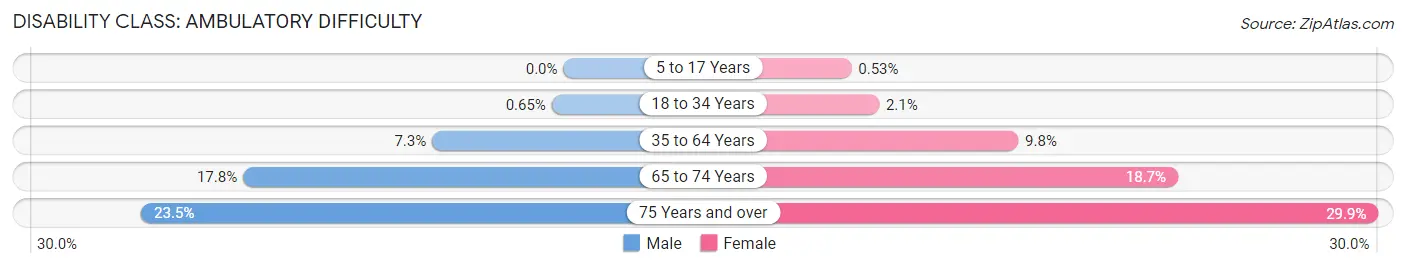
| Age Bracket | Male | Female |
| 5 to 17 Years | 0 (0.0%) | 54 (0.5%) |
| 18 to 34 Years | 88 (0.6%) | 269 (2.1%) |
| 35 to 64 Years | 1,790 (7.3%) | 2,424 (9.8%) |
| 65 to 74 Years | 1,013 (17.8%) | 1,182 (18.7%) |
| 75 Years and over | 684 (23.5%) | 1,040 (29.9%) |
Disability Class: Self-Care Difficulty
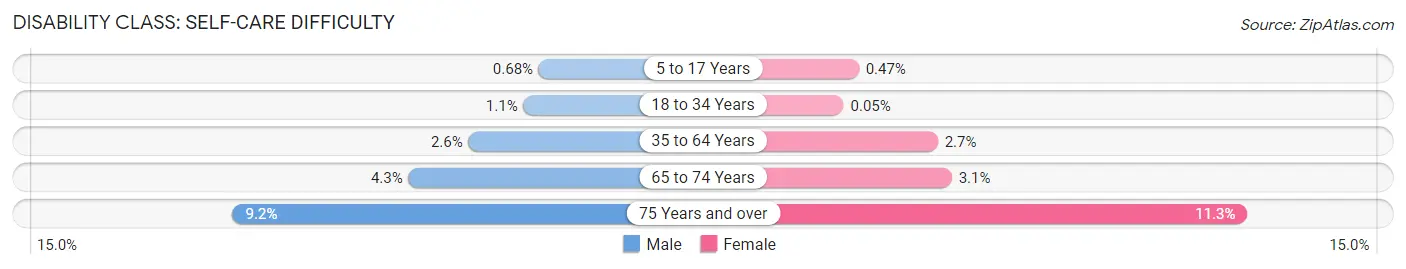
| Age Bracket | Male | Female |
| 5 to 17 Years | 73 (0.7%) | 48 (0.5%) |
| 18 to 34 Years | 151 (1.1%) | 7 (0.1%) |
| 35 to 64 Years | 645 (2.6%) | 659 (2.7%) |
| 65 to 74 Years | 245 (4.3%) | 193 (3.1%) |
| 75 Years and over | 268 (9.2%) | 393 (11.3%) |
Technology Access in Berkeley County
Computing Device Access in Berkeley County
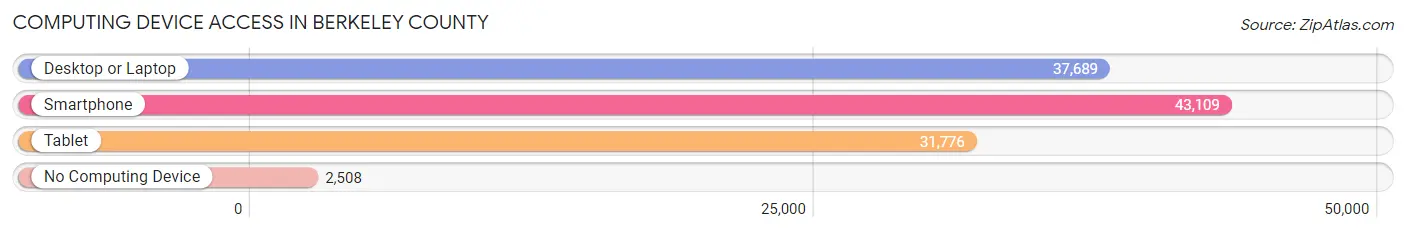
| Device Type | # Households | % Households |
| Desktop or Laptop | 37,689 | 77.7% |
| Smartphone | 43,109 | 88.8% |
| Tablet | 31,776 | 65.5% |
| No Computing Device | 2,508 | 5.2% |
| Total | 48,528 | 100.0% |
Internet Access in Berkeley County
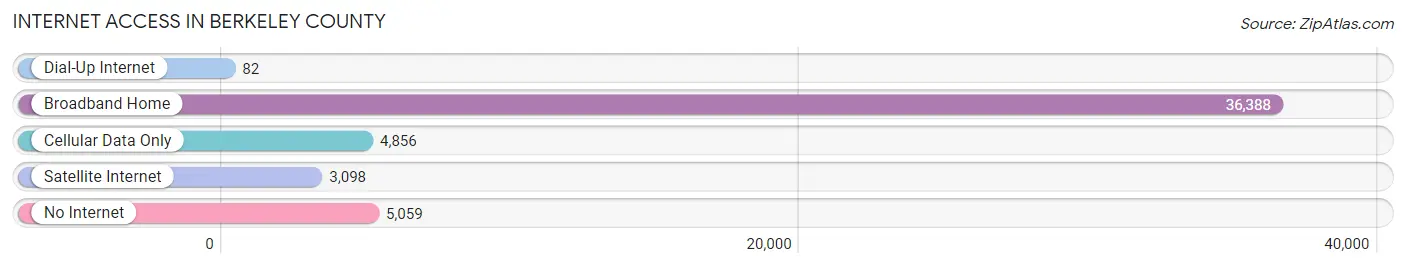
| Internet Type | # Households | % Households |
| Dial-Up Internet | 82 | 0.2% |
| Broadband Home | 36,388 | 75.0% |
| Cellular Data Only | 4,856 | 10.0% |
| Satellite Internet | 3,098 | 6.4% |
| No Internet | 5,059 | 10.4% |
| Total | 48,528 | 100.0% |
Berkeley County Summary
Berkeley County, West Virginia is located in the Eastern Panhandle of the state, and is bordered by Jefferson County to the north, Morgan County to the east, and Hampshire County to the south. The county seat is Martinsburg, and the county is part of the Hagerstown-Martinsburg Metropolitan Statistical Area. As of the 2010 census, the population of Berkeley County was 104,169, making it the second most populous county in West Virginia.
History
Berkeley County was created in 1772 from the northern part of Frederick County, Virginia. It was named for Norborne Berkeley, Baron de Botetourt, who was the royal governor of Virginia from 1768 to 1770. The county was part of the Shenandoah Valley, and was a major center of the Civil War. The Battle of Antietam, the bloodiest single-day battle in American history, was fought in the county in 1862.
Geography
Berkeley County is located in the Eastern Panhandle of West Virginia, and is bordered by Jefferson County to the north, Morgan County to the east, and Hampshire County to the south. The county has a total area of 316 square miles, of which 312 square miles is land and 4.2 square miles is water. The county is located in the Appalachian Mountains, and is part of the Potomac River watershed. The highest point in the county is North Mountain, which has an elevation of 2,890 feet.
Economy
Berkeley County has a diverse economy, with a mix of manufacturing, retail, and service industries. The county is home to several large employers, including Procter & Gamble, Amazon, and the U.S. Department of Defense. The county also has a thriving agricultural sector, with crops such as corn, soybeans, and hay being grown in the area.
Demographics
As of the 2010 census, the population of Berkeley County was 104,169, making it the second most populous county in West Virginia. The population density was 333.3 people per square mile. The racial makeup of the county was 87.2% White, 8.3% African American, 0.4% Native American, 1.2% Asian, 0.1% Pacific Islander, 0.7% from other races, and 2.1% from two or more races. Hispanic or Latino of any race were 2.7% of the population.
The median income for a household in the county was $45,945, and the median income for a family was $54,945. The per capita income for the county was $22,945. About 8.3% of families and 11.2% of the population were below the poverty line, including 15.2% of those under age 18 and 8.2% of those age 65 or over.
Common Questions
What is the Total Population of Berkeley County?
Total Population of Berkeley County is 123,283.
What is the Total Male Population of Berkeley County?
Total Male Population of Berkeley County is 61,697.
What is the Total Female Population of Berkeley County?
Total Female Population of Berkeley County is 61,586.
What is the Ratio of Males per 100 Females in Berkeley County?
There are 100.18 Males per 100 Females in Berkeley County.
What is the Ratio of Females per 100 Males in Berkeley County?
There are 99.82 Females per 100 Males in Berkeley County.
What is the Median Population Age in Berkeley County?
Median Population Age in Berkeley County is 38.8 Years.
What is the Average Family Size in Berkeley County
Average Family Size in Berkeley County is 3.1 People.
What is the Average Household Size in Berkeley County
Average Household Size in Berkeley County is 2.5 People.
What is Per Capita Income in Berkeley County?
Per Capita income in Berkeley County is $35,909.
What is the Median Family Income in Berkeley County?
Median Family Income in Berkeley County is $85,110.
What is the Median Household income in Berkeley County?
Median Household Income in Berkeley County is $73,619.
What is Income or Wage Gap in Berkeley County?
Income or Wage Gap in Berkeley County is 30.1%.
Women in Berkeley County earn 69.9 cents for every dollar earned by a man.
What is Family Income Deficit in Berkeley County?
Family Income Deficit in Berkeley County is $10,882.
Families that are below poverty line in Berkeley County earn $10,882 less on average than the poverty threshold level.
What is Inequality or Gini Index in Berkeley County?
Inequality or Gini Index in Berkeley County is 0.40.
How Large is the Labor Force in Berkeley County?
There are 65,244 People in the Labor Forcein in Berkeley County.
What is the Percentage of People in the Labor Force in Berkeley County?
66.4% of People are in the Labor Force in Berkeley County.
What is the Unemployment Rate in Berkeley County?
Unemployment Rate in Berkeley County is 4.6%.