Barbour County, WV
Barbour County Map

Barbour County Overview
15,527
TOTAL POPULATION
7,620
MALE POPULATION
7,907
FEMALE POPULATION
96.37
MALES / 100 FEMALES
103.77
FEMALES / 100 MALES
42.6
MEDIAN AGE
3.3
AVG FAMILY SIZE
2.6
AVG HOUSEHOLD SIZE
$24,947
PER CAPITA INCOME
$55,686
AVG FAMILY INCOME
$44,341
AVG HOUSEHOLD INCOME
46.7%
WAGE / INCOME GAP [ % ]
53.3¢/ $1
WAGE / INCOME GAP [ $ ]
$12,570
FAMILY INCOME DEFICIT
0.45
INEQUALITY / GINI INDEX
6,379
LABOR FORCE [ PEOPLE ]
49.9%
PERCENT IN LABOR FORCE
10.1%
UNEMPLOYMENT RATE
Barbour County Area Codes
Race in Barbour County
The most populous races in Barbour County are White / Caucasian (14,313 | 92.2%), Two or more Races (837 | 5.4%), and Black / African American (215 | 1.4%).

| Race | # Population | % Population |
| Asian | 84 | 0.5% |
| Black / African American | 215 | 1.4% |
| Hawaiian / Pacific | 0 | 0.0% |
| Hispanic or Latino | 182 | 1.2% |
| Native / Alaskan | 26 | 0.2% |
| White / Caucasian | 14,313 | 92.2% |
| Two or more Races | 837 | 5.4% |
| Some other Race | 52 | 0.3% |
| Total | 15,527 | 100.0% |
Ancestry in Barbour County
The most populous ancestries reported in Barbour County are German (3,068 | 19.8%), Irish (2,287 | 14.7%), English (1,202 | 7.7%), American (1,199 | 7.7%), and Italian (849 | 5.5%), together accounting for 55.4% of all Barbour County residents.

| Ancestry | # Population | % Population |
| African | 2 | 0.0% |
| American | 1,199 | 7.7% |
| Arab | 13 | 0.1% |
| Belgian | 3 | 0.0% |
| British | 55 | 0.4% |
| Central American | 3 | 0.0% |
| Cuban | 1 | 0.0% |
| Czech | 4 | 0.0% |
| Danish | 9 | 0.1% |
| Dominican | 15 | 0.1% |
| Dutch | 202 | 1.3% |
| English | 1,202 | 7.7% |
| European | 114 | 0.7% |
| Finnish | 42 | 0.3% |
| French | 90 | 0.6% |
| German | 3,068 | 19.8% |
| Haitian | 2 | 0.0% |
| Hungarian | 104 | 0.7% |
| Irish | 2,287 | 14.7% |
| Italian | 849 | 5.5% |
| Jamaican | 3 | 0.0% |
| Korean | 113 | 0.7% |
| Mexican | 93 | 0.6% |
| Native Hawaiian | 9 | 0.1% |
| Norwegian | 20 | 0.1% |
| Pakistani | 3 | 0.0% |
| Polish | 147 | 0.9% |
| Portuguese | 13 | 0.1% |
| Pueblo | 26 | 0.2% |
| Puerto Rican | 33 | 0.2% |
| Salvadoran | 3 | 0.0% |
| Scotch-Irish | 230 | 1.5% |
| Scottish | 219 | 1.4% |
| Slavic | 25 | 0.2% |
| Slovene | 12 | 0.1% |
| Spaniard | 3 | 0.0% |
| Spanish | 23 | 0.2% |
| Subsaharan African | 2 | 0.0% |
| Swedish | 37 | 0.2% |
| Swiss | 35 | 0.2% |
| Syrian | 13 | 0.1% |
| Thai | 4 | 0.0% |
| Ukrainian | 17 | 0.1% |
| Welsh | 148 | 0.9% | View All 44 Rows |
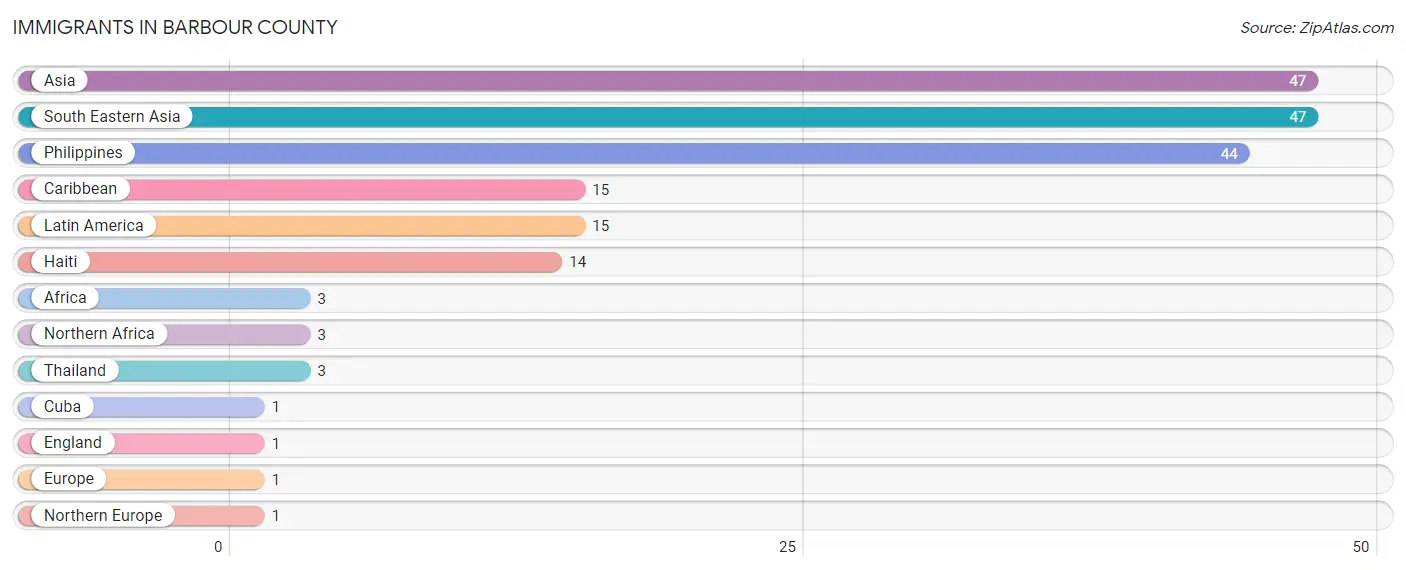
Immigrants in Barbour County
The most numerous immigrant groups reported in Barbour County came from Asia (47 | 0.3%), South Eastern Asia (47 | 0.3%), Philippines (44 | 0.3%), Caribbean (15 | 0.1%), and Latin America (15 | 0.1%), together accounting for 1.1% of all Barbour County residents.
| Immigration Origin | # Population | % Population |
| Africa | 3 | 0.0% |
| Asia | 47 | 0.3% |
| Caribbean | 15 | 0.1% |
| Cuba | 1 | 0.0% |
| England | 1 | 0.0% |
| Europe | 1 | 0.0% |
| Haiti | 14 | 0.1% |
| Latin America | 15 | 0.1% |
| Northern Africa | 3 | 0.0% |
| Northern Europe | 1 | 0.0% |
| Philippines | 44 | 0.3% |
| South Eastern Asia | 47 | 0.3% |
| Thailand | 3 | 0.0% | View All 13 Rows |
Sex and Age in Barbour County
Sex and Age in Barbour County
The most populous age groups in Barbour County are 65 to 69 Years (650 | 8.5%) for men and 15 to 19 Years (681 | 8.6%) for women.

| Age Bracket | Male | Female |
| Under 5 Years | 381 (5.0%) | 358 (4.5%) |
| 5 to 9 Years | 535 (7.0%) | 378 (4.8%) |
| 10 to 14 Years | 399 (5.2%) | 511 (6.5%) |
| 15 to 19 Years | 580 (7.6%) | 681 (8.6%) |
| 20 to 24 Years | 554 (7.3%) | 549 (6.9%) |
| 25 to 29 Years | 420 (5.5%) | 397 (5.0%) |
| 30 to 34 Years | 398 (5.2%) | 405 (5.1%) |
| 35 to 39 Years | 399 (5.2%) | 426 (5.4%) |
| 40 to 44 Years | 446 (5.9%) | 428 (5.4%) |
| 45 to 49 Years | 480 (6.3%) | 497 (6.3%) |
| 50 to 54 Years | 477 (6.3%) | 476 (6.0%) |
| 55 to 59 Years | 514 (6.8%) | 472 (6.0%) |
| 60 to 64 Years | 533 (7.0%) | 598 (7.6%) |
| 65 to 69 Years | 650 (8.5%) | 668 (8.5%) |
| 70 to 74 Years | 281 (3.7%) | 312 (4.0%) |
| 75 to 79 Years | 273 (3.6%) | 307 (3.9%) |
| 80 to 84 Years | 179 (2.4%) | 317 (4.0%) |
| 85 Years and over | 121 (1.6%) | 127 (1.6%) |
| Total | 7,620 (100.0%) | 7,907 (100.0%) |
Families and Households in Barbour County
Median Family Size in Barbour County
The median family size in Barbour County is 3.30 persons per family, with single female/mother families (696 | 19.1%) accounting for the largest median family size of 3.75 persons per family. On the other hand, single male/father families (208 | 5.7%) represent the smallest median family size with 2.88 persons per family.

| Family Type | # Families | Family Size |
| Married-Couple | 2,734 (75.1%) | 3.22 |
| Single Male/Father | 208 (5.7%) | 2.88 |
| Single Female/Mother | 696 (19.1%) | 3.75 |
| Total Families | 3,638 (100.0%) | 3.30 |
Median Household Size in Barbour County
The median household size in Barbour County is 2.58 persons per household, with single female/mother households (696 | 12.0%) accounting for the largest median household size of 4 persons per household. non-family households (2,151 | 37.2%) represent the smallest median household size with 1.21 persons per household.

| Household Type | # Households | Household Size |
| Married-Couple | 2,734 (47.2%) | 3.23 |
| Single Male/Father | 208 (3.6%) | 3.38 |
| Single Female/Mother | 696 (12.0%) | 4.00 |
| Non-family | 2,151 (37.2%) | 1.21 |
| Total Households | 5,789 (100.0%) | 2.58 |
Household Size by Marriage Status in Barbour County
Out of a total of 5,789 households in Barbour County, 3,638 (62.8%) are family households, while 2,151 (37.2%) are nonfamily households. The most numerous type of family households are 2-person households, comprising 1,793, and the most common type of nonfamily households are 1-person households, comprising 1,793.

| Household Size | Family Households | Nonfamily Households |
| 1-Person Households | - | 1,793 (31.0%) |
| 2-Person Households | 1,793 (31.0%) | 345 (6.0%) |
| 3-Person Households | 715 (12.3%) | 13 (0.2%) |
| 4-Person Households | 758 (13.1%) | 0 (0.0%) |
| 5-Person Households | 288 (5.0%) | 0 (0.0%) |
| 6-Person Households | 67 (1.2%) | 0 (0.0%) |
| 7+ Person Households | 17 (0.3%) | 0 (0.0%) |
| Total | 3,638 (62.8%) | 2,151 (37.2%) |
Female Fertility in Barbour County
Fertility by Age in Barbour County
Average fertility rate in Barbour County is 56.0 births per 1,000 women. Women in the age bracket of 20 to 34 years have the highest fertility rate with 129.0 births per 1,000 women. Women in the age bracket of 20 to 34 years acount for 90.2% of all women with births.

| Age Bracket | Women with Births | Births / 1,000 Women |
| 15 to 19 years | 0 (0.0%) | 0.0 |
| 20 to 34 years | 174 (90.2%) | 129.0 |
| 35 to 50 years | 19 (9.8%) | 13.0 |
| Total | 193 (100.0%) | 56.0 |
Fertility by Age by Marriage Status in Barbour County
61.7% of women with births (193) in Barbour County are married. The highest percentage of unmarried women with births falls into 20 to 34 years age bracket with 42.5% of them unmarried at the time of birth, while the lowest percentage of unmarried women with births belong to 35 to 50 years age bracket with 0.0% of them unmarried.

| Age Bracket | Married | Unmarried |
| 15 to 19 years | 0 (0.0%) | 0 (0.0%) |
| 20 to 34 years | 100 (57.5%) | 74 (42.5%) |
| 35 to 50 years | 19 (100.0%) | 0 (0.0%) |
| Total | 119 (61.7%) | 74 (38.3%) |
Fertility by Education in Barbour County

| Educational Attainment | Women with Births | Births / 1,000 Women |
| Less than High School | 19 (9.8%) | 29.0 |
| High School Diploma | 166 (86.0%) | 100.0 |
| College or Associate's Degree | 8 (4.2%) | 10.0 |
| Bachelor's Degree | 0 (0.0%) | 0.0 |
| Graduate Degree | 0 (0.0%) | 0.0 |
| Total | 193 (100.0%) | 56.0 |
Fertility by Education by Marriage Status in Barbour County
38.3% of women with births in Barbour County are unmarried. Women with the educational attainment of less than high school are most likely to be married with 100.0% of them married at childbirth, while women with the educational attainment of college or associate's degree are least likely to be married with 100.0% of them unmarried at childbirth.

| Educational Attainment | Married | Unmarried |
| Less than High School | 19 (100.0%) | 0 (0.0%) |
| High School Diploma | 100 (60.2%) | 66 (39.8%) |
| College or Associate's Degree | 0 (0.0%) | 8 (100.0%) |
| Bachelor's Degree | 0 (0.0%) | 0 (0.0%) |
| Graduate Degree | 0 (0.0%) | 0 (0.0%) |
| Total | 119 (61.7%) | 74 (38.3%) |
Income in Barbour County
Income Overview in Barbour County
Per Capita Income in Barbour County is $24,947, while median incomes of families and households are $55,686 and $44,341 respectively.
| Characteristic | Number | Measure |
| Per Capita Income | 15,527 | $24,947 |
| Median Family Income | 3,638 | $55,686 |
| Mean Family Income | 3,638 | $72,680 |
| Median Household Income | 5,789 | $44,341 |
| Mean Household Income | 5,789 | $59,463 |
| Income Deficit | 3,638 | $12,570 |
| Wage / Income Gap (%) | 15,527 | 46.66% |
| Wage / Income Gap ($) | 15,527 | 53.34¢ per $1 |
| Gini / Inequality Index | 15,527 | 0.45 |
Earnings by Sex in Barbour County
Average Earnings in Barbour County are $29,928, $40,893 for men and $21,812 for women, a difference of 46.7%.

| Sex | Number | Average Earnings |
| Male | 3,358 (51.8%) | $40,893 |
| Female | 3,122 (48.2%) | $21,812 |
| Total | 6,480 (100.0%) | $29,928 |
Earnings by Sex by Income Bracket in Barbour County
The most common earnings brackets in Barbour County are $75,000 to $99,999 for men (424 | 12.6%) and $2,499 or less for women (258 | 8.3%).

| Income | Male | Female |
| $2,499 or less | 223 (6.6%) | 258 (8.3%) |
| $2,500 to $4,999 | 78 (2.3%) | 231 (7.4%) |
| $5,000 to $7,499 | 84 (2.5%) | 214 (6.9%) |
| $7,500 to $9,999 | 63 (1.9%) | 163 (5.2%) |
| $10,000 to $12,499 | 176 (5.2%) | 245 (7.9%) |
| $12,500 to $14,999 | 91 (2.7%) | 146 (4.7%) |
| $15,000 to $17,499 | 51 (1.5%) | 55 (1.8%) |
| $17,500 to $19,999 | 36 (1.1%) | 141 (4.5%) |
| $20,000 to $22,499 | 64 (1.9%) | 149 (4.8%) |
| $22,500 to $24,999 | 117 (3.5%) | 231 (7.4%) |
| $25,000 to $29,999 | 208 (6.2%) | 222 (7.1%) |
| $30,000 to $34,999 | 123 (3.7%) | 110 (3.5%) |
| $35,000 to $39,999 | 335 (10.0%) | 185 (5.9%) |
| $40,000 to $44,999 | 124 (3.7%) | 104 (3.3%) |
| $45,000 to $49,999 | 380 (11.3%) | 81 (2.6%) |
| $50,000 to $54,999 | 77 (2.3%) | 123 (3.9%) |
| $55,000 to $64,999 | 162 (4.8%) | 107 (3.4%) |
| $65,000 to $74,999 | 212 (6.3%) | 115 (3.7%) |
| $75,000 to $99,999 | 424 (12.6%) | 60 (1.9%) |
| $100,000+ | 330 (9.8%) | 182 (5.8%) |
| Total | 3,358 (100.0%) | 3,122 (100.0%) |
Earnings by Sex by Educational Attainment in Barbour County
Average earnings in Barbour County are $46,635 for men and $25,773 for women, a difference of 44.7%. Men with an educational attainment of college or associate's degree enjoy the highest average annual earnings of $51,058, while those with less than high school education earn the least with $24,667. Women with an educational attainment of graduate degree earn the most with the average annual earnings of $70,417, while those with high school diploma education have the smallest earnings of $22,630.

| Educational Attainment | Male Income | Female Income |
| Less than High School | $24,667 | $0 |
| High School Diploma | $46,708 | $22,630 |
| College or Associate's Degree | $51,058 | $26,650 |
| Bachelor's Degree | - | - |
| Graduate Degree | $43,750 | $70,417 |
| Total | $46,635 | $25,773 |
Family Income in Barbour County
Family Income Brackets in Barbour County
According to the Barbour County family income data, there are 840 families falling into the $50,000 to $74,999 income range, which is the most common income bracket and makes up 23.1% of all families. Conversely, the $200,000+ income bracket is the least frequent group with only 106 families (2.9%) belonging to this category.

| Income Bracket | # Families | % Families |
| Less than $10,000 | 258 | 7.1% |
| $10,000 to $14,999 | 156 | 4.3% |
| $15,000 to $24,999 | 240 | 6.6% |
| $25,000 to $34,999 | 331 | 9.1% |
| $35,000 to $49,999 | 564 | 15.5% |
| $50,000 to $74,999 | 840 | 23.1% |
| $75,000 to $99,999 | 342 | 9.4% |
| $100,000 to $149,999 | 586 | 16.1% |
| $150,000 to $199,999 | 211 | 5.8% |
| $200,000+ | 106 | 2.9% |
Family Income by Famaliy Size in Barbour County
5-person families (212 | 5.8%) account for the highest median family income in Barbour County with $75,600 per family, while 2-person families (1,926 | 52.9%) have the highest median income of $25,662 per family member.

| Income Bracket | # Families | Median Income |
| 2-Person Families | 1,926 (52.9%) | $51,324 |
| 3-Person Families | 713 (19.6%) | $60,321 |
| 4-Person Families | 703 (19.3%) | $69,254 |
| 5-Person Families | 212 (5.8%) | $75,600 |
| 6-Person Families | 67 (1.8%) | $47,589 |
| 7+ Person Families | 17 (0.5%) | $0 |
| Total | 3,638 (100.0%) | $55,686 |
Family Income by Number of Earners in Barbour County
The median family income in Barbour County is $55,686, with families comprising 3+ earners (232) having the highest median family income of $122,292, while families with no earners (1,076) have the lowest median family income of $38,080, accounting for 6.4% and 29.6% of families, respectively.

| Number of Earners | # Families | Median Income |
| No Earners | 1,076 (29.6%) | $38,080 |
| 1 Earner | 1,283 (35.3%) | $61,727 |
| 2 Earners | 1,047 (28.8%) | $85,720 |
| 3+ Earners | 232 (6.4%) | $122,292 |
| Total | 3,638 (100.0%) | $55,686 |
Household Income in Barbour County
Household Income Brackets in Barbour County
With 1,106 households falling in the category, the $35,000 to $49,999 income range is the most frequent in Barbour County, accounting for 19.1% of all households. In contrast, only 104 households (1.8%) fall into the $200,000+ income bracket, making it the least populous group.

| Income Bracket | # Households | % Households |
| Less than $10,000 | 457 | 7.9% |
| $10,000 to $14,999 | 370 | 6.4% |
| $15,000 to $24,999 | 672 | 11.6% |
| $25,000 to $34,999 | 683 | 11.8% |
| $35,000 to $49,999 | 1,106 | 19.1% |
| $50,000 to $74,999 | 1,077 | 18.6% |
| $75,000 to $99,999 | 399 | 6.9% |
| $100,000 to $149,999 | 689 | 11.9% |
| $150,000 to $199,999 | 226 | 3.9% |
| $200,000+ | 104 | 1.8% |
Household Income by Householder Age in Barbour County
The median household income in Barbour County is $44,341, with the highest median household income of $58,727 found in the 25 to 44 years age bracket for the primary householder. A total of 1,413 households (24.4%) fall into this category. Meanwhile, the 65+ years age bracket for the primary householder has the lowest median household income of $36,844, with 2,122 households (36.7%) in this group.

| Income Bracket | # Households | Median Income |
| 15 to 24 Years | 212 (3.7%) | $38,235 |
| 25 to 44 Years | 1,413 (24.4%) | $58,727 |
| 45 to 64 Years | 2,042 (35.3%) | $50,786 |
| 65+ Years | 2,122 (36.7%) | $36,844 |
| Total | 5,789 (100.0%) | $44,341 |
Poverty in Barbour County
Income Below Poverty by Sex and Age in Barbour County
With 18.8% poverty level for males and 25.1% for females among the residents of Barbour County, 16 and 17 year old males and 6 to 11 year old females are the most vulnerable to poverty, with 105 males (49.3%) and 223 females (35.3%) in their respective age groups living below the poverty level.

| Age Bracket | Male | Female |
| Under 5 Years | 83 (23.0%) | 120 (33.5%) |
| 5 Years | 19 (14.7%) | 0 (0.0%) |
| 6 to 11 Years | 180 (33.5%) | 223 (35.3%) |
| 12 to 14 Years | 114 (42.7%) | 71 (33.2%) |
| 15 Years | 36 (46.2%) | 0 (0.0%) |
| 16 and 17 Years | 105 (49.3%) | 54 (32.9%) |
| 18 to 24 Years | 97 (16.2%) | 234 (30.3%) |
| 25 to 34 Years | 136 (16.7%) | 234 (29.2%) |
| 35 to 44 Years | 180 (21.3%) | 215 (25.2%) |
| 45 to 54 Years | 111 (11.6%) | 239 (24.6%) |
| 55 to 64 Years | 128 (12.2%) | 251 (23.5%) |
| 65 to 74 Years | 125 (13.5%) | 167 (17.1%) |
| 75 Years and over | 60 (10.9%) | 96 (15.6%) |
| Total | 1,374 (18.8%) | 1,904 (25.1%) |
Income Above Poverty by Sex and Age in Barbour County
According to the poverty statistics in Barbour County, males aged 75 years and over and females aged 5 years are the age groups that are most secure financially, with 89.1% of males and 100.0% of females in these age groups living above the poverty line.

| Age Bracket | Male | Female |
| Under 5 Years | 278 (77.0%) | 238 (66.5%) |
| 5 Years | 110 (85.3%) | 40 (100.0%) |
| 6 to 11 Years | 358 (66.5%) | 408 (64.7%) |
| 12 to 14 Years | 153 (57.3%) | 143 (66.8%) |
| 15 Years | 42 (53.8%) | 104 (100.0%) |
| 16 and 17 Years | 108 (50.7%) | 110 (67.1%) |
| 18 to 24 Years | 502 (83.8%) | 538 (69.7%) |
| 25 to 34 Years | 677 (83.3%) | 568 (70.8%) |
| 35 to 44 Years | 665 (78.7%) | 639 (74.8%) |
| 45 to 54 Years | 846 (88.4%) | 734 (75.4%) |
| 55 to 64 Years | 919 (87.8%) | 819 (76.5%) |
| 65 to 74 Years | 802 (86.5%) | 808 (82.9%) |
| 75 Years and over | 489 (89.1%) | 521 (84.4%) |
| Total | 5,949 (81.2%) | 5,670 (74.9%) |
Income Below Poverty Among Married-Couple Families in Barbour County
The poverty statistics for married-couple families in Barbour County show that 8.5% or 233 of the total 2,734 families live below the poverty line. Families with 5 or more children have the highest poverty rate of 100.0%, comprising of 17 families. On the other hand, families with no children have the lowest poverty rate of 5.6%, which includes 99 families.

| Children | Above Poverty | Below Poverty |
| No Children | 1,682 (94.4%) | 99 (5.6%) |
| 1 or 2 Children | 713 (89.1%) | 87 (10.9%) |
| 3 or 4 Children | 106 (77.9%) | 30 (22.1%) |
| 5 or more Children | 0 (0.0%) | 17 (100.0%) |
| Total | 2,501 (91.5%) | 233 (8.5%) |
Income Below Poverty Among Single-Parent Households in Barbour County
According to the poverty data in Barbour County, 21.6% or 45 single-father households and 48.0% or 334 single-mother households are living below the poverty line. Among single-father households, those with 3 or 4 children have the highest poverty rate, with 12 households (100.0%) experiencing poverty. Likewise, among single-mother households, those with 3 or 4 children have the highest poverty rate, with 90 households (67.2%) falling below the poverty line.

| Children | Single Father | Single Mother |
| No Children | 12 (12.9%) | 79 (27.2%) |
| 1 or 2 Children | 21 (20.4%) | 165 (60.7%) |
| 3 or 4 Children | 12 (100.0%) | 90 (67.2%) |
| 5 or more Children | 0 (0.0%) | 0 (0.0%) |
| Total | 45 (21.6%) | 334 (48.0%) |
Income Below Poverty Among Married-Couple vs Single-Parent Households in Barbour County
The poverty data for Barbour County shows that 233 of the married-couple family households (8.5%) and 379 of the single-parent households (41.9%) are living below the poverty level. Within the married-couple family households, those with 5 or more children have the highest poverty rate, with 17 households (100.0%) falling below the poverty line. Among the single-parent households, those with 3 or 4 children have the highest poverty rate, with 102 household (69.9%) living below poverty.

| Children | Married-Couple Families | Single-Parent Households |
| No Children | 99 (5.6%) | 91 (23.8%) |
| 1 or 2 Children | 87 (10.9%) | 186 (49.6%) |
| 3 or 4 Children | 30 (22.1%) | 102 (69.9%) |
| 5 or more Children | 17 (100.0%) | 0 (0.0%) |
| Total | 233 (8.5%) | 379 (41.9%) |
Employment Characteristics in Barbour County
Employment by Class of Employer in Barbour County
Among the 5,578 employed individuals in Barbour County, private company employees (3,867 | 69.3%), state government employees (574 | 10.3%), and not-for-profit organizations (435 | 7.8%) make up the most common classes of employment.

| Employer Class | # Employees | % Employees |
| Private Company Employees | 3,867 | 69.3% |
| Self-Employed (Incorporated) | 53 | 0.9% |
| Self-Employed (Not Incorporated) | 229 | 4.1% |
| Not-for-profit Organizations | 435 | 7.8% |
| Local Government Employees | 225 | 4.0% |
| State Government Employees | 574 | 10.3% |
| Federal Government Employees | 193 | 3.5% |
| Unpaid Family Workers | 2 | 0.0% |
| Total | 5,578 | 100.0% |
Employment Status by Age in Barbour County
According to the labor force statistics for Barbour County, out of the total population over 16 years of age (12,783), 49.9% or 6,379 individuals are in the labor force, with 10.1% or 644 of them unemployed. The age group with the highest labor force participation rate is 45 to 54 years, with 84.2% or 1,625 individuals in the labor force. Within the labor force, the 16 to 19 years age range has the highest percentage of unemployed individuals, with 25.2% or 100 of them being unemployed.

| Age Bracket | In Labor Force | Unemployed |
| 16 to 19 Years | 397 (36.8%) | 100 (25.2%) |
| 20 to 24 Years | 760 (68.9%) | 126 (16.6%) |
| 25 to 29 Years | 590 (72.2%) | 30 (5.1%) |
| 30 to 34 Years | 515 (64.1%) | 42 (8.2%) |
| 35 to 44 Years | 1,273 (74.9%) | 274 (21.5%) |
| 45 to 54 Years | 1,625 (84.2%) | 21 (1.3%) |
| 55 to 59 Years | 485 (49.2%) | 17 (3.5%) |
| 60 to 64 Years | 605 (53.5%) | 23 (3.8%) |
| 65 to 74 Years | 118 (6.2%) | 15 (12.7%) |
| 75 Years and over | 7 (0.5%) | 0 (0.0%) |
| Total | 6,379 (49.9%) | 644 (10.1%) |
Employment Status by Educational Attainment in Barbour County
According to labor force statistics for Barbour County, 69.1% of individuals (5,090) out of the total population between 25 and 64 years of age (7,366) are in the labor force, with 8.0% or 407 of them being unemployed. The group with the highest labor force participation rate are those with the educational attainment of bachelor's degree or higher, with 84.0% or 802 individuals in the labor force. Within the labor force, individuals with less than high school education have the highest percentage of unemployment, with 18.7% or 103 of them being unemployed.

| Educational Attainment | In Labor Force | Unemployed |
| Less than High School | 552 (61.5%) | 168 (18.7%) |
| High School Diploma | 2,462 (63.4%) | 369 (9.5%) |
| College / Associate Degree | 1,278 (78.4%) | 44 (2.7%) |
| Bachelor's Degree or higher | 802 (84.0%) | 43 (4.5%) |
| Total | 5,090 (69.1%) | 589 (8.0%) |
Employment Occupations by Sex in Barbour County
Management, Business, Science and Arts Occupations
The most common Management, Business, Science and Arts occupations in Barbour County are Community & Social Service (491 | 8.6%), Education Instruction & Library (372 | 6.5%), Health Diagnosing & Treating (369 | 6.4%), Management (333 | 5.8%), and Computers, Engineering & Science (230 | 4.0%).

Management, Business, Science and Arts Occupations by Sex
Within the Management, Business, Science and Arts occupations in Barbour County, the most male-oriented occupations are Architecture & Engineering (100.0%), Computers, Engineering & Science (93.0%), and Computers & Mathematics (92.6%), while the most female-oriented occupations are Arts, Media & Entertainment (100.0%), Business & Financial (93.5%), and Health Diagnosing & Treating (89.2%).

| Occupation | Male | Female |
| Management | 112 (33.6%) | 221 (66.4%) |
| Business & Financial | 3 (6.5%) | 43 (93.5%) |
| Computers, Engineering & Science | 214 (93.0%) | 16 (7.0%) |
| Computers & Mathematics | 75 (92.6%) | 6 (7.4%) |
| Architecture & Engineering | 91 (100.0%) | 0 (0.0%) |
| Life, Physical & Social Science | 48 (82.8%) | 10 (17.2%) |
| Community & Social Service | 212 (43.2%) | 279 (56.8%) |
| Education, Arts & Media | 27 (79.4%) | 7 (20.6%) |
| Legal Services & Support | 50 (64.1%) | 28 (35.9%) |
| Education Instruction & Library | 135 (36.3%) | 237 (63.7%) |
| Arts, Media & Entertainment | 0 (0.0%) | 7 (100.0%) |
| Health Diagnosing & Treating | 40 (10.8%) | 329 (89.2%) |
| Health Technologists | 31 (17.9%) | 142 (82.1%) |
| Total (Category) | 581 (39.6%) | 888 (60.5%) |
| Total (Overall) | 3,028 (52.9%) | 2,700 (47.1%) |
Services Occupations
The most common Services occupations in Barbour County are Healthcare Support (442 | 7.7%), Food Preparation & Serving (358 | 6.2%), Cleaning & Maintenance (298 | 5.2%), Personal Care & Service (92 | 1.6%), and Security & Protection (86 | 1.5%).

Services Occupations by Sex
Within the Services occupations in Barbour County, the most male-oriented occupations are Security & Protection (100.0%), Firefighting & Prevention (100.0%), and Law Enforcement (100.0%), while the most female-oriented occupations are Personal Care & Service (100.0%), Healthcare Support (93.0%), and Food Preparation & Serving (70.7%).

| Occupation | Male | Female |
| Healthcare Support | 31 (7.0%) | 411 (93.0%) |
| Security & Protection | 86 (100.0%) | 0 (0.0%) |
| Firefighting & Prevention | 5 (100.0%) | 0 (0.0%) |
| Law Enforcement | 81 (100.0%) | 0 (0.0%) |
| Food Preparation & Serving | 105 (29.3%) | 253 (70.7%) |
| Cleaning & Maintenance | 118 (39.6%) | 180 (60.4%) |
| Personal Care & Service | 0 (0.0%) | 92 (100.0%) |
| Total (Category) | 340 (26.7%) | 936 (73.4%) |
| Total (Overall) | 3,028 (52.9%) | 2,700 (47.1%) |
Sales and Office Occupations
The most common Sales and Office occupations in Barbour County are Office & Administration (644 | 11.2%), and Sales & Related (469 | 8.2%).

Sales and Office Occupations by Sex

| Occupation | Male | Female |
| Sales & Related | 204 (43.5%) | 265 (56.5%) |
| Office & Administration | 135 (21.0%) | 509 (79.0%) |
| Total (Category) | 339 (30.5%) | 774 (69.5%) |
| Total (Overall) | 3,028 (52.9%) | 2,700 (47.1%) |
Natural Resources, Construction and Maintenance Occupations
The most common Natural Resources, Construction and Maintenance occupations in Barbour County are Construction & Extraction (630 | 11.0%), Installation, Maintenance & Repair (387 | 6.8%), and Farming, Fishing & Forestry (19 | 0.3%).

Natural Resources, Construction and Maintenance Occupations by Sex

| Occupation | Male | Female |
| Farming, Fishing & Forestry | 19 (100.0%) | 0 (0.0%) |
| Construction & Extraction | 630 (100.0%) | 0 (0.0%) |
| Installation, Maintenance & Repair | 387 (100.0%) | 0 (0.0%) |
| Total (Category) | 1,036 (100.0%) | 0 (0.0%) |
| Total (Overall) | 3,028 (52.9%) | 2,700 (47.1%) |
Production, Transportation and Moving Occupations
The most common Production, Transportation and Moving occupations in Barbour County are Transportation (343 | 6.0%), Production (320 | 5.6%), and Material Moving (171 | 3.0%).

Production, Transportation and Moving Occupations by Sex

| Occupation | Male | Female |
| Production | 262 (81.9%) | 58 (18.1%) |
| Transportation | 325 (94.8%) | 18 (5.2%) |
| Material Moving | 145 (84.8%) | 26 (15.2%) |
| Total (Category) | 732 (87.8%) | 102 (12.2%) |
| Total (Overall) | 3,028 (52.9%) | 2,700 (47.1%) |
Employment Industries by Sex in Barbour County
Employment Industries in Barbour County
The major employment industries in Barbour County include Health Care & Social Assistance (1,035 | 18.1%), Educational Services (650 | 11.4%), Retail Trade (616 | 10.7%), Manufacturing (570 | 10.0%), and Construction (560 | 9.8%).

Employment Industries by Sex in Barbour County
The Barbour County industries that see more men than women are Agriculture, Fishing & Hunting (100.0%), Transportation & Warehousing (100.0%), and Utilities (100.0%), whereas the industries that tend to have a higher number of women are Arts, Entertainment & Recreation (100.0%), Finance & Insurance (97.5%), and Health Care & Social Assistance (87.7%).

| Industry | Male | Female |
| Agriculture, Fishing & Hunting | 24 (100.0%) | 0 (0.0%) |
| Mining, Quarrying, & Extraction | 324 (97.9%) | 7 (2.1%) |
| Construction | 544 (97.1%) | 16 (2.9%) |
| Manufacturing | 405 (71.1%) | 165 (28.9%) |
| Wholesale Trade | 0 (0.0%) | 0 (0.0%) |
| Retail Trade | 333 (54.1%) | 283 (45.9%) |
| Transportation & Warehousing | 142 (100.0%) | 0 (0.0%) |
| Utilities | 111 (100.0%) | 0 (0.0%) |
| Information | 45 (100.0%) | 0 (0.0%) |
| Finance & Insurance | 3 (2.5%) | 118 (97.5%) |
| Real Estate, Rental & Leasing | 5 (29.4%) | 12 (70.6%) |
| Professional & Scientific | 70 (31.4%) | 153 (68.6%) |
| Enterprise Management | 0 (0.0%) | 0 (0.0%) |
| Administrative & Support | 72 (38.1%) | 117 (61.9%) |
| Educational Services | 290 (44.6%) | 360 (55.4%) |
| Health Care & Social Assistance | 127 (12.3%) | 908 (87.7%) |
| Arts, Entertainment & Recreation | 0 (0.0%) | 8 (100.0%) |
| Accommodation & Food Services | 145 (36.6%) | 251 (63.4%) |
| Public Administration | 245 (57.4%) | 182 (42.6%) |
| Total | 3,028 (52.9%) | 2,700 (47.1%) |
Education in Barbour County
School Enrollment in Barbour County
The most common levels of schooling among the 3,190 students in Barbour County are high school (826 | 25.9%), elementary school (721 | 22.6%), and middle school (718 | 22.5%).

| School Level | # Students | % Students |
| Nursery / Preschool | 63 | 2.0% |
| Kindergarten | 147 | 4.6% |
| Elementary School | 721 | 22.6% |
| Middle School | 718 | 22.5% |
| High School | 826 | 25.9% |
| College / Undergraduate | 706 | 22.1% |
| Graduate / Professional | 9 | 0.3% |
| Total | 3,190 | 100.0% |
School Enrollment by Age by Funding Source in Barbour County
Out of a total of 3,190 students who are enrolled in schools in Barbour County, 590 (18.5%) attend a private institution, while the remaining 2,600 (81.5%) are enrolled in public schools. The age group of 18 to 19 year olds has the highest likelihood of being enrolled in private schools, with 247 (45.8% in the age bracket) enrolled. Conversely, the age group of 3 to 4 year olds has the lowest likelihood of being enrolled in a private school, with 41 (100.0% in the age bracket) attending a public institution.

| Age Bracket | Public School | Private School |
| 3 to 4 Year Olds | 41 (100.0%) | 0 (0.0%) |
| 5 to 9 Year Old | 717 (90.2%) | 78 (9.8%) |
| 10 to 14 Year Olds | 822 (90.3%) | 88 (9.7%) |
| 15 to 17 Year Olds | 464 (92.4%) | 38 (7.6%) |
| 18 to 19 Year Olds | 292 (54.2%) | 247 (45.8%) |
| 20 to 24 Year Olds | 208 (62.6%) | 124 (37.3%) |
| 25 to 34 Year Olds | 0 (0.0%) | 0 (0.0%) |
| 35 Years and over | 57 (80.3%) | 14 (19.7%) |
| Total | 2,600 (81.5%) | 590 (18.5%) |
Educational Attainment by Field of Study in Barbour County
Education (305 | 23.0%), business (299 | 22.5%), science & technology (245 | 18.4%), psychology (136 | 10.2%), and bio, nature & agricultural (135 | 10.2%) are the most common fields of study among 1,328 individuals in Barbour County who have obtained a bachelor's degree or higher.

| Field of Study | # Graduates | % Graduates |
| Computers & Mathematics | 9 | 0.7% |
| Bio, Nature & Agricultural | 135 | 10.2% |
| Physical & Health Sciences | 2 | 0.2% |
| Psychology | 136 | 10.2% |
| Social Sciences | 39 | 2.9% |
| Engineering | 38 | 2.9% |
| Multidisciplinary Studies | 0 | 0.0% |
| Science & Technology | 245 | 18.4% |
| Business | 299 | 22.5% |
| Education | 305 | 23.0% |
| Literature & Languages | 6 | 0.4% |
| Liberal Arts & History | 42 | 3.2% |
| Visual & Performing Arts | 6 | 0.4% |
| Communications | 14 | 1.1% |
| Arts & Humanities | 52 | 3.9% |
| Total | 1,328 | 100.0% |
Transportation & Commute in Barbour County
Vehicle Availability by Sex in Barbour County
The most prevalent vehicle ownership categories in Barbour County are males with 2 vehicles (1,149, accounting for 38.2%) and females with 2 vehicles (932, making up 46.3%).

| Vehicles Available | Male | Female |
| No Vehicle | 50 (1.7%) | 3 (0.1%) |
| 1 Vehicle | 767 (25.5%) | 515 (20.7%) |
| 2 Vehicles | 1,149 (38.2%) | 932 (37.5%) |
| 3 Vehicles | 747 (24.8%) | 653 (26.3%) |
| 4 Vehicles | 160 (5.3%) | 204 (8.2%) |
| 5 or more Vehicles | 134 (4.5%) | 176 (7.1%) |
| Total | 3,007 (100.0%) | 2,483 (100.0%) |
Commute Time in Barbour County
The most frequently occuring commute durations in Barbour County are 5 to 9 minutes (874 commuters, 16.6%), 20 to 24 minutes (767 commuters, 14.6%), and 10 to 14 minutes (584 commuters, 11.1%).

| Commute Time | # Commuters | % Commuters |
| Less than 5 Minutes | 200 | 3.8% |
| 5 to 9 Minutes | 874 | 16.6% |
| 10 to 14 Minutes | 584 | 11.1% |
| 15 to 19 Minutes | 395 | 7.5% |
| 20 to 24 Minutes | 767 | 14.6% |
| 25 to 29 Minutes | 364 | 6.9% |
| 30 to 34 Minutes | 576 | 11.0% |
| 35 to 39 Minutes | 187 | 3.5% |
| 40 to 44 Minutes | 279 | 5.3% |
| 45 to 59 Minutes | 434 | 8.3% |
| 60 to 89 Minutes | 401 | 7.6% |
| 90 or more Minutes | 200 | 3.8% |
Commute Time by Sex in Barbour County
The most common commute times in Barbour County are 5 to 9 minutes (426 commuters, 15.1%) for males and 5 to 9 minutes (448 commuters, 18.4%) for females.

| Commute Time | Male | Female |
| Less than 5 Minutes | 37 (1.3%) | 163 (6.7%) |
| 5 to 9 Minutes | 426 (15.1%) | 448 (18.4%) |
| 10 to 14 Minutes | 224 (7.9%) | 360 (14.8%) |
| 15 to 19 Minutes | 158 (5.6%) | 237 (9.7%) |
| 20 to 24 Minutes | 415 (14.7%) | 352 (14.4%) |
| 25 to 29 Minutes | 223 (7.9%) | 141 (5.8%) |
| 30 to 34 Minutes | 290 (10.3%) | 286 (11.7%) |
| 35 to 39 Minutes | 144 (5.1%) | 43 (1.8%) |
| 40 to 44 Minutes | 161 (5.7%) | 118 (4.8%) |
| 45 to 59 Minutes | 263 (9.3%) | 171 (7.0%) |
| 60 to 89 Minutes | 312 (11.1%) | 89 (3.6%) |
| 90 or more Minutes | 170 (6.0%) | 30 (1.2%) |
Time of Departure to Work by Sex in Barbour County
The most frequent times of departure to work in Barbour County are 12:00 AM to 4:59 AM (495, 17.5%) for males and 7:30 AM to 7:59 AM (367, 15.0%) for females.

| Time of Departure | Male | Female |
| 12:00 AM to 4:59 AM | 495 (17.5%) | 18 (0.7%) |
| 5:00 AM to 5:29 AM | 100 (3.5%) | 130 (5.3%) |
| 5:30 AM to 5:59 AM | 471 (16.7%) | 180 (7.4%) |
| 6:00 AM to 6:29 AM | 289 (10.2%) | 309 (12.7%) |
| 6:30 AM to 6:59 AM | 329 (11.7%) | 283 (11.6%) |
| 7:00 AM to 7:29 AM | 332 (11.8%) | 241 (9.9%) |
| 7:30 AM to 7:59 AM | 251 (8.9%) | 367 (15.0%) |
| 8:00 AM to 8:29 AM | 183 (6.5%) | 137 (5.6%) |
| 8:30 AM to 8:59 AM | 9 (0.3%) | 137 (5.6%) |
| 9:00 AM to 9:59 AM | 51 (1.8%) | 131 (5.4%) |
| 10:00 AM to 10:59 AM | 39 (1.4%) | 113 (4.6%) |
| 11:00 AM to 11:59 AM | 15 (0.5%) | 18 (0.7%) |
| 12:00 PM to 3:59 PM | 195 (6.9%) | 178 (7.3%) |
| 4:00 PM to 11:59 PM | 64 (2.3%) | 196 (8.0%) |
| Total | 2,823 (100.0%) | 2,438 (100.0%) |
Housing Occupancy in Barbour County
Occupancy by Ownership in Barbour County
Of the total 5,789 dwellings in Barbour County, owner-occupied units account for 4,348 (75.1%), while renter-occupied units make up 1,441 (24.9%).

| Occupancy | # Housing Units | % Housing Units |
| Owner Occupied Housing Units | 4,348 | 75.1% |
| Renter-Occupied Housing Units | 1,441 | 24.9% |
| Total Occupied Housing Units | 5,789 | 100.0% |
Occupancy by Household Size in Barbour County

| Household Size | # Housing Units | % Housing Units |
| 1-Person Household | 1,793 | 31.0% |
| 2-Person Household | 2,138 | 36.9% |
| 3-Person Household | 728 | 12.6% |
| 4+ Person Household | 1,130 | 19.5% |
| Total Housing Units | 5,789 | 100.0% |
Occupancy by Ownership by Household Size in Barbour County

| Household Size | Owner-occupied | Renter-occupied |
| 1-Person Household | 1,163 (64.9%) | 630 (35.1%) |
| 2-Person Household | 1,869 (87.4%) | 269 (12.6%) |
| 3-Person Household | 514 (70.6%) | 214 (29.4%) |
| 4+ Person Household | 802 (71.0%) | 328 (29.0%) |
| Total Housing Units | 4,348 (75.1%) | 1,441 (24.9%) |
Occupancy by Educational Attainment in Barbour County

| Household Size | Owner-occupied | Renter-occupied |
| Less than High School | 273 (54.3%) | 230 (45.7%) |
| High School Diploma | 2,381 (75.6%) | 768 (24.4%) |
| College/Associate Degree | 1,107 (82.9%) | 228 (17.1%) |
| Bachelor's Degree or higher | 587 (73.2%) | 215 (26.8%) |
Occupancy by Age of Householder in Barbour County

| Age Bracket | # Households | % Households |
| Under 35 Years | 954 | 16.5% |
| 35 to 44 Years | 671 | 11.6% |
| 45 to 54 Years | 852 | 14.7% |
| 55 to 64 Years | 1,190 | 20.6% |
| 65 to 74 Years | 1,311 | 22.7% |
| 75 to 84 Years | 649 | 11.2% |
| 85 Years and Over | 162 | 2.8% |
| Total | 5,789 | 100.0% |
Housing Finances in Barbour County
Median Income by Occupancy in Barbour County

| Occupancy Type | # Households | Median Income |
| Owner-Occupied | 4,348 (75.1%) | $45,082 |
| Renter-Occupied | 1,441 (24.9%) | $36,732 |
| Average | 5,789 (100.0%) | $44,341 |
Occupancy by Householder Income Bracket in Barbour County

| Income Bracket | Owner-occupied | Renter-occupied |
| Less than $5,000 | 191 (4.4%) | 78 (5.4%) |
| $5,000 to $9,999 | 109 (2.5%) | 82 (5.7%) |
| $10,000 to $14,999 | 244 (5.6%) | 128 (8.9%) |
| $15,000 to $19,999 | 158 (3.6%) | 79 (5.5%) |
| $20,000 to $24,999 | 267 (6.1%) | 168 (11.7%) |
| $25,000 to $34,999 | 536 (12.3%) | 146 (10.1%) |
| $35,000 to $49,999 | 855 (19.7%) | 252 (17.5%) |
| $50,000 to $74,999 | 785 (18.0%) | 294 (20.4%) |
| $75,000 to $99,999 | 307 (7.1%) | 92 (6.4%) |
| $100,000 to $149,999 | 566 (13.0%) | 120 (8.3%) |
| $150,000 or more | 330 (7.6%) | 2 (0.1%) |
| Total | 4,348 (100.0%) | 1,441 (100.0%) |
Monthly Housing Cost Tiers in Barbour County

| Monthly Cost | Owner-occupied | Renter-occupied |
| Less than $300 | 1,196 (27.5%) | 64 (4.4%) |
| $300 to $499 | 1,238 (28.5%) | 164 (11.4%) |
| $500 to $799 | 674 (15.5%) | 510 (35.4%) |
| $800 to $999 | 449 (10.3%) | 243 (16.9%) |
| $1,000 to $1,499 | 544 (12.5%) | 200 (13.9%) |
| $1,500 to $1,999 | 160 (3.7%) | 6 (0.4%) |
| $2,000 to $2,499 | 64 (1.5%) | 0 (0.0%) |
| $2,500 to $2,999 | 0 (0.0%) | 0 (0.0%) |
| $3,000 or more | 23 (0.5%) | 5 (0.4%) |
| Total | 4,348 (100.0%) | 1,441 (100.0%) |
Physical Housing Characteristics in Barbour County
Housing Structures in Barbour County

| Structure Type | # Housing Units | % Housing Units |
| Single Unit, Detached | 4,459 | 77.0% |
| Single Unit, Attached | 50 | 0.9% |
| 2 Unit Apartments | 128 | 2.2% |
| 3 or 4 Unit Apartments | 42 | 0.7% |
| 5 to 9 Unit Apartments | 149 | 2.6% |
| 10 or more Apartments | 128 | 2.2% |
| Mobile Home / Other | 833 | 14.4% |
| Total | 5,789 | 100.0% |
Housing Structures by Occupancy in Barbour County

| Structure Type | Owner-occupied | Renter-occupied |
| Single Unit, Detached | 3,634 (81.5%) | 825 (18.5%) |
| Single Unit, Attached | 47 (94.0%) | 3 (6.0%) |
| 2 Unit Apartments | 16 (12.5%) | 112 (87.5%) |
| 3 or 4 Unit Apartments | 0 (0.0%) | 42 (100.0%) |
| 5 to 9 Unit Apartments | 0 (0.0%) | 149 (100.0%) |
| 10 or more Apartments | 0 (0.0%) | 128 (100.0%) |
| Mobile Home / Other | 651 (78.1%) | 182 (21.8%) |
| Total | 4,348 (75.1%) | 1,441 (24.9%) |
Housing Structures by Number of Rooms in Barbour County

| Number of Rooms | Owner-occupied | Renter-occupied |
| 1 Room | 0 (0.0%) | 0 (0.0%) |
| 2 or 3 Rooms | 41 (0.9%) | 261 (18.1%) |
| 4 or 5 Rooms | 1,201 (27.6%) | 752 (52.2%) |
| 6 or 7 Rooms | 1,879 (43.2%) | 358 (24.8%) |
| 8 or more Rooms | 1,227 (28.2%) | 70 (4.9%) |
| Total | 4,348 (100.0%) | 1,441 (100.0%) |
Housing Structure by Heating Type in Barbour County

| Heating Type | Owner-occupied | Renter-occupied |
| Utility Gas | 1,970 (45.3%) | 559 (38.8%) |
| Bottled, Tank, or LP Gas | 550 (12.7%) | 203 (14.1%) |
| Electricity | 1,072 (24.7%) | 539 (37.4%) |
| Fuel Oil or Kerosene | 61 (1.4%) | 3 (0.2%) |
| Coal or Coke | 108 (2.5%) | 21 (1.5%) |
| All other Fuels | 580 (13.3%) | 116 (8.1%) |
| No Fuel Used | 7 (0.2%) | 0 (0.0%) |
| Total | 4,348 (100.0%) | 1,441 (100.0%) |
Household Vehicle Usage in Barbour County

| Vehicles per Household | Owner-occupied | Renter-occupied |
| No Vehicle | 176 (4.1%) | 225 (15.6%) |
| 1 Vehicle | 1,207 (27.8%) | 724 (50.2%) |
| 2 Vehicles | 1,875 (43.1%) | 351 (24.4%) |
| 3 or more Vehicles | 1,090 (25.1%) | 141 (9.8%) |
| Total | 4,348 (100.0%) | 1,441 (100.0%) |
Real Estate & Mortgages in Barbour County
Real Estate and Mortgage Overview in Barbour County
| Characteristic | Without Mortgage | With Mortgage |
| Housing Units | 2,818 | 1,530 |
| Median Property Value | $111,700 | $135,100 |
| Median Household Income | $40,563 | $164 |
| Monthly Housing Costs | $351 | $23 |
| Real Estate Taxes | $488 | $17 |
Property Value by Mortgage Status in Barbour County

| Property Value | Without Mortgage | With Mortgage |
| Less than $50,000 | 467 (16.6%) | 128 (8.4%) |
| $50,000 to $99,999 | 767 (27.2%) | 362 (23.7%) |
| $100,000 to $299,999 | 1,410 (50.0%) | 943 (61.6%) |
| $300,000 to $499,999 | 157 (5.6%) | 86 (5.6%) |
| $500,000 to $749,999 | 17 (0.6%) | 11 (0.7%) |
| $750,000 to $999,999 | 0 (0.0%) | 0 (0.0%) |
| $1,000,000 or more | 0 (0.0%) | 0 (0.0%) |
| Total | 2,818 (100.0%) | 1,530 (100.0%) |
Household Income by Mortgage Status in Barbour County

| Household Income | Without Mortgage | With Mortgage |
| Less than $10,000 | 266 (9.4%) | 90 (5.9%) |
| $10,000 to $24,999 | 533 (18.9%) | 34 (2.2%) |
| $25,000 to $34,999 | 383 (13.6%) | 136 (8.9%) |
| $35,000 to $49,999 | 602 (21.4%) | 153 (10.0%) |
| $50,000 to $74,999 | 479 (17.0%) | 253 (16.5%) |
| $75,000 to $99,999 | 116 (4.1%) | 306 (20.0%) |
| $100,000 to $149,999 | 273 (9.7%) | 191 (12.5%) |
| $150,000 or more | 166 (5.9%) | 293 (19.2%) |
| Total | 2,818 (100.0%) | 1,530 (100.0%) |
Property Value to Household Income Ratio in Barbour County

| Value-to-Income Ratio | Without Mortgage | With Mortgage |
| Less than 2.0x | 1,014 (36.0%) | 68,257 (4,461.2%) |
| 2.0x to 2.9x | 491 (17.4%) | 701 (45.8%) |
| 3.0x to 3.9x | 233 (8.3%) | 303 (19.8%) |
| 4.0x or more | 1,047 (37.1%) | 142 (9.3%) |
| Total | 2,818 (100.0%) | 1,530 (100.0%) |
Real Estate Taxes by Mortgage Status in Barbour County

| Property Taxes | Without Mortgage | With Mortgage |
| Less than $800 | 2,130 (75.6%) | 11 (0.7%) |
| $800 to $1,499 | 449 (15.9%) | 1,033 (67.5%) |
| $800 to $1,499 | 69 (2.5%) | 331 (21.6%) |
| Total | 2,818 (100.0%) | 1,530 (100.0%) |
Health & Disability in Barbour County
Health Insurance Coverage by Age in Barbour County

| Age Bracket | With Coverage | Without Coverage |
| Under 6 Years | 908 (100.0%) | 0 (0.0%) |
| 6 to 18 Years | 2,642 (100.0%) | 0 (0.0%) |
| 19 to 25 Years | 1,359 (92.6%) | 109 (7.4%) |
| 26 to 34 Years | 1,451 (95.0%) | 77 (5.0%) |
| 35 to 44 Years | 1,461 (86.0%) | 238 (14.0%) |
| 45 to 54 Years | 1,612 (83.5%) | 318 (16.5%) |
| 55 to 64 Years | 2,012 (95.0%) | 105 (5.0%) |
| 65 to 74 Years | 1,902 (100.0%) | 0 (0.0%) |
| 75 Years and older | 1,166 (100.0%) | 0 (0.0%) |
| Total | 14,513 (94.5%) | 847 (5.5%) |
Health Insurance Coverage by Citizenship Status in Barbour County

| Citizenship Status | With Coverage | Without Coverage |
| Native Born | 908 (100.0%) | 0 (0.0%) |
| Foreign Born, Citizen | 2,642 (100.0%) | 0 (0.0%) |
| Foreign Born, not a Citizen | 1,359 (92.6%) | 109 (7.4%) |
Health Insurance Coverage by Household Income in Barbour County

| Household Income | With Coverage | Without Coverage |
| Under $25,000 | 2,865 (94.7%) | 160 (5.3%) |
| $25,000 to $49,999 | 3,480 (90.2%) | 377 (9.8%) |
| $50,000 to $74,999 | 2,718 (97.7%) | 64 (2.3%) |
| $75,000 to $99,999 | 1,524 (94.5%) | 88 (5.5%) |
| $100,000 and over | 3,482 (95.7%) | 158 (4.3%) |
Public vs Private Health Insurance Coverage by Age in Barbour County

| Age Bracket | Public Insurance | Private Insurance |
| Under 6 | 521 (57.4%) | 387 (42.6%) |
| 6 to 18 Years | 1,265 (47.9%) | 1,405 (53.2%) |
| 19 to 25 Years | 461 (31.4%) | 999 (68.0%) |
| 25 to 34 Years | 575 (37.6%) | 918 (60.1%) |
| 35 to 44 Years | 620 (36.5%) | 901 (53.0%) |
| 45 to 54 Years | 473 (24.5%) | 1,195 (61.9%) |
| 55 to 64 Years | 965 (45.6%) | 1,207 (57.0%) |
| 65 to 74 Years | 1,891 (99.4%) | 1,063 (55.9%) |
| 75 Years and over | 1,116 (95.7%) | 705 (60.5%) |
| Total | 7,887 (51.3%) | 8,780 (57.2%) |
Disability Status by Sex by Age in Barbour County

| Age Bracket | Male | Female |
| Under 5 Years | 0 (0.0%) | 0 (0.0%) |
| 5 to 17 Years | 60 (4.9%) | 98 (8.5%) |
| 18 to 34 Years | 217 (13.1%) | 92 (5.2%) |
| 35 to 64 Years | 500 (17.5%) | 421 (14.5%) |
| 65 to 74 Years | 210 (22.7%) | 233 (23.9%) |
| 75 Years and over | 213 (38.8%) | 294 (47.6%) |
Disability Class by Sex by Age in Barbour County
Disability Class: Hearing Difficulty

| Age Bracket | Male | Female |
| Under 5 Years | 0 (0.0%) | 0 (0.0%) |
| 5 to 17 Years | 15 (1.2%) | 0 (0.0%) |
| 18 to 34 Years | 22 (1.3%) | 0 (0.0%) |
| 35 to 64 Years | 111 (3.9%) | 109 (3.8%) |
| 65 to 74 Years | 127 (13.7%) | 64 (6.6%) |
| 75 Years and over | 110 (20.0%) | 56 (9.1%) |
Disability Class: Vision Difficulty

| Age Bracket | Male | Female |
| Under 5 Years | 0 (0.0%) | 0 (0.0%) |
| 5 to 17 Years | 5 (0.4%) | 4 (0.4%) |
| 18 to 34 Years | 0 (0.0%) | 0 (0.0%) |
| 35 to 64 Years | 35 (1.2%) | 161 (5.6%) |
| 65 to 74 Years | 16 (1.7%) | 0 (0.0%) |
| 75 Years and over | 14 (2.5%) | 49 (7.9%) |
Disability Class: Cognitive Difficulty

| Age Bracket | Male | Female |
| 5 to 17 Years | 40 (3.3%) | 71 (6.1%) |
| 18 to 34 Years | 107 (6.4%) | 89 (5.1%) |
| 35 to 64 Years | 76 (2.7%) | 64 (2.2%) |
| 65 to 74 Years | 67 (7.2%) | 45 (4.6%) |
| 75 Years and over | 38 (6.9%) | 67 (10.9%) |
Disability Class: Ambulatory Difficulty

| Age Bracket | Male | Female |
| 5 to 17 Years | 0 (0.0%) | 4 (0.4%) |
| 18 to 34 Years | 78 (4.7%) | 3 (0.2%) |
| 35 to 64 Years | 379 (13.3%) | 232 (8.0%) |
| 65 to 74 Years | 120 (12.9%) | 150 (15.4%) |
| 75 Years and over | 140 (25.5%) | 225 (36.5%) |
Disability Class: Self-Care Difficulty

| Age Bracket | Male | Female |
| 5 to 17 Years | 0 (0.0%) | 44 (3.8%) |
| 18 to 34 Years | 38 (2.3%) | 0 (0.0%) |
| 35 to 64 Years | 127 (4.5%) | 142 (4.9%) |
| 65 to 74 Years | 11 (1.2%) | 70 (7.2%) |
| 75 Years and over | 26 (4.7%) | 141 (22.9%) |
Technology Access in Barbour County
Computing Device Access in Barbour County

| Device Type | # Households | % Households |
| Desktop or Laptop | 3,649 | 63.0% |
| Smartphone | 4,378 | 75.6% |
| Tablet | 3,180 | 54.9% |
| No Computing Device | 777 | 13.4% |
| Total | 5,789 | 100.0% |
Internet Access in Barbour County

| Internet Type | # Households | % Households |
| Dial-Up Internet | 25 | 0.4% |
| Broadband Home | 3,540 | 61.2% |
| Cellular Data Only | 415 | 7.2% |
| Satellite Internet | 790 | 13.7% |
| No Internet | 1,224 | 21.1% |
| Total | 5,789 | 100.0% |
Barbour County Summary
Barbour County, West Virginia is located in the north-central part of the state, and is bordered by Randolph, Tucker, Upshur, Lewis, and Harrison counties. The county seat is Philippi, and the county was created in 1843 from parts of Harrison, Lewis, and Randolph counties. The county has a total area of 441 square miles, and a population of 16,589 as of the 2010 census.
History
Barbour County was formed in 1843 from parts of Harrison, Lewis, and Randolph counties. The county was named for Philip Pendleton Barbour, a U.S. Supreme Court Justice and Congressman from Virginia. The county was originally part of the Virginia Military District, and was settled by veterans of the Revolutionary War. The first settlers arrived in the area in 1772, and the county was officially established in 1843.
The county was home to several Civil War battles, including the Battle of Philippi, which was the first land battle of the war. The county was also home to the first Confederate victory of the war, at the Battle of Rich Mountain.
Geography
Barbour County is located in the north-central part of West Virginia, and is bordered by Randolph, Tucker, Upshur, Lewis, and Harrison counties. The county has a total area of 441 square miles, and is mostly mountainous, with the Allegheny Mountains running through the county. The Tygart Valley River runs through the county, and the county is home to several state parks, including Audra State Park and Tygart Lake State Park.
Economy
The economy of Barbour County is largely based on agriculture and tourism. The county is home to several farms, and the county is also home to several tourist attractions, including Audra State Park and Tygart Lake State Park. The county is also home to several manufacturing companies, including a paper mill and a furniture factory.
Demographics
As of the 2010 census, Barbour County had a population of 16,589. The population was spread out, with 48.3% male and 51.7% female. The median age was 41.7 years, and the median household income was $35,945. The racial makeup of the county was 95.2% White, 2.3% African American, 0.3% Native American, 0.3% Asian, 0.1% Pacific Islander, 0.5% from other races, and 1.3% from two or more races.
Barbour County is home to several religious denominations, including Baptist, Methodist, Presbyterian, and Catholic. The county is also home to several schools, including Philippi Elementary School, Philip Barbour High School, and Alderson Broaddus University.
Common Questions
What is the Total Population of Barbour County?
Total Population of Barbour County is 15,527.
What is the Total Male Population of Barbour County?
Total Male Population of Barbour County is 7,620.
What is the Total Female Population of Barbour County?
Total Female Population of Barbour County is 7,907.
What is the Ratio of Males per 100 Females in Barbour County?
There are 96.37 Males per 100 Females in Barbour County.
What is the Ratio of Females per 100 Males in Barbour County?
There are 103.77 Females per 100 Males in Barbour County.
What is the Median Population Age in Barbour County?
Median Population Age in Barbour County is 42.6 Years.
What is the Average Family Size in Barbour County
Average Family Size in Barbour County is 3.3 People.
What is the Average Household Size in Barbour County
Average Household Size in Barbour County is 2.6 People.
What is Per Capita Income in Barbour County?
Per Capita income in Barbour County is $24,947.
What is the Median Family Income in Barbour County?
Median Family Income in Barbour County is $55,686.
What is the Median Household income in Barbour County?
Median Household Income in Barbour County is $44,341.
What is Income or Wage Gap in Barbour County?
Income or Wage Gap in Barbour County is 46.7%.
Women in Barbour County earn 53.3 cents for every dollar earned by a man.
What is Family Income Deficit in Barbour County?
Family Income Deficit in Barbour County is $12,570.
Families that are below poverty line in Barbour County earn $12,570 less on average than the poverty threshold level.
What is Inequality or Gini Index in Barbour County?
Inequality or Gini Index in Barbour County is 0.45.
How Large is the Labor Force in Barbour County?
There are 6,379 People in the Labor Forcein in Barbour County.
What is the Percentage of People in the Labor Force in Barbour County?
49.9% of People are in the Labor Force in Barbour County.
What is the Unemployment Rate in Barbour County?
Unemployment Rate in Barbour County is 10.1%.