Zip Codes with the Highest Percentage of Population Employed in Accommodation & Food Services in Port Orchard, WA
RELATED REPORTS & OPTIONS
Accommodation & Food Services
Port Orchard
Compare Zip Codes
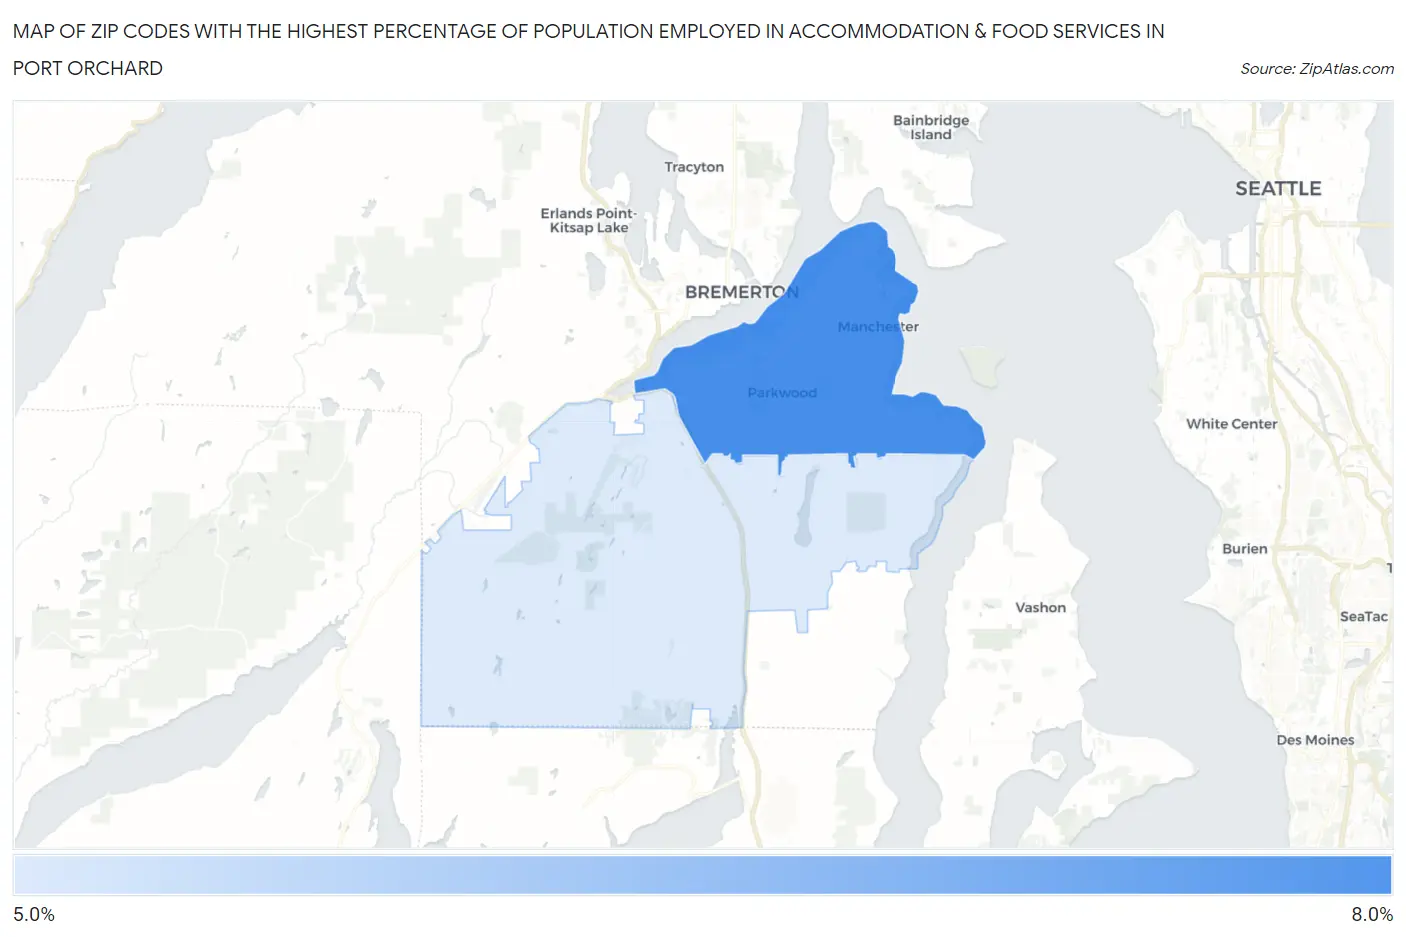
Map of Zip Codes with the Highest Percentage of Population Employed in Accommodation & Food Services in Port Orchard
0.0%
8.0%
Zip Codes with the Highest Percentage of Population Employed in Accommodation & Food Services in Port Orchard, WA
| Zip Code | % Employed | vs State | vs National | |
| 1. | 98366 | 7.9% | 6.5%(+1.45)#148 | 6.9%(+1.03)#7,995 |
| 2. | 98367 | 5.0% | 6.5%(-1.43)#326 | 6.9%(-1.85)#16,722 |
1
Common Questions
What are the Top Zip Codes with the Highest Percentage of Population Employed in Accommodation & Food Services in Port Orchard, WA?
Top Zip Codes with the Highest Percentage of Population Employed in Accommodation & Food Services in Port Orchard, WA are:
What zip code has the Highest Percentage of Population Employed in Accommodation & Food Services in Port Orchard, WA?
98366 has the Highest Percentage of Population Employed in Accommodation & Food Services in Port Orchard, WA with 7.9%.
What is the Percentage of Population Employed in Accommodation & Food Services in Port Orchard, WA?
Percentage of Population Employed in Accommodation & Food Services in Port Orchard is 10.1%.
What is the Percentage of Population Employed in Accommodation & Food Services in Washington?
Percentage of Population Employed in Accommodation & Food Services in Washington is 6.5%.
What is the Percentage of Population Employed in Accommodation & Food Services in the United States?
Percentage of Population Employed in Accommodation & Food Services in the United States is 6.9%.