Zip Codes with the Highest Percentage of Households Heated by Bottled Gas / Liquid Propane in Port Orchard, WA
RELATED REPORTS & OPTIONS
Bottled Gas / LP Heating
Port Orchard
Compare Zip Codes
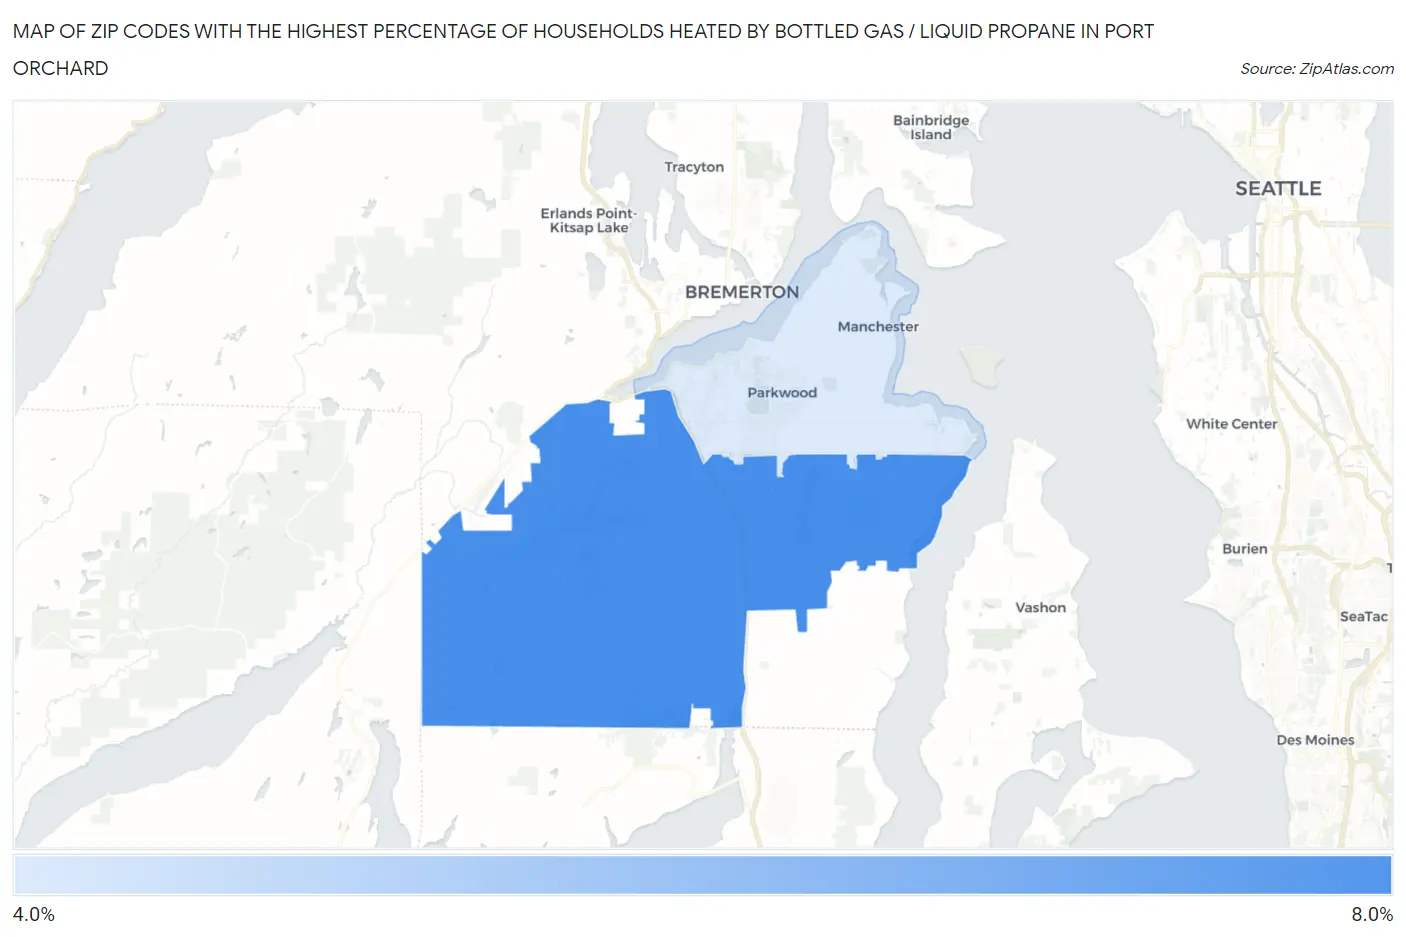
Map of Zip Codes with the Highest Percentage of Households Heated by Bottled Gas / Liquid Propane in Port Orchard
0.0%
8.0%
Zip Codes with the Highest Percentage of Households Heated by Bottled Gas / Liquid Propane in Port Orchard, WA
| Zip Code | Bottled Gas / LP Heating | vs State | vs National | |
| 1. | 98367 | 7.2% | 3.1%(+4.10)#140 | 4.9%(+2.30)#16,578 |
| 2. | 98366 | 4.7% | 3.1%(+1.60)#195 | 4.9%(-0.200)#18,831 |
1
Common Questions
What are the Top Zip Codes with the Highest Percentage of Households Heated by Bottled Gas / Liquid Propane in Port Orchard, WA?
Top Zip Codes with the Highest Percentage of Households Heated by Bottled Gas / Liquid Propane in Port Orchard, WA are:
What zip code has the Highest Percentage of Households Heated by Bottled Gas / Liquid Propane in Port Orchard, WA?
98367 has the Highest Percentage of Households Heated by Bottled Gas / Liquid Propane in Port Orchard, WA with 7.2%.
What is the Percentage of Households Heated by Bottled Gas / Liquid Propane in Port Orchard, WA?
Percentage of Households Heated by Bottled Gas / Liquid Propane in Port Orchard is 2.1%.
What is the Percentage of Households Heated by Bottled Gas / Liquid Propane in Washington?
Percentage of Households Heated by Bottled Gas / Liquid Propane in Washington is 3.1%.
What is the Percentage of Households Heated by Bottled Gas / Liquid Propane in the United States?
Percentage of Households Heated by Bottled Gas / Liquid Propane in the United States is 4.9%.