Zip Codes with the Highest Percentage of Population Employed in Real Estate, Rental & Leasing in Kennewick, WA
RELATED REPORTS & OPTIONS
Real Estate, Rental & Leasing
Kennewick
Compare Zip Codes
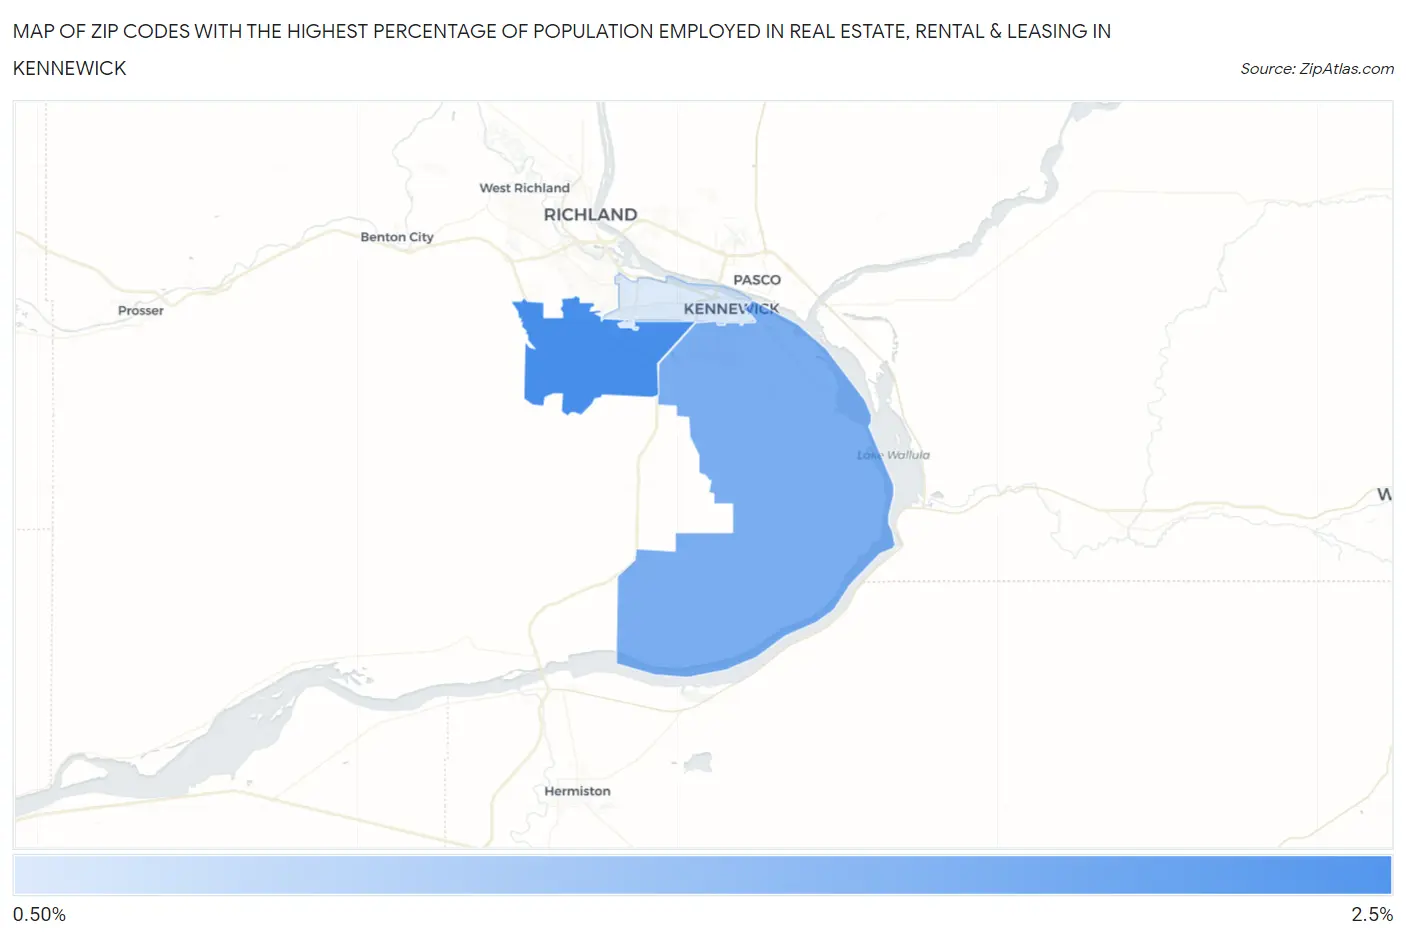
Map of Zip Codes with the Highest Percentage of Population Employed in Real Estate, Rental & Leasing in Kennewick
0.0%
2.5%
Zip Codes with the Highest Percentage of Population Employed in Real Estate, Rental & Leasing in Kennewick, WA
| Zip Code | % Employed | vs State | vs National | |
| 1. | 99338 | 2.3% | 2.1%(+0.245)#168 | 1.9%(+0.450)#6,130 |
| 2. | 99337 | 2.0% | 2.1%(-0.130)#228 | 1.9%(+0.075)#8,029 |
| 3. | 99336 | 1.2% | 2.1%(-0.854)#337 | 1.9%(-0.648)#13,133 |
1
Common Questions
What are the Top Zip Codes with the Highest Percentage of Population Employed in Real Estate, Rental & Leasing in Kennewick, WA?
Top Zip Codes with the Highest Percentage of Population Employed in Real Estate, Rental & Leasing in Kennewick, WA are:
What zip code has the Highest Percentage of Population Employed in Real Estate, Rental & Leasing in Kennewick, WA?
99338 has the Highest Percentage of Population Employed in Real Estate, Rental & Leasing in Kennewick, WA with 2.3%.
What is the Percentage of Population Employed in Real Estate, Rental & Leasing in Kennewick, WA?
Percentage of Population Employed in Real Estate, Rental & Leasing in Kennewick is 1.5%.
What is the Percentage of Population Employed in Real Estate, Rental & Leasing in Washington?
Percentage of Population Employed in Real Estate, Rental & Leasing in Washington is 2.1%.
What is the Percentage of Population Employed in Real Estate, Rental & Leasing in the United States?
Percentage of Population Employed in Real Estate, Rental & Leasing in the United States is 1.9%.