Zip Codes with the Highest Percentage of Population with a Degree in Physical and Health Sciences in Kennewick, WA
RELATED REPORTS & OPTIONS
Physical and Health Sciences
Kennewick
Compare Zip Codes
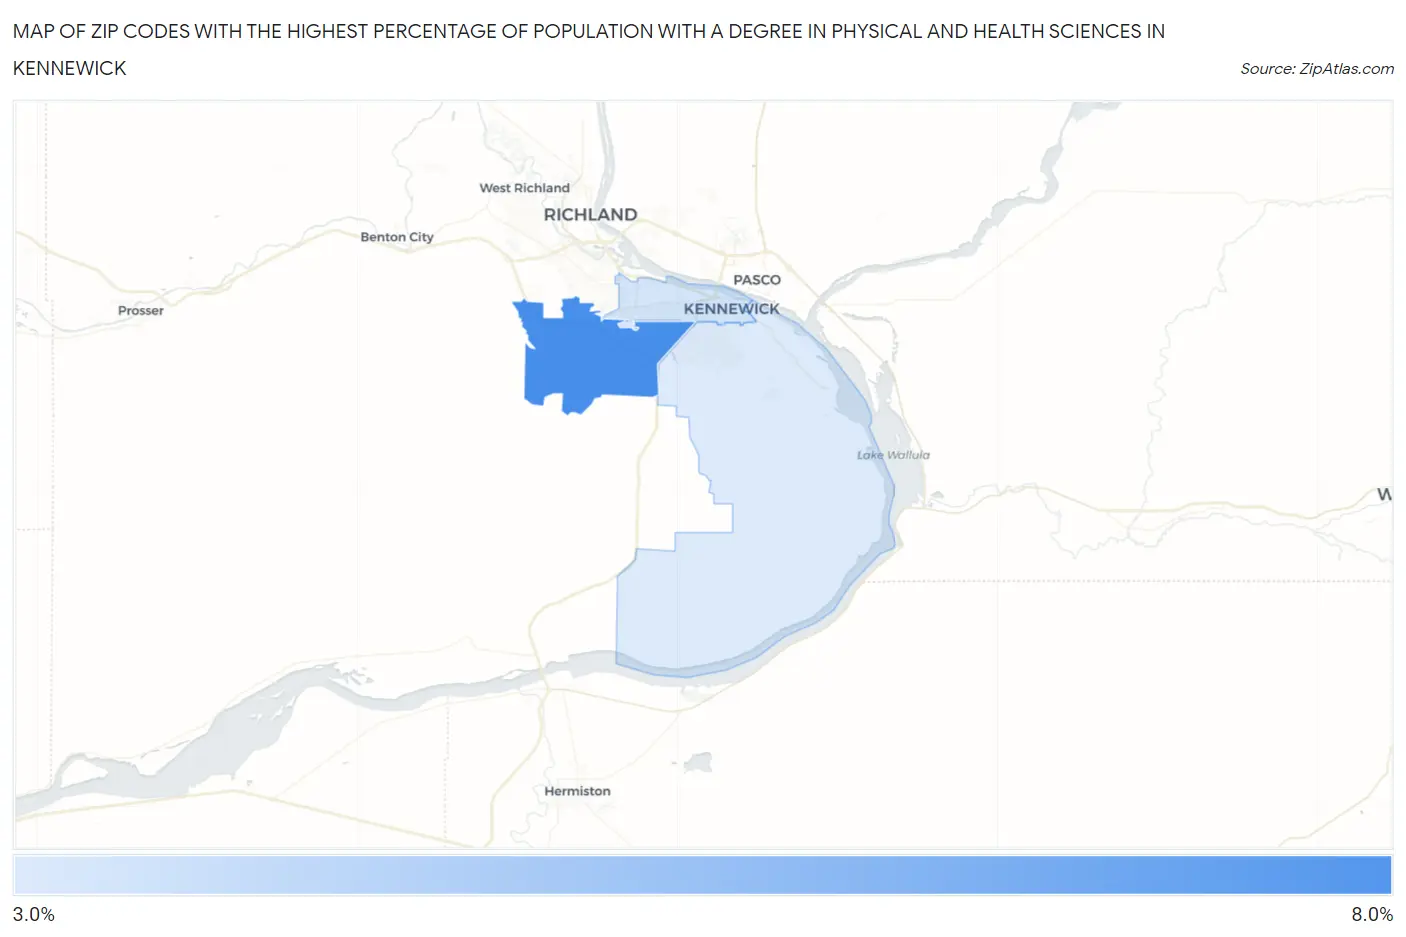
Map of Zip Codes with the Highest Percentage of Population with a Degree in Physical and Health Sciences in Kennewick
0.0%
8.0%
Zip Codes with the Highest Percentage of Population with a Degree in Physical and Health Sciences in Kennewick, WA
| Zip Code | % Graduates | vs State | vs National | |
| 1. | 99338 | 6.5% | 3.4%(+3.12)#62 | 3.1%(+3.39)#2,835 |
| 2. | 99336 | 3.5% | 3.4%(+0.152)#197 | 3.1%(+0.424)#8,345 |
| 3. | 99337 | 3.3% | 3.4%(-0.046)#218 | 3.1%(+0.226)#9,102 |
1
Common Questions
What are the Top Zip Codes with the Highest Percentage of Population with a Degree in Physical and Health Sciences in Kennewick, WA?
Top Zip Codes with the Highest Percentage of Population with a Degree in Physical and Health Sciences in Kennewick, WA are:
What zip code has the Highest Percentage of Population with a Degree in Physical and Health Sciences in Kennewick, WA?
99338 has the Highest Percentage of Population with a Degree in Physical and Health Sciences in Kennewick, WA with 6.5%.
What is the Percentage of Population with a Degree in Physical and Health Sciences in Kennewick, WA?
Percentage of Population with a Degree in Physical and Health Sciences in Kennewick is 3.9%.
What is the Percentage of Population with a Degree in Physical and Health Sciences in Washington?
Percentage of Population with a Degree in Physical and Health Sciences in Washington is 3.4%.
What is the Percentage of Population with a Degree in Physical and Health Sciences in the United States?
Percentage of Population with a Degree in Physical and Health Sciences in the United States is 3.1%.