Zip Codes with the Highest Percentage of Population Employed in Accommodation & Food Services in Kennewick, WA
RELATED REPORTS & OPTIONS
Accommodation & Food Services
Kennewick
Compare Zip Codes
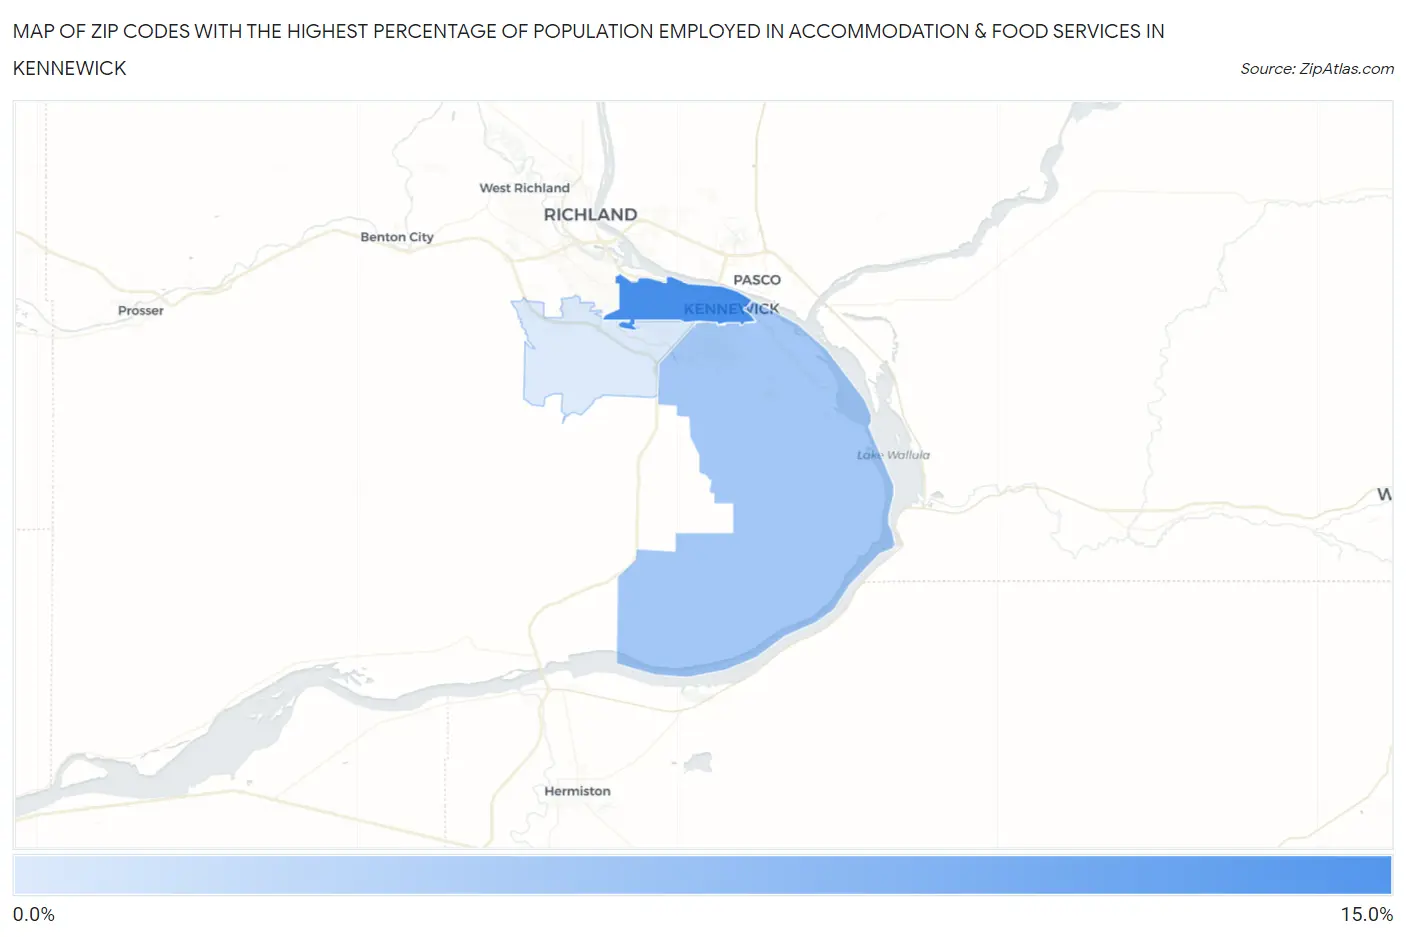
Map of Zip Codes with the Highest Percentage of Population Employed in Accommodation & Food Services in Kennewick
0.0%
15.0%
Zip Codes with the Highest Percentage of Population Employed in Accommodation & Food Services in Kennewick, WA
| Zip Code | % Employed | vs State | vs National | |
| 1. | 99336 | 10.0% | 6.5%(+3.56)#80 | 6.9%(+3.15)#4,499 |
| 2. | 99337 | 6.3% | 6.5%(-0.193)#248 | 6.9%(-0.612)#12,580 |
| 3. | 99338 | 4.0% | 6.5%(-2.43)#396 | 6.9%(-2.85)#20,043 |
1
Common Questions
What are the Top Zip Codes with the Highest Percentage of Population Employed in Accommodation & Food Services in Kennewick, WA?
Top Zip Codes with the Highest Percentage of Population Employed in Accommodation & Food Services in Kennewick, WA are:
What zip code has the Highest Percentage of Population Employed in Accommodation & Food Services in Kennewick, WA?
99336 has the Highest Percentage of Population Employed in Accommodation & Food Services in Kennewick, WA with 10.0%.
What is the Percentage of Population Employed in Accommodation & Food Services in Kennewick, WA?
Percentage of Population Employed in Accommodation & Food Services in Kennewick is 7.9%.
What is the Percentage of Population Employed in Accommodation & Food Services in Washington?
Percentage of Population Employed in Accommodation & Food Services in Washington is 6.5%.
What is the Percentage of Population Employed in Accommodation & Food Services in the United States?
Percentage of Population Employed in Accommodation & Food Services in the United States is 6.9%.