Zip Codes with the Highest Percentage of Population with a Degree in Physical and Health Sciences in Bellingham, WA
RELATED REPORTS & OPTIONS
Physical and Health Sciences
Bellingham
Compare Zip Codes
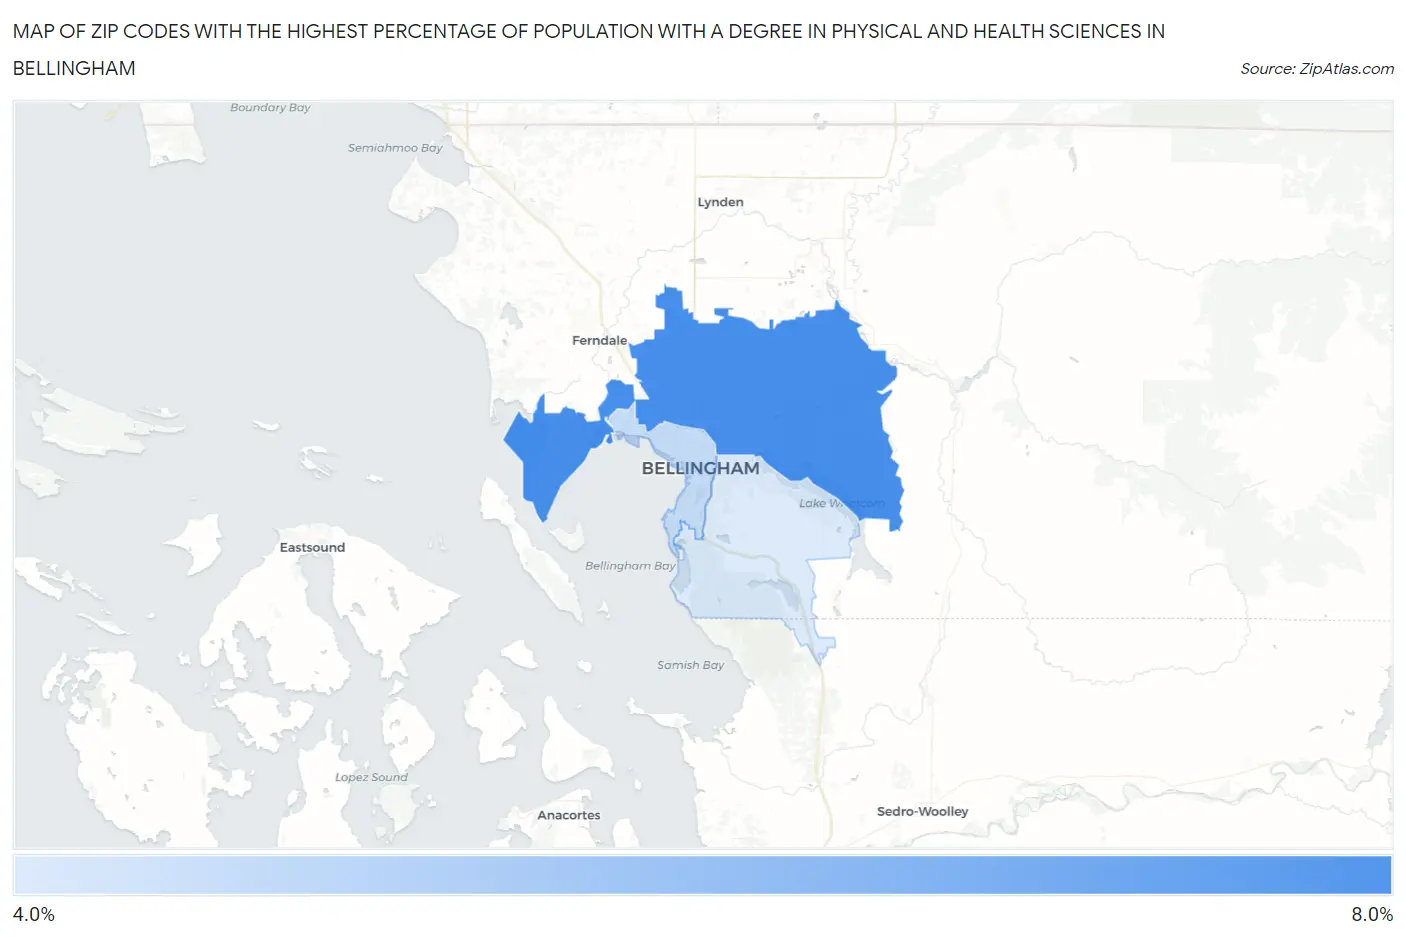
Map of Zip Codes with the Highest Percentage of Population with a Degree in Physical and Health Sciences in Bellingham
0.0%
8.0%
Zip Codes with the Highest Percentage of Population with a Degree in Physical and Health Sciences in Bellingham, WA
| Zip Code | % Graduates | vs State | vs National | |
| 1. | 98226 | 6.5% | 3.4%(+3.11)#64 | 3.1%(+3.38)#2,846 |
| 2. | 98225 | 4.6% | 3.4%(+1.23)#118 | 3.1%(+1.50)#5,311 |
| 3. | 98229 | 4.3% | 3.4%(+0.907)#138 | 3.1%(+1.18)#6,006 |
1
Common Questions
What are the Top Zip Codes with the Highest Percentage of Population with a Degree in Physical and Health Sciences in Bellingham, WA?
Top Zip Codes with the Highest Percentage of Population with a Degree in Physical and Health Sciences in Bellingham, WA are:
What zip code has the Highest Percentage of Population with a Degree in Physical and Health Sciences in Bellingham, WA?
98226 has the Highest Percentage of Population with a Degree in Physical and Health Sciences in Bellingham, WA with 6.5%.
What is the Percentage of Population with a Degree in Physical and Health Sciences in Bellingham, WA?
Percentage of Population with a Degree in Physical and Health Sciences in Bellingham is 5.2%.
What is the Percentage of Population with a Degree in Physical and Health Sciences in Washington?
Percentage of Population with a Degree in Physical and Health Sciences in Washington is 3.4%.
What is the Percentage of Population with a Degree in Physical and Health Sciences in the United States?
Percentage of Population with a Degree in Physical and Health Sciences in the United States is 3.1%.