Zip Codes with the Highest Percentage of Population Employed in Arts, Entertainment & Recreation in Bellingham, WA
RELATED REPORTS & OPTIONS
Arts, Entertainment & Recreation
Bellingham
Compare Zip Codes
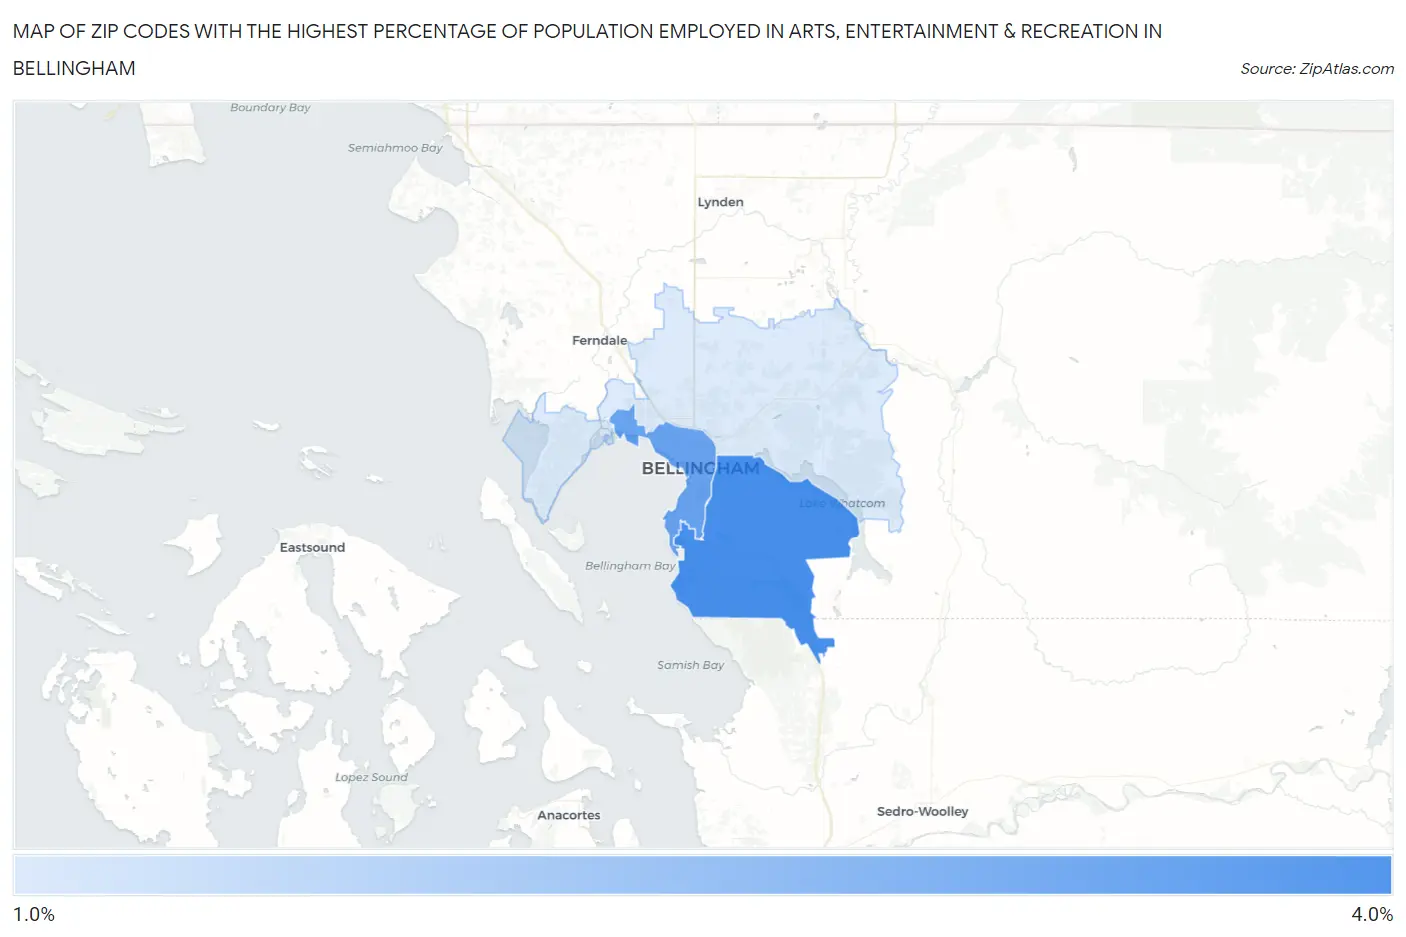
Map of Zip Codes with the Highest Percentage of Population Employed in Arts, Entertainment & Recreation in Bellingham
0.0%
4.0%
Zip Codes with the Highest Percentage of Population Employed in Arts, Entertainment & Recreation in Bellingham, WA
| Zip Code | % Employed | vs State | vs National | |
| 1. | 98229 | 3.7% | 2.1%(+1.54)#91 | 2.1%(+1.60)#3,802 |
| 2. | 98225 | 3.3% | 2.1%(+1.11)#125 | 2.1%(+1.18)#4,663 |
| 3. | 98226 | 1.7% | 2.1%(-0.488)#296 | 2.1%(-0.424)#12,028 |
1
Common Questions
What are the Top Zip Codes with the Highest Percentage of Population Employed in Arts, Entertainment & Recreation in Bellingham, WA?
Top Zip Codes with the Highest Percentage of Population Employed in Arts, Entertainment & Recreation in Bellingham, WA are:
What zip code has the Highest Percentage of Population Employed in Arts, Entertainment & Recreation in Bellingham, WA?
98229 has the Highest Percentage of Population Employed in Arts, Entertainment & Recreation in Bellingham, WA with 3.7%.
What is the Percentage of Population Employed in Arts, Entertainment & Recreation in Bellingham, WA?
Percentage of Population Employed in Arts, Entertainment & Recreation in Bellingham is 3.1%.
What is the Percentage of Population Employed in Arts, Entertainment & Recreation in Washington?
Percentage of Population Employed in Arts, Entertainment & Recreation in Washington is 2.1%.
What is the Percentage of Population Employed in Arts, Entertainment & Recreation in the United States?
Percentage of Population Employed in Arts, Entertainment & Recreation in the United States is 2.1%.