Norwegian vs Immigrants from South Central Asia 3 or more Vehicles in Household

COMPARE

Norwegian
Race
Ancestry
AfghanAfricanAlaska NativeAlaskan AthabascanAlbanianAleutAlsatianAmericanApacheArabArapahoArgentineanArmenianAssyrian/Chaldean/SyriacAustralianAustrianBahamianBangladeshiBarbadianBasqueBelgianBelizeanBermudanBhutaneseBlackfeetBolivianBrazilianBritishBritish West IndianBulgarianBurmeseCajunCambodianCanadianCape VerdeanCarpatho RusynCelticCentral AmericanCentral American IndianCherokeeCheyenneChickasawChileanChineseChippewaChoctawColombianColvilleComancheCosta RicanCreeCreekCroatianCrowCubanCypriotCzechCzechoslovakianDanishDelawareDominicanDutchDutch West IndianEastern EuropeanEcuadorianEgyptianEnglishEstonianEthiopianEuropeanFijianFilipinoFinnishFrenchFrench American IndianFrench CanadianGermanGerman RussianGhanaianGreekGuamanian/ChamorroGuatemalanGuyaneseHaitianHmongHonduranHopiHoumaHungarianIcelanderIndian (Asian)IndonesianInupiatIranianIraqiIrishIroquoisIsraeliItalianJamaicanJapaneseJordanianKenyanKiowaKoreanLaotianLatvianLebaneseLiberianLithuanianLumbeeLuxembourgerMacedonianMalaysianMalteseMarshalleseMenomineeMexicanMexican American IndianMongolianMoroccanNative HawaiianNavajoNepaleseNew ZealanderNicaraguanNigerianNorthern EuropeanNorwegianOkinawanOsageOttawaPaiutePakistaniPalestinianPanamanianParaguayanPennsylvania GermanPeruvianPimaPolishPortuguesePotawatomiPuebloPuerto RicanPuget Sound SalishRomanianRussianSalvadoranSamoanScandinavianScotch-IrishScottishSeminoleSenegaleseSerbianShoshoneSierra LeoneanSiouxSlavicSlovakSloveneSomaliSouth AfricanSouth AmericanSouth American IndianSoviet UnionSpaniardSpanishSpanish AmericanSpanish American IndianSri LankanSubsaharan AfricanSudaneseSwedishSwissSyrianTaiwaneseThaiTlingit-HaidaTohono O'OdhamTonganTrinidadian and TobagonianTsimshianTurkishU.S. Virgin IslanderUgandanUkrainianUruguayanUteVenezuelanVietnameseWelshWest IndianYakamaYaquiYugoslavianYumanYup'ikZimbabwean
Immigration
NonimmigrantsImmigrantsAfghanistanAfricaAlbaniaArgentinaArmeniaAsiaAustraliaAustriaBahamasBangladeshBarbadosBelarusBelgiumBelizeBoliviaBosnia and HerzegovinaBrazilBulgariaBurma/MyanmarCabo VerdeCambodiaCameroonCanadaCaribbeanCentral AmericaChileChinaColombiaCongoCosta RicaCroatiaCubaCzechoslovakiaDenmarkDominicaDominican RepublicEastern AfricaEastern AsiaEastern EuropeEcuadorEgyptEl SalvadorEnglandEritreaEthiopiaEuropeFijiFranceGermanyGhanaGreeceGrenadaGuatemalaGuyanaHaitiHondurasHong KongHungaryIndiaIndonesiaIranIraqIrelandIsraelItalyJamaicaJapanJordanKazakhstanKenyaKoreaKuwaitLaosLatin AmericaLatviaLebanonLiberiaLithuaniaMalaysiaMexicoMicronesiaMiddle AfricaMoldovaMoroccoNepalNetherlandsNicaraguaNigeriaNorth AmericaNorth MacedoniaNorthern AfricaNorthern EuropeNorwayOceaniaPakistanPanamaPeruPhilippinesPolandPortugalRomaniaRussiaSaudi ArabiaScotlandSenegalSerbiaSierra LeoneSingaporeSomaliaSouth AfricaSouth AmericaSouth Eastern AsiaSouthern EuropeSpainSri LankaSt. Vincent and the GrenadinesSudanSwedenSwitzerlandSyriaTaiwanThailandTrinidad and TobagoTurkeyUgandaUkraineUruguayUzbekistanVenezuelaVietnamWest IndiesWestern AfricaWestern AsiaWestern EuropeYemenZaireZimbabweAzores
Immigrants from South Central Asia
Race
Ancestry
AfghanAfricanAlaska NativeAlaskan AthabascanAlbanianAleutAlsatianAmericanApacheArabArapahoArgentineanArmenianAssyrian/Chaldean/SyriacAustralianAustrianBahamianBangladeshiBarbadianBasqueBelgianBelizeanBermudanBhutaneseBlackfeetBolivianBrazilianBritishBritish West IndianBulgarianBurmeseCajunCambodianCanadianCape VerdeanCarpatho RusynCelticCentral AmericanCentral American IndianCherokeeCheyenneChickasawChileanChineseChippewaChoctawColombianColvilleComancheCosta RicanCreeCreekCroatianCrowCubanCypriotCzechCzechoslovakianDanishDelawareDominicanDutchDutch West IndianEastern EuropeanEcuadorianEgyptianEnglishEstonianEthiopianEuropeanFijianFilipinoFinnishFrenchFrench American IndianFrench CanadianGermanGerman RussianGhanaianGreekGuamanian/ChamorroGuatemalanGuyaneseHaitianHmongHonduranHopiHoumaHungarianIcelanderIndian (Asian)IndonesianInupiatIranianIraqiIrishIroquoisIsraeliItalianJamaicanJapaneseJordanianKenyanKiowaKoreanLaotianLatvianLebaneseLiberianLithuanianLumbeeLuxembourgerMacedonianMalaysianMalteseMarshalleseMenomineeMexicanMexican American IndianMongolianMoroccanNative HawaiianNavajoNepaleseNew ZealanderNicaraguanNigerianNorthern EuropeanOkinawanOsageOttawaPaiutePakistaniPalestinianPanamanianParaguayanPennsylvania GermanPeruvianPimaPolishPortuguesePotawatomiPuebloPuerto RicanPuget Sound SalishRomanianRussianSalvadoranSamoanScandinavianScotch-IrishScottishSeminoleSenegaleseSerbianShoshoneSierra LeoneanSiouxSlavicSlovakSloveneSomaliSouth AfricanSouth AmericanSouth American IndianSoviet UnionSpaniardSpanishSpanish AmericanSpanish American IndianSri LankanSubsaharan AfricanSudaneseSwedishSwissSyrianTaiwaneseThaiTlingit-HaidaTohono O'OdhamTonganTrinidadian and TobagonianTsimshianTurkishU.S. Virgin IslanderUgandanUkrainianUruguayanUteVenezuelanVietnameseWelshWest IndianYakamaYaquiYugoslavianYumanYup'ikZimbabwean
Immigration
NonimmigrantsImmigrantsAfghanistanAfricaAlbaniaArgentinaArmeniaAsiaAustraliaAustriaBahamasBangladeshBarbadosBelarusBelgiumBelizeBoliviaBosnia and HerzegovinaBrazilBulgariaBurma/MyanmarCabo VerdeCambodiaCameroonCanadaCaribbeanCentral AmericaChileChinaColombiaCongoCosta RicaCroatiaCubaCzechoslovakiaDenmarkDominicaDominican RepublicEastern AfricaEastern AsiaEastern EuropeEcuadorEgyptEl SalvadorEnglandEritreaEthiopiaEuropeFijiFranceGermanyGhanaGreeceGrenadaGuatemalaGuyanaHaitiHondurasHong KongHungaryIndiaIndonesiaIranIraqIrelandIsraelItalyJamaicaJapanJordanKazakhstanKenyaKoreaKuwaitLaosLatin AmericaLatviaLebanonLiberiaLithuaniaMalaysiaMexicoMicronesiaMiddle AfricaMoldovaMoroccoNepalNetherlandsNicaraguaNigeriaNorth AmericaNorth MacedoniaNorthern AfricaNorthern EuropeNorwayOceaniaPakistanPanamaPeruPhilippinesPolandPortugalRomaniaRussiaSaudi ArabiaScotlandSenegalSerbiaSierra LeoneSingaporeSomaliaSouth AfricaSouth AmericaSouth Central AsiaSouth Eastern AsiaSouthern EuropeSpainSri LankaSt. Vincent and the GrenadinesSudanSwedenSwitzerlandSyriaTaiwanThailandTrinidad and TobagoTurkeyUgandaUkraineUruguayUzbekistanVenezuelaVietnamWest IndiesWestern AfricaWestern AsiaWestern EuropeYemenZaireZimbabweAzores
3 or more Vehicles in Household
Income
Poverty
Unemployment
Labor Participation
Family Structure
Vehicle Availability
Education Level
Disability

3 or more Vehicles in Household Comparison

Norwegians

Immigrants from South Central Asia

Exceptional
Fair
23.9%
3 OR MORE VEHICLES IN HOUSEHOLD
100.0/ 100
METRIC RATING
18th/ 347
METRIC RANK
19.3%
3 OR MORE VEHICLES IN HOUSEHOLD
38.9/ 100
METRIC RATING
179th/ 347
METRIC RANK

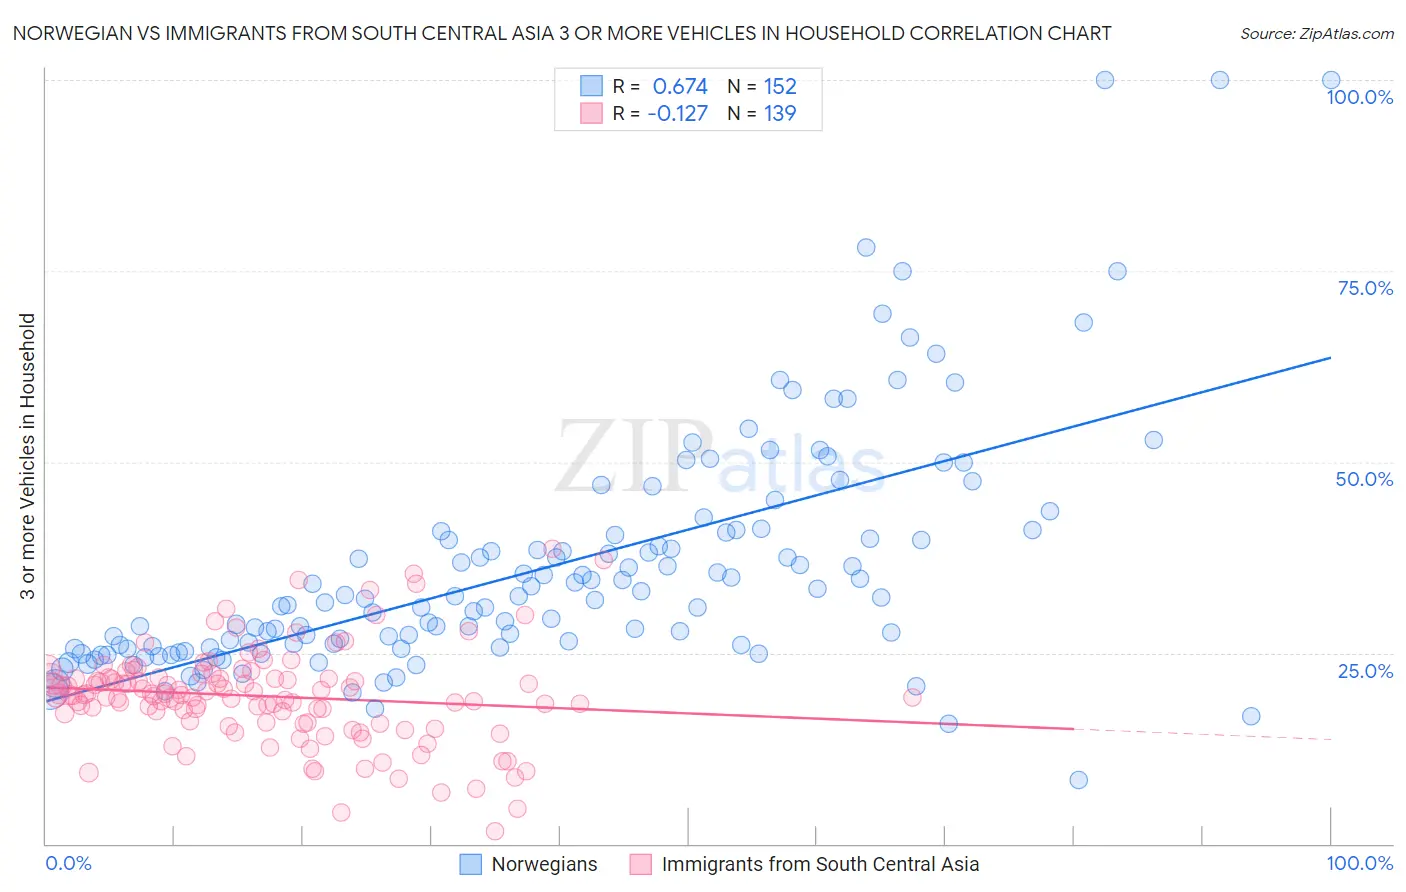
Norwegian vs Immigrants from South Central Asia 3 or more Vehicles in Household Correlation Chart

The statistical analysis conducted on geographies consisting of 532,701,273 people shows a significant positive correlation between the proportion of Norwegians and percentage of households with 3 or more vehicles available in the United States with a correlation coefficient (R) of 0.674 and weighted average of 23.9%. Similarly, the statistical analysis conducted on geographies consisting of 472,461,759 people shows a poor negative correlation between the proportion of Immigrants from South Central Asia and percentage of households with 3 or more vehicles available in the United States with a correlation coefficient (R) of -0.127 and weighted average of 19.3%, a difference of 23.5%.
Norwegian vs Immigrants from South Central Asia 3 or more Vehicles in Household

3 or more Vehicles in Household Correlation Summary

MeasurementNorwegianImmigrants from South Central Asia
Minimum8.3%1.7%
Maximum100.0%38.7%
Range91.7%37.0%
Mean36.1%19.3%
Median32.0%19.5%
Interquartile 25% (IQ1)25.7%15.9%
Interquartile 75% (IQ3)40.6%21.7%
Interquartile Range (IQR)14.8%5.8%
Standard Deviation (Sample)15.8%6.3%
Standard Deviation (Population)15.7%6.2%

Similar Demographics by 3 or more Vehicles in Household

Demographics Similar to Norwegians by 3 or more Vehicles in Household

In terms of 3 or more vehicles in household, the demographic groups most similar to Norwegians are Chinese (23.9%, a difference of 0.030%), Paiute (23.8%, a difference of 0.33%), Immigrants from Vietnam (23.8%, a difference of 0.45%), Immigrants from Philippines (23.8%, a difference of 0.51%), and Korean (24.1%, a difference of 0.79%).
DemographicsRating | Rank3 or more Vehicles in Household
Shoshone
100.0
/100
|
#11
Exceptional
24.9%
Danes
100.0
/100
|
#12
Exceptional
24.7%
Mexicans
100.0
/100
|
#13
Exceptional
24.7%
Immigrants | Mexico
100.0
/100
|
#14
Exceptional
24.6%
Hawaiians
100.0
/100
|
#15
Exceptional
24.3%
Basques
100.0
/100
|
#16
Exceptional
24.3%
Koreans
100.0
/100
|
#17
Exceptional
24.1%
Norwegians
100.0
/100
|
#18
Exceptional
23.9%
Chinese
100.0
/100
|
#19
Exceptional
23.9%
Paiute
100.0
/100
|
#20
Exceptional
23.8%
Immigrants | Vietnam
100.0
/100
|
#21
Exceptional
23.8%
Immigrants | Philippines
100.0
/100
|
#22
Exceptional
23.8%
Scandinavians
100.0
/100
|
#23
Exceptional
23.6%
Sri Lankans
100.0
/100
|
#24
Exceptional
23.6%
Immigrants | Central America
100.0
/100
|
#25
Exceptional
23.4%

Demographics Similar to Immigrants from South Central Asia by 3 or more Vehicles in Household

In terms of 3 or more vehicles in household, the demographic groups most similar to Immigrants from South Central Asia are Immigrants from Syria (19.4%, a difference of 0.11%), South African (19.3%, a difference of 0.11%), Romanian (19.3%, a difference of 0.15%), Immigrants from Peru (19.4%, a difference of 0.17%), and Cuban (19.3%, a difference of 0.19%).
DemographicsRating | Rank3 or more Vehicles in Household
Kiowa
50.9
/100
|
#172
Average
19.5%
Immigrants | Northern Europe
50.2
/100
|
#173
Average
19.5%
Immigrants | South Africa
50.0
/100
|
#174
Average
19.5%
Syrians
47.0
/100
|
#175
Average
19.5%
Iroquois
46.0
/100
|
#176
Average
19.4%
Immigrants | Peru
41.1
/100
|
#177
Average
19.4%
Immigrants | Syria
40.3
/100
|
#178
Average
19.4%
Immigrants | South Central Asia
38.9
/100
|
#179
Fair
19.3%
South Africans
37.5
/100
|
#180
Fair
19.3%
Romanians
37.1
/100
|
#181
Fair
19.3%
Cubans
36.6
/100
|
#182
Fair
19.3%
Cajuns
36.0
/100
|
#183
Fair
19.3%
Latvians
35.7
/100
|
#184
Fair
19.3%
Immigrants | Sri Lanka
30.7
/100
|
#185
Fair
19.2%
Immigrants | Sweden
29.0
/100
|
#186
Fair
19.2%