Nepalese vs Immigrants from Sri Lanka 2 or more Vehicles in Household

COMPARE

Nepalese
Race
Ancestry
AfghanAfricanAlaska NativeAlaskan AthabascanAlbanianAleutAlsatianAmericanApacheArabArapahoArgentineanArmenianAssyrian/Chaldean/SyriacAustralianAustrianBahamianBangladeshiBarbadianBasqueBelgianBelizeanBermudanBhutaneseBlackfeetBolivianBrazilianBritishBritish West IndianBulgarianBurmeseCajunCambodianCanadianCape VerdeanCarpatho RusynCelticCentral AmericanCentral American IndianCherokeeCheyenneChickasawChileanChineseChippewaChoctawColombianColvilleComancheCosta RicanCreeCreekCroatianCrowCubanCypriotCzechCzechoslovakianDanishDelawareDominicanDutchDutch West IndianEastern EuropeanEcuadorianEgyptianEnglishEstonianEthiopianEuropeanFijianFilipinoFinnishFrenchFrench American IndianFrench CanadianGermanGerman RussianGhanaianGreekGuamanian/ChamorroGuatemalanGuyaneseHaitianHmongHonduranHopiHoumaHungarianIcelanderIndian (Asian)IndonesianInupiatIranianIraqiIrishIroquoisIsraeliItalianJamaicanJapaneseJordanianKenyanKiowaKoreanLaotianLatvianLebaneseLiberianLithuanianLumbeeLuxembourgerMacedonianMalaysianMalteseMarshalleseMenomineeMexicanMexican American IndianMongolianMoroccanNative HawaiianNavajoNepaleseNew ZealanderNicaraguanNigerianNorthern EuropeanNorwegianOkinawanOsageOttawaPaiutePakistaniPalestinianPanamanianParaguayanPennsylvania GermanPeruvianPimaPolishPortuguesePotawatomiPuebloPuerto RicanPuget Sound SalishRomanianRussianSalvadoranSamoanScandinavianScotch-IrishScottishSeminoleSenegaleseSerbianShoshoneSierra LeoneanSiouxSlavicSlovakSloveneSomaliSouth AfricanSouth AmericanSouth American IndianSoviet UnionSpaniardSpanishSpanish AmericanSpanish American IndianSri LankanSubsaharan AfricanSudaneseSwedishSwissSyrianTaiwaneseThaiTlingit-HaidaTohono O'OdhamTonganTrinidadian and TobagonianTsimshianTurkishU.S. Virgin IslanderUgandanUkrainianUruguayanUteVenezuelanVietnameseWelshWest IndianYakamaYaquiYugoslavianYumanYup'ikZimbabwean
Immigration
NonimmigrantsImmigrantsAfghanistanAfricaAlbaniaArgentinaArmeniaAsiaAustraliaAustriaBahamasBangladeshBarbadosBelarusBelgiumBelizeBoliviaBosnia and HerzegovinaBrazilBulgariaBurma/MyanmarCabo VerdeCambodiaCameroonCanadaCaribbeanCentral AmericaChileChinaColombiaCongoCosta RicaCroatiaCubaCzechoslovakiaDenmarkDominicaDominican RepublicEastern AfricaEastern AsiaEastern EuropeEcuadorEgyptEl SalvadorEnglandEritreaEthiopiaEuropeFijiFranceGermanyGhanaGreeceGrenadaGuatemalaGuyanaHaitiHondurasHong KongHungaryIndiaIndonesiaIranIraqIrelandIsraelItalyJamaicaJapanJordanKazakhstanKenyaKoreaKuwaitLaosLatin AmericaLatviaLebanonLiberiaLithuaniaMalaysiaMexicoMicronesiaMiddle AfricaMoldovaMoroccoNepalNetherlandsNicaraguaNigeriaNorth AmericaNorth MacedoniaNorthern AfricaNorthern EuropeNorwayOceaniaPakistanPanamaPeruPhilippinesPolandPortugalRomaniaRussiaSaudi ArabiaScotlandSenegalSerbiaSierra LeoneSingaporeSomaliaSouth AfricaSouth AmericaSouth Central AsiaSouth Eastern AsiaSouthern EuropeSpainSt. Vincent and the GrenadinesSudanSwedenSwitzerlandSyriaTaiwanThailandTrinidad and TobagoTurkeyUgandaUkraineUruguayUzbekistanVenezuelaVietnamWest IndiesWestern AfricaWestern AsiaWestern EuropeYemenZaireZimbabweAzores
Immigrants from Sri Lanka
Race
Ancestry
AfghanAfricanAlaska NativeAlaskan AthabascanAlbanianAleutAlsatianAmericanApacheArabArapahoArgentineanArmenianAssyrian/Chaldean/SyriacAustralianAustrianBahamianBangladeshiBarbadianBasqueBelgianBelizeanBermudanBhutaneseBlackfeetBolivianBrazilianBritishBritish West IndianBulgarianBurmeseCajunCambodianCanadianCape VerdeanCarpatho RusynCelticCentral AmericanCentral American IndianCherokeeCheyenneChickasawChileanChineseChippewaChoctawColombianColvilleComancheCosta RicanCreeCreekCroatianCrowCubanCypriotCzechCzechoslovakianDanishDelawareDominicanDutchDutch West IndianEastern EuropeanEcuadorianEgyptianEnglishEstonianEthiopianEuropeanFijianFilipinoFinnishFrenchFrench American IndianFrench CanadianGermanGerman RussianGhanaianGreekGuamanian/ChamorroGuatemalanGuyaneseHaitianHmongHonduranHopiHoumaHungarianIcelanderIndian (Asian)IndonesianInupiatIranianIraqiIrishIroquoisIsraeliItalianJamaicanJapaneseJordanianKenyanKiowaKoreanLaotianLatvianLebaneseLiberianLithuanianLumbeeLuxembourgerMacedonianMalaysianMalteseMarshalleseMenomineeMexicanMexican American IndianMongolianMoroccanNative HawaiianNavajoNew ZealanderNicaraguanNigerianNorthern EuropeanNorwegianOkinawanOsageOttawaPaiutePakistaniPalestinianPanamanianParaguayanPennsylvania GermanPeruvianPimaPolishPortuguesePotawatomiPuebloPuerto RicanPuget Sound SalishRomanianRussianSalvadoranSamoanScandinavianScotch-IrishScottishSeminoleSenegaleseSerbianShoshoneSierra LeoneanSiouxSlavicSlovakSloveneSomaliSouth AfricanSouth AmericanSouth American IndianSoviet UnionSpaniardSpanishSpanish AmericanSpanish American IndianSri LankanSubsaharan AfricanSudaneseSwedishSwissSyrianTaiwaneseThaiTlingit-HaidaTohono O'OdhamTonganTrinidadian and TobagonianTsimshianTurkishU.S. Virgin IslanderUgandanUkrainianUruguayanUteVenezuelanVietnameseWelshWest IndianYakamaYaquiYugoslavianYumanYup'ikZimbabwean
Immigration
NonimmigrantsImmigrantsAfghanistanAfricaAlbaniaArgentinaArmeniaAsiaAustraliaAustriaBahamasBangladeshBarbadosBelarusBelgiumBelizeBoliviaBosnia and HerzegovinaBrazilBulgariaBurma/MyanmarCabo VerdeCambodiaCameroonCanadaCaribbeanCentral AmericaChileChinaColombiaCongoCosta RicaCroatiaCubaCzechoslovakiaDenmarkDominicaDominican RepublicEastern AfricaEastern AsiaEastern EuropeEcuadorEgyptEl SalvadorEnglandEritreaEthiopiaEuropeFijiFranceGermanyGhanaGreeceGrenadaGuatemalaGuyanaHaitiHondurasHong KongHungaryIndiaIndonesiaIranIraqIrelandIsraelItalyJamaicaJapanJordanKazakhstanKenyaKoreaKuwaitLaosLatin AmericaLatviaLebanonLiberiaLithuaniaMalaysiaMexicoMicronesiaMiddle AfricaMoldovaMoroccoNepalNetherlandsNicaraguaNigeriaNorth AmericaNorth MacedoniaNorthern AfricaNorthern EuropeNorwayOceaniaPakistanPanamaPeruPhilippinesPolandPortugalRomaniaRussiaSaudi ArabiaScotlandSenegalSerbiaSierra LeoneSingaporeSomaliaSouth AfricaSouth AmericaSouth Central AsiaSouth Eastern AsiaSouthern EuropeSpainSri LankaSt. Vincent and the GrenadinesSudanSwedenSwitzerlandSyriaTaiwanThailandTrinidad and TobagoTurkeyUgandaUkraineUruguayUzbekistanVenezuelaVietnamWest IndiesWestern AfricaWestern AsiaWestern EuropeYemenZaireZimbabweAzores
2 or more Vehicles in Household
Income
Poverty
Unemployment
Labor Participation
Family Structure
Vehicle Availability
Education Level
Disability

2 or more Vehicles in Household Comparison

Nepalese

Immigrants from Sri Lanka

Exceptional
Average
61.4%
2 OR MORE VEHICLES IN HOUSEHOLD
100.0/ 100
METRIC RATING
15th/ 347
METRIC RANK
55.5%
2 OR MORE VEHICLES IN HOUSEHOLD
58.3/ 100
METRIC RATING
166th/ 347
METRIC RANK

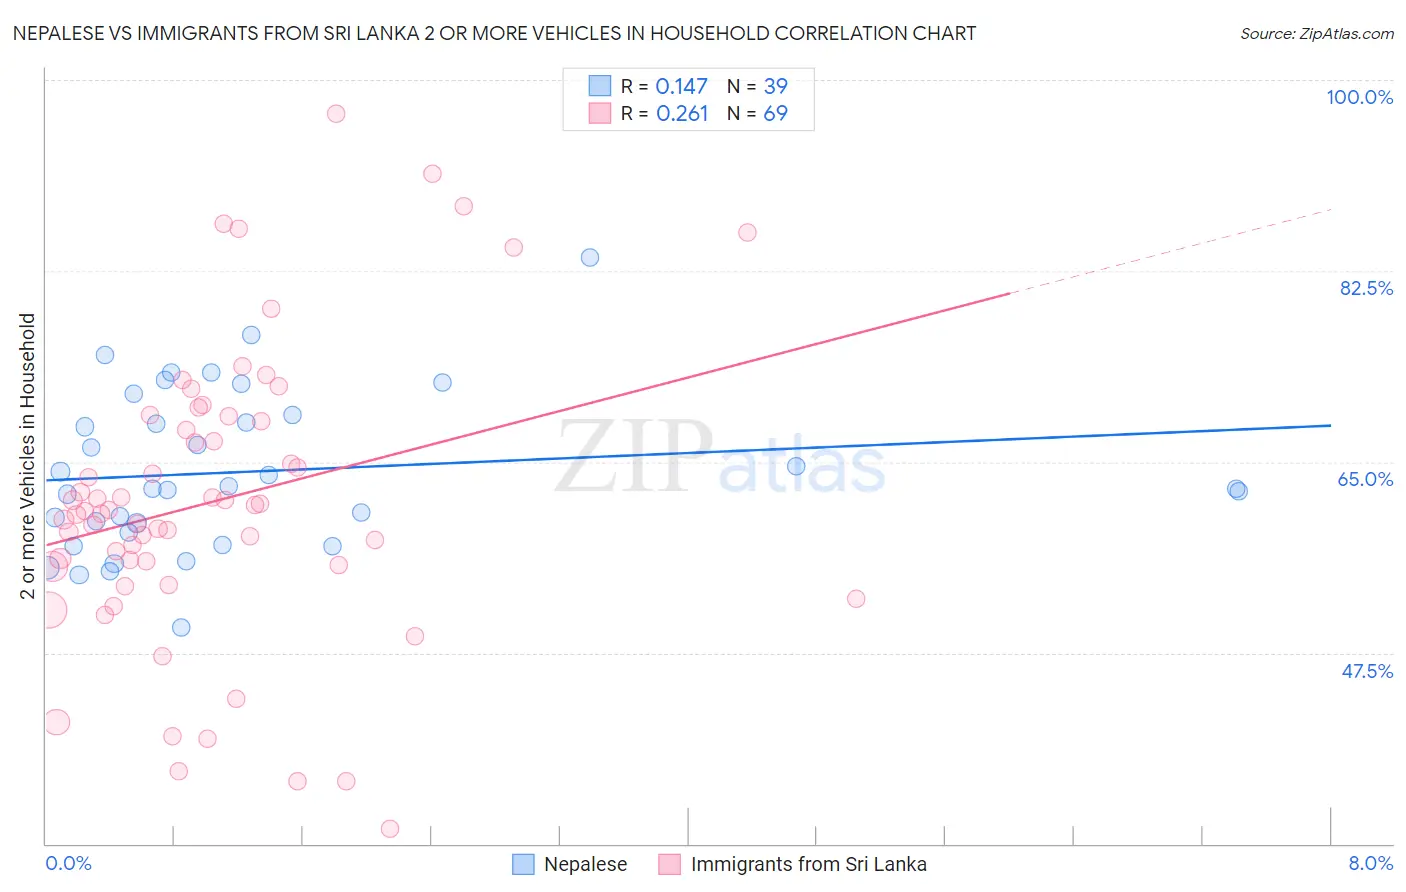
Nepalese vs Immigrants from Sri Lanka 2 or more Vehicles in Household Correlation Chart

The statistical analysis conducted on geographies consisting of 24,483,296 people shows a poor positive correlation between the proportion of Nepalese and percentage of households with 2 or more vehicles available in the United States with a correlation coefficient (R) of 0.147 and weighted average of 61.4%. Similarly, the statistical analysis conducted on geographies consisting of 149,689,488 people shows a weak positive correlation between the proportion of Immigrants from Sri Lanka and percentage of households with 2 or more vehicles available in the United States with a correlation coefficient (R) of 0.261 and weighted average of 55.5%, a difference of 10.6%.
Nepalese vs Immigrants from Sri Lanka 2 or more Vehicles in Household

2 or more Vehicles in Household Correlation Summary

MeasurementNepaleseImmigrants from Sri Lanka
Minimum49.8%31.3%
Maximum83.8%96.9%
Range33.9%65.5%
Mean64.1%61.4%
Median62.5%60.5%
Interquartile 25% (IQ1)58.6%55.5%
Interquartile 75% (IQ3)69.3%69.0%
Interquartile Range (IQR)10.7%13.5%
Standard Deviation (Sample)7.3%13.5%
Standard Deviation (Population)7.2%13.4%

Similar Demographics by 2 or more Vehicles in Household

Demographics Similar to Nepalese by 2 or more Vehicles in Household

In terms of 2 or more vehicles in household, the demographic groups most similar to Nepalese are Native Hawaiian (61.4%, a difference of 0.020%), Czech (61.5%, a difference of 0.090%), Basque (61.4%, a difference of 0.090%), European (61.4%, a difference of 0.10%), and Samoan (61.5%, a difference of 0.14%).
DemographicsRating | Rank2 or more Vehicles in Household
English
100.0
/100
|
#8
Exceptional
61.9%
Swedes
100.0
/100
|
#9
Exceptional
61.8%
Mexicans
100.0
/100
|
#10
Exceptional
61.7%
Dutch
100.0
/100
|
#11
Exceptional
61.6%
Germans
100.0
/100
|
#12
Exceptional
61.6%
Samoans
100.0
/100
|
#13
Exceptional
61.5%
Czechs
100.0
/100
|
#14
Exceptional
61.5%
Nepalese
100.0
/100
|
#15
Exceptional
61.4%
Native Hawaiians
100.0
/100
|
#16
Exceptional
61.4%
Basques
100.0
/100
|
#17
Exceptional
61.4%
Europeans
100.0
/100
|
#18
Exceptional
61.4%
Scottish
100.0
/100
|
#19
Exceptional
61.2%
Sri Lankans
100.0
/100
|
#20
Exceptional
61.0%
Koreans
100.0
/100
|
#21
Exceptional
61.0%
Swiss
100.0
/100
|
#22
Exceptional
61.0%

Demographics Similar to Immigrants from Sri Lanka by 2 or more Vehicles in Household

In terms of 2 or more vehicles in household, the demographic groups most similar to Immigrants from Sri Lanka are Kenyan (55.5%, a difference of 0.010%), Immigrants from El Salvador (55.6%, a difference of 0.040%), Dutch West Indian (55.6%, a difference of 0.060%), French American Indian (55.5%, a difference of 0.070%), and Immigrants from Zimbabwe (55.6%, a difference of 0.080%).
DemographicsRating | Rank2 or more Vehicles in Household
Paiute
68.0
/100
|
#159
Good
55.8%
Crow
67.0
/100
|
#160
Good
55.7%
Colville
61.1
/100
|
#161
Good
55.6%
German Russians
60.9
/100
|
#162
Good
55.6%
Immigrants | Zimbabwe
60.2
/100
|
#163
Good
55.6%
Dutch West Indians
59.8
/100
|
#164
Average
55.6%
Immigrants | El Salvador
59.4
/100
|
#165
Average
55.6%
Immigrants | Sri Lanka
58.3
/100
|
#166
Average
55.5%
Kenyans
58.1
/100
|
#167
Average
55.5%
French American Indians
56.7
/100
|
#168
Average
55.5%
Immigrants | Austria
56.3
/100
|
#169
Average
55.5%
Romanians
55.8
/100
|
#170
Average
55.5%
Immigrants | Costa Rica
54.4
/100
|
#171
Average
55.4%
Immigrants | Nicaragua
51.6
/100
|
#172
Average
55.4%
Immigrants | Western Europe
51.4
/100
|
#173
Average
55.4%