Immigrants from Uganda vs Immigrants from Croatia 1 or more Vehicles in Household

COMPARE

Immigrants from Uganda
Race
Ancestry
AfghanAfricanAlaska NativeAlaskan AthabascanAlbanianAleutAlsatianAmericanApacheArabArapahoArgentineanArmenianAssyrian/Chaldean/SyriacAustralianAustrianBahamianBangladeshiBarbadianBasqueBelgianBelizeanBermudanBhutaneseBlackfeetBolivianBrazilianBritishBritish West IndianBulgarianBurmeseCajunCambodianCanadianCape VerdeanCarpatho RusynCelticCentral AmericanCentral American IndianCherokeeCheyenneChickasawChileanChineseChippewaChoctawColombianColvilleComancheCosta RicanCreeCreekCroatianCrowCubanCypriotCzechCzechoslovakianDanishDelawareDominicanDutchDutch West IndianEastern EuropeanEcuadorianEgyptianEnglishEstonianEthiopianEuropeanFijianFilipinoFinnishFrenchFrench American IndianFrench CanadianGermanGerman RussianGhanaianGreekGuamanian/ChamorroGuatemalanGuyaneseHaitianHmongHonduranHopiHoumaHungarianIcelanderIndian (Asian)IndonesianInupiatIranianIraqiIrishIroquoisIsraeliItalianJamaicanJapaneseJordanianKenyanKiowaKoreanLaotianLatvianLebaneseLiberianLithuanianLumbeeLuxembourgerMacedonianMalaysianMalteseMarshalleseMenomineeMexicanMexican American IndianMongolianMoroccanNative HawaiianNavajoNepaleseNew ZealanderNicaraguanNigerianNorthern EuropeanNorwegianOkinawanOsageOttawaPaiutePakistaniPalestinianPanamanianParaguayanPennsylvania GermanPeruvianPimaPolishPortuguesePotawatomiPuebloPuerto RicanPuget Sound SalishRomanianRussianSalvadoranSamoanScandinavianScotch-IrishScottishSeminoleSenegaleseSerbianShoshoneSierra LeoneanSiouxSlavicSlovakSloveneSomaliSouth AfricanSouth AmericanSouth American IndianSoviet UnionSpaniardSpanishSpanish AmericanSpanish American IndianSri LankanSubsaharan AfricanSudaneseSwedishSwissSyrianTaiwaneseThaiTlingit-HaidaTohono O'OdhamTonganTrinidadian and TobagonianTsimshianTurkishU.S. Virgin IslanderUgandanUkrainianUruguayanUteVenezuelanVietnameseWelshWest IndianYakamaYaquiYugoslavianYumanYup'ikZimbabwean
Immigration
NonimmigrantsImmigrantsAfghanistanAfricaAlbaniaArgentinaArmeniaAsiaAustraliaAustriaBahamasBangladeshBarbadosBelarusBelgiumBelizeBoliviaBosnia and HerzegovinaBrazilBulgariaBurma/MyanmarCabo VerdeCambodiaCameroonCanadaCaribbeanCentral AmericaChileChinaColombiaCongoCosta RicaCubaCzechoslovakiaDenmarkDominicaDominican RepublicEastern AfricaEastern AsiaEastern EuropeEcuadorEgyptEl SalvadorEnglandEritreaEthiopiaEuropeFijiFranceGermanyGhanaGreeceGrenadaGuatemalaGuyanaHaitiHondurasHong KongHungaryIndiaIndonesiaIranIraqIrelandIsraelItalyJamaicaJapanJordanKazakhstanKenyaKoreaKuwaitLaosLatin AmericaLatviaLebanonLiberiaLithuaniaMalaysiaMexicoMicronesiaMiddle AfricaMoldovaMoroccoNepalNetherlandsNicaraguaNigeriaNorth AmericaNorth MacedoniaNorthern AfricaNorthern EuropeNorwayOceaniaPakistanPanamaPeruPhilippinesPolandPortugalRomaniaRussiaSaudi ArabiaScotlandSenegalSerbiaSierra LeoneSingaporeSomaliaSouth AfricaSouth AmericaSouth Central AsiaSouth Eastern AsiaSouthern EuropeSpainSri LankaSt. Vincent and the GrenadinesSudanSwedenSwitzerlandSyriaTaiwanThailandTrinidad and TobagoTurkeyUgandaUkraineUruguayUzbekistanVenezuelaVietnamWest IndiesWestern AfricaWestern AsiaWestern EuropeYemenZaireZimbabweAzores
Immigrants from Croatia
Race
Ancestry
AfghanAfricanAlaska NativeAlaskan AthabascanAlbanianAleutAlsatianAmericanApacheArabArapahoArgentineanArmenianAssyrian/Chaldean/SyriacAustralianAustrianBahamianBangladeshiBarbadianBasqueBelgianBelizeanBermudanBhutaneseBlackfeetBolivianBrazilianBritishBritish West IndianBulgarianBurmeseCajunCambodianCanadianCape VerdeanCarpatho RusynCelticCentral AmericanCentral American IndianCherokeeCheyenneChickasawChileanChineseChippewaChoctawColombianColvilleComancheCosta RicanCreeCreekCroatianCrowCubanCypriotCzechCzechoslovakianDanishDelawareDominicanDutchDutch West IndianEastern EuropeanEcuadorianEgyptianEnglishEstonianEthiopianEuropeanFijianFilipinoFinnishFrenchFrench American IndianFrench CanadianGermanGerman RussianGhanaianGreekGuamanian/ChamorroGuatemalanGuyaneseHaitianHmongHonduranHopiHoumaHungarianIcelanderIndian (Asian)IndonesianInupiatIranianIraqiIrishIroquoisIsraeliItalianJamaicanJapaneseJordanianKenyanKiowaKoreanLaotianLatvianLebaneseLiberianLithuanianLumbeeLuxembourgerMacedonianMalaysianMalteseMarshalleseMenomineeMexicanMexican American IndianMongolianMoroccanNative HawaiianNavajoNepaleseNew ZealanderNicaraguanNigerianNorthern EuropeanNorwegianOkinawanOsageOttawaPaiutePakistaniPalestinianPanamanianParaguayanPennsylvania GermanPeruvianPimaPolishPortuguesePotawatomiPuebloPuerto RicanPuget Sound SalishRomanianRussianSalvadoranSamoanScandinavianScotch-IrishScottishSeminoleSenegaleseSerbianShoshoneSierra LeoneanSiouxSlavicSlovakSloveneSomaliSouth AfricanSouth AmericanSouth American IndianSoviet UnionSpaniardSpanishSpanish AmericanSpanish American IndianSri LankanSubsaharan AfricanSudaneseSwedishSwissSyrianTaiwaneseThaiTlingit-HaidaTohono O'OdhamTonganTrinidadian and TobagonianTsimshianTurkishU.S. Virgin IslanderUgandanUkrainianUruguayanUteVenezuelanVietnameseWelshWest IndianYakamaYaquiYugoslavianYumanYup'ikZimbabwean
Immigration
NonimmigrantsImmigrantsAfghanistanAfricaAlbaniaArgentinaArmeniaAsiaAustraliaAustriaBahamasBangladeshBarbadosBelarusBelgiumBelizeBoliviaBosnia and HerzegovinaBrazilBulgariaBurma/MyanmarCabo VerdeCambodiaCameroonCanadaCaribbeanCentral AmericaChileChinaColombiaCongoCosta RicaCroatiaCubaCzechoslovakiaDenmarkDominicaDominican RepublicEastern AfricaEastern AsiaEastern EuropeEcuadorEgyptEl SalvadorEnglandEritreaEthiopiaEuropeFijiFranceGermanyGhanaGreeceGrenadaGuatemalaGuyanaHaitiHondurasHong KongHungaryIndiaIndonesiaIranIraqIrelandIsraelItalyJamaicaJapanJordanKazakhstanKenyaKoreaKuwaitLaosLatin AmericaLatviaLebanonLiberiaLithuaniaMalaysiaMexicoMicronesiaMiddle AfricaMoldovaMoroccoNepalNetherlandsNicaraguaNigeriaNorth AmericaNorth MacedoniaNorthern AfricaNorthern EuropeNorwayOceaniaPakistanPanamaPeruPhilippinesPolandPortugalRomaniaRussiaSaudi ArabiaScotlandSenegalSerbiaSierra LeoneSingaporeSomaliaSouth AfricaSouth AmericaSouth Central AsiaSouth Eastern AsiaSouthern EuropeSpainSri LankaSt. Vincent and the GrenadinesSudanSwedenSwitzerlandSyriaTaiwanThailandTrinidad and TobagoTurkeyUkraineUruguayUzbekistanVenezuelaVietnamWest IndiesWestern AfricaWestern AsiaWestern EuropeYemenZaireZimbabweAzores
1 or more Vehicles in Household
Income
Poverty
Unemployment
Labor Participation
Family Structure
Vehicle Availability
Education Level
Disability

1 or more Vehicles in Household Comparison

Immigrants from Uganda

Immigrants from Croatia

Good
Tragic
90.1%
1 OR MORE VEHICLES IN HOUSEHOLD
73.8/ 100
METRIC RATING
154th/ 347
METRIC RANK
87.0%
1 OR MORE VEHICLES IN HOUSEHOLD
0.0/ 100
METRIC RATING
280th/ 347
METRIC RANK

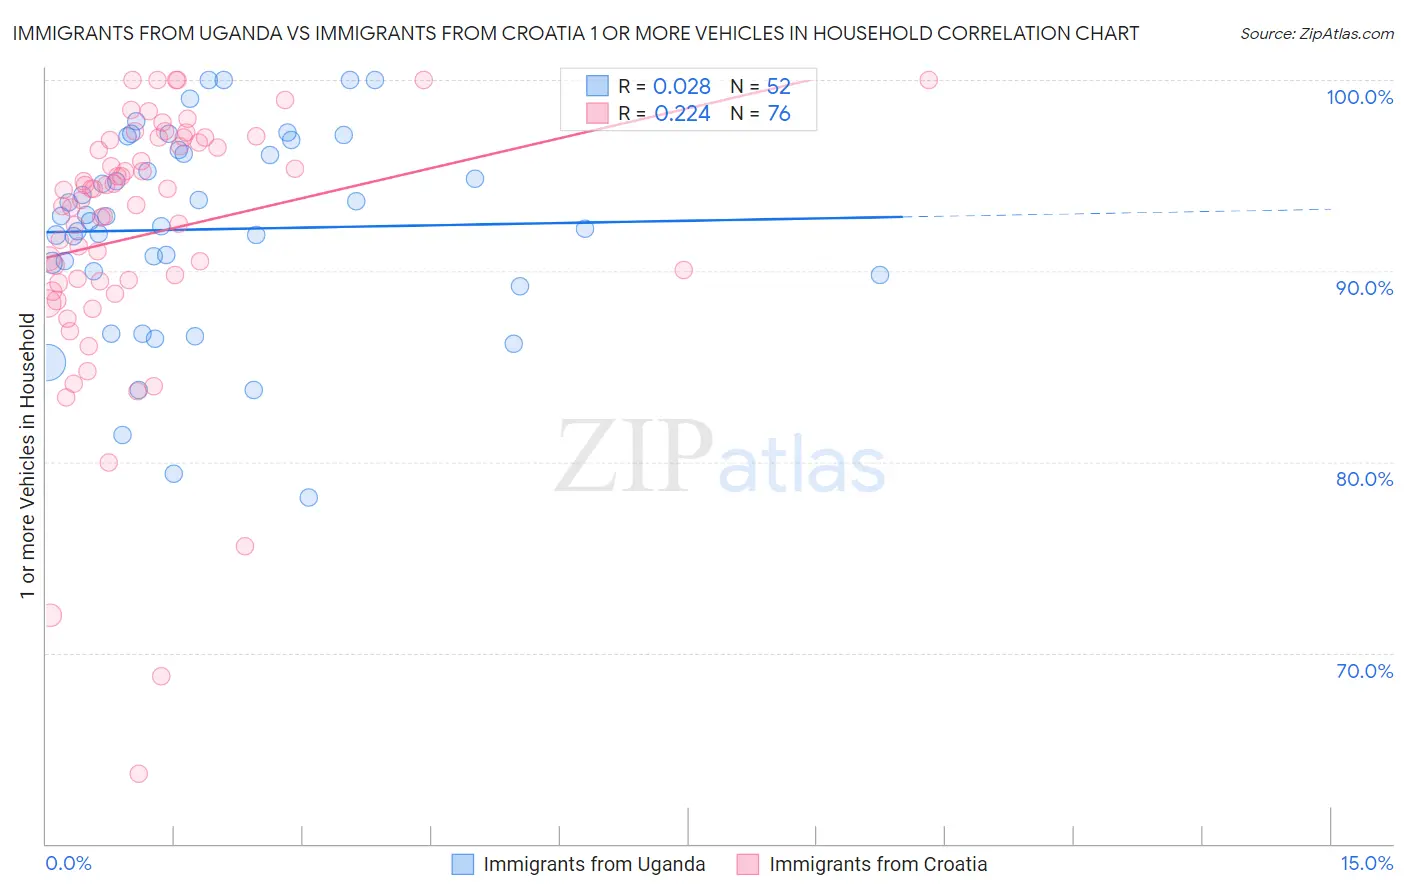
Immigrants from Uganda vs Immigrants from Croatia 1 or more Vehicles in Household Correlation Chart

The statistical analysis conducted on geographies consisting of 125,961,827 people shows no correlation between the proportion of Immigrants from Uganda and percentage of households with 1 or more vehicles available in the United States with a correlation coefficient (R) of 0.028 and weighted average of 90.1%. Similarly, the statistical analysis conducted on geographies consisting of 132,537,913 people shows a weak positive correlation between the proportion of Immigrants from Croatia and percentage of households with 1 or more vehicles available in the United States with a correlation coefficient (R) of 0.224 and weighted average of 87.0%, a difference of 3.5%.
Immigrants from Uganda vs Immigrants from Croatia 1 or more Vehicles in Household

1 or more Vehicles in Household Correlation Summary

MeasurementImmigrants from UgandaImmigrants from Croatia
Minimum78.1%63.6%
Maximum100.0%100.0%
Range21.9%36.4%
Mean92.2%91.9%
Median92.7%94.0%
Interquartile 25% (IQ1)89.9%89.4%
Interquartile 75% (IQ3)96.2%96.8%
Interquartile Range (IQR)6.3%7.4%
Standard Deviation (Sample)5.3%7.0%
Standard Deviation (Population)5.2%7.0%

Similar Demographics by 1 or more Vehicles in Household

Demographics Similar to Immigrants from Uganda by 1 or more Vehicles in Household

In terms of 1 or more vehicles in household, the demographic groups most similar to Immigrants from Uganda are New Zealander (90.1%, a difference of 0.0%), Immigrants (90.1%, a difference of 0.0%), Tlingit-Haida (90.1%, a difference of 0.010%), Immigrants from Bosnia and Herzegovina (90.1%, a difference of 0.030%), and Australian (90.0%, a difference of 0.030%).
DemographicsRating | Rank1 or more Vehicles in Household
Chileans
79.8
/100
|
#147
Good
90.2%
Immigrants | Eastern Africa
78.2
/100
|
#148
Good
90.1%
Immigrants | Nicaragua
76.7
/100
|
#149
Good
90.1%
Immigrants | Micronesia
75.9
/100
|
#150
Good
90.1%
Immigrants | Bosnia and Herzegovina
75.4
/100
|
#151
Good
90.1%
Tlingit-Haida
74.3
/100
|
#152
Good
90.1%
New Zealanders
73.8
/100
|
#153
Good
90.1%
Immigrants | Uganda
73.8
/100
|
#154
Good
90.1%
Immigrants | Immigrants
73.6
/100
|
#155
Good
90.1%
Australians
72.4
/100
|
#156
Good
90.0%
Immigrants | Congo
71.2
/100
|
#157
Good
90.0%
Brazilians
71.0
/100
|
#158
Good
90.0%
South Africans
69.7
/100
|
#159
Good
90.0%
Immigrants | Indonesia
68.8
/100
|
#160
Good
90.0%
Salvadorans
68.7
/100
|
#161
Good
90.0%

Demographics Similar to Immigrants from Croatia by 1 or more Vehicles in Household

In terms of 1 or more vehicles in household, the demographic groups most similar to Immigrants from Croatia are Immigrants from Southern Europe (87.1%, a difference of 0.030%), Immigrants from Albania (87.1%, a difference of 0.030%), Mongolian (87.0%, a difference of 0.060%), Alsatian (87.1%, a difference of 0.070%), and Immigrants from France (87.1%, a difference of 0.13%).
DemographicsRating | Rank1 or more Vehicles in Household
Immigrants | Northern Africa
0.2
/100
|
#273
Tragic
87.4%
Immigrants | Morocco
0.1
/100
|
#274
Tragic
87.4%
Immigrants | Singapore
0.1
/100
|
#275
Tragic
87.2%
Immigrants | France
0.1
/100
|
#276
Tragic
87.1%
Alsatians
0.1
/100
|
#277
Tragic
87.1%
Immigrants | Southern Europe
0.1
/100
|
#278
Tragic
87.1%
Immigrants | Albania
0.1
/100
|
#279
Tragic
87.1%
Immigrants | Croatia
0.0
/100
|
#280
Tragic
87.0%
Mongolians
0.0
/100
|
#281
Tragic
87.0%
Colville
0.0
/100
|
#282
Tragic
86.8%
Immigrants | Eastern Europe
0.0
/100
|
#283
Tragic
86.7%
Central American Indians
0.0
/100
|
#284
Tragic
86.7%
Immigrants | Kazakhstan
0.0
/100
|
#285
Tragic
86.6%
Immigrants | Eastern Asia
0.0
/100
|
#286
Tragic
86.5%
Immigrants | Malaysia
0.0
/100
|
#287
Tragic
86.5%