Immigrants from Lithuania vs Immigrants from Croatia 1 or more Vehicles in Household

COMPARE

Immigrants from Lithuania
Race
Ancestry
AfghanAfricanAlaska NativeAlaskan AthabascanAlbanianAleutAlsatianAmericanApacheArabArapahoArgentineanArmenianAssyrian/Chaldean/SyriacAustralianAustrianBahamianBangladeshiBarbadianBasqueBelgianBelizeanBermudanBhutaneseBlackfeetBolivianBrazilianBritishBritish West IndianBulgarianBurmeseCajunCambodianCanadianCape VerdeanCarpatho RusynCelticCentral AmericanCentral American IndianCherokeeCheyenneChickasawChileanChineseChippewaChoctawColombianColvilleComancheCosta RicanCreeCreekCroatianCrowCubanCypriotCzechCzechoslovakianDanishDelawareDominicanDutchDutch West IndianEastern EuropeanEcuadorianEgyptianEnglishEstonianEthiopianEuropeanFijianFilipinoFinnishFrenchFrench American IndianFrench CanadianGermanGerman RussianGhanaianGreekGuamanian/ChamorroGuatemalanGuyaneseHaitianHmongHonduranHopiHoumaHungarianIcelanderIndian (Asian)IndonesianInupiatIranianIraqiIrishIroquoisIsraeliItalianJamaicanJapaneseJordanianKenyanKiowaKoreanLaotianLatvianLebaneseLiberianLithuanianLumbeeLuxembourgerMacedonianMalaysianMalteseMarshalleseMenomineeMexicanMexican American IndianMongolianMoroccanNative HawaiianNavajoNepaleseNew ZealanderNicaraguanNigerianNorthern EuropeanNorwegianOkinawanOsageOttawaPaiutePakistaniPalestinianPanamanianParaguayanPennsylvania GermanPeruvianPimaPolishPortuguesePotawatomiPuebloPuerto RicanPuget Sound SalishRomanianRussianSalvadoranSamoanScandinavianScotch-IrishScottishSeminoleSenegaleseSerbianShoshoneSierra LeoneanSiouxSlavicSlovakSloveneSomaliSouth AfricanSouth AmericanSouth American IndianSoviet UnionSpaniardSpanishSpanish AmericanSpanish American IndianSri LankanSubsaharan AfricanSudaneseSwedishSwissSyrianTaiwaneseThaiTlingit-HaidaTohono O'OdhamTonganTrinidadian and TobagonianTsimshianTurkishU.S. Virgin IslanderUgandanUkrainianUruguayanUteVenezuelanVietnameseWelshWest IndianYakamaYaquiYugoslavianYumanYup'ikZimbabwean
Immigration
NonimmigrantsImmigrantsAfghanistanAfricaAlbaniaArgentinaArmeniaAsiaAustraliaAustriaBahamasBangladeshBarbadosBelarusBelgiumBelizeBoliviaBosnia and HerzegovinaBrazilBulgariaBurma/MyanmarCabo VerdeCambodiaCameroonCanadaCaribbeanCentral AmericaChileChinaColombiaCongoCosta RicaCubaCzechoslovakiaDenmarkDominicaDominican RepublicEastern AfricaEastern AsiaEastern EuropeEcuadorEgyptEl SalvadorEnglandEritreaEthiopiaEuropeFijiFranceGermanyGhanaGreeceGrenadaGuatemalaGuyanaHaitiHondurasHong KongHungaryIndiaIndonesiaIranIraqIrelandIsraelItalyJamaicaJapanJordanKazakhstanKenyaKoreaKuwaitLaosLatin AmericaLatviaLebanonLiberiaLithuaniaMalaysiaMexicoMicronesiaMiddle AfricaMoldovaMoroccoNepalNetherlandsNicaraguaNigeriaNorth AmericaNorth MacedoniaNorthern AfricaNorthern EuropeNorwayOceaniaPakistanPanamaPeruPhilippinesPolandPortugalRomaniaRussiaSaudi ArabiaScotlandSenegalSerbiaSierra LeoneSingaporeSomaliaSouth AfricaSouth AmericaSouth Central AsiaSouth Eastern AsiaSouthern EuropeSpainSri LankaSt. Vincent and the GrenadinesSudanSwedenSwitzerlandSyriaTaiwanThailandTrinidad and TobagoTurkeyUgandaUkraineUruguayUzbekistanVenezuelaVietnamWest IndiesWestern AfricaWestern AsiaWestern EuropeYemenZaireZimbabweAzores
Immigrants from Croatia
Race
Ancestry
AfghanAfricanAlaska NativeAlaskan AthabascanAlbanianAleutAlsatianAmericanApacheArabArapahoArgentineanArmenianAssyrian/Chaldean/SyriacAustralianAustrianBahamianBangladeshiBarbadianBasqueBelgianBelizeanBermudanBhutaneseBlackfeetBolivianBrazilianBritishBritish West IndianBulgarianBurmeseCajunCambodianCanadianCape VerdeanCarpatho RusynCelticCentral AmericanCentral American IndianCherokeeCheyenneChickasawChileanChineseChippewaChoctawColombianColvilleComancheCosta RicanCreeCreekCroatianCrowCubanCypriotCzechCzechoslovakianDanishDelawareDominicanDutchDutch West IndianEastern EuropeanEcuadorianEgyptianEnglishEstonianEthiopianEuropeanFijianFilipinoFinnishFrenchFrench American IndianFrench CanadianGermanGerman RussianGhanaianGreekGuamanian/ChamorroGuatemalanGuyaneseHaitianHmongHonduranHopiHoumaHungarianIcelanderIndian (Asian)IndonesianInupiatIranianIraqiIrishIroquoisIsraeliItalianJamaicanJapaneseJordanianKenyanKiowaKoreanLaotianLatvianLebaneseLiberianLithuanianLumbeeLuxembourgerMacedonianMalaysianMalteseMarshalleseMenomineeMexicanMexican American IndianMongolianMoroccanNative HawaiianNavajoNepaleseNew ZealanderNicaraguanNigerianNorthern EuropeanNorwegianOkinawanOsageOttawaPaiutePakistaniPalestinianPanamanianParaguayanPennsylvania GermanPeruvianPimaPolishPortuguesePotawatomiPuebloPuerto RicanPuget Sound SalishRomanianRussianSalvadoranSamoanScandinavianScotch-IrishScottishSeminoleSenegaleseSerbianShoshoneSierra LeoneanSiouxSlavicSlovakSloveneSomaliSouth AfricanSouth AmericanSouth American IndianSoviet UnionSpaniardSpanishSpanish AmericanSpanish American IndianSri LankanSubsaharan AfricanSudaneseSwedishSwissSyrianTaiwaneseThaiTlingit-HaidaTohono O'OdhamTonganTrinidadian and TobagonianTsimshianTurkishU.S. Virgin IslanderUgandanUkrainianUruguayanUteVenezuelanVietnameseWelshWest IndianYakamaYaquiYugoslavianYumanYup'ikZimbabwean
Immigration
NonimmigrantsImmigrantsAfghanistanAfricaAlbaniaArgentinaArmeniaAsiaAustraliaAustriaBahamasBangladeshBarbadosBelarusBelgiumBelizeBoliviaBosnia and HerzegovinaBrazilBulgariaBurma/MyanmarCabo VerdeCambodiaCameroonCanadaCaribbeanCentral AmericaChileChinaColombiaCongoCosta RicaCroatiaCubaCzechoslovakiaDenmarkDominicaDominican RepublicEastern AfricaEastern AsiaEastern EuropeEcuadorEgyptEl SalvadorEnglandEritreaEthiopiaEuropeFijiFranceGermanyGhanaGreeceGrenadaGuatemalaGuyanaHaitiHondurasHong KongHungaryIndiaIndonesiaIranIraqIrelandIsraelItalyJamaicaJapanJordanKazakhstanKenyaKoreaKuwaitLaosLatin AmericaLatviaLebanonLiberiaMalaysiaMexicoMicronesiaMiddle AfricaMoldovaMoroccoNepalNetherlandsNicaraguaNigeriaNorth AmericaNorth MacedoniaNorthern AfricaNorthern EuropeNorwayOceaniaPakistanPanamaPeruPhilippinesPolandPortugalRomaniaRussiaSaudi ArabiaScotlandSenegalSerbiaSierra LeoneSingaporeSomaliaSouth AfricaSouth AmericaSouth Central AsiaSouth Eastern AsiaSouthern EuropeSpainSri LankaSt. Vincent and the GrenadinesSudanSwedenSwitzerlandSyriaTaiwanThailandTrinidad and TobagoTurkeyUgandaUkraineUruguayUzbekistanVenezuelaVietnamWest IndiesWestern AfricaWestern AsiaWestern EuropeYemenZaireZimbabweAzores
1 or more Vehicles in Household
Income
Poverty
Unemployment
Labor Participation
Family Structure
Vehicle Availability
Education Level
Disability

1 or more Vehicles in Household Comparison

Immigrants from Lithuania

Immigrants from Croatia

Excellent
Tragic
90.2%
1 OR MORE VEHICLES IN HOUSEHOLD
83.0/ 100
METRIC RATING
142nd/ 347
METRIC RANK
87.0%
1 OR MORE VEHICLES IN HOUSEHOLD
0.0/ 100
METRIC RATING
280th/ 347
METRIC RANK

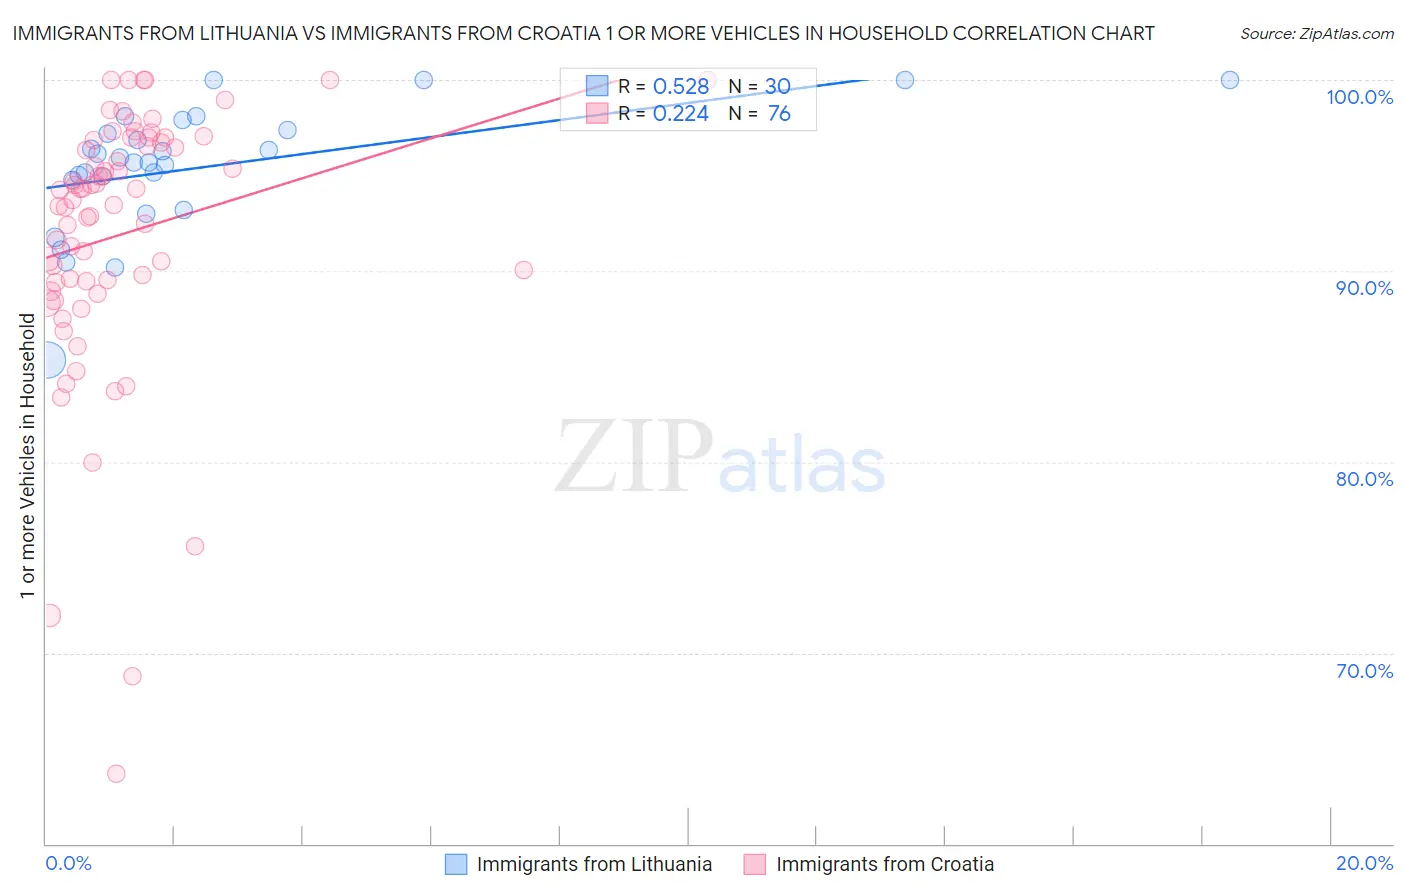
Immigrants from Lithuania vs Immigrants from Croatia 1 or more Vehicles in Household Correlation Chart

The statistical analysis conducted on geographies consisting of 117,713,976 people shows a substantial positive correlation between the proportion of Immigrants from Lithuania and percentage of households with 1 or more vehicles available in the United States with a correlation coefficient (R) of 0.528 and weighted average of 90.2%. Similarly, the statistical analysis conducted on geographies consisting of 132,537,913 people shows a weak positive correlation between the proportion of Immigrants from Croatia and percentage of households with 1 or more vehicles available in the United States with a correlation coefficient (R) of 0.224 and weighted average of 87.0%, a difference of 3.7%.
Immigrants from Lithuania vs Immigrants from Croatia 1 or more Vehicles in Household

1 or more Vehicles in Household Correlation Summary

MeasurementImmigrants from LithuaniaImmigrants from Croatia
Minimum85.3%63.6%
Maximum100.0%100.0%
Range14.7%36.4%
Mean95.4%91.9%
Median95.8%94.0%
Interquartile 25% (IQ1)94.8%89.4%
Interquartile 75% (IQ3)97.4%96.8%
Interquartile Range (IQR)2.6%7.4%
Standard Deviation (Sample)3.3%7.0%
Standard Deviation (Population)3.2%7.0%

Similar Demographics by 1 or more Vehicles in Household

Demographics Similar to Immigrants from Lithuania by 1 or more Vehicles in Household

In terms of 1 or more vehicles in household, the demographic groups most similar to Immigrants from Lithuania are Immigrants from Moldova (90.2%, a difference of 0.0%), Immigrants from Bahamas (90.2%, a difference of 0.040%), Immigrants from Zimbabwe (90.2%, a difference of 0.040%), Sioux (90.2%, a difference of 0.040%), and Sudanese (90.3%, a difference of 0.060%).
DemographicsRating | Rank1 or more Vehicles in Household
Immigrants | Oceania
86.9
/100
|
#135
Excellent
90.4%
Hungarians
86.5
/100
|
#136
Excellent
90.3%
Latvians
86.3
/100
|
#137
Excellent
90.3%
Syrians
86.3
/100
|
#138
Excellent
90.3%
Estonians
85.6
/100
|
#139
Excellent
90.3%
Sudanese
85.2
/100
|
#140
Excellent
90.3%
Immigrants | Moldova
83.1
/100
|
#141
Excellent
90.2%
Immigrants | Lithuania
83.0
/100
|
#142
Excellent
90.2%
Immigrants | Bahamas
81.5
/100
|
#143
Excellent
90.2%
Immigrants | Zimbabwe
81.5
/100
|
#144
Excellent
90.2%
Sioux
81.3
/100
|
#145
Excellent
90.2%
Bahamians
80.5
/100
|
#146
Excellent
90.2%
Chileans
79.8
/100
|
#147
Good
90.2%
Immigrants | Eastern Africa
78.2
/100
|
#148
Good
90.1%
Immigrants | Nicaragua
76.7
/100
|
#149
Good
90.1%

Demographics Similar to Immigrants from Croatia by 1 or more Vehicles in Household

In terms of 1 or more vehicles in household, the demographic groups most similar to Immigrants from Croatia are Immigrants from Southern Europe (87.1%, a difference of 0.030%), Immigrants from Albania (87.1%, a difference of 0.030%), Mongolian (87.0%, a difference of 0.060%), Alsatian (87.1%, a difference of 0.070%), and Immigrants from France (87.1%, a difference of 0.13%).
DemographicsRating | Rank1 or more Vehicles in Household
Immigrants | Northern Africa
0.2
/100
|
#273
Tragic
87.4%
Immigrants | Morocco
0.1
/100
|
#274
Tragic
87.4%
Immigrants | Singapore
0.1
/100
|
#275
Tragic
87.2%
Immigrants | France
0.1
/100
|
#276
Tragic
87.1%
Alsatians
0.1
/100
|
#277
Tragic
87.1%
Immigrants | Southern Europe
0.1
/100
|
#278
Tragic
87.1%
Immigrants | Albania
0.1
/100
|
#279
Tragic
87.1%
Immigrants | Croatia
0.0
/100
|
#280
Tragic
87.0%
Mongolians
0.0
/100
|
#281
Tragic
87.0%
Colville
0.0
/100
|
#282
Tragic
86.8%
Immigrants | Eastern Europe
0.0
/100
|
#283
Tragic
86.7%
Central American Indians
0.0
/100
|
#284
Tragic
86.7%
Immigrants | Kazakhstan
0.0
/100
|
#285
Tragic
86.6%
Immigrants | Eastern Asia
0.0
/100
|
#286
Tragic
86.5%
Immigrants | Malaysia
0.0
/100
|
#287
Tragic
86.5%