Immigrants from India vs South American Indian 2 or more Vehicles in Household
COMPARE
Immigrants from India
South American Indian
2 or more Vehicles in Household
2 or more Vehicles in Household Comparison
Immigrants from India
South American Indians
59.3%
2 OR MORE VEHICLES IN HOUSEHOLD
99.9/ 100
METRIC RATING
48th/ 347
METRIC RANK
53.9%
2 OR MORE VEHICLES IN HOUSEHOLD
6.5/ 100
METRIC RATING
219th/ 347
METRIC RANK
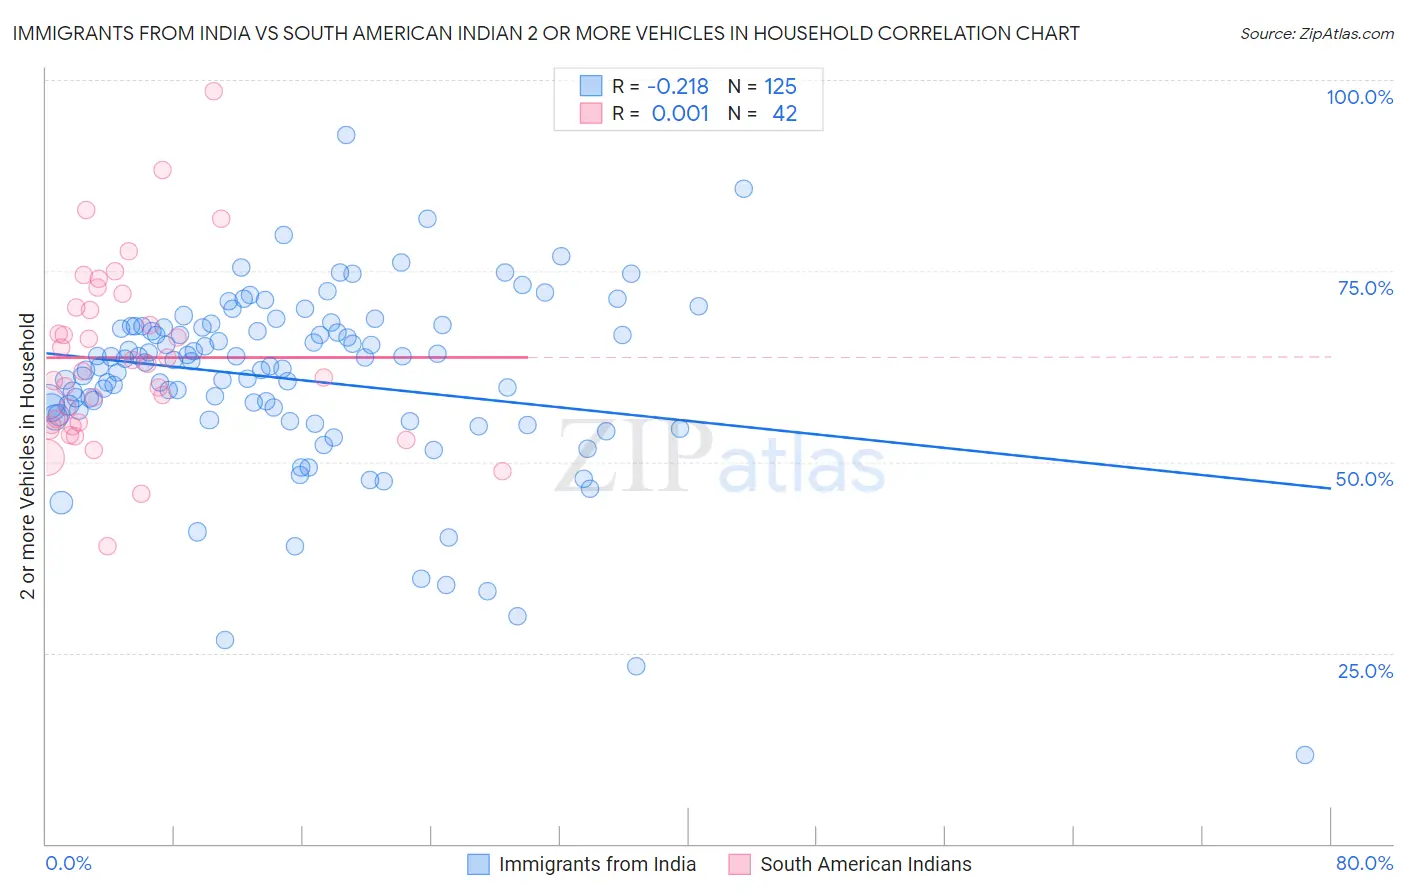
Immigrants from India vs South American Indian 2 or more Vehicles in Household Correlation Chart
The statistical analysis conducted on geographies consisting of 433,787,530 people shows a weak negative correlation between the proportion of Immigrants from India and percentage of households with 2 or more vehicles available in the United States with a correlation coefficient (R) of -0.218 and weighted average of 59.3%. Similarly, the statistical analysis conducted on geographies consisting of 164,540,449 people shows no correlation between the proportion of South American Indians and percentage of households with 2 or more vehicles available in the United States with a correlation coefficient (R) of 0.001 and weighted average of 53.9%, a difference of 10.0%.
2 or more Vehicles in Household Correlation Summary
| Measurement | Immigrants from India | South American Indian |
| Minimum | 11.6% | 38.9% |
| Maximum | 92.9% | 98.5% |
| Range | 81.2% | 59.6% |
| Mean | 60.8% | 63.7% |
| Median | 63.0% | 62.4% |
| Interquartile 25% (IQ1) | 55.9% | 54.8% |
| Interquartile 75% (IQ3) | 67.7% | 70.2% |
| Interquartile Range (IQR) | 11.7% | 15.4% |
| Standard Deviation (Sample) | 12.0% | 11.8% |
| Standard Deviation (Population) | 12.0% | 11.6% |
Similar Demographics by 2 or more Vehicles in Household
Demographics Similar to Immigrants from India by 2 or more Vehicles in Household
In terms of 2 or more vehicles in household, the demographic groups most similar to Immigrants from India are Yaqui (59.3%, a difference of 0.020%), Belgian (59.3%, a difference of 0.040%), Choctaw (59.3%, a difference of 0.040%), Spaniard (59.2%, a difference of 0.18%), and Immigrants from Laos (59.2%, a difference of 0.19%).
| Demographics | Rating | Rank | 2 or more Vehicles in Household |
| Northern Europeans | 100.0 /100 | #41 | Exceptional 59.9% |
| Malaysians | 100.0 /100 | #42 | Exceptional 59.8% |
| Czechoslovakians | 100.0 /100 | #43 | Exceptional 59.8% |
| French | 100.0 /100 | #44 | Exceptional 59.8% |
| Immigrants | Taiwan | 100.0 /100 | #45 | Exceptional 59.7% |
| Immigrants | South Eastern Asia | 100.0 /100 | #46 | Exceptional 59.6% |
| Yaqui | 99.9 /100 | #47 | Exceptional 59.3% |
| Immigrants | India | 99.9 /100 | #48 | Exceptional 59.3% |
| Belgians | 99.9 /100 | #49 | Exceptional 59.3% |
| Choctaw | 99.9 /100 | #50 | Exceptional 59.3% |
| Spaniards | 99.9 /100 | #51 | Exceptional 59.2% |
| Immigrants | Laos | 99.9 /100 | #52 | Exceptional 59.2% |
| Celtics | 99.9 /100 | #53 | Exceptional 59.2% |
| Bhutanese | 99.9 /100 | #54 | Exceptional 59.1% |
| Luxembourgers | 99.9 /100 | #55 | Exceptional 59.1% |
Demographics Similar to South American Indians by 2 or more Vehicles in Household
In terms of 2 or more vehicles in household, the demographic groups most similar to South American Indians are Taiwanese (53.9%, a difference of 0.020%), Immigrants from Singapore (53.9%, a difference of 0.040%), Kiowa (53.9%, a difference of 0.050%), Immigrants from Argentina (53.9%, a difference of 0.060%), and Immigrants from Burma/Myanmar (53.9%, a difference of 0.11%).
| Demographics | Rating | Rank | 2 or more Vehicles in Household |
| Immigrants | Chile | 11.1 /100 | #212 | Poor 54.2% |
| Guatemalans | 9.6 /100 | #213 | Tragic 54.1% |
| Immigrants | Czechoslovakia | 9.4 /100 | #214 | Tragic 54.1% |
| Aleuts | 9.3 /100 | #215 | Tragic 54.1% |
| Immigrants | Western Asia | 9.3 /100 | #216 | Tragic 54.1% |
| Immigrants | Burma/Myanmar | 7.1 /100 | #217 | Tragic 53.9% |
| Immigrants | Argentina | 6.8 /100 | #218 | Tragic 53.9% |
| South American Indians | 6.5 /100 | #219 | Tragic 53.9% |
| Taiwanese | 6.3 /100 | #220 | Tragic 53.9% |
| Immigrants | Singapore | 6.3 /100 | #221 | Tragic 53.9% |
| Kiowa | 6.2 /100 | #222 | Tragic 53.9% |
| Immigrants | Bosnia and Herzegovina | 5.5 /100 | #223 | Tragic 53.8% |
| Brazilians | 5.3 /100 | #224 | Tragic 53.8% |
| Immigrants | Egypt | 5.2 /100 | #225 | Tragic 53.8% |
| Immigrants | Eastern Africa | 5.1 /100 | #226 | Tragic 53.7% |