Immigrants from Guatemala vs Hungarian 2 or more Vehicles in Household

COMPARE

Immigrants from Guatemala
Race
Ancestry
AfghanAfricanAlaska NativeAlaskan AthabascanAlbanianAleutAlsatianAmericanApacheArabArapahoArgentineanArmenianAssyrian/Chaldean/SyriacAustralianAustrianBahamianBangladeshiBarbadianBasqueBelgianBelizeanBermudanBhutaneseBlackfeetBolivianBrazilianBritishBritish West IndianBulgarianBurmeseCajunCambodianCanadianCape VerdeanCarpatho RusynCelticCentral AmericanCentral American IndianCherokeeCheyenneChickasawChileanChineseChippewaChoctawColombianColvilleComancheCosta RicanCreeCreekCroatianCrowCubanCypriotCzechCzechoslovakianDanishDelawareDominicanDutchDutch West IndianEastern EuropeanEcuadorianEgyptianEnglishEstonianEthiopianEuropeanFijianFilipinoFinnishFrenchFrench American IndianFrench CanadianGermanGerman RussianGhanaianGreekGuamanian/ChamorroGuatemalanGuyaneseHaitianHmongHonduranHopiHoumaIcelanderIndian (Asian)IndonesianInupiatIranianIraqiIrishIroquoisIsraeliItalianJamaicanJapaneseJordanianKenyanKiowaKoreanLaotianLatvianLebaneseLiberianLithuanianLumbeeLuxembourgerMacedonianMalaysianMalteseMarshalleseMenomineeMexicanMexican American IndianMongolianMoroccanNative HawaiianNavajoNepaleseNew ZealanderNicaraguanNigerianNorthern EuropeanNorwegianOkinawanOsageOttawaPaiutePakistaniPalestinianPanamanianParaguayanPennsylvania GermanPeruvianPimaPolishPortuguesePotawatomiPuebloPuerto RicanPuget Sound SalishRomanianRussianSalvadoranSamoanScandinavianScotch-IrishScottishSeminoleSenegaleseSerbianShoshoneSierra LeoneanSiouxSlavicSlovakSloveneSomaliSouth AfricanSouth AmericanSouth American IndianSoviet UnionSpaniardSpanishSpanish AmericanSpanish American IndianSri LankanSubsaharan AfricanSudaneseSwedishSwissSyrianTaiwaneseThaiTlingit-HaidaTohono O'OdhamTonganTrinidadian and TobagonianTsimshianTurkishU.S. Virgin IslanderUgandanUkrainianUruguayanUteVenezuelanVietnameseWelshWest IndianYakamaYaquiYugoslavianYumanYup'ikZimbabwean
Immigration
NonimmigrantsImmigrantsAfghanistanAfricaAlbaniaArgentinaArmeniaAsiaAustraliaAustriaBahamasBangladeshBarbadosBelarusBelgiumBelizeBoliviaBosnia and HerzegovinaBrazilBulgariaBurma/MyanmarCabo VerdeCambodiaCameroonCanadaCaribbeanCentral AmericaChileChinaColombiaCongoCosta RicaCroatiaCubaCzechoslovakiaDenmarkDominicaDominican RepublicEastern AfricaEastern AsiaEastern EuropeEcuadorEgyptEl SalvadorEnglandEritreaEthiopiaEuropeFijiFranceGermanyGhanaGreeceGrenadaGuatemalaGuyanaHaitiHondurasHong KongHungaryIndiaIndonesiaIranIraqIrelandIsraelItalyJamaicaJapanJordanKazakhstanKenyaKoreaKuwaitLaosLatin AmericaLatviaLebanonLiberiaLithuaniaMalaysiaMexicoMicronesiaMiddle AfricaMoldovaMoroccoNepalNetherlandsNicaraguaNigeriaNorth AmericaNorth MacedoniaNorthern AfricaNorthern EuropeNorwayOceaniaPakistanPanamaPeruPhilippinesPolandPortugalRomaniaRussiaSaudi ArabiaScotlandSenegalSerbiaSierra LeoneSingaporeSomaliaSouth AfricaSouth AmericaSouth Central AsiaSouth Eastern AsiaSouthern EuropeSpainSri LankaSt. Vincent and the GrenadinesSudanSwedenSwitzerlandSyriaTaiwanThailandTrinidad and TobagoTurkeyUgandaUkraineUruguayUzbekistanVenezuelaVietnamWest IndiesWestern AfricaWestern AsiaWestern EuropeYemenZaireZimbabweAzores
Hungarian
Race
Ancestry
AfghanAfricanAlaska NativeAlaskan AthabascanAlbanianAleutAlsatianAmericanApacheArabArapahoArgentineanArmenianAssyrian/Chaldean/SyriacAustralianAustrianBahamianBangladeshiBarbadianBasqueBelgianBelizeanBermudanBhutaneseBlackfeetBolivianBrazilianBritishBritish West IndianBulgarianBurmeseCajunCambodianCanadianCape VerdeanCarpatho RusynCelticCentral AmericanCentral American IndianCherokeeCheyenneChickasawChileanChineseChippewaChoctawColombianColvilleComancheCosta RicanCreeCreekCroatianCrowCubanCypriotCzechCzechoslovakianDanishDelawareDominicanDutchDutch West IndianEastern EuropeanEcuadorianEgyptianEnglishEstonianEthiopianEuropeanFijianFilipinoFinnishFrenchFrench American IndianFrench CanadianGermanGerman RussianGhanaianGreekGuamanian/ChamorroGuatemalanGuyaneseHaitianHmongHonduranHopiHoumaHungarianIcelanderIndian (Asian)IndonesianInupiatIranianIraqiIrishIroquoisIsraeliItalianJamaicanJapaneseJordanianKenyanKiowaKoreanLaotianLatvianLebaneseLiberianLithuanianLumbeeLuxembourgerMacedonianMalaysianMalteseMarshalleseMenomineeMexicanMexican American IndianMongolianMoroccanNative HawaiianNavajoNepaleseNew ZealanderNicaraguanNigerianNorthern EuropeanNorwegianOkinawanOsageOttawaPaiutePakistaniPalestinianPanamanianParaguayanPennsylvania GermanPeruvianPimaPolishPortuguesePotawatomiPuebloPuerto RicanPuget Sound SalishRomanianRussianSalvadoranSamoanScandinavianScotch-IrishScottishSeminoleSenegaleseSerbianShoshoneSierra LeoneanSiouxSlavicSlovakSloveneSomaliSouth AfricanSouth AmericanSouth American IndianSoviet UnionSpaniardSpanishSpanish AmericanSpanish American IndianSri LankanSubsaharan AfricanSudaneseSwedishSwissSyrianTaiwaneseThaiTlingit-HaidaTohono O'OdhamTonganTrinidadian and TobagonianTsimshianTurkishU.S. Virgin IslanderUgandanUkrainianUruguayanUteVenezuelanVietnameseWelshWest IndianYakamaYaquiYugoslavianYumanYup'ikZimbabwean
Immigration
NonimmigrantsImmigrantsAfghanistanAfricaAlbaniaArgentinaArmeniaAsiaAustraliaAustriaBahamasBangladeshBarbadosBelarusBelgiumBelizeBoliviaBosnia and HerzegovinaBrazilBulgariaBurma/MyanmarCabo VerdeCambodiaCameroonCanadaCaribbeanCentral AmericaChileChinaColombiaCongoCosta RicaCroatiaCubaCzechoslovakiaDenmarkDominicaDominican RepublicEastern AfricaEastern AsiaEastern EuropeEcuadorEgyptEl SalvadorEnglandEritreaEthiopiaEuropeFijiFranceGermanyGhanaGreeceGrenadaGuyanaHaitiHondurasHong KongHungaryIndiaIndonesiaIranIraqIrelandIsraelItalyJamaicaJapanJordanKazakhstanKenyaKoreaKuwaitLaosLatin AmericaLatviaLebanonLiberiaLithuaniaMalaysiaMexicoMicronesiaMiddle AfricaMoldovaMoroccoNepalNetherlandsNicaraguaNigeriaNorth AmericaNorth MacedoniaNorthern AfricaNorthern EuropeNorwayOceaniaPakistanPanamaPeruPhilippinesPolandPortugalRomaniaRussiaSaudi ArabiaScotlandSenegalSerbiaSierra LeoneSingaporeSomaliaSouth AfricaSouth AmericaSouth Central AsiaSouth Eastern AsiaSouthern EuropeSpainSri LankaSt. Vincent and the GrenadinesSudanSwedenSwitzerlandSyriaTaiwanThailandTrinidad and TobagoTurkeyUgandaUkraineUruguayUzbekistanVenezuelaVietnamWest IndiesWestern AfricaWestern AsiaWestern EuropeYemenZaireZimbabweAzores
2 or more Vehicles in Household
Income
Poverty
Unemployment
Labor Participation
Family Structure
Vehicle Availability
Education Level
Disability

2 or more Vehicles in Household Comparison

Immigrants from Guatemala

Hungarians

Tragic
Excellent
53.5%
2 OR MORE VEHICLES IN HOUSEHOLD
3.2/ 100
METRIC RATING
232nd/ 347
METRIC RANK
56.5%
2 OR MORE VEHICLES IN HOUSEHOLD
89.1/ 100
METRIC RATING
132nd/ 347
METRIC RANK

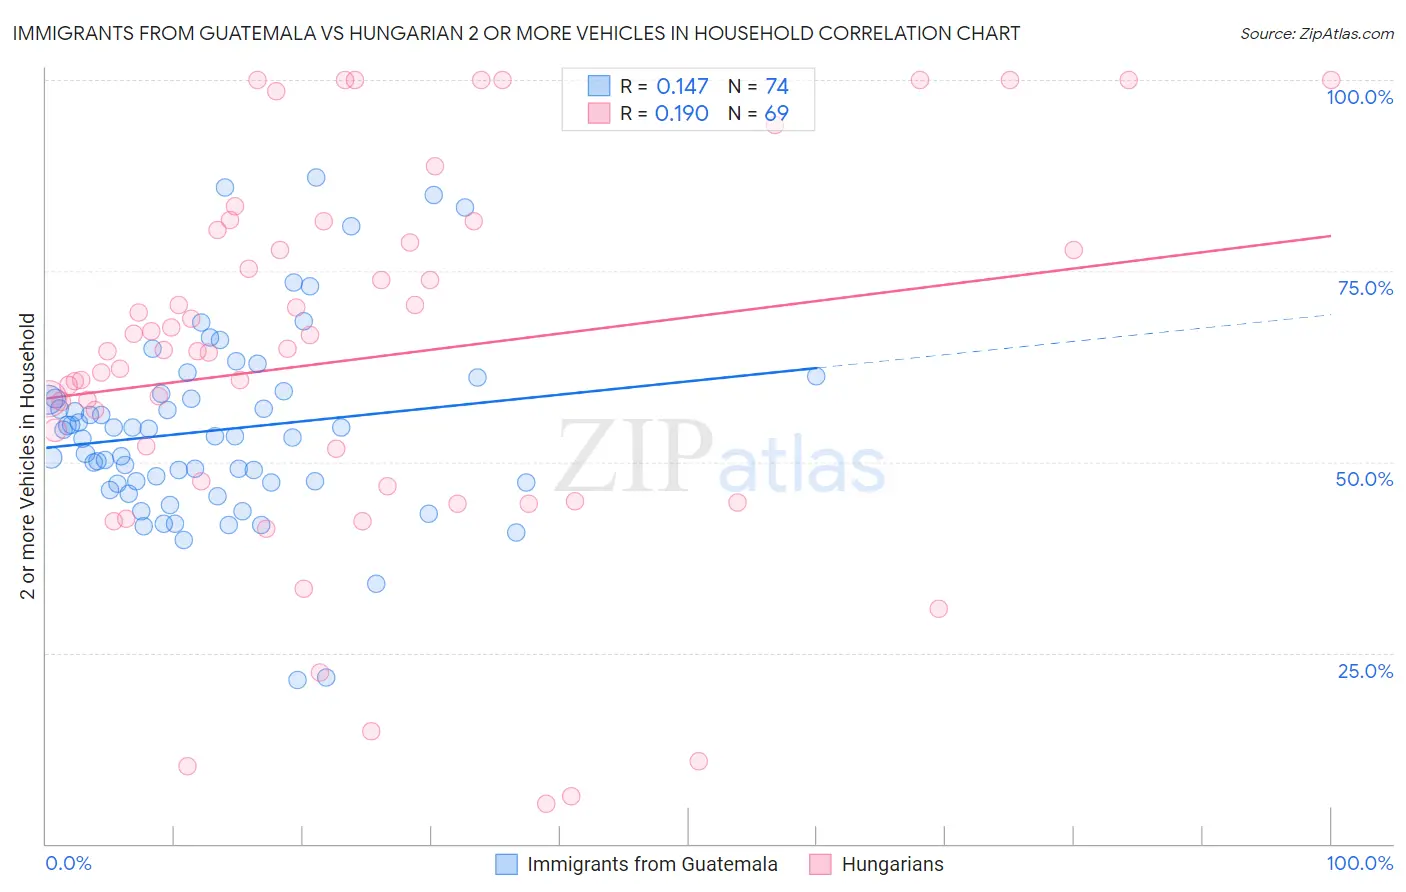
Immigrants from Guatemala vs Hungarian 2 or more Vehicles in Household Correlation Chart

The statistical analysis conducted on geographies consisting of 377,175,695 people shows a poor positive correlation between the proportion of Immigrants from Guatemala and percentage of households with 2 or more vehicles available in the United States with a correlation coefficient (R) of 0.147 and weighted average of 53.5%. Similarly, the statistical analysis conducted on geographies consisting of 485,946,107 people shows a poor positive correlation between the proportion of Hungarians and percentage of households with 2 or more vehicles available in the United States with a correlation coefficient (R) of 0.190 and weighted average of 56.5%, a difference of 5.7%.
Immigrants from Guatemala vs Hungarian 2 or more Vehicles in Household

2 or more Vehicles in Household Correlation Summary

MeasurementImmigrants from GuatemalaHungarian
Minimum21.5%5.2%
Maximum87.2%100.0%
Range65.7%94.8%
Mean54.1%63.4%
Median53.3%64.5%
Interquartile 25% (IQ1)47.2%47.2%
Interquartile 75% (IQ3)58.9%79.5%
Interquartile Range (IQR)11.7%32.4%
Standard Deviation (Sample)12.5%24.4%
Standard Deviation (Population)12.4%24.2%

Similar Demographics by 2 or more Vehicles in Household

Demographics Similar to Immigrants from Guatemala by 2 or more Vehicles in Household

In terms of 2 or more vehicles in household, the demographic groups most similar to Immigrants from Guatemala are Ugandan (53.5%, a difference of 0.010%), Immigrants from Switzerland (53.4%, a difference of 0.060%), Panamanian (53.5%, a difference of 0.070%), Immigrants from Middle Africa (53.4%, a difference of 0.090%), and Immigrants from Nepal (53.5%, a difference of 0.12%).
DemographicsRating | Rank2 or more Vehicles in Household
Immigrants | Egypt
5.2
/100
|
#225
Tragic
53.8%
Immigrants | Eastern Africa
5.1
/100
|
#226
Tragic
53.7%
Sudanese
4.1
/100
|
#227
Tragic
53.6%
Alaska Natives
3.9
/100
|
#228
Tragic
53.6%
Immigrants | Turkey
3.8
/100
|
#229
Tragic
53.6%
Immigrants | Nepal
3.6
/100
|
#230
Tragic
53.5%
Panamanians
3.4
/100
|
#231
Tragic
53.5%
Immigrants | Guatemala
3.2
/100
|
#232
Tragic
53.5%
Ugandans
3.2
/100
|
#233
Tragic
53.5%
Immigrants | Switzerland
3.0
/100
|
#234
Tragic
53.4%
Immigrants | Middle Africa
3.0
/100
|
#235
Tragic
53.4%
Indonesians
2.7
/100
|
#236
Tragic
53.4%
Macedonians
2.4
/100
|
#237
Tragic
53.3%
Immigrants | Armenia
2.3
/100
|
#238
Tragic
53.3%
Cambodians
2.3
/100
|
#239
Tragic
53.3%

Demographics Similar to Hungarians by 2 or more Vehicles in Household

In terms of 2 or more vehicles in household, the demographic groups most similar to Hungarians are Bulgarian (56.5%, a difference of 0.060%), Comanche (56.5%, a difference of 0.070%), Yugoslavian (56.6%, a difference of 0.090%), Ute (56.6%, a difference of 0.13%), and Immigrants from South Central Asia (56.6%, a difference of 0.15%).
DemographicsRating | Rank2 or more Vehicles in Household
Tsimshian
91.6
/100
|
#125
Exceptional
56.7%
Estonians
90.9
/100
|
#126
Exceptional
56.6%
Immigrants | Thailand
90.7
/100
|
#127
Exceptional
56.6%
Immigrants | South Central Asia
90.5
/100
|
#128
Exceptional
56.6%
Ute
90.4
/100
|
#129
Exceptional
56.6%
Yugoslavians
90.0
/100
|
#130
Exceptional
56.6%
Bulgarians
89.7
/100
|
#131
Excellent
56.5%
Hungarians
89.1
/100
|
#132
Excellent
56.5%
Comanche
88.4
/100
|
#133
Excellent
56.5%
Immigrants | Azores
86.6
/100
|
#134
Excellent
56.4%
Blackfeet
86.5
/100
|
#135
Excellent
56.4%
Immigrants | Asia
86.0
/100
|
#136
Excellent
56.3%
Cubans
84.8
/100
|
#137
Excellent
56.3%
Salvadorans
84.7
/100
|
#138
Excellent
56.3%
Armenians
84.3
/100
|
#139
Excellent
56.3%