Houma vs Immigrants from Afghanistan 1 or more Vehicles in Household

COMPARE

Houma
Race
Ancestry
AfghanAfricanAlaska NativeAlaskan AthabascanAlbanianAleutAlsatianAmericanApacheArabArapahoArgentineanArmenianAssyrian/Chaldean/SyriacAustralianAustrianBahamianBangladeshiBarbadianBasqueBelgianBelizeanBermudanBhutaneseBlackfeetBolivianBrazilianBritishBritish West IndianBulgarianBurmeseCajunCambodianCanadianCape VerdeanCarpatho RusynCelticCentral AmericanCentral American IndianCherokeeCheyenneChickasawChileanChineseChippewaChoctawColombianColvilleComancheCosta RicanCreeCreekCroatianCrowCubanCypriotCzechCzechoslovakianDanishDelawareDominicanDutchDutch West IndianEastern EuropeanEcuadorianEgyptianEnglishEstonianEthiopianEuropeanFijianFilipinoFinnishFrenchFrench American IndianFrench CanadianGermanGerman RussianGhanaianGreekGuamanian/ChamorroGuatemalanGuyaneseHaitianHmongHonduranHopiHoumaHungarianIcelanderIndian (Asian)IndonesianInupiatIranianIraqiIrishIroquoisIsraeliItalianJamaicanJapaneseJordanianKenyanKiowaKoreanLaotianLatvianLebaneseLiberianLithuanianLumbeeLuxembourgerMacedonianMalaysianMalteseMarshalleseMenomineeMexicanMexican American IndianMongolianMoroccanNative HawaiianNavajoNepaleseNew ZealanderNicaraguanNigerianNorthern EuropeanNorwegianOkinawanOsageOttawaPaiutePakistaniPalestinianPanamanianParaguayanPennsylvania GermanPeruvianPimaPolishPortuguesePotawatomiPuebloPuerto RicanPuget Sound SalishRomanianRussianSalvadoranSamoanScandinavianScotch-IrishScottishSeminoleSenegaleseSerbianShoshoneSierra LeoneanSiouxSlavicSlovakSloveneSomaliSouth AfricanSouth AmericanSouth American IndianSoviet UnionSpaniardSpanishSpanish AmericanSpanish American IndianSri LankanSubsaharan AfricanSudaneseSwedishSwissSyrianTaiwaneseThaiTlingit-HaidaTohono O'OdhamTonganTrinidadian and TobagonianTsimshianTurkishU.S. Virgin IslanderUgandanUkrainianUruguayanUteVenezuelanVietnameseWelshWest IndianYakamaYaquiYugoslavianYumanYup'ikZimbabwean
Immigration
NonimmigrantsImmigrantsAfricaAlbaniaArgentinaArmeniaAsiaAustraliaAustriaBahamasBangladeshBarbadosBelarusBelgiumBelizeBoliviaBosnia and HerzegovinaBrazilBulgariaBurma/MyanmarCabo VerdeCambodiaCameroonCanadaCaribbeanCentral AmericaChileChinaColombiaCongoCosta RicaCroatiaCubaCzechoslovakiaDenmarkDominicaDominican RepublicEastern AfricaEastern AsiaEastern EuropeEcuadorEgyptEl SalvadorEnglandEritreaEthiopiaEuropeFijiFranceGermanyGhanaGreeceGrenadaGuatemalaGuyanaHaitiHondurasHong KongHungaryIndiaIndonesiaIranIraqIrelandIsraelItalyJamaicaJapanJordanKazakhstanKenyaKoreaKuwaitLaosLatin AmericaLatviaLebanonLiberiaLithuaniaMalaysiaMexicoMicronesiaMiddle AfricaMoldovaMoroccoNepalNetherlandsNicaraguaNigeriaNorth AmericaNorth MacedoniaNorthern AfricaNorthern EuropeNorwayOceaniaPakistanPanamaPeruPhilippinesPolandPortugalRomaniaRussiaSaudi ArabiaScotlandSenegalSerbiaSierra LeoneSingaporeSomaliaSouth AfricaSouth AmericaSouth Central AsiaSouth Eastern AsiaSouthern EuropeSpainSri LankaSt. Vincent and the GrenadinesSudanSwedenSwitzerlandSyriaTaiwanThailandTrinidad and TobagoTurkeyUgandaUkraineUruguayUzbekistanVenezuelaVietnamWest IndiesWestern AfricaWestern AsiaWestern EuropeYemenZaireZimbabweAzores
Immigrants from Afghanistan
Race
Ancestry
AfghanAfricanAlaska NativeAlaskan AthabascanAlbanianAleutAlsatianAmericanApacheArabArapahoArgentineanArmenianAssyrian/Chaldean/SyriacAustralianAustrianBahamianBangladeshiBarbadianBasqueBelgianBelizeanBermudanBhutaneseBlackfeetBolivianBrazilianBritishBritish West IndianBulgarianBurmeseCajunCambodianCanadianCape VerdeanCarpatho RusynCelticCentral AmericanCentral American IndianCherokeeCheyenneChickasawChileanChineseChippewaChoctawColombianColvilleComancheCosta RicanCreeCreekCroatianCrowCubanCypriotCzechCzechoslovakianDanishDelawareDominicanDutchDutch West IndianEastern EuropeanEcuadorianEgyptianEnglishEstonianEthiopianEuropeanFijianFilipinoFinnishFrenchFrench American IndianFrench CanadianGermanGerman RussianGhanaianGreekGuamanian/ChamorroGuatemalanGuyaneseHaitianHmongHonduranHopiHungarianIcelanderIndian (Asian)IndonesianInupiatIranianIraqiIrishIroquoisIsraeliItalianJamaicanJapaneseJordanianKenyanKiowaKoreanLaotianLatvianLebaneseLiberianLithuanianLumbeeLuxembourgerMacedonianMalaysianMalteseMarshalleseMenomineeMexicanMexican American IndianMongolianMoroccanNative HawaiianNavajoNepaleseNew ZealanderNicaraguanNigerianNorthern EuropeanNorwegianOkinawanOsageOttawaPaiutePakistaniPalestinianPanamanianParaguayanPennsylvania GermanPeruvianPimaPolishPortuguesePotawatomiPuebloPuerto RicanPuget Sound SalishRomanianRussianSalvadoranSamoanScandinavianScotch-IrishScottishSeminoleSenegaleseSerbianShoshoneSierra LeoneanSiouxSlavicSlovakSloveneSomaliSouth AfricanSouth AmericanSouth American IndianSoviet UnionSpaniardSpanishSpanish AmericanSpanish American IndianSri LankanSubsaharan AfricanSudaneseSwedishSwissSyrianTaiwaneseThaiTlingit-HaidaTohono O'OdhamTonganTrinidadian and TobagonianTsimshianTurkishU.S. Virgin IslanderUgandanUkrainianUruguayanUteVenezuelanVietnameseWelshWest IndianYakamaYaquiYugoslavianYumanYup'ikZimbabwean
Immigration
NonimmigrantsImmigrantsAfghanistanAfricaAlbaniaArgentinaArmeniaAsiaAustraliaAustriaBahamasBangladeshBarbadosBelarusBelgiumBelizeBoliviaBosnia and HerzegovinaBrazilBulgariaBurma/MyanmarCabo VerdeCambodiaCameroonCanadaCaribbeanCentral AmericaChileChinaColombiaCongoCosta RicaCroatiaCubaCzechoslovakiaDenmarkDominicaDominican RepublicEastern AfricaEastern AsiaEastern EuropeEcuadorEgyptEl SalvadorEnglandEritreaEthiopiaEuropeFijiFranceGermanyGhanaGreeceGrenadaGuatemalaGuyanaHaitiHondurasHong KongHungaryIndiaIndonesiaIranIraqIrelandIsraelItalyJamaicaJapanJordanKazakhstanKenyaKoreaKuwaitLaosLatin AmericaLatviaLebanonLiberiaLithuaniaMalaysiaMexicoMicronesiaMiddle AfricaMoldovaMoroccoNepalNetherlandsNicaraguaNigeriaNorth AmericaNorth MacedoniaNorthern AfricaNorthern EuropeNorwayOceaniaPakistanPanamaPeruPhilippinesPolandPortugalRomaniaRussiaSaudi ArabiaScotlandSenegalSerbiaSierra LeoneSingaporeSomaliaSouth AfricaSouth AmericaSouth Central AsiaSouth Eastern AsiaSouthern EuropeSpainSri LankaSt. Vincent and the GrenadinesSudanSwedenSwitzerlandSyriaTaiwanThailandTrinidad and TobagoTurkeyUgandaUkraineUruguayUzbekistanVenezuelaVietnamWest IndiesWestern AfricaWestern AsiaWestern EuropeYemenZaireZimbabweAzores
1 or more Vehicles in Household
Income
Poverty
Unemployment
Labor Participation
Family Structure
Vehicle Availability
Education Level
Disability

1 or more Vehicles in Household Comparison

Houma

Immigrants from Afghanistan

Tragic
Exceptional
88.6%
1 OR MORE VEHICLES IN HOUSEHOLD
4.8/ 100
METRIC RATING
233rd/ 347
METRIC RANK
92.0%
1 OR MORE VEHICLES IN HOUSEHOLD
99.9/ 100
METRIC RATING
55th/ 347
METRIC RANK

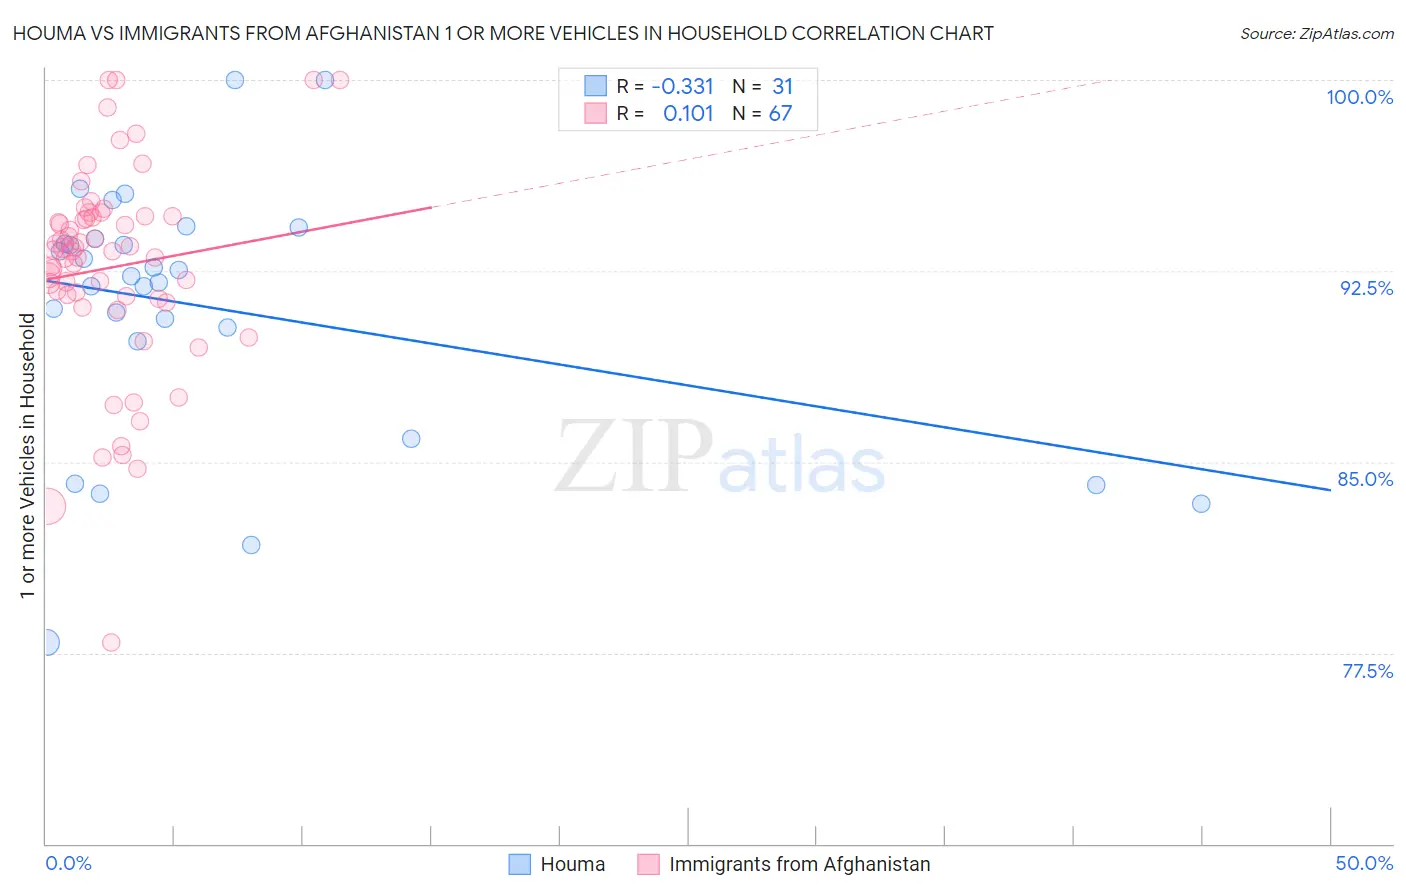
Houma vs Immigrants from Afghanistan 1 or more Vehicles in Household Correlation Chart

The statistical analysis conducted on geographies consisting of 36,796,778 people shows a mild negative correlation between the proportion of Houma and percentage of households with 1 or more vehicles available in the United States with a correlation coefficient (R) of -0.331 and weighted average of 88.6%. Similarly, the statistical analysis conducted on geographies consisting of 147,625,417 people shows a poor positive correlation between the proportion of Immigrants from Afghanistan and percentage of households with 1 or more vehicles available in the United States with a correlation coefficient (R) of 0.101 and weighted average of 92.0%, a difference of 3.8%.
Houma vs Immigrants from Afghanistan 1 or more Vehicles in Household

1 or more Vehicles in Household Correlation Summary

MeasurementHoumaImmigrants from Afghanistan
Minimum77.9%77.9%
Maximum100.0%100.0%
Range22.1%22.1%
Mean91.0%92.6%
Median92.3%93.3%
Interquartile 25% (IQ1)89.7%91.4%
Interquartile 75% (IQ3)93.8%94.6%
Interquartile Range (IQR)4.0%3.2%
Standard Deviation (Sample)5.1%4.1%
Standard Deviation (Population)5.0%4.1%

Similar Demographics by 1 or more Vehicles in Household

Demographics Similar to Houma by 1 or more Vehicles in Household

In terms of 1 or more vehicles in household, the demographic groups most similar to Houma are Immigrants from Japan (88.7%, a difference of 0.010%), Immigrants from Peru (88.6%, a difference of 0.010%), Paiute (88.6%, a difference of 0.010%), Russian (88.7%, a difference of 0.020%), and Immigrants from Pakistan (88.6%, a difference of 0.030%).
DemographicsRating | Rank1 or more Vehicles in Household
Cheyenne
5.7
/100
|
#226
Tragic
88.7%
Ute
5.6
/100
|
#227
Tragic
88.7%
Immigrants | Norway
5.5
/100
|
#228
Tragic
88.7%
Immigrants | Romania
5.4
/100
|
#229
Tragic
88.7%
Immigrants | Sierra Leone
5.2
/100
|
#230
Tragic
88.7%
Russians
5.0
/100
|
#231
Tragic
88.7%
Immigrants | Japan
4.9
/100
|
#232
Tragic
88.7%
Houma
4.8
/100
|
#233
Tragic
88.6%
Immigrants | Peru
4.7
/100
|
#234
Tragic
88.6%
Paiute
4.6
/100
|
#235
Tragic
88.6%
Immigrants | Pakistan
4.5
/100
|
#236
Tragic
88.6%
Immigrants | Turkey
4.4
/100
|
#237
Tragic
88.6%
Immigrants | Somalia
4.2
/100
|
#238
Tragic
88.6%
Kiowa
3.8
/100
|
#239
Tragic
88.6%
Eastern Europeans
3.0
/100
|
#240
Tragic
88.5%

Demographics Similar to Immigrants from Afghanistan by 1 or more Vehicles in Household

In terms of 1 or more vehicles in household, the demographic groups most similar to Immigrants from Afghanistan are Immigrants from Venezuela (92.0%, a difference of 0.0%), Iraqi (91.9%, a difference of 0.040%), Slovene (92.0%, a difference of 0.060%), Immigrants from Mexico (91.9%, a difference of 0.060%), and Hawaiian (92.0%, a difference of 0.070%).
DemographicsRating | Rank1 or more Vehicles in Household
Belgians
99.9
/100
|
#48
Exceptional
92.1%
Afghans
99.9
/100
|
#49
Exceptional
92.1%
Guamanians/Chamorros
99.9
/100
|
#50
Exceptional
92.1%
Celtics
99.9
/100
|
#51
Exceptional
92.1%
Koreans
99.9
/100
|
#52
Exceptional
92.1%
Hawaiians
99.9
/100
|
#53
Exceptional
92.0%
Slovenes
99.9
/100
|
#54
Exceptional
92.0%
Immigrants | Afghanistan
99.9
/100
|
#55
Exceptional
92.0%
Immigrants | Venezuela
99.9
/100
|
#56
Exceptional
92.0%
Iraqis
99.8
/100
|
#57
Exceptional
91.9%
Immigrants | Mexico
99.8
/100
|
#58
Exceptional
91.9%
Venezuelans
99.8
/100
|
#59
Exceptional
91.9%
Slovaks
99.8
/100
|
#60
Exceptional
91.9%
Immigrants | India
99.8
/100
|
#61
Exceptional
91.9%
Thais
99.8
/100
|
#62
Exceptional
91.9%