Houma vs Immigrants from Afghanistan Divorced or Separated
COMPARE
Houma
Immigrants from Afghanistan
Divorced or Separated
Divorced or Separated Comparison
Houma
Immigrants from Afghanistan
13.6%
DIVORCED OR SEPARATED
0.0/ 100
METRIC RATING
329th/ 347
METRIC RANK
11.8%
DIVORCED OR SEPARATED
87.9/ 100
METRIC RATING
132nd/ 347
METRIC RANK
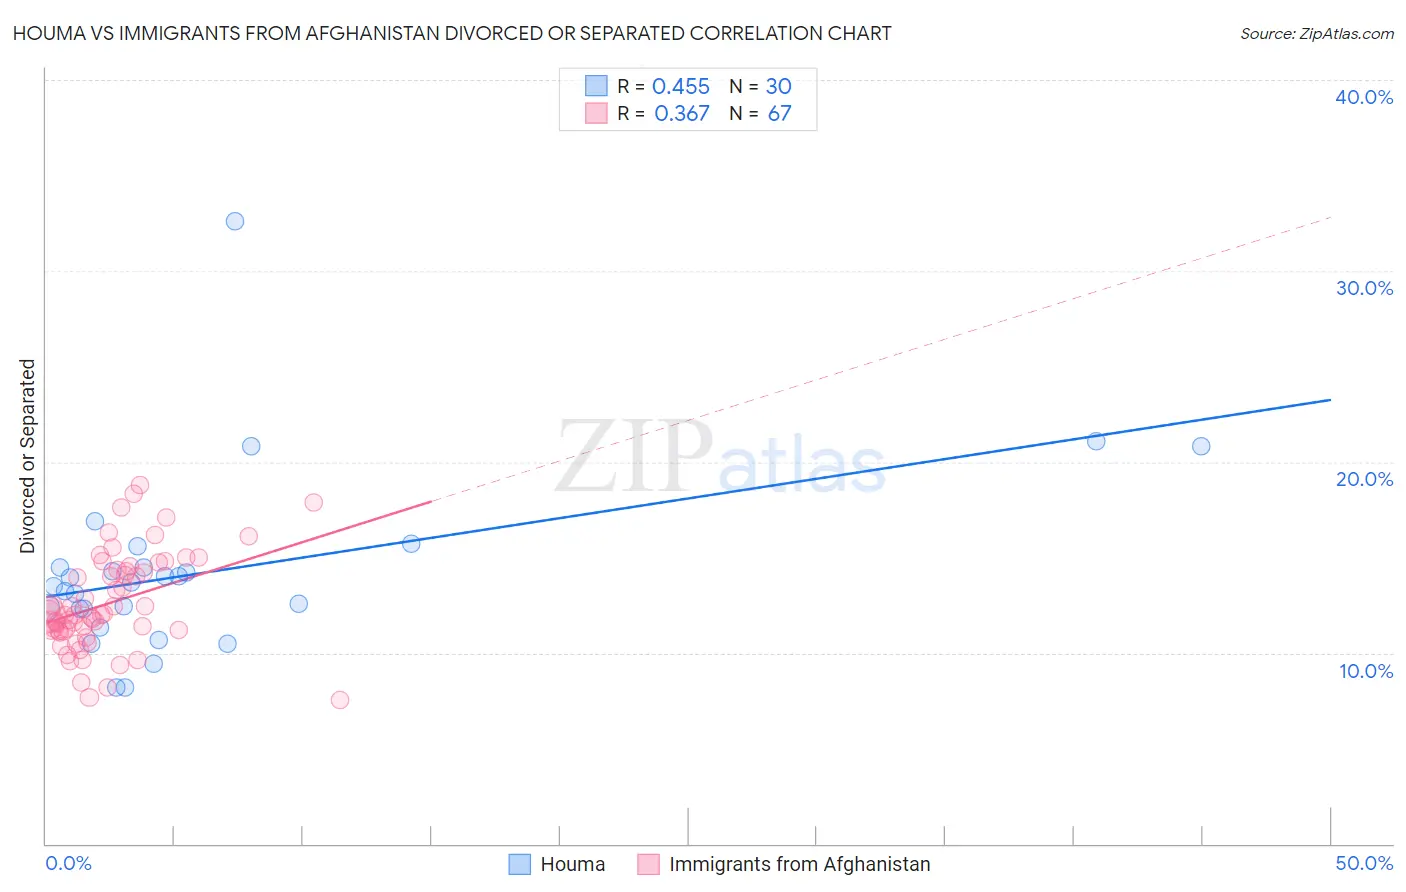
Houma vs Immigrants from Afghanistan Divorced or Separated Correlation Chart
The statistical analysis conducted on geographies consisting of 36,793,405 people shows a moderate positive correlation between the proportion of Houma and percentage of population currently divorced or separated in the United States with a correlation coefficient (R) of 0.455 and weighted average of 13.6%. Similarly, the statistical analysis conducted on geographies consisting of 147,642,734 people shows a mild positive correlation between the proportion of Immigrants from Afghanistan and percentage of population currently divorced or separated in the United States with a correlation coefficient (R) of 0.367 and weighted average of 11.8%, a difference of 14.7%.
Divorced or Separated Correlation Summary
| Measurement | Houma | Immigrants from Afghanistan |
| Minimum | 8.2% | 7.5% |
| Maximum | 32.6% | 18.8% |
| Range | 24.4% | 11.3% |
| Mean | 14.2% | 12.6% |
| Median | 13.6% | 12.0% |
| Interquartile 25% (IQ1) | 12.3% | 11.2% |
| Interquartile 75% (IQ3) | 14.5% | 14.3% |
| Interquartile Range (IQR) | 2.2% | 3.1% |
| Standard Deviation (Sample) | 4.7% | 2.5% |
| Standard Deviation (Population) | 4.6% | 2.5% |
Similar Demographics by Divorced or Separated
Demographics Similar to Houma by Divorced or Separated
In terms of divorced or separated, the demographic groups most similar to Houma are Paiute (13.6%, a difference of 0.11%), Immigrants from Caribbean (13.6%, a difference of 0.15%), Black/African American (13.6%, a difference of 0.24%), Comanche (13.5%, a difference of 0.53%), and Cherokee (13.7%, a difference of 1.0%).
| Demographics | Rating | Rank | Divorced or Separated |
| Immigrants | Haiti | 0.0 /100 | #322 | Tragic 13.4% |
| U.S. Virgin Islanders | 0.0 /100 | #323 | Tragic 13.4% |
| Osage | 0.0 /100 | #324 | Tragic 13.4% |
| Potawatomi | 0.0 /100 | #325 | Tragic 13.5% |
| Immigrants | Congo | 0.0 /100 | #326 | Tragic 13.5% |
| Comanche | 0.0 /100 | #327 | Tragic 13.5% |
| Immigrants | Caribbean | 0.0 /100 | #328 | Tragic 13.6% |
| Houma | 0.0 /100 | #329 | Tragic 13.6% |
| Paiute | 0.0 /100 | #330 | Tragic 13.6% |
| Blacks/African Americans | 0.0 /100 | #331 | Tragic 13.6% |
| Cherokee | 0.0 /100 | #332 | Tragic 13.7% |
| Puerto Ricans | 0.0 /100 | #333 | Tragic 13.9% |
| Immigrants | Bahamas | 0.0 /100 | #334 | Tragic 13.9% |
| Dutch West Indians | 0.0 /100 | #335 | Tragic 14.0% |
| Shoshone | 0.0 /100 | #336 | Tragic 14.0% |
Demographics Similar to Immigrants from Afghanistan by Divorced or Separated
In terms of divorced or separated, the demographic groups most similar to Immigrants from Afghanistan are Immigrants from Austria (11.8%, a difference of 0.030%), Immigrants from Cambodia (11.8%, a difference of 0.030%), New Zealander (11.9%, a difference of 0.030%), Immigrants from St. Vincent and the Grenadines (11.8%, a difference of 0.040%), and Immigrants from Ecuador (11.8%, a difference of 0.080%).
| Demographics | Rating | Rank | Divorced or Separated |
| Ukrainians | 92.3 /100 | #125 | Exceptional 11.8% |
| South American Indians | 92.1 /100 | #126 | Exceptional 11.8% |
| South Africans | 88.9 /100 | #127 | Excellent 11.8% |
| Immigrants | Ecuador | 88.9 /100 | #128 | Excellent 11.8% |
| Immigrants | St. Vincent and the Grenadines | 88.4 /100 | #129 | Excellent 11.8% |
| Immigrants | Austria | 88.2 /100 | #130 | Excellent 11.8% |
| Immigrants | Cambodia | 88.2 /100 | #131 | Excellent 11.8% |
| Immigrants | Afghanistan | 87.9 /100 | #132 | Excellent 11.8% |
| New Zealanders | 87.5 /100 | #133 | Excellent 11.9% |
| Argentineans | 85.1 /100 | #134 | Excellent 11.9% |
| Danes | 84.8 /100 | #135 | Excellent 11.9% |
| Carpatho Rusyns | 84.8 /100 | #136 | Excellent 11.9% |
| Alsatians | 84.0 /100 | #137 | Excellent 11.9% |
| Immigrants | Netherlands | 83.9 /100 | #138 | Excellent 11.9% |
| Australians | 83.6 /100 | #139 | Excellent 11.9% |