Zip Codes with the Highest Percentage of Population Employed in Food Preparation & Serving in Salt Lake City, UT
RELATED REPORTS & OPTIONS
Food Preparation & Serving
Salt Lake City
Compare Zip Codes
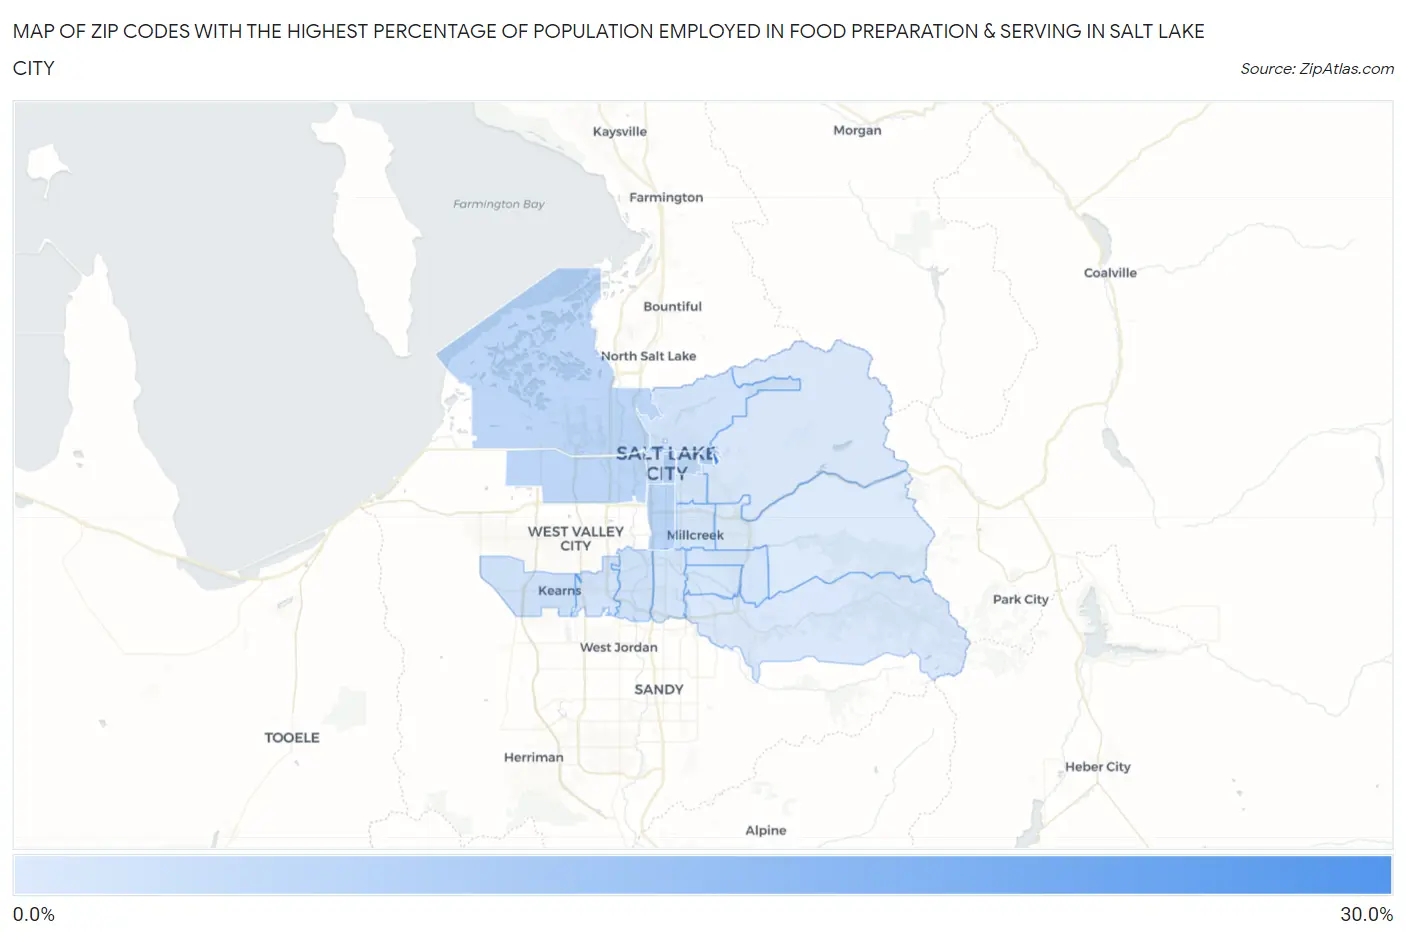
Map of Zip Codes with the Highest Percentage of Population Employed in Food Preparation & Serving in Salt Lake City
0.0%
30.0%
Zip Codes with the Highest Percentage of Population Employed in Food Preparation & Serving in Salt Lake City, UT
| Zip Code | % Employed | vs State | vs National | |
| 1. | 84113 | 26.7% | 4.5%(+22.2)#3 | 5.3%(+21.4)#270 |
| 2. | 84111 | 8.7% | 4.5%(+4.16)#24 | 5.3%(+3.41)#3,863 |
| 3. | 84112 | 8.6% | 4.5%(+4.03)#28 | 5.3%(+3.28)#4,005 |
| 4. | 84115 | 7.5% | 4.5%(+2.93)#36 | 5.3%(+2.18)#5,628 |
| 5. | 84116 | 7.2% | 4.5%(+2.68)#39 | 5.3%(+1.93)#6,091 |
| 6. | 84104 | 7.2% | 4.5%(+2.61)#40 | 5.3%(+1.87)#6,227 |
| 7. | 84102 | 6.9% | 4.5%(+2.37)#49 | 5.3%(+1.62)#6,805 |
| 8. | 84123 | 4.4% | 4.5%(-0.112)#108 | 5.3%(-0.861)#15,315 |
| 9. | 84118 | 4.4% | 4.5%(-0.163)#111 | 5.3%(-0.912)#15,534 |
| 10. | 84129 | 4.0% | 4.5%(-0.522)#124 | 5.3%(-1.27)#17,066 |
| 11. | 84103 | 4.0% | 4.5%(-0.560)#126 | 5.3%(-1.31)#17,212 |
| 12. | 84101 | 3.9% | 4.5%(-0.592)#130 | 5.3%(-1.34)#17,359 |
| 13. | 84124 | 3.7% | 4.5%(-0.873)#142 | 5.3%(-1.62)#18,504 |
| 14. | 84105 | 3.7% | 4.5%(-0.884)#143 | 5.3%(-1.63)#18,559 |
| 15. | 84107 | 3.6% | 4.5%(-0.894)#144 | 5.3%(-1.64)#18,587 |
| 16. | 84106 | 3.5% | 4.5%(-1.06)#153 | 5.3%(-1.81)#19,281 |
| 17. | 84117 | 3.3% | 4.5%(-1.27)#164 | 5.3%(-2.02)#20,206 |
| 18. | 84108 | 3.1% | 4.5%(-1.43)#172 | 5.3%(-2.18)#20,837 |
| 19. | 84121 | 2.8% | 4.5%(-1.77)#179 | 5.3%(-2.52)#22,190 |
| 20. | 84109 | 2.4% | 4.5%(-2.16)#192 | 5.3%(-2.90)#23,508 |
1
Common Questions
What are the Top 10 Zip Codes with the Highest Percentage of Population Employed in Food Preparation & Serving in Salt Lake City, UT?
Top 10 Zip Codes with the Highest Percentage of Population Employed in Food Preparation & Serving in Salt Lake City, UT are:
What zip code has the Highest Percentage of Population Employed in Food Preparation & Serving in Salt Lake City, UT?
84113 has the Highest Percentage of Population Employed in Food Preparation & Serving in Salt Lake City, UT with 26.7%.
What is the Percentage of Population Employed in Food Preparation & Serving in Salt Lake City, UT?
Percentage of Population Employed in Food Preparation & Serving in Salt Lake City is 5.5%.
What is the Percentage of Population Employed in Food Preparation & Serving in Utah?
Percentage of Population Employed in Food Preparation & Serving in Utah is 4.5%.
What is the Percentage of Population Employed in Food Preparation & Serving in the United States?
Percentage of Population Employed in Food Preparation & Serving in the United States is 5.3%.