Zip Codes with the Highest Percentage of Population Employed in Security & Protection in Salt Lake City, UT
RELATED REPORTS & OPTIONS
Security & Protection
Salt Lake City
Compare Zip Codes
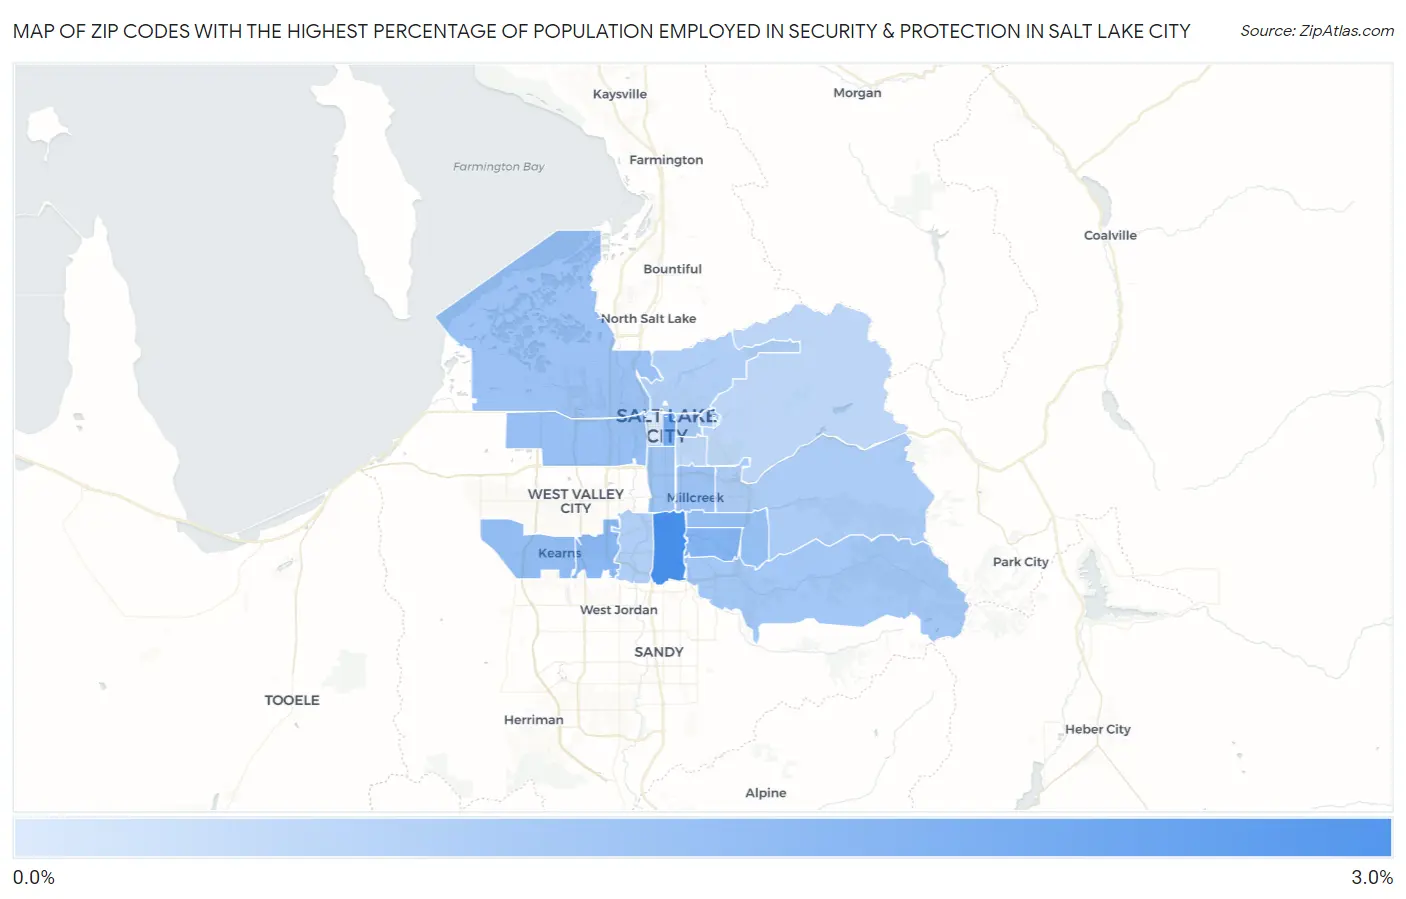
Map of Zip Codes with the Highest Percentage of Population Employed in Security & Protection in Salt Lake City
0.0%
3.0%
Zip Codes with the Highest Percentage of Population Employed in Security & Protection in Salt Lake City, UT
| Zip Code | % Employed | vs State | vs National | |
| 1. | 84107 | 2.9% | 1.6%(+1.28)#55 | 2.1%(+0.743)#7,686 |
| 2. | 84111 | 2.1% | 1.6%(+0.451)#82 | 2.1%(-0.084)#12,158 |
| 3. | 84117 | 1.8% | 1.6%(+0.209)#96 | 2.1%(-0.326)#13,765 |
| 4. | 84129 | 1.7% | 1.6%(+0.066)#111 | 2.1%(-0.469)#14,833 |
| 5. | 84118 | 1.5% | 1.6%(-0.112)#125 | 2.1%(-0.647)#16,183 |
| 6. | 84124 | 1.5% | 1.6%(-0.131)#127 | 2.1%(-0.666)#16,341 |
| 7. | 84104 | 1.4% | 1.6%(-0.193)#131 | 2.1%(-0.728)#16,799 |
| 8. | 84116 | 1.4% | 1.6%(-0.203)#132 | 2.1%(-0.737)#16,864 |
| 9. | 84106 | 1.3% | 1.6%(-0.266)#136 | 2.1%(-0.801)#17,365 |
| 10. | 84115 | 1.3% | 1.6%(-0.308)#144 | 2.1%(-0.842)#17,689 |
| 11. | 84121 | 1.2% | 1.6%(-0.387)#148 | 2.1%(-0.922)#18,312 |
| 12. | 84102 | 1.1% | 1.6%(-0.509)#161 | 2.1%(-1.04)#19,253 |
| 13. | 84112 | 1.1% | 1.6%(-0.552)#165 | 2.1%(-1.09)#19,561 |
| 14. | 84109 | 1.1% | 1.6%(-0.553)#166 | 2.1%(-1.09)#19,572 |
| 15. | 84103 | 0.99% | 1.6%(-0.623)#173 | 2.1%(-1.16)#20,113 |
| 16. | 84123 | 0.99% | 1.6%(-0.626)#174 | 2.1%(-1.16)#20,141 |
| 17. | 84108 | 0.80% | 1.6%(-0.816)#183 | 2.1%(-1.35)#21,417 |
| 18. | 84105 | 0.73% | 1.6%(-0.879)#187 | 2.1%(-1.41)#21,839 |
| 19. | 84101 | 0.21% | 1.6%(-1.41)#208 | 2.1%(-1.94)#24,509 |
1
Common Questions
What are the Top 10 Zip Codes with the Highest Percentage of Population Employed in Security & Protection in Salt Lake City, UT?
Top 10 Zip Codes with the Highest Percentage of Population Employed in Security & Protection in Salt Lake City, UT are:
What zip code has the Highest Percentage of Population Employed in Security & Protection in Salt Lake City, UT?
84107 has the Highest Percentage of Population Employed in Security & Protection in Salt Lake City, UT with 2.9%.
What is the Percentage of Population Employed in Security & Protection in Salt Lake City, UT?
Percentage of Population Employed in Security & Protection in Salt Lake City is 1.1%.
What is the Percentage of Population Employed in Security & Protection in Utah?
Percentage of Population Employed in Security & Protection in Utah is 1.6%.
What is the Percentage of Population Employed in Security & Protection in the United States?
Percentage of Population Employed in Security & Protection in the United States is 2.1%.